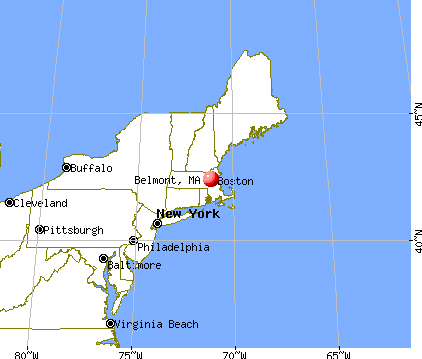
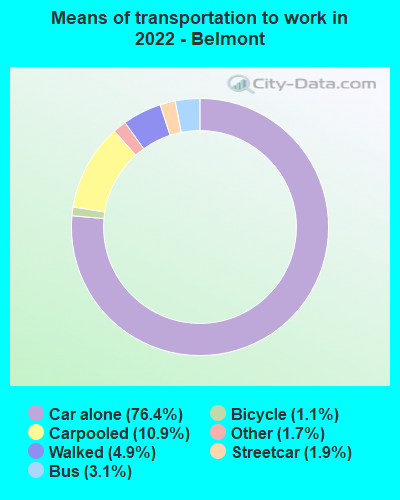
Belmont, Massachusetts

Belmont: church

Belmont: The fall colors on my street.
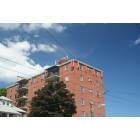
Belmont: Belmont's high rise apartment building.
- add
your
Submit your own pictures of this place and show them to the world
- OSM Map
- General Map
- Google Map
- MSN Map
Population change since 2000: +2.2%
| Males: 11,538 | |
| Females: 13,191 |
| Median resident age: | 42.5 years |
| Massachusetts median age: | 40.3 years |
Zip codes: 02138, 02472, 02478.
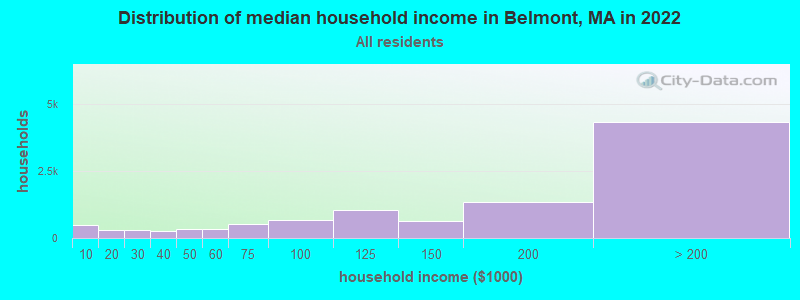
Belmont Zip Code Map| Belmont: | $161,514 |
| MA: | $94,488 |
Estimated per capita income in 2022: $89,641 (it was $42,485 in 2000)
Belmont CDP income, earnings, and wages data
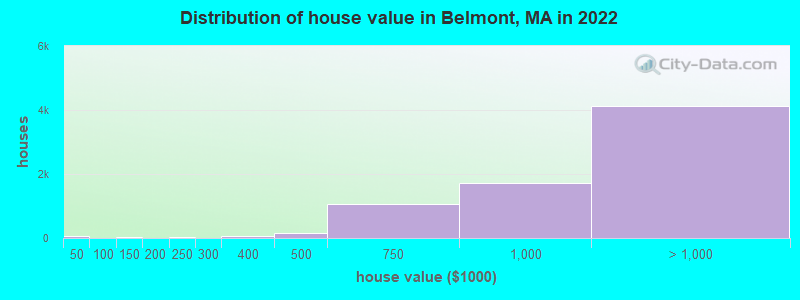
Estimated median house or condo value in 2022: over $1,000,000 (it was $419,700 in 2000)
| Belmont: | over $1,000,000 |
| MA: | $534,700 |
Mean prices in 2022: all housing units: over $1,000,000; detached houses: over $1,000,000; townhouses or other attached units: over $1,000,000; in 2-unit structures: $810,910; in 3-to-4-unit structures: $659,962; in 5-or-more-unit structures: $724,420
Median gross rent in 2022: $2,330.
(3.0% for White Non-Hispanic residents, 13.1% for Black residents, 10.7% for Hispanic or Latino residents, 22.9% for other race residents, 4.0% for two or more races residents)
Detailed information about poverty and poor residents in Belmont, MA


Compare current foreclosures near Belmont, MA:
| Photo | Address | Area | Beds / Baths | Price | Details |
|---|---|---|---|---|---|

|
#1
Wiley Rd
Belmont, MA 02478
|
2,614 sq. feet
|
2 baths 5 beds |
show details | |

|
#2
Walnut St
Belmont, MA 02478
|
3,600 sq. feet
|
4 baths 6 beds |
show details | |

|
#3
Payson Rd # 11
Belmont, MA 02478
|
1,934 sq. feet
|
2 baths 4 beds |
show details | |

|
#4
School St
Belmont, MA 02478
|
3,020 sq. feet
|
2 baths 4 beds |
show details | |

|
#5
Farnham St
Belmont, MA 02478
|
2,198 sq. feet
|
2 baths 3 beds |
show details | |

|
#6
School St
Belmont, MA 02478
|
2,262 sq. feet
|
1 baths 4 beds |
show details | |

|
#7
Marsh St
Belmont, MA 02478
|
2,321 sq. feet
|
2 baths 5 beds |
show details | |

|
#8
Lorimer Rd
Belmont, MA 02478
|
- sq. feet
|
- baths - beds |
show details | |

|
#9
Concord Ave Ste 5
Belmont, MA 02478
|
- sq. feet
|
- baths - beds |
show details | |

|
#10
Banks St, Unit 2
Belmont, MA 02478
|
- sq. feet
|
- baths - beds |
show details |
| Photo | Address | Area | Beds / Baths | Price | Details |
|---|---|---|---|---|---|

|
#11
Leonard St
Belmont, MA 02478
|
- sq. feet
|
- baths - beds |
show details | |

|
#12
Leonard St
Belmont, MA 02478
|
- sq. feet
|
- baths - beds |
show details | |

|
#13
Trapelo Rd
Belmont, MA 02478
|
- sq. feet
|
- baths - beds |
show details | |

|
#14
Clark St
Belmont, MA 02478
|
- sq. feet
|
- baths - beds |
show details | |

|
#15
Gordon Ter
Belmont, MA 02478
|
- sq. feet
|
- baths - beds |
show details | |

|
#16
Stillman St
Framingham, MA 01702
|
1,122 sq. feet
|
1 baths 2 beds |
$440,000
|
show details |

|
#17
Johnson Rd
North Weymouth, MA 02191
|
748 sq. feet
|
1 baths 2 beds |
$365,000
|
show details |

|
#18
Maple St
Tewksbury, MA 01876
|
1,748 sq. feet
|
1 baths 4 beds |
$379,900
|
show details |

|
#19
Commonwealth Ave Apt B
Boston, MA 02116
|
- sq. feet
|
1 baths 2 beds |
$684,900
|
show details |

|
#20
Portland St
Lynn, MA 01902
|
851 sq. feet
|
2 baths 2 beds |
show details |
| Photo | Address | Area | Beds / Baths | Price | Details |
|---|---|---|---|---|---|

|
#21
Church St
Boston, MA 02122
|
3,663 sq. feet
|
3 baths 6 beds |
show details | |

|
#22
College Farm Rd
Waltham, MA 02451
|
879 sq. feet
|
1 baths 2 beds |
show details | |

|
#23
Ballou St
Quincy, MA 02169
|
1,758 sq. feet
|
1 baths 3 beds |
show details | |

|
#24
Brahms St
Roslindale, MA 02131
|
1,604 sq. feet
|
1 baths 4 beds |
show details | |

|
#25
Gay St
Quincy, MA 02169
|
1,330 sq. feet
|
1 baths 4 beds |
show details | |

|
#26
Gordon St
Allston, MA 02134
|
3,246 sq. feet
|
2 baths 5 beds |
show details | |

|
#27
Salem Rd
Billerica, MA 01821
|
1,428 sq. feet
|
1 baths 4 beds |
show details | |

|
#28
Baker St
West Roxbury, MA 02132
|
2,614 sq. feet
|
3 baths 4 beds |
show details | |

|
#29
Atlantic Street, Unit A 10 A/k/a Unit 10, Marilyn Condominium
Lynn, MA 01902
|
576 sq. feet
|
1 baths 1 beds |
show details | |

|
#30
Cora St
Winthrop, MA 02152
|
1,452 sq. feet
|
1 baths 2 beds |
show details |
| Photo | Address | Area | Beds / Baths | Price | Details |
|---|---|---|---|---|---|

|
#31
Merrill Ave
Lynn, MA 01902
|
1,136 sq. feet
|
1 baths 3 beds |
show details | |

|
#32
Boston Rd
Chelmsford, MA 01824
|
1,392 sq. feet
|
1 baths 3 beds |
show details | |

|
#33
Marks Way
Maynard, MA 01754
|
2,596 sq. feet
|
2 baths 4 beds |
show details | |

|
#34
Deer Path Apt 5
Maynard, MA 01754
|
1,540 sq. feet
|
1 baths 2 beds |
show details | |

|
#35
Thompson St
Hyde Park, MA 02136
|
1,584 sq. feet
|
1 baths 4 beds |
show details | |

|
#36
Forest Park Rd
Woburn, MA 01801
|
1,132 sq. feet
|
1 baths 3 beds |
show details | |

|
#37
Margin Street
Lynn, MA 01905
|
1,240 sq. feet
|
2 baths 2 beds |
show details | |

|
#38
Iroquois St
Boston, MA 02120
|
2,524 sq. feet
|
1 baths 4 beds |
show details | |

|
#39
Lincoln Ave
Saugus, MA 01906
|
1,080 sq. feet
|
1 baths 3 beds |
show details | |

|
#40
Essex St
Swampscott, MA 01907
|
2,029 sq. feet
|
2 baths 3 beds |
show details |
| Photo | Address | Area | Beds / Baths | Price | Details |
|---|---|---|---|---|---|

|
#41
Victoria Cir
Norwood, MA 02062
|
2,980 sq. feet
|
3 baths 5 beds |
show details | |

|
#42
Emily Rd
Tewksbury, MA 01876
|
1,600 sq. feet
|
1 baths 3 beds |
show details | |

|
#43
Wilson Ave
Dedham, MA 02026
|
- sq. feet
|
2 baths 3 beds |
show details | |

|
#44
Magnolia St
Boston, MA 02125
|
3,654 sq. feet
|
3 baths 6 beds |
show details | |

|
#45
Woodbury Rd
Billerica, MA 01821
|
1,680 sq. feet
|
2 baths 3 beds |
show details | |

|
#46
Washington St
Hyde Park, MA 02136
|
2,980 sq. feet
|
3 baths 5 beds |
show details | |

|
#47
Carlisle St
Lowell, MA 01852
|
1,913 sq. feet
|
1 baths 5 beds |
show details | |

|
#48
Summer St
Weymouth, MA 02188
|
1,413 sq. feet
|
2 baths 3 beds |
show details | |

|
#49
Bloomfield St
Boston, MA 02124
|
2,667 sq. feet
|
2 baths 6 beds |
show details | |

|
Check over 1 million property listings on Foreclosure.com!
|
browse all offers | |||


- 18,28368.0%White alone
- 5,07618.9%Asian alone
- 1,6566.2%Two or more races
- 1,2984.8%Hispanic
- 4691.7%Black alone
- 580.2%Other race alone
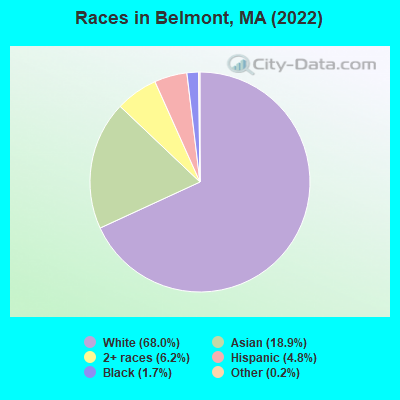
Races in Belmont detailed stats: ancestries, foreign born residents, place of birth
According to our research of Massachusetts and other state lists, there was 1 registered sex offender living in Belmont, Massachusetts as of April 27, 2024.
The ratio of all residents to sex offenders in Belmont is 25,916 to 1.
The ratio of registered sex offenders to all residents in this city is much lower than the state average.
Type |
2009 |
2010 |
2011 |
2012 |
2013 |
2014 |
2015 |
2016 |
2017 |
2018 |
2019 |
2020 |
2021 |
2022 |
|---|---|---|---|---|---|---|---|---|---|---|---|---|---|---|
| Murders (per 100,000) | 0 (0.0) | 0 (0.0) | 0 (0.0) | 0 (0.0) | 0 (0.0) | 0 (0.0) | 0 (0.0) | 0 (0.0) | 0 (0.0) | 0 (0.0) | 0 (0.0) | 0 (0.0) | 1 (3.8) | 0 (0.0) |
| Rapes (per 100,000) | 6 (25.4) | 4 (16.2) | 5 (20.1) | 3 (11.9) | 4 (15.7) | 6 (23.5) | 3 (11.7) | 5 (19.5) | 4 (15.1) | 1 (3.7) | 1 (3.8) | 2 (7.7) | 1 (3.8) | 0 (0.0) |
| Robberies (per 100,000) | 3 (12.7) | 6 (24.3) | 3 (12.1) | 4 (15.9) | 2 (7.9) | 0 (0.0) | 0 (0.0) | 0 (0.0) | 3 (11.3) | 0 (0.0) | 0 (0.0) | 3 (11.5) | 1 (3.8) | 1 (3.8) |
| Assaults (per 100,000) | 19 (80.5) | 21 (84.9) | 15 (60.3) | 12 (47.6) | 18 (70.8) | 10 (39.1) | 5 (19.5) | 9 (35.1) | 5 (18.9) | 4 (15.0) | 5 (19.0) | 11 (42.1) | 10 (38.2) | 14 (52.7) |
| Burglaries (per 100,000) | 98 (415.3) | 151 (610.6) | 94 (377.8) | 114 (452.2) | 56 (220.3) | 37 (144.8) | 47 (182.9) | 58 (226.2) | 85 (321.6) | 52 (194.8) | 76 (288.6) | 86 (329.0) | 57 (217.5) | 46 (173.2) |
| Thefts (per 100,000) | 166 (703.5) | 168 (679.4) | 180 (723.5) | 168 (666.4) | 172 (676.6) | 124 (485.3) | 102 (397.0) | 114 (444.7) | 116 (438.9) | 107 (400.7) | 98 (372.2) | 91 (348.2) | 110 (419.8) | 126 (474.5) |
| Auto thefts (per 100,000) | 25 (105.9) | 11 (44.5) | 15 (60.3) | 9 (35.7) | 13 (51.1) | 13 (50.9) | 3 (11.7) | 5 (19.5) | 9 (34.0) | 8 (30.0) | 5 (19.0) | 5 (19.1) | 5 (19.1) | 10 (37.7) |
| Arson (per 100,000) | 2 (8.5) | 1 (4.0) | 0 (0.0) | 1 (4.0) | 3 (11.8) | 0 (0.0) | 0 (0.0) | 0 (0.0) | 0 (0.0) | 0 (0.0) | 2 (7.6) | 1 (3.8) | 1 (3.8) | 1 (3.8) |
| City-Data.com crime index | 105.9 | 110.7 | 92.0 | 85.0 | 75.7 | 60.2 | 42.9 | 57.8 | 62.1 | 38.1 | 43.4 | 56.5 | 53.0 | 45.8 |
The City-Data.com crime index weighs serious crimes and violent crimes more heavily. Higher means more crime, U.S. average is 246.1. It adjusts for the number of visitors and daily workers commuting into cities.
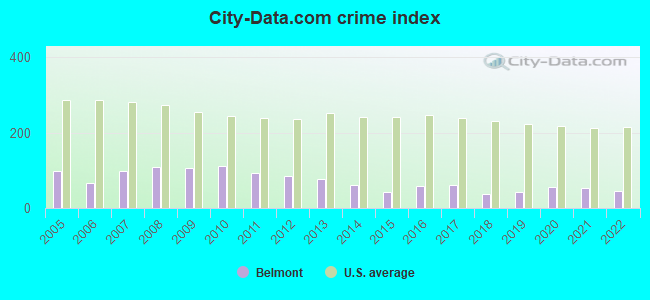
Crime rate in Belmont detailed stats: murders, rapes, robberies, assaults, burglaries, thefts, arson
Full-time law enforcement employees in 2021, including police officers: 56 (44 officers - 38 male; 6 female).
| Officers per 1,000 residents here: | 1.68 |
| Massachusetts average: | 2.53 |
 Recent articles from our blog. Our writers, many of them Ph.D. graduates or candidates, create easy-to-read articles on a wide variety of topics.

 | Only Child families in Lexington/Belmont? (34 replies) |
| Different Neighborhoods in Winchester / Belmont (10 replies) |
| Commute from Holden, MA to Belmont, mA (5 replies) |
| Melrose v Belmont Schools (24 replies) |
| why belmont MA is expensive but highly sought after? (39 replies) |
| Public School (SPED) in Arlington Lexington Belmont and Winchester (10 replies) |
Latest news from Belmont, MA collected exclusively by city-data.com from local newspapers, TV, and radio stations
Belmont, MA City Guides:
Ancestries: Irish (10.2%), Italian (8.1%), European (4.4%), Greek (3.9%), English (3.6%), Armenian (3.5%).
Current Local Time: EST time zone
Incorporated in 1859
Elevation: 44 feet
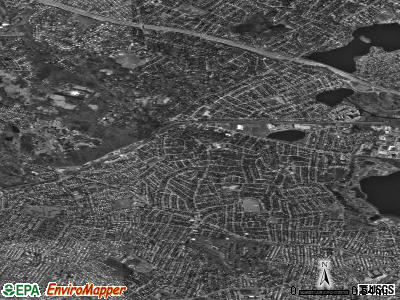
Land area: 4.66 square miles.
Population density: 5,305 people per square mile (average).
7,153 residents are foreign born (14.7% Asia, 7.0% Europe).
| This place: | 26.6% |
| Massachusetts: | 17.6% |
Median real estate property taxes paid for housing units with mortgages in 2022: $9,730 (0.8%)
Median real estate property taxes paid for housing units with no mortgage in 2022: $9,838 (0.9%)
Nearest city with pop. 50,000+: Waltham, MA  (3.2 miles , pop. 59,226).
Nearest city with pop. 200,000+: Boston, MA (6.5 miles , pop. 589,141).
Nearest city with pop. 1,000,000+: Bronx, NY (175.7 miles , pop. 1,332,650).
Nearest cities:
Latitude: 42.39 N, Longitude: 71.17 W
Daytime population change due to commuting: -2,857 (-10.6%)
Workers who live and work in this place: 5,487 (39.3%)
Area codes: 617, 857
Belmont, Massachusetts accommodation & food services, waste management - Economy and Business Data
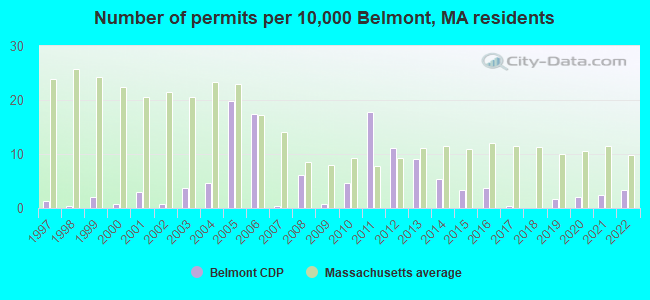
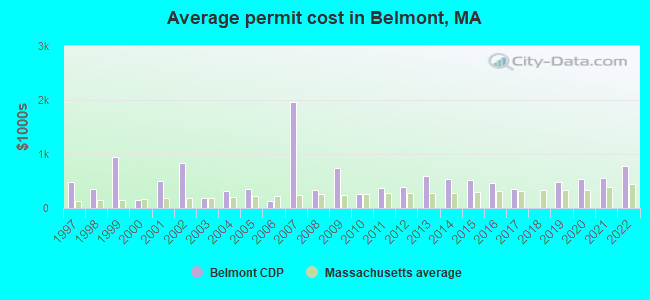
Single-family new house construction building permits:
- 2022: 8 buildings, average cost: $777,000
- 2021: 6 buildings, average cost: $547,500
- 2020: 5 buildings, average cost: $539,000
- 2019: 4 buildings, average cost: $487,300
- 2017: 1 building, cost: $350,000
- 2016: 9 buildings, average cost: $461,900
- 2015: 8 buildings, average cost: $517,700
- 2014: 13 buildings, average cost: $537,200
- 2013: 22 buildings, average cost: $601,100
- 2012: 27 buildings, average cost: $392,900
- 2011: 43 buildings, average cost: $369,500
- 2010: 11 buildings, average cost: $260,300
- 2009: 2 buildings, average cost: $750,000
- 2008: 15 buildings, average cost: $325,000
- 2007: 1 building, cost: $1,972,000
- 2006: 42 buildings, average cost: $138,400
- 2005: 48 buildings, average cost: $353,100
- 2004: 11 buildings, average cost: $319,800
- 2003: 9 buildings, average cost: $191,000
- 2002: 2 buildings, average cost: $827,500
- 2001: 7 buildings, average cost: $498,300
- 2000: 2 buildings, average cost: $150,000
- 1999: 5 buildings, average cost: $937,300
- 1998: 1 building, cost: $350,000
- 1997: 3 buildings, average cost: $482,000
| Here: | 3.0% |
| Massachusetts: | 3.5% |
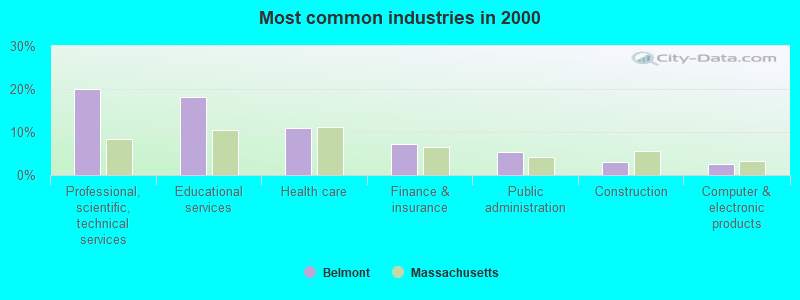
- Professional, scientific, technical services (20.1%)
- Educational services (18.1%)
- Health care (11.0%)
- Finance & insurance (7.2%)
- Public administration (5.3%)
- Construction (3.0%)
- Computer & electronic products (2.5%)
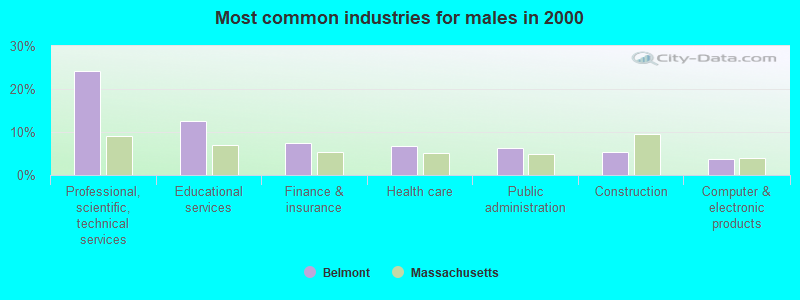
- Professional, scientific, technical services (24.1%)
- Educational services (12.6%)
- Finance & insurance (7.5%)
- Health care (6.7%)
- Public administration (6.3%)
- Construction (5.2%)
- Computer & electronic products (3.7%)

- Educational services (23.7%)
- Professional, scientific, technical services (16.0%)
- Health care (15.3%)
- Finance & insurance (6.9%)
- Public administration (4.2%)
- Social assistance (3.2%)
- Religious, grantmaking, civic, professional, similar organizations (3.0%)

- Other management occupations, except farmers and farm managers (7.4%)
- Computer specialists (5.8%)
- Postsecondary teachers (4.3%)
- Preschool, kindergarten, elementary, and middle school teachers (4.0%)
- Lawyers (3.8%)
- Top executives (3.8%)
- Life and physical scientists (3.4%)

- Computer specialists (9.4%)
- Other management occupations, except farmers and farm managers (7.3%)
- Top executives (6.2%)
- Lawyers (5.1%)
- Postsecondary teachers (4.9%)
- Life and physical scientists (4.0%)
- Engineers (3.6%)

- Other management occupations, except farmers and farm managers (7.5%)
- Preschool, kindergarten, elementary, and middle school teachers (7.0%)
- Secretaries and administrative assistants (6.6%)
- Registered nurses (4.4%)
- Other office and administrative support workers, including supervisors (4.2%)
- Counselors, social workers, and other community and social service specialists (3.8%)
- Postsecondary teachers (3.8%)
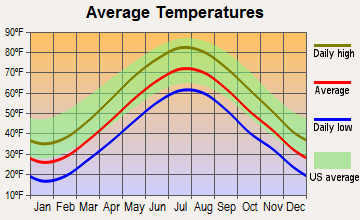
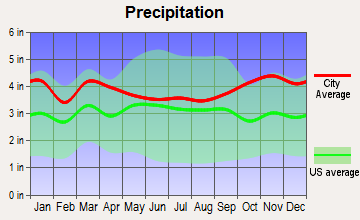
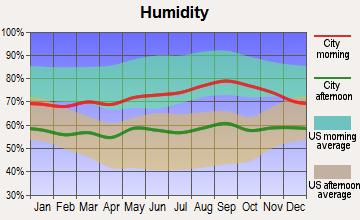
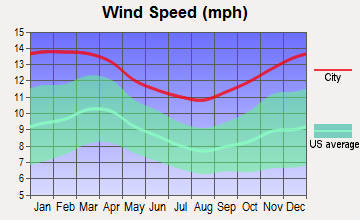
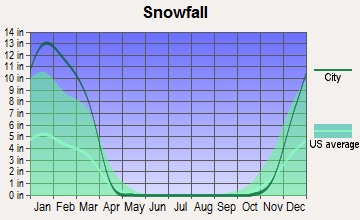
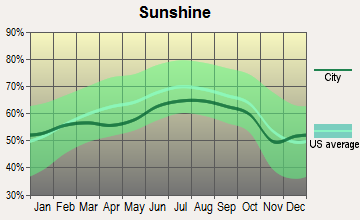
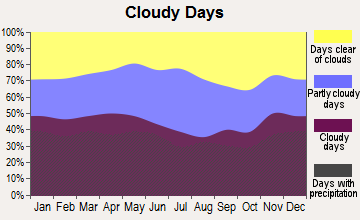
Average climate in Belmont, Massachusetts
Based on data reported by over 4,000 weather stations
|
|

(lower is better)
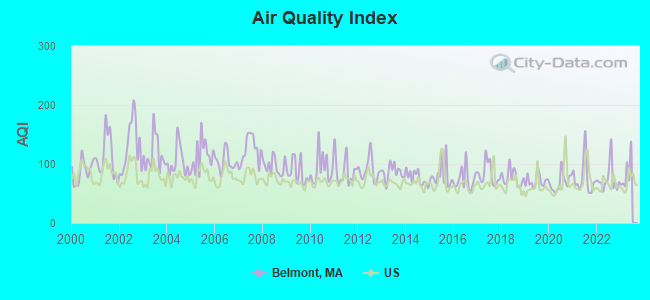
Air Quality Index (AQI) level in 2022 was 74.3. This is about average.
| City: | 74.3 |
| U.S.: | 72.6 |
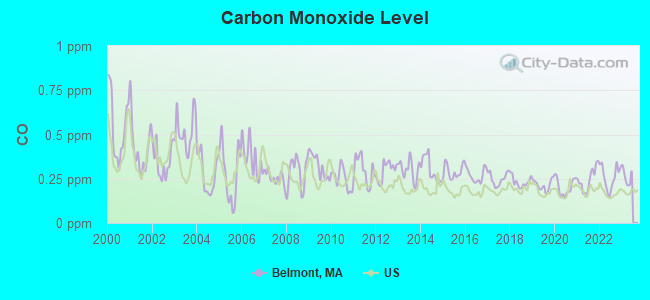
Carbon Monoxide (CO) [ppm] level in 2022 was 0.260. This is about average. Closest monitor was 1.2 miles away from the city center.
| City: | 0.260 |
| U.S.: | 0.251 |
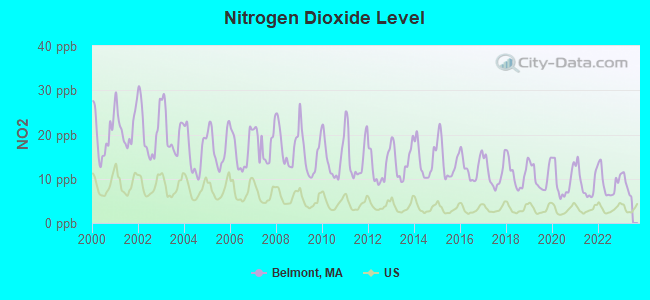
Nitrogen Dioxide (NO2) [ppb] level in 2022 was 8.96. This is significantly worse than average. Closest monitor was 1.2 miles away from the city center.
| City: | 8.96 |
| U.S.: | 5.11 |
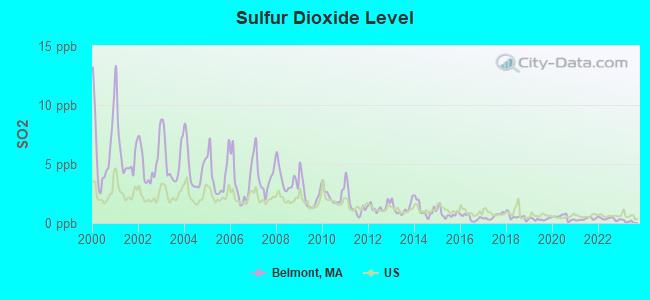
Sulfur Dioxide (SO2) [ppb] level in 2022 was 0.358. This is significantly better than average. Closest monitor was 1.2 miles away from the city center.
| City: | 0.358 |
| U.S.: | 1.515 |
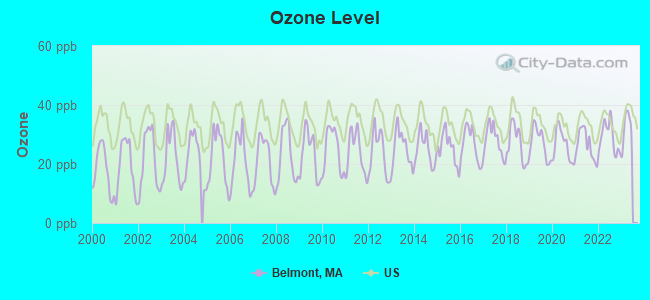
Ozone [ppb] level in 2022 was 29.1. This is about average. Closest monitor was 1.2 miles away from the city center.
| City: | 29.1 |
| U.S.: | 33.3 |
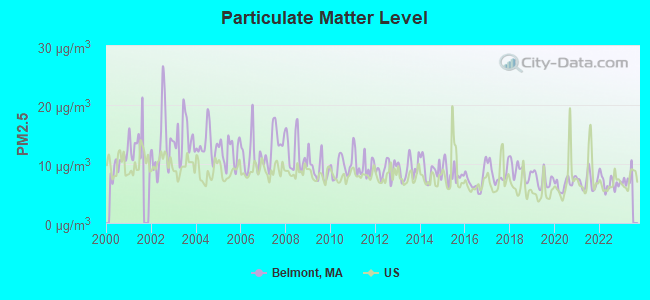
Particulate Matter (PM2.5) [µg/m3] level in 2022 was 6.82. This is about average. Closest monitor was 4.9 miles away from the city center.
| City: | 6.82 |
| U.S.: | 8.11 |
Tornado activity:
Belmont-area historical tornado activity is near Massachusetts state average. It is 40% smaller than the overall U.S. average.
On 6/9/1953, a category F4 (max. wind speeds 207-260 mph) tornado 18.8 miles away from the Belmont place center killed 90 people and injured 1228 people and caused between $50,000,000 and $500,000,000 in damages.
On 9/29/1974, a category F3 (max. wind speeds 158-206 mph) tornado 14.7 miles away from the place center injured one person and caused between $50,000 and $500,000 in damages.
Earthquake activity:
Belmont-area historical earthquake activity is significantly above Massachusetts state average. It is 73% smaller than the overall U.S. average.On 10/7/1983 at 10:18:46, a magnitude 5.3 (5.1 MB, 5.3 LG, 5.1 ML, Class: Moderate, Intensity: VI - VII) earthquake occurred 192.8 miles away from Belmont center
On 4/20/2002 at 10:50:47, a magnitude 5.3 (5.3 ML, Depth: 3.0 mi) earthquake occurred 193.8 miles away from Belmont center
On 1/19/1982 at 00:14:42, a magnitude 4.7 (4.5 MB, 4.7 MD, 4.5 LG, Class: Light, Intensity: IV - V) earthquake occurred 79.6 miles away from the city center
On 10/16/2012 at 23:12:25, a magnitude 4.7 (4.7 ML, Depth: 10.0 mi) earthquake occurred 87.4 miles away from Belmont center
On 4/20/2002 at 10:50:47, a magnitude 5.2 (5.2 MB, 4.2 MS, 5.2 MW, 5.0 MW) earthquake occurred 193.2 miles away from the city center
On 8/22/1992 at 12:20:32, a magnitude 4.8 (4.8 MB, 3.8 MS, 4.7 LG, Depth: 6.2 mi) earthquake occurred 231.6 miles away from the city center
Magnitude types: regional Lg-wave magnitude (LG), body-wave magnitude (MB), duration magnitude (MD), local magnitude (ML), surface-wave magnitude (MS), moment magnitude (MW)
Natural disasters:
The number of natural disasters in Middlesex County (31) is a lot greater than the US average (15).Major Disasters (Presidential) Declared: 17
Emergencies Declared: 14
Causes of natural disasters: Floods: 12, Storms: 9, Hurricanes: 6, Snowstorms: 6, Winter Storms: 5, Blizzards: 2, Snows: 2, Explosion: 1, Heavy Rain: 1, Snowfall: 1, Water Main Break: 1, Wind: 1 (Note: some incidents may be assigned to more than one category).
Hospitals and medical centers in Belmont:
Other hospitals and medical centers near Belmont:
- NORTHEAST CAMBRIDGE DIALYSIS (Dialysis Facility, about 2 miles away; CAMBRIDGE, MA)
- SANCTA MARIA NURSING FACILITY (Nursing Home, about 2 miles away; CAMBRIDGE, MA)
- MAYOR MICHAEL J NEVILLE MANOR (Nursing Home, about 2 miles away; CAMBRIDGE, MA)
- NEVILLE CENTER AT FRESH POND FOR NURSING AND REHAB (Nursing Home, about 2 miles away; CAMBRIDGE, MA)
- MARQUARDT NURSING CENTER (Nursing Home, about 2 miles away; WALTHAM, MA)
- ABBEY FOREST NURSING HOME (Nursing Home, about 2 miles away; NORTH WALTHAM, MA)
- PARK CIRCLE NURSING HOME (Nursing Home, about 2 miles away; ARLINGTON, MA)
Amtrak stations near Belmont:
- 6 miles: BACK BAY (BOSTON, 145 DARTMOUTH ST.) . Services: ticket office, partially wheelchair accessible, enclosed waiting area, public restrooms, public payphones, vending machines, ATM, paid short-term parking, paid long-term parking, call for car rental service, taxi stand, public transit connection.
- 7 miles: BOSTON, NORTH STATION (BOSTON, 126 CAUSEWAY ST.) . Services: ticket office, enclosed waiting area.
- 7 miles: BOSTON (SO. STA) (BOSTON, ATLANTIC AVE. & SUMMER ST.) . Services: ticket office, fully wheelchair accessible, enclosed waiting area, public restrooms, public payphones, full-service food facilities and snack bar, ATM, paid short-term parking, paid long-term parking, call for car rental service, taxi stand, intercity bus service, public transit connection.
Colleges/universities with over 2000 students nearest to Belmont:
- Bentley University (about 3 miles; Waltham, MA; Full-time enrollment: 5,229)
- Tufts University (about 3 miles; Medford, MA; FT enrollment: 9,041)
- Harvard University (about 4 miles; Cambridge, MA; FT enrollment: 20,857)
- Lesley University (about 4 miles; Cambridge, MA; FT enrollment: 4,317)
- Cambridge College (about 4 miles; Cambridge, MA; FT enrollment: 2,782)
- Boston College (about 4 miles; Chestnut Hill, MA; FT enrollment: 12,070)
- Brandeis University (about 5 miles; Waltham, MA; FT enrollment: 6,966)
Public high school in Belmont:
- BELMONT HIGH (Students: 437, Location: 221 CONCORD AVENUE, Grades: 9-12)
Private high schools in Belmont:
- BELMONT HILL SCHOOL (Students: 448, Location: 350 PROSPECT ST, Grades: 7-12, Boys only)
- ARLINGTON SCHOOL (Students: 33, Location: 115 MILL ST, Grades: 9-12)
- CNS/PATHWAYS ACADEMY (Students: 25, Location: 115 MILL ST, Grades: UG-12)
Public elementary/middle schools in Belmont:
- WINTHROP L CHENERY MIDDLE (Students: 1,122, Location: 95 WASHINGTON STREET, Grades: 5-8)
- WINN BROOK (Students: 453, Location: 97 WATERHOUSE RD, Grades: KG-4)
- ROGER E WELLINGTON (Students: 434, Location: 121 ORCHARD STREET, Grades: PK-4)
- MARY LEE BURBANK (Students: 299, Location: 266 SCHOOL STREET, Grades: KG-4)
- DANIEL BUTLER (Students: 269, Location: 90 WHITE STREET, Grades: KG-4)
Private elementary/middle school in Belmont:
Library in Belmont:
User-submitted facts and corrections:
- Cornerstone Christian Academy has been closed and should be removed from your list of schools.
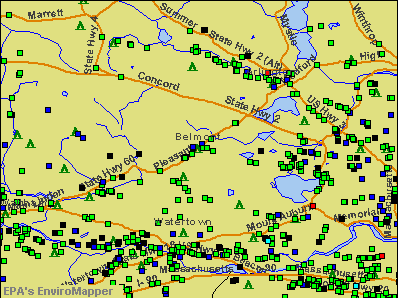
Points of interest:
Notable locations in Belmont: Belmont Station (A), Waverley Station (B), Belmont Country Club (C), Belmont Fire Department Station 1 Headquarters (D), Belmont Fire Department Station 2 (E), Winn Brook School Library (F), Belmont Public Library (G), Benton Branch Belmont Public Library (H), Byrnes Library (I), Roger Wellington School Library (J), Belmont Townhall (K), McLean Hospital Mental Health Sciences Library (L), National Archives New England Region (M). Display/hide their locations on the map
Churches in Belmont include: Saint Patricks Parish Church (A), Saint Josephs Parish Church (B), Saint Andrews Episcopal Church (C), Payson Park Church (D), Our Lady of Mercy Church (E), Korean Hope Church in Boston (F), First Baptist Church (G), Cross Roads Evangelical Church (H), Cornerstone Baptist Church (I). Display/hide their locations on the map
Lakes and reservoirs: Little Pond (A), Mill Pond (B), Claypit Pond (C), Duck Pond (D), Payson Park Reservoir (E). Display/hide their locations on the map
Streams, rivers, and creeks: Winn Brook (A). Display/hide its location on the map
Parks in Belmont include: Audubon Wildlife Sanctuary (1), Pequossette Playground (2), Grove Street Playground (3). Display/hide their locations on the map
Birthplace of: Bruce Mather (ice hockey) - Ice hockey player, Chandler Robbins - Ornithologist and natural history writer, David Wheeler (stage director) - Stage director, Eugene Francis McGurl - Doolittle Raid pilot, Jean Rogers - Actress, Pat Rissmiller - NHL player (San Jose Sharks, born: Oct 26, 1978), Thomas Vose Daily - Catholic bishop, Whitall Perry - Comparative religions scholar., Addison Powell - Television actor, Blair Fairchild - Diplomat.
Drinking water stations with addresses in Belmont and their reported violations in the past:
BELMONT WATER DEPT. (MWRA) (Population served: 25,879, Purch surface water):Past health violations:
- Lead Service Line Replacement (LSLR) - In JAN-01-2008, Contaminant: Lead and Copper Rule. Follow-up actions: St AO (w/o penalty) issued (2 times from JAN-30-2009 to JUN-25-2009), St Compliance achieved (JAN-01-2010)
| This place: | 2.5 people |
| Massachusetts: | 2.5 people |
| This place: | 68.6% |
| Whole state: | 63.0% |
| This place: | 5.0% |
| Whole state: | 7.0% |
Likely homosexual households (counted as self-reported same-sex unmarried-partner households)
- Lesbian couples: 0.8% of all households
- Gay men: 0.3% of all households
People in group quarters in Belmont in 2010:
- 125 people in nursing facilities/skilled-nursing facilities
- 23 people in group homes intended for adults
- 17 people in residential treatment centers for adults
- 15 people in residential schools for people with disabilities
- 9 people in mental (psychiatric) hospitals and psychiatric units in other hospitals
- 6 people in other noninstitutional facilities
People in group quarters in Belmont in 2000:
- 124 people in nursing homes
- 81 people in mental (psychiatric) hospitals or wards
- 49 people in schools, hospitals, or wards for the intellectually disabled
- 20 people in hospitals or wards for drug/alcohol abuse
- 16 people in homes for the mentally retarded
- 14 people in homes for the mentally ill
- 8 people in religious group quarters
Banks with most branches in Belmont (2011 data):
- Belmont Savings Bank: Belmont Branch, at 2 Leonard Street, Trapelo Road Branch. Info updated 2009/12/23: Bank assets: $668.5 mil, Deposits: $472.9 mil, local headquarters, positive income, Commercial Lending Specialization, 4 total offices, Holding Company: Bsb Bancorp Inc.
- RBS Citizens, National Association: Belmont Shaw's Branch at 535 Trapelo Road, branch established on 1997/08/04; Belmont Branch at 65 Leonard Street, branch established on 2003/07/14. Info updated 2007/09/19: Bank assets: $106,940.6 mil, Deposits: $75,690.2 mil, headquarters in Providence, RI, positive income, 1135 total offices, Holding Company: Uk Financial Investments Limited
- Bank of America, National Association: Belmont Center Branch at 72 Leonard Street, branch established on 1946/06/10; Waverly Branch at 483 Trapelo Road, branch established on 1946/09/03. Info updated 2009/11/18: Bank assets: $1,451,969.3 mil, Deposits: $1,077,176.8 mil, headquarters in Charlotte, NC, positive income, 5782 total offices, Holding Company: Bank Of America Corporation
- East Cambridge Savings Bank: Belmont Branch at 395 Trapelo Road, branch established on 1997/11/17. Info updated 2007/04/09: Bank assets: $803.6 mil, Deposits: $690.6 mil, headquarters in Cambridge, MA, positive income, 9 total offices
- Watertown Savings Bank: Waverly Square Branch at 30 Church Street, branch established on 1997/07/14. Info updated 2011/06/29: Bank assets: $1,063.2 mil, Deposits: $947.0 mil, headquarters in Watertown, MA, positive income, Mortgage Lending Specialization, 9 total offices
- Cambridge Savings Bank: Belmont Branch at 40 Leonard Street, branch established on 1974/09/25. Info updated 2007/01/05: Bank assets: $2,316.4 mil, Deposits: $1,902.8 mil, headquarters in Cambridge, MA, positive income, Commercial Lending Specialization, 18 total offices, Holding Company: Cambridge Financial Group, Inc.
- Cambridge Trust Company: Belmont Branch at 361 Trapelo Road, branch established on 2008/12/29. Info updated 2006/09/29: Bank assets: $1,275.9 mil, Deposits: $1,129.9 mil, headquarters in Cambridge, MA, positive income, Mortgage Lending Specialization, 13 total offices, Holding Company: Cambridge Bancorp
- Sovereign Bank, National Association: Belmont Branch at 375 Concord Avenue, branch established on 1968/02/27. Info updated 2012/01/31: Bank assets: $78,146.9 mil, Deposits: $48,042.9 mil, headquarters in Wilmington, DE, positive income, Commercial Lending Specialization, 718 total offices, Holding Company: Banco Santander, S.A.
- Leader Bank, National Association: Belmont Branch at 363 Pleasant St, branch established on 2008/01/11. Info updated 2011/07/15: Bank assets: $509.3 mil, Deposits: $342.4 mil, headquarters in Arlington, MA, positive income, Commercial Lending Specialization, 5 total offices, Holding Company: Leader Bancorp, Inc
For population 15 years and over in Belmont:
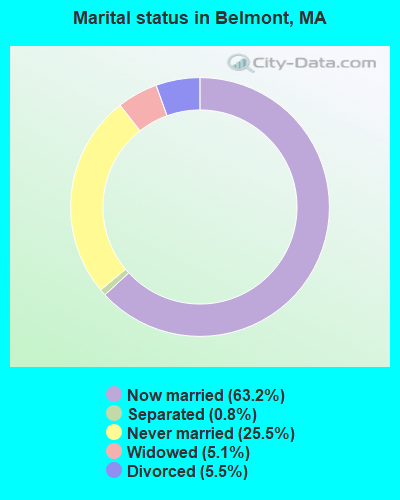
- Never married: 25.5%
- Now married: 63.2%
- Separated: 0.8%
- Widowed: 5.1%
- Divorced: 5.5%
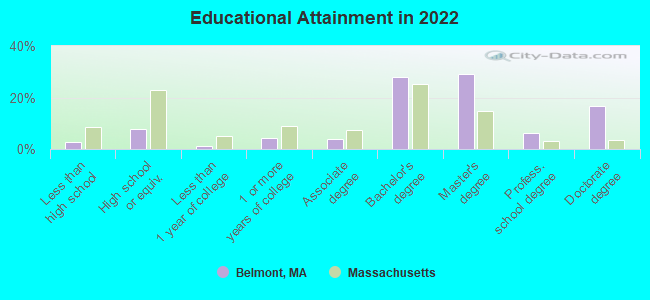
For population 25 years and over in Belmont:
- High school or higher: 97.4%
- Bachelor's degree or higher: 79.6%
- Graduate or professional degree: 51.8%
- Unemployed: 2.3%
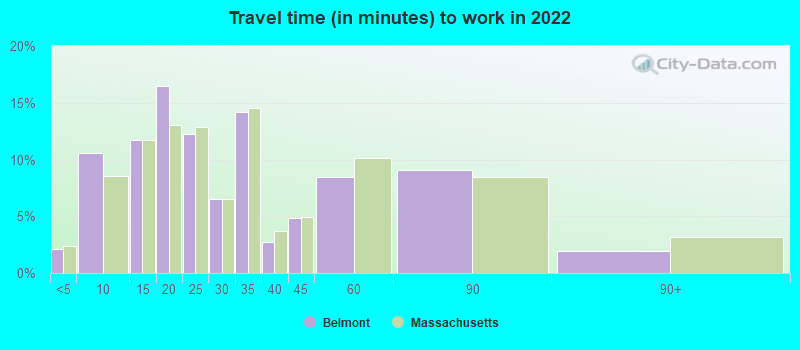
- Mean travel time to work (commute): 20.1 minutes
| Here: | 10.3 |
| Massachusetts average: | 13.0 |
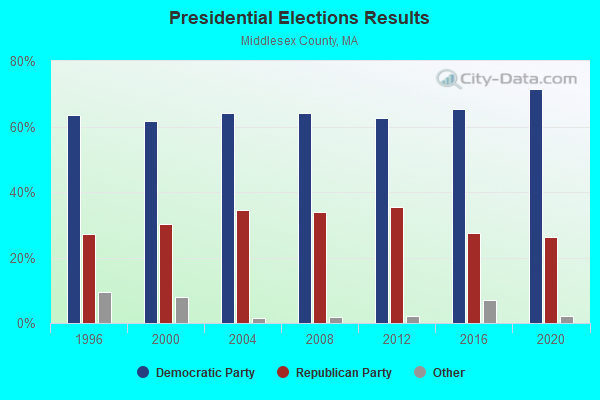
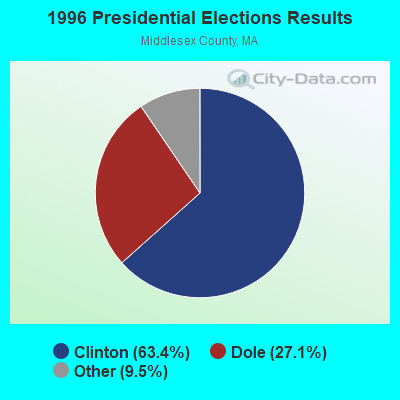
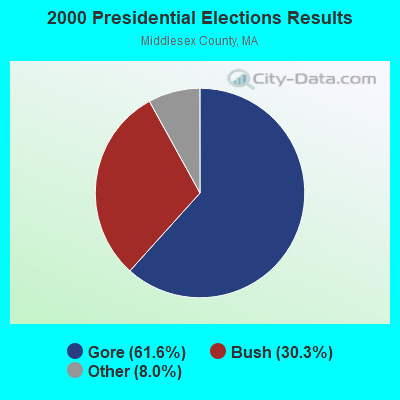
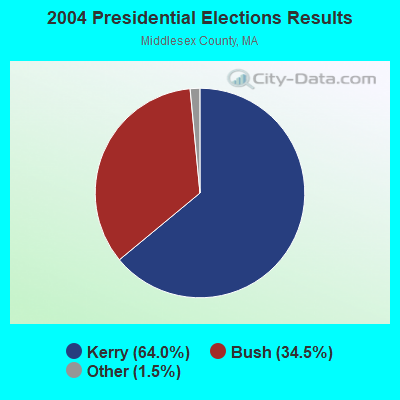
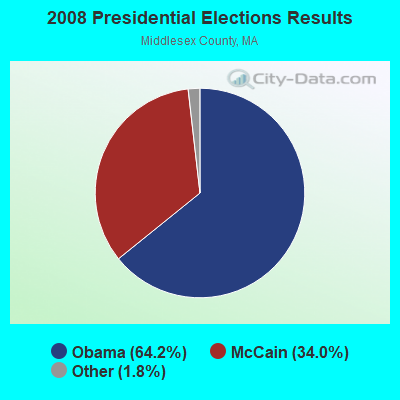
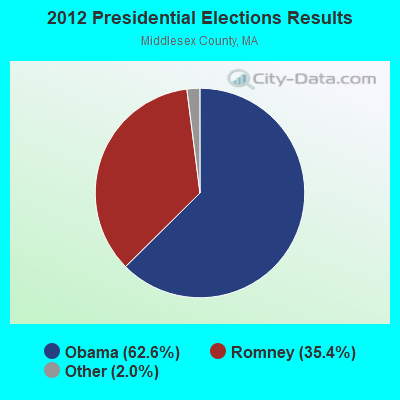
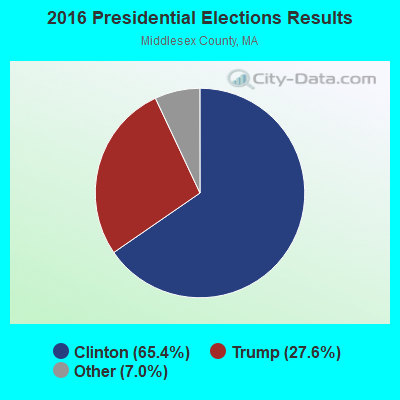
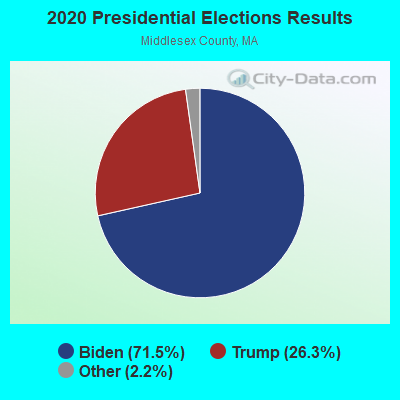
Graphs represent county-level data. Detailed 2008 Election Results
Religion statistics for Belmont, MA (based on Middlesex County data)
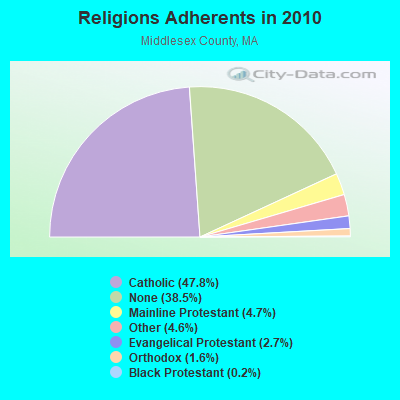
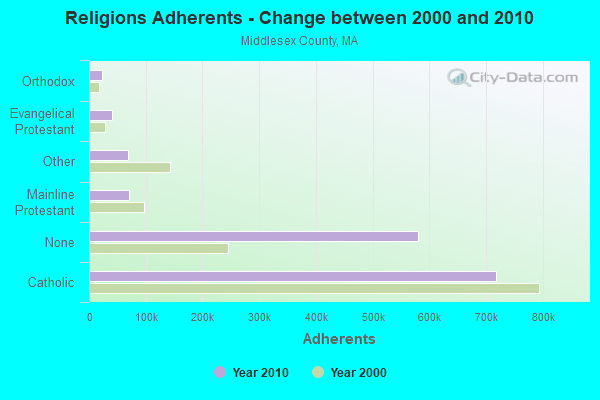
| Religion | Adherents | Congregations |
|---|---|---|
| Catholic | 718,209 | 107 |
| Mainline Protestant | 70,053 | 269 |
| Other | 68,480 | 199 |
| Evangelical Protestant | 41,270 | 304 |
| Orthodox | 23,641 | 28 |
| Black Protestant | 2,276 | 8 |
| None | 579,156 | - |
Food Environment Statistics:
| Middlesex County: | 1.71 / 10,000 pop. |
| State: | 1.98 / 10,000 pop. |
| Here: | 0.03 / 10,000 pop. |
| State: | 0.05 / 10,000 pop. |
| Middlesex County: | 2.14 / 10,000 pop. |
| State: | 2.22 / 10,000 pop. |
| Middlesex County: | 1.38 / 10,000 pop. |
| Massachusetts: | 1.77 / 10,000 pop. |
| Middlesex County: | 7.84 / 10,000 pop. |
| Massachusetts: | 8.76 / 10,000 pop. |
| Middlesex County: | 7.8% |
| State: | 8.1% |
| This county: | 21.5% |
| Massachusetts: | 22.5% |
| Middlesex County: | 18.0% |
| Massachusetts: | 16.5% |
Health and Nutrition:
| Belmont: | 59.9% |
| Massachusetts: | 50.5% |
| Here: | 60.9% |
| State: | 48.0% |
| Here: | 27.4 |
| State: | 28.4 |
| Here: | 17.0% |
| Massachusetts: | 20.7% |
| Belmont: | 7.6% |
| Massachusetts: | 10.4% |
| Here: | 7.1 |
| State: | 6.8 |
| This city: | 32.8% |
| Massachusetts: | 33.4% |
| Belmont: | 65.5% |
| Massachusetts: | 57.1% |
| Belmont: | 82.1% |
| Massachusetts: | 79.2% |
More about Health and Nutrition of Belmont, MA Residents
6.91% of this county's 2021 resident taxpayers lived in other counties in 2020 ($102,955 average adjusted gross income)
| Here: | 6.91% |
| Massachusetts average: | 6.35% |
0.01% of residents moved from foreign countries ($137 average AGI)
Middlesex County: 0.01% Massachusetts average: 0.01%
Top counties from which taxpayers relocated into this county between 2020 and 2021:
| from Suffolk County, MA | |
| from Essex County, MA | |
| from Norfolk County, MA |
8.22% of this county's 2020 resident taxpayers moved to other counties in 2021 ($123,369 average adjusted gross income)
| Here: | 8.22% |
| Massachusetts average: | 7.18% |
0.01% of residents moved to foreign countries ($124 average AGI)
Middlesex County: 0.01% Massachusetts average: 0.02%
Top counties to which taxpayers relocated from this county between 2020 and 2021:
| to Suffolk County, MA | |
| to Essex County, MA | |
| to Worcester County, MA |
| Businesses in Belmont, MA | ||||
| Name | Count | Name | Count | |
|---|---|---|---|---|
| Baskin-Robbins | 1 | Macy's | 1 | |
| CVS | 2 | Motherhood Maternity | 1 | |
| Domino's Pizza | 1 | Shaw's | 1 | |
| Dunkin Donuts | 2 | Starbucks | 2 | |
| FedEx | 6 | Subaru | 1 | |
| H&R Block | 1 | True Value | 1 | |
| Jones New York | 3 | UPS | 2 | |
Strongest AM radio stations in Belmont:
- WWZN (1510 AM; 50 kW; BOSTON, MA; Owner: ROSE CITY RADIO CORPORATION)
- WRKO (680 AM; 50 kW; BOSTON, MA; Owner: ENTERCOM BOSTON LICENSE, LLC)
- WBPS (1150 AM; 5 kW; BOSTON, MA; Owner: MEGA COMMUNICATIONS OF BOSTON LICENSEE, L.L.C.)
- WRCA (1330 AM; 25 kW; WALTHAM, MA; Owner: WRCA LICENSE, LLC)
- WEEI (850 AM; 50 kW; BOSTON, MA; Owner: ENTERCOM BOSTON LICENSE, LLC)
- WNTN (1550 AM; 10 kW; NEWTON, MA; Owner: COLT COMMUNICATIONS, LLC)
- WEZE (590 AM; 5 kW; BOSTON, MA; Owner: NEW ENGLAND CONTINENTAL MEDIA, INC.)
- WUNR (1600 AM; 20 kW; BROOKLINE, MA; Owner: CHAMPION BROADCASTING SYSTEMS, INC.)
- WKOX (1200 AM; 50 kW; FRAMINGHAM, MA; Owner: CAPSTAR TX LIMITED PARTNERSHIP)
- WBIX (1060 AM; 40 kW; NATICK, MA; Owner: LANGER BROADCASTING CORPORATION)
- WBZ (1030 AM; 50 kW; BOSTON, MA; Owner: INFINITY BROADCASTING OPERATIONS, INC.)
- WILD (1090 AM; daytime; 5 kW; BOSTON, MA; Owner: RADIO ONE OF BOSTON LICENSES, LLC)
- WXKS (1430 AM; 5 kW; EVERETT, MA; Owner: AMFM RADIO LICENSES, L.L.C.)
Strongest FM radio stations in Belmont:
- WXKS-FM (107.9 FM; MEDFORD, MA; Owner: AMFM RADIO LICENSES, L.L.C.)
- WMJX (106.7 FM; BOSTON, MA; Owner: GREATER BOSTON RADIO, INC.)
- WBMX (98.5 FM; BOSTON, MA; Owner: INFINITY RADIO OPERATIONS INC.)
- WJMN (94.5 FM; BOSTON, MA; Owner: AMFM RADIO LICENSES, L.L.C.)
- WCRB (102.5 FM; WALTHAM, MA; Owner: CHARLES RIVER BROADCASTING WCRB LICE)
- WTKK (96.9 FM; BOSTON, MA; Owner: GREATER BOSTON RADIO, INC.)
- WROR-FM (105.7 FM; FRAMINGHAM, MA; Owner: GREATER BOSTON RADIO, INC.)
- WBOS (92.9 FM; BROOKLINE, MA; Owner: GREATER BOSTON RADIO, INC.)
- WGBH (89.7 FM; BOSTON, MA; Owner: WGBH EDUCATIONAL FOUNDATION)
- WBUR-FM (90.9 FM; BOSTON, MA; Owner: TRUSTEES OF BOSTON UNIVERSITY)
- WBCN (104.1 FM; BOSTON, MA; Owner: HEMISPHERE BROADCASTING CORPORATION)
- WZLX (100.7 FM; BOSTON, MA; Owner: INFINITY BROADCASTING CORPORATION OF BOSTON)
- WODS (103.3 FM; BOSTON, MA; Owner: INFINITY BROADCASTING OPERATIONS, INC.)
- WERS (88.9 FM; BOSTON, MA; Owner: EMERSON COLLEGE)
- W267AI (101.3 FM; BOSTON, MA; Owner: MCC BROADCASTING COMPANY, INC.)
- WFNX (101.7 FM; LYNN, MA; Owner: MCC BROADCASTING COMPANY, INC.)
- WHRB (95.3 FM; CAMBRIDGE, MA; Owner: HARVARD RADIO BROADCASTING CO., INC.)
- WZBC (90.3 FM; NEWTON, MA; Owner: TRUSTEES OF BOSTON COLLEGE)
- WMBR (88.1 FM; CAMBRIDGE, MA; Owner: TECHNOLOGY BROADCASTING CORPORATION)
- WMFO (91.5 FM; MEDFORD, MA; Owner: TUFTS UNIVERSITY)
TV broadcast stations around Belmont:
- WCVB-TV (Channel 5; BOSTON, MA; Owner: WCVB HEARST-ARGYLE TV, INC.)
- WGBH-TV (Channel 2; BOSTON, MA; Owner: WGBH EDUCATIONAL FOUNDATION)
- WHDH-TV (Channel 7; BOSTON, MA; Owner: WHDH-TV)
- WMFP (Channel 62; LAWRENCE, MA; Owner: WSAH LICENSE, INC.)
- WSBK-TV (Channel 38; BOSTON, MA; Owner: VIACOM INC.)
- WBZ-TV (Channel 4; BOSTON, MA; Owner: VIACOM INC.)
- WGBX-TV (Channel 44; BOSTON, MA; Owner: WGBH EDUCATIONAL FOUNDATION)
- WLVI-TV (Channel 56; CAMBRIDGE, MA; Owner: WLVI, INC.)
- WBPX (Channel 68; BOSTON, MA; Owner: PAXSON BOSTON-68 LICENSE, INC.)
- WFXT (Channel 25; BOSTON, MA; Owner: FOX TELEVISION STATIONS INC.)
- WTMU-LP (Channel 32; BOSTON, MA; Owner: ZGS BOSTON, INC.)
- WCEA-LP (Channel 58; BOSTON, MA; Owner: CHANNEL 19 TV CORPORATION)
- W40BO (Channel 40; BOSTON, MA; Owner: PAXSON COMMUNICATIONS LPTV, INC.)
- WUTF (Channel 66; MARLBOROUGH, MA; Owner: TELEFUTURA BOSTON LLC)
- WUNI (Channel 27; WORCESTER, MA; Owner: ENTRAVISION HOLDINGS, LLC)
- WFXZ-CA (Channel 24; BOSTON, MA; Owner: BOSTON BROADCASTING CORP.)
- WWDP (Channel 46; NORWELL, MA; Owner: NORWELL TELEVISION, LLC)
- WLNE-TV (Channel 6; NEW BEDFORD, MA; Owner: FREEDOM BROADCASTING OF SOUTHERN NEW ENGLAND, INC.)
- WNAC-TV (Channel 64; PROVIDENCE, RI; Owner: WNAC, LLC)
- WPRI-TV (Channel 12; PROVIDENCE, RI; Owner: TVL BROADCASTING OF RHODE ISLAND, LLC)
- WJAR (Channel 10; PROVIDENCE, RI; Owner: OUTLET BROADCASTING, INC.)
- WSBE-TV (Channel 36; PROVIDENCE, RI; Owner: RHODE ISLAND PUBLIC TELECOM. AUTHORITY)
- WHDN-LP (Channel 26; BOSTON, MA; Owner: GUENTER MARKSTEINER)
- WNDS (Channel 50; DERRY, NH; Owner: CTV OF DERRY, INC)
- National Bridge Inventory (NBI) Statistics
- 4Number of bridges
- 49ft / 15.1mTotal length
- $22,788,000Total costs
- 88,220Total average daily traffic
- 5,869Total average daily truck traffic
- 144,506Total future (year 2031) average daily traffic
FCC Registered Antenna Towers:
19 (See the full list of FCC Registered Antenna Towers in Belmont)FCC Registered Broadcast Land Mobile Towers:
12 (See the full list of FCC Registered Broadcast Land Mobile Towers in Belmont, MA)FCC Registered Microwave Towers:
7- Various Locations (Lat: 42.396194 Lon: -71.178083), Overall height: 6.1 m, Call Sign: WPNL334,
Assigned Frequencies: 952.356 MHz, Grant Date: 04/07/1998, Expiration Date: 04/07/2008, Cancellation Date: 06/07/2008, Phone: (617) 484-2780
- MA-BOS5294A, 460 Concord Avenue (Lat: 42.396278 Lon: -71.177667), Type: Tower, Structure height: 30.1 m, Overall height: 32 m, Call Sign: WQMA838,
Assigned Frequencies: 19375.0 MHz, 19475.0 MHz, Grant Date: 08/04/2020, Expiration Date: 06/15/2030, Cancellation Date: 04/05/2022, Certifier: Nadja S Sodos-Wallace, Registrant: T-Mobile Usa, Inc., 12920 Se 38th Street, Bellevue, WA 98006, Phone: (425) 383-8402, Fax: (425) 383-4840, Email:
- MA-BOS5243A, 30 Church St (Lat: 42.386778 Lon: -71.190500), Type: Bant, Structure height: 13.7 m, Overall height: 15.7 m, Call Sign: WQMA862,
Assigned Frequencies: 21875.0 MHz, Grant Date: 08/04/2020, Expiration Date: 06/15/2030, Cancellation Date: 09/13/2021, Certifier: Nadja S Sodos-Wallace, Registrant: T-Mobile Usa, Inc., 12920 Se 38th Street, Bellevue, WA 98006, Phone: (425) 383-8402, Fax: (425) 383-4840, Email:
- MA-BOS5295A, 125 Trapelo Rd (Lat: 42.381139 Lon: -71.175639), Type: Bant, Structure height: 21.6 m, Overall height: 23.6 m, Call Sign: WQMA985,
Assigned Frequencies: 23075.0 MHz, 23025.0 MHz, Grant Date: 08/04/2020, Expiration Date: 06/16/2030, Cancellation Date: 09/13/2021, Certifier: Nadja S Sodos-Wallace, Registrant: T-Mobile Usa, Inc., 12920 Se 38th Street, Bellevue, WA 98006, Phone: (425) 383-8402, Fax: (425) 383-4840, Email:
- MA-BOS7043A, Concord Ave (Lat: 42.399250 Lon: -71.188861), Type: Tower, Structure height: 36.6 m, Call Sign: WQMB955,
Assigned Frequencies: 10775.0 MHz, 10855.0 MHz, Grant Date: 08/11/2020, Expiration Date: 06/23/2030, Cancellation Date: 05/10/2023, Certifier: Nadja S Sodos-Wallace, Registrant: T-Mobile Usa, Inc., 12920 Se 38th Street, Bellevue, WA 98006, Phone: (425) 383-8401, Email:
- BOS0116, 780 Concord Avenue (Lat: 42.399361 Lon: -71.188361), Type: Pole, Structure height: 36.6 m, Call Sign: WQQG384,
Assigned Frequencies: 23285.0 MHz, 23285.0 MHz, 23285.0 MHz, 23285.0 MHz, 23285.0 MHz, Grant Date: 12/04/2012, Expiration Date: 12/04/2022, Cancellation Date: 06/03/2014, Certifier: Dan Menser, Registrant: T-Mobile License LLC, 12920 Se 38th Street, Bellevue, WA 98006, Phone: (425) 383-8401, Fax: (425) 383-4840, Email:
- Master, Lat: 42.391500 Lon: -71.184139, Call Sign: WRDA768, Licensee ID: L00015738,
Assigned Frequencies: 952.318 MHz, 952.318 MHz, Grant Date: 03/14/2019, Expiration Date: 03/14/2029, Certifier: Christopher Roy, Registrant: Belmont Municipal Light Department, 40 Prince Street, Belmont, MA 02478, Phone: (617) 716-9096, Email:
FCC Registered Amateur Radio Licenses:
144 (See the full list of FCC Registered Amateur Radio Licenses in Belmont)FAA Registered Aircraft:
5- Aircraft: COMMANDER AIRCRAFT CO 114-B (Category: Land, Seats: 4, Weight: Up to 12,499 Pounds), Engine: LYCOMING IO-540 SER (300 HP) (Reciprocating)
N-Number: 115CE, N115CE, N-115CE, Serial Number: 14667, Year manufactured: 1999, Airworthiness Date: 12/14/1999, Certificate Issue Date: 05/01/2002
Registrant (LLC): Dentate Equipment Leasing LLC, 375 Acorn Park Dr Apt 1407, Belmont, MA 02478 - Aircraft: ROBINSON HELICOPTER COMPANY R44 II (Category: Land, Seats: 4, Weight: Up to 12,499 Pounds), Engine: LYCOMING IO-540 SER (300 HP) (Reciprocating)
N-Number: 206TJ, N206TJ, N-206TJ, Serial Number: 11097, Year manufactured: 2006, Airworthiness Date: 02/14/2006, Certificate Issue Date: 06/13/2017
Registrant (LLC): Central Mass Helicopter LLC, 4 Radcliffe Rd, Belmont, MA 02478 - Aircraft: ROBINSON HELICOPTER R22 BETA (Category: Land, Seats: 2, Weight: Up to 12,499 Pounds), Engine: LYCOMING O-360-J2A (145 HP) (Reciprocating)
N-Number: 228SH, N228SH, N-228SH, Serial Number: 4014, Year manufactured: 2006, Airworthiness Date: 01/25/2006, Certificate Issue Date: 01/22/2016
Registrant (LLC): Central Mass Helicopter LLC, 4 Radcliffe Rd, Belmont, MA 02478 - Aircraft: EUROCOPTER SA341F2 (Category: Land, Seats: 5, Weight: Up to 12,499 Pounds), Engine: TURBOMECA ASTAZOU IIIC2 (590 HP) (Turbo-shaft)
N-Number: 341RD, N341RD, N-341RD, Serial Number: 1501, Year manufactured: 1976, Airworthiness Date: 11/16/2017, Certificate Issue Date: 09/18/2017
Registrant (LLC): Central Mass Helicopter LLC, 4 Radcliffe Rd, Belmont, MA 02478 - Aircraft: CESSNA T182T (Category: Land, Seats: 4, Weight: Up to 12,499 Pounds), Engine: LYCOMING TI0-540 SER (310 HP) (Reciprocating)
N-Number: 65431, N65431, N-65431, Serial Number: T18208302, Year manufactured: 2004, Airworthiness Date: 09/24/2004, Certificate Issue Date: 10/23/2006
Registrant (Individual): Craig A Wheeler, 37 Somerset St, Belmont, MA 02478
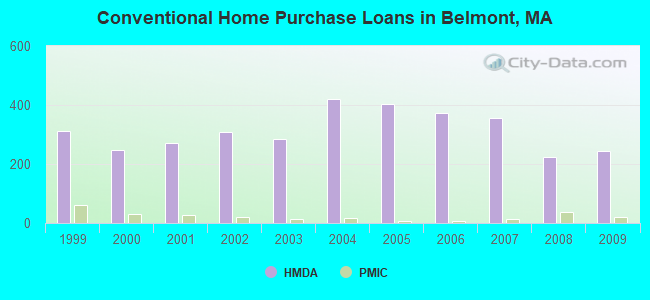
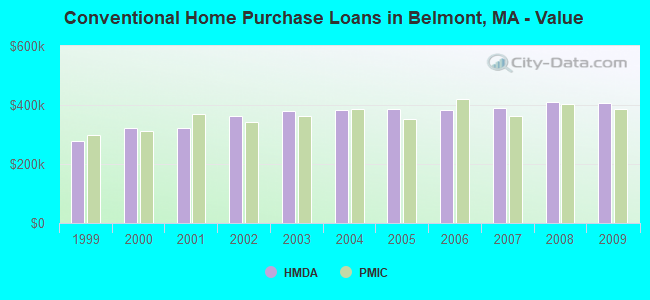
| Home Mortgage Disclosure Act Aggregated Statistics For Year 2009 (Based on 8 full tracts) | ||||||||||
| A) FHA, FSA/RHS & VA Home Purchase Loans | B) Conventional Home Purchase Loans | C) Refinancings | D) Home Improvement Loans | F) Non-occupant Loans on < 5 Family Dwellings (A B C & D) | ||||||
|---|---|---|---|---|---|---|---|---|---|---|
| Number | Average Value | Number | Average Value | Number | Average Value | Number | Average Value | Number | Average Value | |
| LOANS ORIGINATED | 11 | $439,455 | 245 | $406,351 | 1,015 | $342,768 | 32 | $310,250 | 48 | $386,667 |
| APPLICATIONS APPROVED, NOT ACCEPTED | 0 | $0 | 15 | $400,067 | 59 | $417,017 | 5 | $106,400 | 2 | $1,293,500 |
| APPLICATIONS DENIED | 2 | $415,000 | 20 | $400,000 | 119 | $359,706 | 6 | $229,667 | 6 | $233,500 |
| APPLICATIONS WITHDRAWN | 0 | $0 | 35 | $356,886 | 109 | $380,275 | 2 | $252,500 | 11 | $474,727 |
| FILES CLOSED FOR INCOMPLETENESS | 0 | $0 | 6 | $368,500 | 39 | $343,385 | 2 | $572,500 | 2 | $337,500 |
Detailed HMDA statistics for the following Tracts: 3571.00 , 3572.00, 3573.00, 3574.00, 3575.00, 3576.00, 3577.00, 3578.00
| Private Mortgage Insurance Companies Aggregated Statistics For Year 2009 (Based on 8 full tracts) | ||||
| A) Conventional Home Purchase Loans | B) Refinancings | |||
|---|---|---|---|---|
| Number | Average Value | Number | Average Value | |
| LOANS ORIGINATED | 20 | $384,800 | 8 | $333,875 |
| APPLICATIONS APPROVED, NOT ACCEPTED | 11 | $373,000 | 1 | $288,000 |
| APPLICATIONS DENIED | 4 | $345,500 | 1 | $292,000 |
| APPLICATIONS WITHDRAWN | 1 | $442,000 | 5 | $389,200 |
| FILES CLOSED FOR INCOMPLETENESS | 0 | $0 | 0 | $0 |
Detailed PMIC statistics for the following Tracts: 3571.00 , 3572.00, 3573.00, 3574.00, 3575.00, 3576.00, 3577.00, 3578.00
2002 - 2018 National Fire Incident Reporting System (NFIRS) incidents
- Fire incident types reported to NFIRS in Belmont, MA
- 1,85177.4%Structure Fires
- 42617.8%Outside Fires
- 873.6%Mobile Property/Vehicle Fires
- 261.1%Other
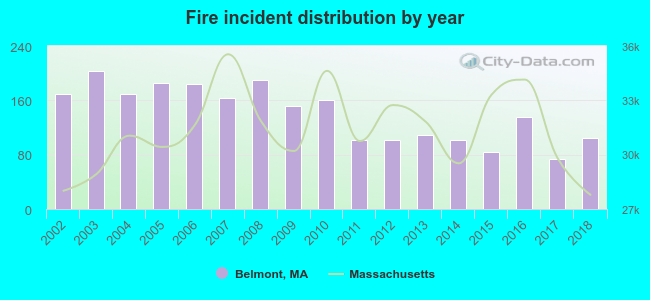 According to the data from the years 2002 - 2018 the average number of fire incidents per year is 141. The highest number of reported fire incidents - 203 took place in 2003, and the least - 74 in 2017. The data has a decreasing trend.
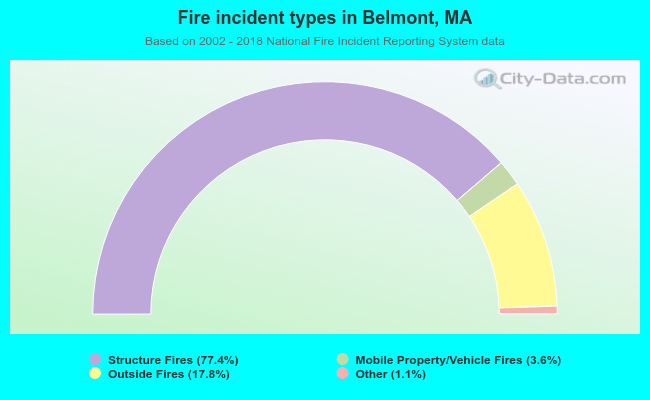 When looking into fire subcategories, the most incidents belonged to: Structure Fires (77.4%), and Outside Fires (17.8%).
| Most common first names in Belmont, MA among deceased individuals | ||
| Name | Count | Lived (average) |
|---|---|---|
| Mary | 453 | 81.4 years |
| John | 390 | 76.2 years |
| Joseph | 205 | 77.4 years |
| William | 188 | 75.8 years |
| Margaret | 172 | 83.6 years |
| James | 166 | 76.4 years |
| Helen | 154 | 82.5 years |
| Elizabeth | 132 | 83.7 years |
| Charles | 117 | 77.8 years |
| Alice | 116 | 83.0 years |
| Most common last names in Belmont, MA among deceased individuals | ||
| Last name | Count | Lived (average) |
|---|---|---|
| Sullivan | 66 | 77.4 years |
| Murphy | 46 | 80.1 years |
| Obrien | 45 | 77.8 years |
| Smith | 36 | 77.7 years |
| Brown | 32 | 78.5 years |
| Johnson | 28 | 79.9 years |
| White | 25 | 77.8 years |
| Shea | 24 | 80.7 years |
| Oconnor | 23 | 80.9 years |
| Mahoney | 23 | 79.5 years |
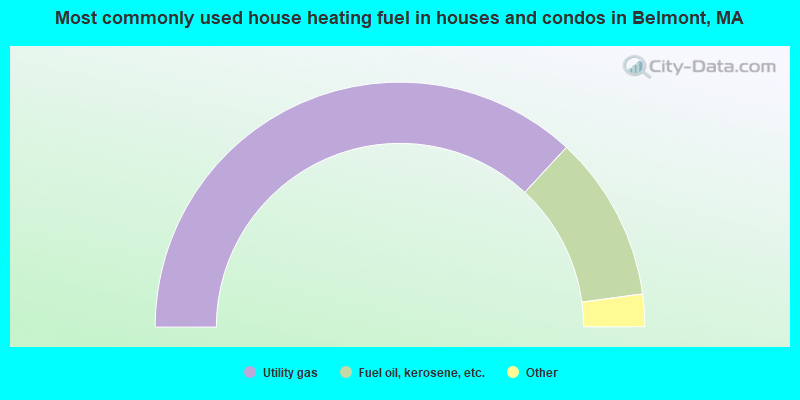
- 73.8%Utility gas
- 21.9%Fuel oil, kerosene, etc.
- 2.9%Electricity
- 0.6%Bottled, tank, or LP gas
- 0.4%Other fuel
- 0.2%Wood
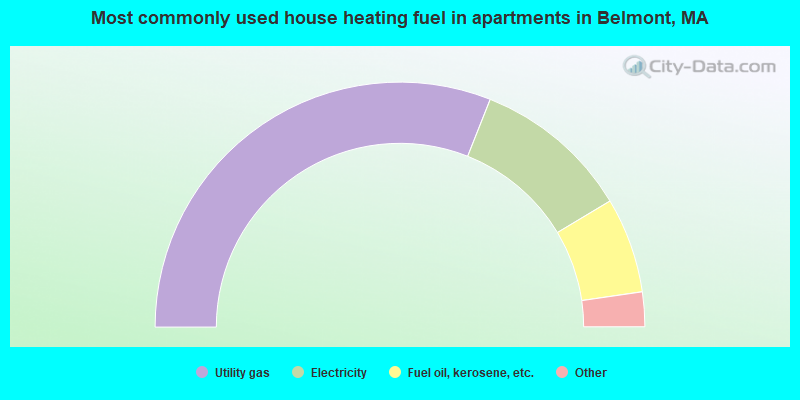
- 62.1%Utility gas
- 20.8%Electricity
- 12.6%Fuel oil, kerosene, etc.
- 3.9%Bottled, tank, or LP gas
- 0.4%Other fuel
- 0.3%No fuel used
Belmont compared to Massachusetts state average:
- Median household income above state average.
- Median house value above state average.
- Unemployed percentage significantly below state average.
- Black race population percentage significantly below state average.
- Hispanic race population percentage below state average.
- Foreign-born population percentage above state average.
- Length of stay since moving in above state average.
- House age above state average.
- Percentage of population with a bachelor's degree or higher significantly above state average.
Belmont on our top lists:
- #21 on the list of "Top 101 cities with the most people having Master's or Doctorate degrees (population 5,000+)"
- #34 on the list of "Top 101 cities with largest percentage of males in occupations: life, physical, and social science occupations (population 5,000+)"
- #36 on the list of "Top 101 cities with the most residents born in Armenia (population 500+)"
- #61 on the list of "Top 101 cities with largest percentage of females in occupations: life, physical, and social science occupations (population 5,000+)"
- #61 on the list of "Top 100 cities with oldest houses (pop. 5,000+)"
- #81 on the list of "Top 101 cities with the most people having Doctorate degrees (population 500+)"
- #84 on the list of "Top 101 cities with the most residents born in Greece (population 500+)"
- #96 on the list of "Top 100 best educated cities (highest percentage of bachelor degree holding residents) (pop. 5,000+)"
- #99 (02138) on the list of "Top 101 zip codes with the largest charity contributions deductions as a percentage of AGI in 2012 (pop 5,000+)"
- #4 on the list of "Top 101 counties with the most Orthodox adherents"
- #7 on the list of "Top 101 counties with the most Catholic adherents"
- #7 on the list of "Top 101 counties with the most Mainline Protestant congregations"
- #7 on the list of "Top 101 counties with the most Orthodox congregations"
- #8 on the list of "Top 101 counties with the lowest percentage of residents that keep firearms around their homes"

|
|
Total of 3610 patent applications in 2008-2024.