Estimated zip code population in 2022: 37,993 Zip code population in 2010: 36,314 Zip code population in 2000: 35,407
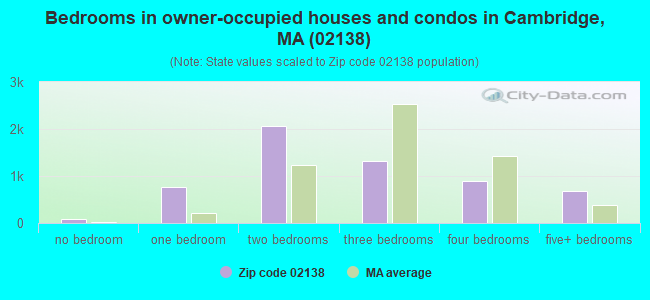
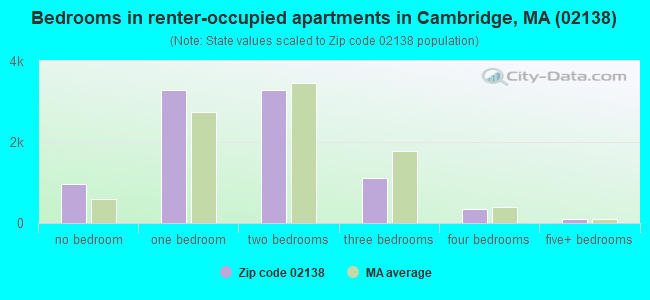
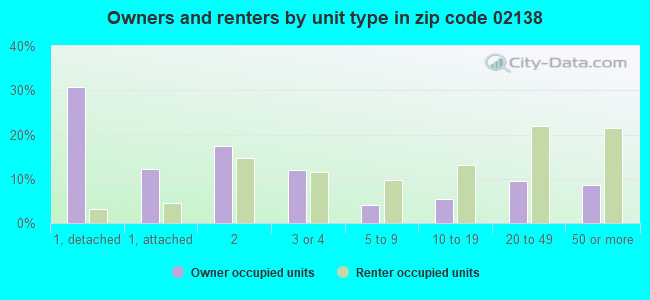
Houses and condos: 16,344 Renter-occupied apartments: 9,077
% of renters here:
61%
State:
38%
March 2022 cost of living index in zip code 02138: 142.8 (very high, U.S. average is 100)
Land area: 2.7 sq. mi. Water area: 0.3 sq. mi.
Population density: 13,864 people per square mile
(very high).
OSM Map
Google Map
MSN Map
OSM Map
General Map
Google Map
MSN Map
OSM Map
Google Map
MSN Map
OSM Map
Google Map
MSN Map
Please wait while loading the map...
Real estate property taxes paid for housing units in 2022:
This zip code:
0.5% ($5,714)
Massachusetts:
1.0% ($5,536)
Median real estate property taxes paid for housing units with mortgages in 2022: $5,697 (0.5%) Median real estate property taxes paid for housing units with no mortgage in 2022: $5,733 (0.5%)
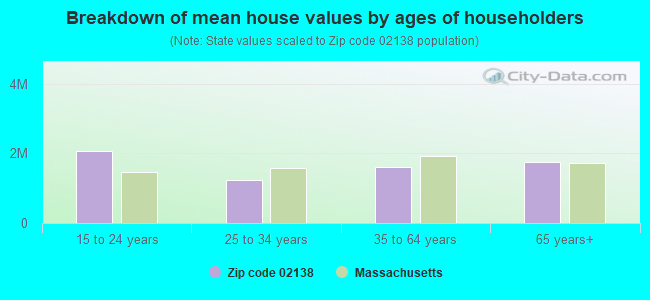
Estimated median house/condo value in 2022: $1,164,318
02138:
$1,164,318
Massachusetts:
$534,700
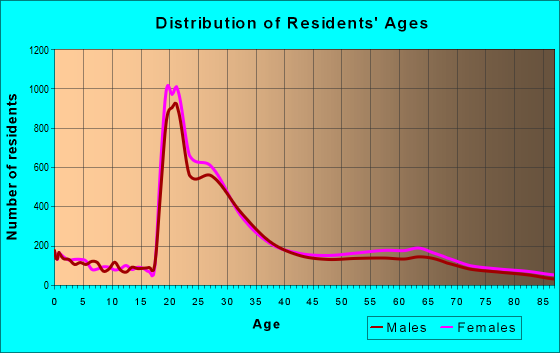
Median resident age:
This zip code:
29.6 years
Massachusetts median age:
40.3 years
Average household size:
This zip code:
2.0 people
Massachusetts:
2.4 people
Averages for the 2020 tax year for zip code 02138, filed in 2021:
Average Adjusted Gross Income (AGI) in 2020: $253,427 (Individual Income Tax Returns)
Here:
$253,427
State:
$105,130
Salary/wage: $127,950 (reported on 80.3% of returns)
Here:
$127,950
State:
$82,951
(% of AGI for various income ranges: 1283.4% for AGIs below $25k, 4076.4% for AGIs $25k-50k, 7069.4% for AGIs $50k-75k, 10787.8% for AGIs $75k-100k, 20681.6% for AGIs $100k-200k, 143585.5% for AGIs over 200k)
Taxable interest for individuals: $10,924 (reported on 53.9% of returns)
This zip code:
$10,924
Massachusetts:
$2,361
(% of AGI for various income ranges: 34.3% for AGIs below $25k, 42.5% for AGIs $25k-50k, 59.0% for AGIs $50k-75k, 93.3% for AGIs $75k-100k, 249.5% for AGIs $100k-200k, 12342.7% for AGIs over 200k)
Ordinary dividends: $32,400 (reported on 47.6% of returns)
Here:
$32,400
State:
$10,365
(% of AGI for various income ranges: 111.0% for AGIs below $25k, 148.4% for AGIs $25k-50k, 291.8% for AGIs $50k-75k, 491.2% for AGIs $75k-100k, 1378.9% for AGIs $100k-200k, 30009.7% for AGIs over 200k)
Net capital gain/loss in AGI: +$194,220 (reported on 44.1% of returns)
Here:
+$194,220
State:
+$48,178
(% of AGI for various income ranges: 69.1% for AGIs below $25k, 152.3% for AGIs $25k-50k, 285.9% for AGIs $50k-75k, 485.4% for AGIs $75k-100k, 1422.1% for AGIs $100k-200k, 188988.2% for AGIs over 200k)
Profit/loss from business: +$42,964 (reported on 21.7% of returns)
Here:
+$42,964
State:
+$20,792
(% of AGI for various income ranges: 155.1% for AGIs below $25k, 208.1% for AGIs $25k-50k, 337.6% for AGIs $50k-75k, 457.0% for AGIs $75k-100k, 1121.4% for AGIs $100k-200k, 16395.6% for AGIs over 200k)
Taxable individual retirement arrangement distribution: $44,106 (reported on 10.3% of returns)
02138:
$44,106
Massachusetts:
$22,790
(% of AGI for various income ranges: 45.5% for AGIs below $25k, 83.1% for AGIs $25k-50k, 142.8% for AGIs $50k-75k, 363.1% for AGIs $75k-100k, 907.3% for AGIs $100k-200k, 7224.4% for AGIs over 200k)
Self-employed (Keogh) retirement plans: $33,313 (reported on 3.2% of returns)
02138:
$33,313
Massachusetts:
$26,868
(% of AGI for various income ranges: 39.5% for AGIs $50k-75k, 114.5% for AGIs $100k-200k, 2086.6% for AGIs over 200k)
Total itemized deductions: $90,857 (reported on 18.7% of returns)
Here:
$90,857
State:
$36,722
(% of AGI for various income ranges: 107.4% for AGIs below $25k, 143.3% for AGIs $25k-50k, 325.5% for AGIs $50k-75k, 474.4% for AGIs $75k-100k, 1506.4% for AGIs $100k-200k, 33292.4% for AGIs over 200k)
Charity contributions: $65,603 (reported on 16.3% of returns)
Here:
$65,603
State:
$12,529
(% of AGI for various income ranges: 5.5% for AGIs below $25k, 16.7% for AGIs $25k-50k, 62.5% for AGIs $50k-75k, 96.6% for AGIs $75k-100k, 347.5% for AGIs $100k-200k, 23160.6% for AGIs over 200k)
Taxes paid: $9,112 (reported on 18.7% of returns)
02138:
$9,112
State:
$8,782
(% of AGI for various income ranges: 15.1% for AGIs below $25k, 28.6% for AGIs $25k-50k, 72.6% for AGIs $50k-75k, 121.7% for AGIs $75k-100k, 422.0% for AGIs $100k-200k, 2509.0% for AGIs over 200k)
Earned income credit: $1,172 (reported on 5.3% of returns)
Here:
$1,172
State:
$1,909
(% of AGI for various income ranges: 33.2% for AGIs below $25k, 20.7% for AGIs $25k-50k)
Percentage of individuals using paid preparers for their 2020 taxes: 92.8%
Here:
93%
State:
92%
(% for various income ranges: 89.7% for AGIs below $25k, 92.6% for AGIs $25k-50k, 93.8% for AGIs $50k-75k, 93.2% for AGIs $75k-100k, 93.1% for AGIs $100k-200k, 94.7% for AGIs over 200k)
Averages for the 2012 tax year for zip code 02138, filed in 2013:
Average Adjusted Gross Income (AGI) in 2012: $183,894 (Individual Income Tax Returns)
Here:
$183,894
State:
$81,425
Salary/wage: $92,293 (reported on 81.6% of returns)
Here:
$92,293
State:
$64,752
(% of AGI for various income ranges: 75.3% for AGIs below $25k, 81.7% for AGIs $25k-50k, 78.2% for AGIs $50k-75k, 74.0% for AGIs $75k-100k, 69.6% for AGIs $100k-200k, 28.7% for AGIs over 200k)
Taxable interest for individuals: $7,291 (reported on 54.5% of returns)
This zip code:
$7,291
Massachusetts:
$2,136
(% of AGI for various income ranges: 1.7% for AGIs below $25k, 0.9% for AGIs $25k-50k, 0.8% for AGIs $50k-75k, 1.2% for AGIs $75k-100k, 1.2% for AGIs $100k-200k, 2.6% for AGIs over 200k)
Ordinary dividends: $32,883 (reported on 42.9% of returns)
Here:
$32,883
State:
$9,473
(% of AGI for various income ranges: 6.2% for AGIs below $25k, 2.8% for AGIs $25k-50k, 3.8% for AGIs $50k-75k, 3.7% for AGIs $75k-100k, 5.0% for AGIs $100k-200k, 8.9% for AGIs over 200k)
Net capital gain/loss in AGI: +$121,793 (reported on 36.7% of returns)
Here:
+$121,793
State:
+$31,437
(% of AGI for various income ranges: 1.2% for AGIs below $25k, 1.2% for AGIs $25k-50k, 1.2% for AGIs $50k-75k, 1.7% for AGIs $75k-100k, 3.8% for AGIs $100k-200k, 32.4% for AGIs over 200k)
Profit/loss from business: +$35,266 (reported on 22.3% of returns)
Here:
+$35,266
State:
+$20,662
(% of AGI for various income ranges: 9.3% for AGIs below $25k, 4.6% for AGIs $25k-50k, 3.8% for AGIs $50k-75k, 4.8% for AGIs $75k-100k, 5.5% for AGIs $100k-200k, 4.0% for AGIs over 200k)
Taxable individual retirement arrangement distribution: $56,229 (reported on 11.5% of returns)
02138:
$56,229
Massachusetts:
$18,892
(% of AGI for various income ranges: 2.3% for AGIs below $25k, 1.6% for AGIs $25k-50k, 2.2% for AGIs $50k-75k, 2.9% for AGIs $75k-100k, 3.6% for AGIs $100k-200k, 3.8% for AGIs over 200k)
Self-employment retirement plans: $27,165 (reported on 3.4% of returns)
02138:
$27,165
Massachusetts:
$20,669
(% of AGI for various income ranges: 0.2% for AGIs $25k-50k, 0.2% for AGIs $50k-75k, 0.3% for AGIs $75k-100k, 0.6% for AGIs $100k-200k, 0.5% for AGIs over 200k)
Total itemized deductions: $68,007 (17% of AGI, reported on 38.5% of returns)
Here:
$68,007
State:
$28,907
Here:
16.7% of AGI
State:
18.2% of AGI
(% of AGI for various income ranges: 11.8% for AGIs below $25k, 6.5% for AGIs $25k-50k, 9.1% for AGIs $50k-75k, 10.9% for AGIs $75k-100k, 14.5% for AGIs $100k-200k, 15.3% for AGIs over 200k)
Charity contributions: $26,054 (reported on 33.0% of returns)
Here:
$26,054
State:
$4,208
(% of AGI for various income ranges: 0.7% for AGIs below $25k, 0.5% for AGIs $25k-50k, 1.0% for AGIs $50k-75k, 1.2% for AGIs $75k-100k, 1.9% for AGIs $100k-200k, 5.9% for AGIs over 200k)
Taxes paid: $27,853 (reported on 38.3% of returns)
02138:
$27,853
State:
$13,303
(% of AGI for various income ranges: 2.4% for AGIs below $25k, 1.5% for AGIs $25k-50k, 2.9% for AGIs $50k-75k, 4.2% for AGIs $75k-100k, 6.2% for AGIs $100k-200k, 6.4% for AGIs over 200k)
Earned income credit: $1,161 (reported on 5.9% of returns)
Here:
$1,161
State:
$1,971
(% of AGI for various income ranges: 1.9% for AGIs below $25k, 0.2% for AGIs $25k-50k)
Percentage of individuals using paid preparers for their 2012 taxes: 47.8%
Here:
48%
State:
56%
(% for various income ranges: 40.6% for AGIs below $25k, 33.2% for AGIs $25k-50k, 40.5% for AGIs $50k-75k, 50.0% for AGIs $75k-100k, 57.8% for AGIs $100k-200k, 78.1% for AGIs over 200k)
Averages for the 2004 tax year for zip code 02138, filed in 2005:
Average Adjusted Gross Income (AGI) in 2004: $108,010 (Individual Income Tax Returns)
Here:
$108,010
State:
$62,877
Salary/wage: $63,770 (reported on 78.8% of returns)
Here:
$63,770
State:
$52,969
(% of AGI for various income ranges: 371.2% for AGIs below $10k, 73.0% for AGIs $10k-25k, 82.2% for AGIs $25k-50k, 78.1% for AGIs $50k-75k, 74.8% for AGIs $75k-100k, 36.0% for AGIs over 100k)
Taxable interest for individuals: $6,030 (reported on 59.1% of returns)
This zip code:
$6,030
Massachusetts:
$1,945
(% of AGI for various income ranges: 29.7% for AGIs below $10k, 3.0% for AGIs $10k-25k, 1.7% for AGIs $25k-50k, 2.0% for AGIs $50k-75k, 2.4% for AGIs $75k-100k, 3.6% for AGIs over 100k)
Taxable dividends: $15,469 (reported on 42.4% of returns)
Here:
$15,469
State:
$5,323
(% of AGI for various income ranges: 56.0% for AGIs below $10k, 4.3% for AGIs $10k-25k, 2.5% for AGIs $25k-50k, 3.0% for AGIs $50k-75k, 3.6% for AGIs $75k-100k, 6.9% for AGIs over 100k)
Net capital gain/loss: +$63,841 (reported on 36.0% of returns)
Here:
+$63,841
State:
+$20,377
(% of AGI for various income ranges: 18.0% for AGIs below $10k, 1.7% for AGIs $10k-25k, 1.2% for AGIs $25k-50k, 1.8% for AGIs $50k-75k, 2.7% for AGIs $75k-100k, 27.3% for AGIs over 100k)
Profit/loss from business: +$28,113 (reported on 20.3% of returns)
Here:
+$28,113
State:
+$17,837
(% of AGI for various income ranges: 16.7% for AGIs below $10k, 5.7% for AGIs $10k-25k, 4.7% for AGIs $25k-50k, 4.8% for AGIs $50k-75k, 5.5% for AGIs $75k-100k, 5.3% for AGIs over 100k)
IRA payment deduction: $2,942 (reported on 2.7% of returns)
02138:
$2,942
Massachusetts:
$3,100
(% of AGI for various income ranges: 2.2% for AGIs below $10k, 0.3% for AGIs $10k-25k, 0.3% for AGIs $25k-50k, 0.2% for AGIs $50k-75k, 0.1% for AGIs $75k-100k, 0.0% for AGIs over 100k)
Self-employed pension: $17,857 (reported on 3.7% of returns)
Here:
$17,857
Massachusetts:
$14,516
(% of AGI for various income ranges: 0.2% for AGIs $10k-25k, 0.3% for AGIs $25k-50k, 0.4% for AGIs $50k-75k, 0.6% for AGIs $75k-100k, 0.7% for AGIs over 100k)
Total itemized deductions: $37,078 (16% of AGI, reported on 39.4% of returns)
Here:
$37,078
State:
$22,573
Here:
16.3% of AGI
State:
19.5% of AGI
(% of AGI for various income ranges: 104.0% for AGIs below $10k, 13.1% for AGIs $10k-25k, 8.2% for AGIs $25k-50k, 12.1% for AGIs $50k-75k, 13.8% for AGIs $75k-100k, 14.0% for AGIs over 100k)
Charity contributions deductions: $13,607 (5% of AGI, reported on 32.0% of returns)
Here:
$13,607
State:
$3,295
Here:
5.3% of AGI
State:
2.7% of AGI
(% of AGI for various income ranges: 3.6% for AGIs below $10k, 1.1% for AGIs $10k-25k, 0.9% for AGIs $25k-50k, 1.5% for AGIs $50k-75k, 1.7% for AGIs $75k-100k, 4.9% for AGIs over 100k)
Total tax: $24,666 (reported on 81.6% of returns)
02138:
$24,666
State:
$11,494
(% of AGI for various income ranges: 16.6% for AGIs below $10k, 5.8% for AGIs $10k-25k, 9.6% for AGIs $25k-50k, 12.8% for AGIs $50k-75k, 14.2% for AGIs $75k-100k, 20.9% for AGIs over 100k)
Earned income credit: $853 (reported on 4.7% of returns)
Here:
$853
State:
$1,518
Percentage of individuals using paid preparers for their 2004 taxes: 46.9%
Here:
47%
State:
58%
(% for various income ranges: 34.3% for AGIs below $10k, 37.8% for AGIs $10k-25k, 40.5% for AGIs $25k-50k, 49.3% for AGIs $50k-75k, 54.1% for AGIs $75k-100k, 70.8% for AGIs over 100k)
Likely homosexual households (counted as self-reported same-sex unmarried-partner households)
Lesbian couples: 0.4% of all households
Gay men: 0.1% of all households
Household received Food Stamps/SNAP in the past 12 months: 447 Household did not receive Food Stamps/SNAP in the past 12 months: 13,991
Women who had a birth in the past 12 months: 188 (191 now married, 5 unmarried) Women who did not have a birth in the past 12 months: 12,722 (3,285 now married, 9,523 unmarried)
Housing units in zip code 02138 with a mortgage: 2,860 (461 second mortgage, 6 home equity loan, 310 both second mortgage and home equity loan) Houses without a mortgage: 105
Median monthly owner costs for units with a mortgage: $3,373 Median monthly owner costs for units without a mortgage: $1,173
Residents with income below the poverty level in 2022:
This zip code:
12.7%
Whole state:
10.4%
Residents with income below 50% of the poverty level in 2022:
This zip code:
5.1%
Whole state:
5.1%
Median number of rooms in houses and condos:
Here:
6.0
State:
6.5
Median number of rooms in apartments:
Here:
3.6
State:
4.0
Notable locations in this zip code not listed on our city pages
Notable locations in zip code 02138: Harvard Observatory (A), Fresh Pond Municipal Golf Course (B), Fresh Pond Golf Course (C), Agassiz Community Center (D), Aggasiz House (E), Aiken Building (F), American Academy of Arts and Sciences (G), Ames Building (H), Andover Building (I), Andover-Harvard Theological Library (J), Arthur and Elizabeth Schlesinger Library on the History of Women in America (K), Arthur M Sackler Museum (L), Austin Hall (M), Bakalar Library (N), Baker Alumni Center (O), Belfer Building (P), Blue Hill Meteorlogical Observatory Library (Q), Brattle Hall (R), Brattle Theatre (S), Buckingham Building (T). Display/hide their locations on the map
Shopping Centers: Fresh Pond Shopping Center (1), Fresh Pond Mall Shopping Center (2), The Atrium Shopping Center (3). Display/hide their locations on the map
Churches in zip code 02138 include: Transcendental Meditation Center (A), Saint Pauls Catholic Church (B), Old Cambridge Baptist Church (C), Mormon Center (D), Memorial Church (E), Holy Trinity Armenian Church (F), Harvard Epworth United Methodist Church (G), First Unitarian Church (H), First Congregational Church (I). Display/hide their locations on the map
Parks in zip code 02138 include: John Bridge Statue (1), John F Kennedy Park (2), John Harvard Statue (3), Law School Yard (4), Library Park (5), Lusitania Field (6), Mayor Danehy Park (7), McNamee Square (8), New Yard (9). Display/hide their locations on the map
Tourist attractions (not listed on the city page) : Cambridge Office for Tourism - Visitor Information (Harvard Square), Cambridge Carnival INT Inc (144 Mount Auburn Street).
3,893 married couples with children.
466 single-parent households (123 men, 343 women).
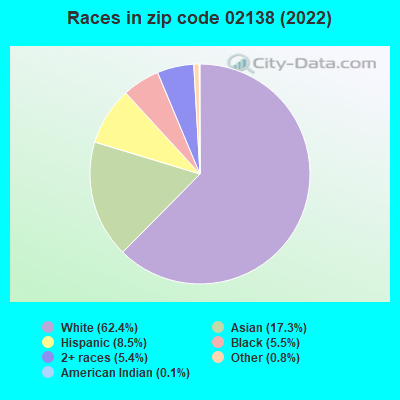
68.7% of residents of 02138 zip code speak English at home.
5.9% of residents speak Spanish at home (88% very well, 7% well, 3% not well, 1% not at all).
10.8% of residents speak other Indo-European language at home (88% very well, 11% well, 1% not well).
10.9% of residents speak Asian or Pacific Island language at home (80% very well, 17% well, 3% not well).
3.7% of residents speak other language at home (79% very well, 15% well, 6% not well).
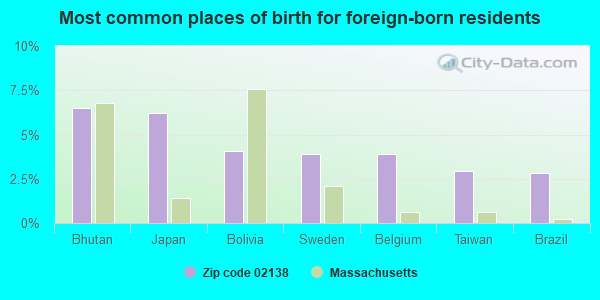
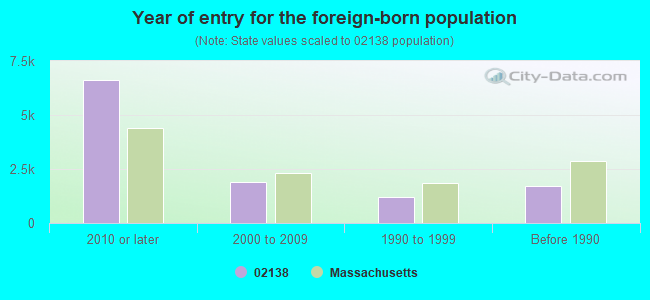
Foreign born population: 9,967 (26.2%) (34.9% of them are naturalized citizens)
Major facilities with environmental interests located in this zip code:
CAMBRIDGE RINDGE & LATIN HIGH SCHOOL (459 BROADWAY in CAMBRIDGE, MA)
AIR MINOR (AIRS/AFS) (National Center for Education Statistics) - STATE ID-049506 Business SIC classification: NEWSPAPERS: PUBLISHING, OR PUBLISHING AND PRINTING Alternative names: CAMB RINDGE AND LATIN, CAMBRIDGE RIDGE_& LANE
E INK CORPORATION (733 CONCORD AVENUE in CAMBRIDGE, MA)
AIR SYNTHETIC MINOR (AIRS/AFS) HAZARDOUS WASTE BIENNIAL REPORTER (Resource Conservation and Recovery Act (tracking hazardous waste)) Large Quantity Generators, more that 1000 kg of hazardous waste/month (Resource Conservation and Recovery Act (tracking hazardous waste)) - notification TRI REPORTER (Tracking of toxic chemicals releasing facilities) Business SIC classification: PRINTING INK Business NAICS classification: CARBON AND GRAPHITE PRODUCT MANUFACTURING. Organizations: KEN TITLEBAUM (CONTACT/OPERATOR)
MARIA L. BALDWIN (28 SACRAMENTO STREET in CAMBRIDGE, MA)
(National Center for Education Statistics) - STATE ID-049005 Organizations: CAMBRIDGE (SCHOOL DISTRICT)
YOUVILLE HOSPITAL (1575 CAMBRIDGE ST in CAMBRIDGE, MA)
AIR MINOR (AIRS/AFS) CRITERIA AND HAZARDOUS AIR POLLUTANT INVENTORY (Inventory of air pollution sources) Small Quantity Generators, between 100 kg and 1000 kg of hazardous waste/month (Resource Conservation and Recovery Act (tracking hazardous waste)) - notification Business SIC classification: GENERAL MEDICAL AND SURGICAL HOSPITALS
JOHN M TOBIN (197 VASSAL LANE in CAMBRIDGE, MA)
(National Center for Education Statistics) - STATE ID-049065 Organizations: CAMBRIDGE (SCHOOL DISTRICT)
ECKEL INDUSTRIES INC (155 FAWCETT STREET in CAMBRIDGE, MA)
AIR MINOR (AIRS/AFS) CRITERIA AND HAZARDOUS AIR POLLUTANT INVENTORY (Inventory of air pollution sources) (Resource Conservation and Recovery Act (tracking hazardous waste)) TRI REPORTER (Tracking of toxic chemicals releasing facilities) Business SIC classification: FABRICATED STRUCTURAL METAL
CAMBRIDGE PUBLIC LIBRARY (MAIN LIB. ADDITIONS & RENOV. in CAMBRIDGE, MA)
National Pollutant Discharge Elimination System NON-MAJOR (Tracking pollutant discharge elimination systems) - permit Organizations: CITY OF CAMBRIDGE (CONTACT/OPERATOR)
Alternative names: CITY OF CAMBRIDGE
CAMBRIDGE W P P (FRESH POND RESERVOIR in CAMBRIDGE, MA)
National Pollutant Discharge Elimination System NON-MAJOR (Tracking pollutant discharge elimination systems) - permit Business SIC classification: WATER SUPPLY Organizations: CAMBRIDGE WATER DEPT. (CONTACT/OPERATOR)
, CAMBRIDGE WATER DEPARTMENT (CONTACT/OWNER)
Alternative names: CAMBRIDGE WATER DEPARTMENT, CAMBRIDGE WATER PURIFICATION
MOONEY ST AUTO CLINIC (51 MOONEY ST in CAMBRIDGE, MA)
(Resource Conservation and Recovery Act (tracking hazardous waste)) Organizations: CHARLES J MABARDY (CONTACT/OWNER)
WYETH RESEARCH (735 CONCORD AVE in CAMBRIDGE, MA)
Small Quantity Generators, between 100 kg and 1000 kg of hazardous waste/month (Resource Conservation and Recovery Act (tracking hazardous waste)) - notification Business NAICS classification: PHARMACEUTICAL PREPARATION MANUFACTURING. Organizations: BU: GENETICS INSTITUTE INC (CONTACT/OWNER)
, PR: INDUSTRIAL & COMMERCIAL DEVELOPMENT (CONTACT/OWNER)
, WYETH PHARMACEUTICALS (CONTACT/OWNER)
Alternative names: GENETICS INSTITUTE INC, GENETICS INSTITUTE LLC
OMNIGENE BIOPRODUCTS INC (763D CONCORD AVE in CAMBRIDGE, MA)
(Resource Conservation and Recovery Act (tracking hazardous waste)) Organizations: THIRD SPINELLI WAY TRUST (CONTACT/OWNER)
Alternative names: OMNIGENE INC
MATRITECH INC (763 CONCORD AVE in CAMBRIDGE, MA)
(Resource Conservation and Recovery Act (tracking hazardous waste))
CAMBRIDGE CEMETERY (76 COOLIDGE AVE in CAMBRIDGE, MA)
(Resource Conservation and Recovery Act (tracking hazardous waste)) Organizations: CITY OF CAMBRIDGE (CONTACT/OWNER)
Housing units lacking complete plumbing facilities: 0.4% Housing units lacking complete kitchen facilities: 1.3%
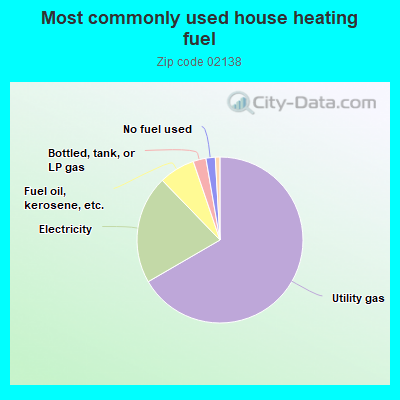
66.5%Utility gas
21.1%Electricity
7.0%Fuel oil, kerosene, etc.
2.5%Bottled, tank, or LP gas
1.8%No fuel used
0.9%Other fuel
Population in 1990: 33,841. Population change in the 1990s: +1,566 (+4.6%).
Place of birth for U.S.-born residents:
This state: 11,220
Northeast: 6,750
Midwest: 2,687
South: 3,955
West: 2,923
37% of the 02138 zip code residents lived in the same house 5 years ago. Out of people who lived in different houses, 27% lived in this county. Out of people who lived in different counties, 50% lived in Massachusetts.
78% of the 02138 zip code residents lived in the same house 1 year ago. Out of people who lived in different houses, 38% moved from this county. Out of people who lived in different houses, 12% moved from different county within same state. Out of people who lived in different houses, 31% moved from different state. Out of people who lived in different houses, 22% moved from abroad.
Private vs. public school enrollment:
Students in private schools in grades 1 to 8 (elementary and middle school): 752
Here:
38.3%
Massachusetts:
10.3%
Students in private schools in grades 9 to 12 (high school): 354
Here:
37.2%
Massachusetts:
12.3%
Students in private undergraduate colleges: 7,441
Here:
86.0%
Massachusetts:
51.2%
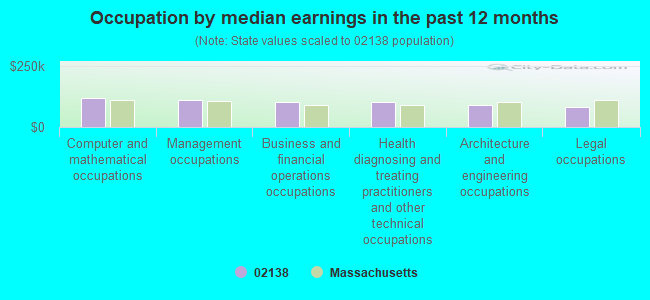
Occupation by median earnings in the past 12 months ($)
120,585Computer and mathematical occupations
109,540Management occupations
104,465Business and financial operations occupations
100,853Health diagnosing and treating practitioners and other technical occupations
91,184Architecture and engineering occupations
84,254Legal occupations
Companies with biggest federal contracts located in this zip code (CAMBRIDGE, MA):
CHARLES RIVER ANALYTICS INC (625 MOUNT AUBURN STREET; small business) : $50,040,771 in 281 contractsfrom 1999 to 2006
Contracts for Other Research and Development -- Management and Support (R&D), Other Defense -- Management and Support (R&D), Defense Missile and Space Systems -- Advanced Development (R&D), Other Defense -- Applied Research and Exploratory Development (R&D), and moreby Air Force, Army, Navy, NASA, and others Signed by year:2000: $3,857,999; 2001: $5,918,009; 2002: $5,456,446; 2003: $6,597,622; 2004: $9,029,186; 2005: $10,793,894; 2006: $7,548,939.
Biggest contracts:
$998,823 with Air Force for Other Research and Development -- Management and Support (R&D). Signed on 2005-09-27. Completion date: 2007-01-09.
$749,978 with Army for Other Defense -- Management and Support (R&D). Signed on 2001-12-10. Completion date: 2003-12-09.
$749,742 with Army for Defense Missile and Space Systems -- Advanced Development (R&D). Signed on 2005-05-25. Completion date: 2007-05-25.
$749,226 with Air Force for Other Defense -- Applied Research and Exploratory Development (R&D). Signed on 2005-05-25. Completion date: 2007-05-19.
MAK TECHNOLOGIES INC (10 FAWCETT STREET; small business) : $24,685,301 in 142 contractsfrom 1999 to 2006
Contracts for Services -- Applied Research and Exploratory Development (R&D), Other Defense -- Applied Research and Exploratory Development (R&D), ADP Software, Defense Electronics and Communication Equipment -- Basic Research (R&D), and moreby Navy, Army, Air Force, U.S. Army Corps of Engineers - civil program financing only, and others Signed by year:2000: $4,421,924; 2001: $2,194,319; 2002: $1,556,800; 2003: $2,641,702; 2004: $2,821,011; 2005: $2,755,728; 2006: $625,166.
Biggest contracts:
$7,111,075 with Navy for Services -- Applied Research and Exploratory Development (R&D). Signed on 1999-12-03. Completion date: 2000-11-30.
$874,500, same as above.Signed on 2000-03-21. Completion date: 2001-03-31.
$829,937 with Navy for Other Defense -- Applied Research and Exploratory Development (R&D). Signed on 2003-03-31. Completion date: 2003-11-01.
$762,223 with Navy for Services -- Applied Research and Exploratory Development (R&D). Signed on 2000-12-14. Completion date: 2001-12-31.
ICOSYSTEM CORPORATION (10 FAWCETT ST; small business) : $1,941,494 in 19 contractsfrom 2002 to 2006
Contracts for Other Defense -- Basic Research (R&D), Other Defense -- Operational Systems Development (R&D), R&D-SVCS-COMERCLIZ, Other Defense -- Management and Support (R&D), and moreby Navy, Air Force, Office of Policy, Management and Budget/Chief Financial Officer Signed by year:2000: $0; 2001: $0; 2002: $169,276; 2003: $197,209; 2004: $693,828; 2005: $714,848; 2006: $166,333.
Biggest contracts:
$349,886 with Navy for Other Defense -- Basic Research (R&D). Signed on 2004-11-22. Completion date: 2005-10-31.
$343,187 with Navy for Other Defense -- Operational Systems Development (R&D). Signed on 2005-11-18. Completion date: 2006-10-20.
$160,000, same as above.Signed on 2005-04-13. Completion date: 2006-10-20.
$133,455, same as above.Signed on 2006-05-30. Completion date: 2006-10-20.
BEACON INTERACTIVE SYSTEMS (30 SPINELLI PL; small business) : $1,855,785 in 11 contractsfrom 2002 to 2006
Contracts for Other Research and Development -- Applied Research and Exploratory Development (R&D), Other Defense -- Management and Support (R&D), Other Defense -- Basic Research (R&D), Other Research and Development -- Basic Research (R&D) by Navy Signed by year:2000: $0; 2001: $0; 2002: $68,566; 2003: $1,328,005; 2004: $0; 2005: $289,942; 2006: $169,272.
Biggest contracts:
$600,000 with Navy for Other Research and Development -- Applied Research and Exploratory Development (R&D). Signed on 2003-10-24. Completion date: 2004-10-23.
$599,664, same as above.Signed on 2003-07-20. Completion date: 2004-01-18.
$149,976, same as above.Signed on 2005-11-14. Completion date: 2005-05-01.
$99,996 with Navy for Other Defense -- Management and Support (R&D). Signed on 2003-07-02. Completion date: 2003-12-01.
CAMBRIDGE COLLABORATIVE, INC (689 CONCORD AVE; small business) : $1,813,385 in 8 contractsfrom 1999 to 2005
Contracts for Defense Missile and Space Systems -- Management and Support (R&D), Defense Ships -- Basic Research (R&D), Other Defense -- Operational Systems Development (R&D), ADP Components by Air Force, Navy Signed by year:2000: $670,063; 2001: $216,954; 2002: $693,825; 2003: $0; 2004: $69,982; 2005: $20,000; 2006: $0.
Biggest contracts:
$575,000 with Air Force for Defense Missile and Space Systems -- Management and Support (R&D). Signed on 2000-12-12. Completion date: 2003-03-19.
$350,000, same as above.Signed on 2002-01-07. Completion date: 2003-03-19.
$343,825, same as above.Signed on 2002-02-20. Completion date: 2003-03-19.
$216,954, same as above.Signed on 2001-03-15. Completion date: 2003-03-19.
XANALOG CORPORATION (30 SPINELLI PL; small business) : $1,765,065 in 5 contractsfrom 2002 to 2004
Contracts for Aircraft Maintenance and Repair Shop Specialized Equipment, Electrical and Electronic Properties Measuring and Testing Instruments, Physical Properties Testing and Inspection, Electrical and Electronic assemblies, Boards, Cards, and Associated Hardware, and moreby Navy Signed by year:2000: $0; 2001: $0; 2002: $877,025; 2003: $251,000; 2004: $637,040; 2005: $0; 2006: $0.
Biggest contracts:
$823,500 with Navy for Aircraft Maintenance and Repair Shop Specialized Equipment. Signed on 2002-05-13. Completion date: 2003-02-08.
$635,140 with Navy for Electrical and Electronic Properties Measuring and Testing Instruments. Signed on 2004-10-05. Completion date: 2006-03-06.
$251,000 with Navy for Physical Properties Testing and Inspection. Signed on 2003-10-08. Completion date: 2004-04-22.
$53,525 with Navy for Electrical and Electronic assemblies, Boards, Cards, and Associated Hardware. Signed on 2002-12-31. Completion date: 2003-03-28.
ANNISTECH (12 ELIOT ST; small business) : $1,757,338 in 8 contractsfrom 1999 to 2001
Contracts for Other Research and Development -- Basic Research (R&D) by Navy Signed by year:2000: $839,243; 2001: $843,095; 2002: $0; 2003: $0; 2004: $0; 2005: $0; 2006: $0.
Biggest contracts:
$470,757 with Navy for Other Research and Development -- Basic Research (R&D). Signed on 2001-06-14. Completion date: 2001-11-30.
$400,000, same as above.Signed on 2000-08-31. Completion date: 2001-05-04.
$389,243, same as above.Signed on 2000-12-19. Completion date: 2001-05-22.
$252,191, same as above.Signed on 2001-10-18. Completion date: 2001-11-30.
LIVEDATA, INC (1030 MASSACHUSETTS AVE STE; small business) : $1,614,200 in 11 contractsfrom 2002 to 2006
Contracts for Other Medical -- Basic Research (R&D), ADP Software, , Maintenance, Repair and Rebuilding of Equipment -- Automatic Data Processing Equipment (Including Firmware), Software, Supplies and Support Equipment by Army, ENERGY, Department of, Bureau of Reclamation Signed by year:2000: $0; 2001: $0; 2002: $202,000; 2003: $69,837; 2004: $594,847; 2005: $744,816; 2006: $2,700.
Biggest contracts:
$700,916 with Army for Other Medical -- Basic Research (R&D). Signed on 2005-12-21. Completion date: 2004-07-10.
$528,647, same as above.Signed on 2004-10-27. Completion date: 2004-07-10.
$202,000 with ENERGY, Department of for ADP Software. Signed on 2002-08-15. Completion date: 2003-08-15.
$69,837 with Army for Other Medical -- Basic Research (R&D). Signed on 2003-12-08. Completion date: 2004-07-10.
BBN CORPORATION (10 MOULTON STREET) : $699,504 in 2 contractsfrom 2000 to 2001
$585,000 with Army for Other Research and Development -- Applied Research and Exploratory Development (R&D). Signed on 2000-05-16. Completion date: 2001-03-31.
$114,504, same as above.Signed on 2001-03-06. Completion date: 2001-03-31.
HARVARD COLLEGE, PRESIDENT & F (1350 MASS AVE) : $631,655 in 4 contractsfrom 2000 to 2001
$189,436 with Army for Other Medical -- Applied Research and Exploratory Development (R&D). Signed on 2001-12-13. Completion date: 2004-11-14.
$184,265 with Army for Other Medical -- Advanced Development (R&D). Signed on 2000-10-20. Completion date: 2004-11-14.
$182,219 with Army for Other Medical -- Applied Research and Exploratory Development (R&D). Signed on 2000-02-16. Completion date: 2004-11-14.
$75,735, same as above.Signed on 2001-04-27. Completion date: 2004-11-14.
Top industries in this zip code by the number of employees in 2005:
Health Care and Social Assistance: Offices of Physicians (except Mental Health Specialists) (100-249: 2, 50-99: 1, 20-49: 1, 10-19: 8, 5-9: 10, 1-4: 40)
Professional, Scientific, and Technical Services: Research and Development in the Social Sciences and Humanities (250-499: 1, 100-249: 1, 20-49: 1, 10-19: 1, 5-9: 1, 1-4: 4)
Health Care and Social Assistance: Nursing Care Facilities (100-249: 3, 50-99: 1)
Administrative and Support and Waste Management and Remediation Services: Temporary Help Services (100-249: 3)
Professional, Scientific, and Technical Services: Research and Development in the Physical, Engineering, and Life Sciences (50-99: 3, 20-49: 3, 10-19: 5, 5-9: 3, 1-4: 13)
People in group quarters in 2010:
9,588 people in college/university student housing
256 people in other noninstitutional facilities
204 people in nursing facilities/skilled-nursing facilities
55 people in emergency and transitional shelters (with sleeping facilities) for people experiencing homelessness
52 people in group homes intended for adults
25 people in workers' group living quarters and job corps centers
6 people in correctional residential facilities
6 people in residential treatment centers for adults
4 people in in-patient hospice facilities
People in group quarters in 2000:
8,766 people in college dormitories (includes college quarters off campus)
119 people in religious group quarters
103 people in other noninstitutional group quarters
82 people in nursing homes
24 people in homes for the mentally ill
5 people in other group homes
3 people in hospitals/wards and hospices for chronically ill
3 people in hospices or homes for chronically ill
3 people in wards in general hospitals for patients who have no usual home elsewhere
Fatal accident statistics in 2013:
Fatal accident count: 1
Vehicles involved in fatal accidents: 1
Fatal accidents caused by drunken drivers: 0
Fatalities: 1
Persons involved in fatal accidents: 1
Pedestrians involved in fatal accidents: 1
Fatal accident statistics in 2012:
Fatal accident count: 1
Vehicles involved in fatal accidents: 1
Fatal accidents caused by drunken drivers: 0
Fatalities: 1
Persons involved in fatal accidents: 1
Pedestrians involved in fatal accidents: 0
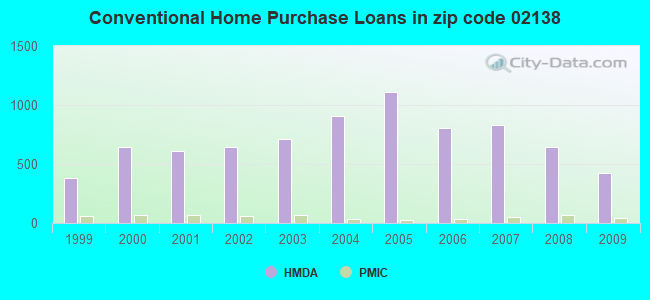
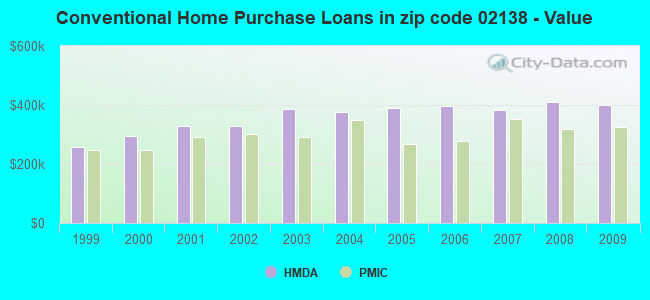
Home Mortgage Disclosure Act Aggregated Statistics For Year 2009 (Based on 11 full and 12 partial tracts)
A) FHA, FSA/RHS & VA Home Purchase Loans
B) Conventional Home Purchase Loans
C) Refinancings
D) Home Improvement Loans
E) Loans on Dwellings For 5+ Families
F) Non-occupant Loans on < 5 Family Dwellings (A B C & D)
Number
Average Value
Number
Average Value
Number
Average Value
Number
Average Value
Number
Average Value
Number
Average Value
LOANS ORIGINATED
9
$496,457
427
$400,313
1,452
$348,464
74
$297,089
12
$1,654,993
146
$344,921
APPLICATIONS APPROVED, NOT ACCEPTED
0
$0
31
$388,809
79
$437,299
3
$737,143
0
$0
9
$651,659
APPLICATIONS DENIED
7
$200,591
46
$454,995
275
$381,547
14
$165,776
0
$0
46
$310,299
APPLICATIONS WITHDRAWN
6
$357,605
51
$491,898
151
$348,134
6
$245,780
2
$5,595,000
15
$560,645
FILES CLOSED FOR INCOMPLETENESS
2
$246,425
6
$792,757
74
$355,755
2
$93,250
0
$0
8
$286,385
Aggregated Statistics For Year 2008 (Based on 11 full and 12 partial tracts)
A) FHA, FSA/RHS & VA Home Purchase Loans
B) Conventional Home Purchase Loans
C) Refinancings
D) Home Improvement Loans
E) Loans on Dwellings For 5+ Families
F) Non-occupant Loans on < 5 Family Dwellings (A B C & D)
Number
Average Value
Number
Average Value
Number
Average Value
Number
Average Value
Number
Average Value
Number
Average Value
LOANS ORIGINATED
3
$367,720
643
$409,849
499
$369,959
24
$326,455
8
$3,287,540
152
$367,343
APPLICATIONS APPROVED, NOT ACCEPTED
2
$358,830
81
$373,971
55
$417,056
9
$287,533
0
$0
17
$253,616
APPLICATIONS DENIED
4
$248,520
58
$343,318
106
$371,887
16
$207,302
0
$0
33
$269,970
APPLICATIONS WITHDRAWN
2
$397,225
65
$401,109
97
$426,415
6
$53,978
0
$0
33
$385,428
FILES CLOSED FOR INCOMPLETENESS
0
$0
16
$381,086
27
$293,762
2
$298,470
0
$0
15
$260,269
Aggregated Statistics For Year 2007 (Based on 11 full and 12 partial tracts)
B) Conventional Home Purchase Loans
C) Refinancings
D) Home Improvement Loans
E) Loans on Dwellings For 5+ Families
F) Non-occupant Loans on < 5 Family Dwellings (A B C & D)
G) Loans On Manufactured Home Dwelling (A B C & D)
Number
Average Value
Number
Average Value
Number
Average Value
Number
Average Value
Number
Average Value
Number
Average Value
LOANS ORIGINATED
831
$383,228
439
$450,101
89
$213,438
18
$1,124,747
187
$470,151
0
$0
APPLICATIONS APPROVED, NOT ACCEPTED
96
$354,606
78
$444,899
12
$107,412
0
$0
23
$413,503
0
$0
APPLICATIONS DENIED
92
$526,427
167
$524,000
45
$224,111
2
$1,293,370
70
$598,546
2
$24,765
APPLICATIONS WITHDRAWN
70
$444,862
78
$427,832
7
$397,793
2
$1,069,515
25
$466,106
0
$0
FILES CLOSED FOR INCOMPLETENESS
14
$508,393
19
$555,198
2
$215,000
1
$1,120,240
4
$295,528
0
$0
Aggregated Statistics For Year 2006 (Based on 11 full and 12 partial tracts)
A) FHA, FSA/RHS & VA Home Purchase Loans
B) Conventional Home Purchase Loans
C) Refinancings
D) Home Improvement Loans
E) Loans on Dwellings For 5+ Families
F) Non-occupant Loans on < 5 Family Dwellings (A B C & D)
G) Loans On Manufactured Home Dwelling (A B C & D)
Number
Average Value
Number
Average Value
Number
Average Value
Number
Average Value
Number
Average Value
Number
Average Value
Number
Average Value
LOANS ORIGINATED
1
$352,370
804
$397,707
513
$413,013
66
$171,301
17
$1,639,546
217
$380,229
0
$0
APPLICATIONS APPROVED, NOT ACCEPTED
0
$0
64
$450,262
75
$373,022
9
$91,011
3
$955,920
8
$387,410
0
$0
APPLICATIONS DENIED
0
$0
85
$509,221
124
$424,281
37
$261,163
2
$3,086,720
24
$419,537
4
$423,000
APPLICATIONS WITHDRAWN
0
$0
97
$402,088
112
$402,021
11
$178,119
6
$1,070,133
36
$270,100
0
$0
FILES CLOSED FOR INCOMPLETENESS
0
$0
14
$270,762
19
$356,537
0
$0
0
$0
1
$163,960
0
$0
Aggregated Statistics For Year 2005 (Based on 11 full and 12 partial tracts)
B) Conventional Home Purchase Loans
C) Refinancings
D) Home Improvement Loans
E) Loans on Dwellings For 5+ Families
F) Non-occupant Loans on < 5 Family Dwellings (A B C & D)
G) Loans On Manufactured Home Dwelling (A B C & D)
Number
Average Value
Number
Average Value
Number
Average Value
Number
Average Value
Number
Average Value
Number
Average Value
LOANS ORIGINATED
1,109
$389,840
733
$407,729
71
$255,588
20
$1,856,727
294
$347,541
2
$29,720
APPLICATIONS APPROVED, NOT ACCEPTED
75
$438,649
70
$336,646
7
$226,449
0
$0
8
$253,255
0
$0
APPLICATIONS DENIED
142
$516,973
207
$462,156
39
$222,393
0
$0
72
$511,866
0
$0
APPLICATIONS WITHDRAWN
123
$486,556
185
$348,345
7
$297,863
4
$3,596,908
31
$316,661
0
$0
FILES CLOSED FOR INCOMPLETENESS
21
$375,363
60
$448,967
1
$305,520
0
$0
14
$507,976
1
$310,000
Aggregated Statistics For Year 2004 (Based on 11 full and 12 partial tracts)
A) FHA, FSA/RHS & VA Home Purchase Loans
B) Conventional Home Purchase Loans
C) Refinancings
D) Home Improvement Loans
E) Loans on Dwellings For 5+ Families
F) Non-occupant Loans on < 5 Family Dwellings (A B C & D)
Number
Average Value
Number
Average Value
Number
Average Value
Number
Average Value
Number
Average Value
Number
Average Value
LOANS ORIGINATED
1
$294,320
908
$375,462
925
$365,651
55
$222,159
21
$1,427,453
222
$369,905
APPLICATIONS APPROVED, NOT ACCEPTED
0
$0
87
$410,053
93
$342,875
11
$157,307
0
$0
32
$263,220
APPLICATIONS DENIED
0
$0
76
$366,308
177
$413,987
32
$146,275
2
$2,500,000
38
$475,217
APPLICATIONS WITHDRAWN
0
$0
94
$475,349
183
$335,536
10
$177,056
3
$591,307
37
$408,357
FILES CLOSED FOR INCOMPLETENESS
0
$0
8
$433,470
35
$656,047
0
$0
0
$0
5
$920,188
Aggregated Statistics For Year 2003 (Based on 11 full and 12 partial tracts)
A) FHA, FSA/RHS & VA Home Purchase Loans
B) Conventional Home Purchase Loans
C) Refinancings
D) Home Improvement Loans
E) Loans on Dwellings For 5+ Families
F) Non-occupant Loans on < 5 Family Dwellings (A B C & D)
Number
Average Value
Number
Average Value
Number
Average Value
Number
Average Value
Number
Average Value
Number
Average Value
LOANS ORIGINATED
2
$394,465
708
$385,018
2,824
$298,647
29
$115,633
23
$1,489,360
340
$273,457
APPLICATIONS APPROVED, NOT ACCEPTED
0
$0
73
$390,295
332
$298,313
7
$33,574
0
$0
23
$202,057
APPLICATIONS DENIED
0
$0
50
$335,849
311
$340,649
19
$46,296
0
$0
39
$254,959
APPLICATIONS WITHDRAWN
0
$0
72
$318,831
256
$299,700
6
$142,103
2
$1,591,840
22
$365,545
FILES CLOSED FOR INCOMPLETENESS
0
$0
8
$384,464
37
$325,074
4
$29,590
0
$0
7
$191,113
Aggregated Statistics For Year 2002 (Based on 11 full and 12 partial tracts)
A) FHA, FSA/RHS & VA Home Purchase Loans
B) Conventional Home Purchase Loans
C) Refinancings
D) Home Improvement Loans
E) Loans on Dwellings For 5+ Families
F) Non-occupant Loans on < 5 Family Dwellings (A B C & D)
Number
Average Value
Number
Average Value
Number
Average Value
Number
Average Value
Number
Average Value
Number
Average Value
LOANS ORIGINATED
1
$29,470
648
$327,197
2,227
$309,111
111
$88,015
25
$979,142
301
$326,711
APPLICATIONS APPROVED, NOT ACCEPTED
1
$197,000
48
$301,635
218
$256,964
19
$58,894
0
$0
20
$251,669
APPLICATIONS DENIED
0
$0
50
$281,804
216
$256,331
41
$118,590
0
$0
37
$169,065
APPLICATIONS WITHDRAWN
0
$0
29
$214,158
175
$271,872
11
$14,072
2
$220,000
23
$302,324
FILES CLOSED FOR INCOMPLETENESS
0
$0
18
$247,492
37
$263,799
1
$12,000
0
$0
12
$130,107
Aggregated Statistics For Year 2001 (Based on 11 full and 12 partial tracts)
A) FHA, FSA/RHS & VA Home Purchase Loans
B) Conventional Home Purchase Loans
C) Refinancings
D) Home Improvement Loans
E) Loans on Dwellings For 5+ Families
F) Non-occupant Loans on < 5 Family Dwellings (A B C & D)
Number
Average Value
Number
Average Value
Number
Average Value
Number
Average Value
Number
Average Value
Number
Average Value
LOANS ORIGINATED
3
$434,737
612
$329,451
1,261
$287,949
94
$102,080
16
$1,712,374
161
$281,955
APPLICATIONS APPROVED, NOT ACCEPTED
0
$0
55
$334,042
111
$216,838
30
$79,536
1
$763,800
23
$189,587
APPLICATIONS DENIED
0
$0
48
$350,207
118
$239,629
54
$125,533
1
$178,220
24
$232,442
APPLICATIONS WITHDRAWN
0
$0
35
$282,712
90
$241,931
12
$58,665
7
$2,336,553
8
$206,874
FILES CLOSED FOR INCOMPLETENESS
0
$0
14
$895,774
15
$239,323
3
$37,093
0
$0
0
$0
Aggregated Statistics For Year 2000 (Based on 11 full and 12 partial tracts)
A) FHA, FSA/RHS & VA Home Purchase Loans
B) Conventional Home Purchase Loans
C) Refinancings
D) Home Improvement Loans
E) Loans on Dwellings For 5+ Families
F) Non-occupant Loans on < 5 Family Dwellings (A B C & D)
Number
Average Value
Number
Average Value
Number
Average Value
Number
Average Value
Number
Average Value
Number
Average Value
LOANS ORIGINATED
1
$200,620
646
$295,585
294
$278,829
55
$88,314
10
$2,779,873
133
$348,400
APPLICATIONS APPROVED, NOT ACCEPTED
0
$0
50
$243,859
41
$197,971
18
$48,571
2
$1,573,215
10
$229,388
APPLICATIONS DENIED
0
$0
39
$258,718
56
$264,094
32
$71,827
0
$0
14
$270,841
APPLICATIONS WITHDRAWN
0
$0
35
$215,639
47
$175,407
12
$87,626
2
$157,000
10
$200,233
FILES CLOSED FOR INCOMPLETENESS
0
$0
13
$265,383
8
$155,178
4
$97,880
2
$1,082,450
3
$364,420
Aggregated Statistics For Year 1999 (Based on 5 full and 8 partial tracts)
A) FHA, FSA/RHS & VA Home Purchase Loans
B) Conventional Home Purchase Loans
C) Refinancings
D) Home Improvement Loans
E) Loans on Dwellings For 5+ Families
F) Non-occupant Loans on < 5 Family Dwellings (A B C & D)
2002 - 2018 National Fire Incident Reporting System (NFIRS) incidents
Based on the data from the years 2002 - 2018 the average number of fires per year is 298. The highest number of fire incidents - 411 took place in 2016, and the least - 112 in 2003. The data has a growing trend.
When looking into fire subcategories, the most incidents belonged to: Structure Fires (86.4%), and Outside Fires (11.0%).
Fire incident types reported to NFIRS in Zip Code 02138


 Nearest zip codes: 02140, 02163, 02134, 02144, 02135, 02139.
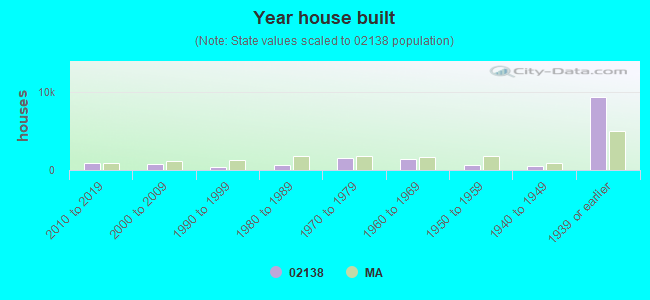


 Based on the data from the years 2002 - 2018 the average number of fires per year is 298. The highest number of fire incidents - 411 took place in 2016, and the least - 112 in 2003. The data has a growing trend.
 When looking into fire subcategories, the most incidents belonged to: Structure Fires (86.4%), and Outside Fires (11.0%).