Newton, Massachusetts

Newton: Park Street, Newton Corner
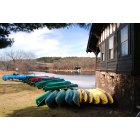
Newton: Canoes and kayaks at the Newton Boathouse in Auburndale
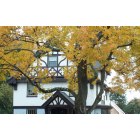
Newton: A house and branches mix together

Newton: Canoes and kayaks at the Newton Boathouse in Auburndale
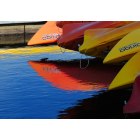
Newton: Canoes and kayaks at the Newton Boathouse in Auburndale
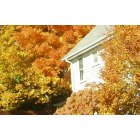
Newton: A sun lighted house in the autom
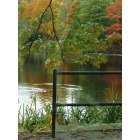
Newton: Bullough's Pond in the autom
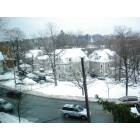
Newton: Newton Corner - Fallen Snow
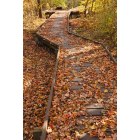
Newton: Walkway at dolan pond
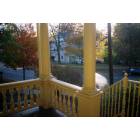
Newton: Newton Corner - Cool Fall morning on the front porch
- add
your
Submit your own pictures of this city and show them to the world
- OSM Map
- General Map
- Google Map
- MSN Map
Population change since 2000: +4.2%
 |
| Males: 41,203 | |
| Females: 46,178 |
| Median resident age: | 44.0 years |
| Massachusetts median age: | 40.3 years |
Zip codes: 02458, 02459, 02460, 02461, 02462, 02464, 02465, 02466, 02468.
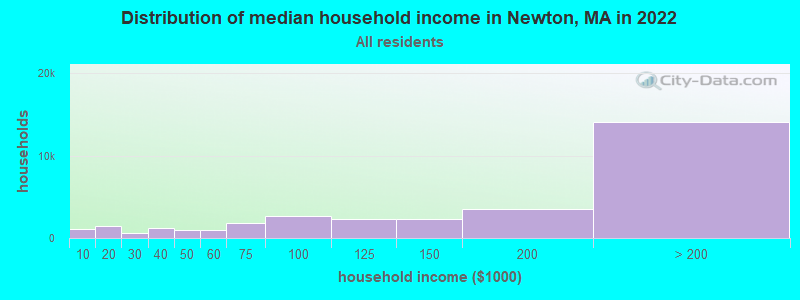
Newton Zip Code Map| Newton: | $163,074 |
| MA: | $94,488 |
Estimated per capita income in 2022: $96,596 (it was $45,708 in 2000)
Newton city income, earnings, and wages data
Estimated median house or condo value in 2022: over $1,000,000 (it was $416,600 in 2000)
| Newton: | over $1,000,000 |
| MA: | $534,700 |
Mean prices in 2022: all housing units: over $1,000,000; detached houses: over $1,000,000; townhouses or other attached units: over $1,000,000; in 2-unit structures: $860,259; in 3-to-4-unit structures: $728,970; in 5-or-more-unit structures: $786,687
Median gross rent in 2022: $2,196.
(3.8% for White Non-Hispanic residents, 11.2% for Black residents, 11.0% for Hispanic or Latino residents, 15.6% for American Indian residents, 8.7% for other race residents, 4.7% for two or more races residents)
Detailed information about poverty and poor residents in Newton, MA


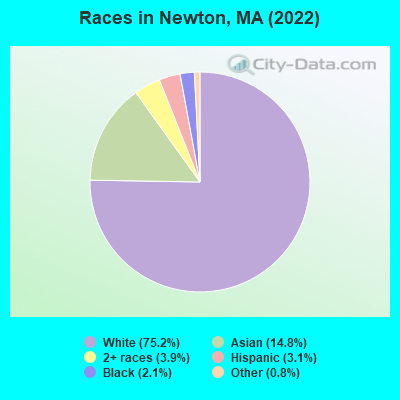
- 65,70575.2%White alone
- 12,91914.8%Asian alone
- 3,3893.9%Two or more races
- 2,7163.1%Hispanic
- 1,8472.1%Black alone
- 7390.8%Other race alone
- 480.05%Native Hawaiian and Other
Pacific Islander alone - 190.02%American Indian alone
Races in Newton detailed stats: ancestries, foreign born residents, place of birth
According to our research of Massachusetts and other state lists, there were 4 registered sex offenders living in Newton, Massachusetts as of April 27, 2024.
The ratio of all residents to sex offenders in Newton is 22,391 to 1.
The ratio of registered sex offenders to all residents in this city is much lower than the state average.
The City-Data.com crime index weighs serious crimes and violent crimes more heavily. Higher means more crime, U.S. average is 246.1. It adjusts for the number of visitors and daily workers commuting into cities.
- means the value is smaller than the state average.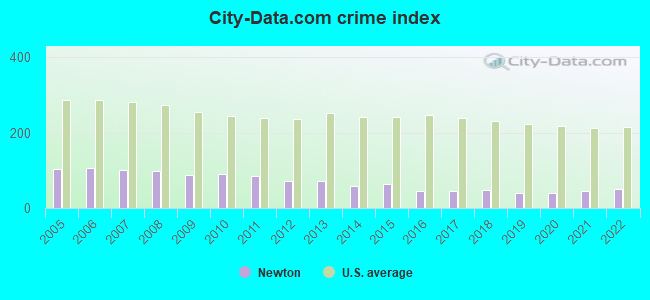
Crime rate in Newton detailed stats: murders, rapes, robberies, assaults, burglaries, thefts, arson
Full-time law enforcement employees in 2021, including police officers: 171 (140 officers - 120 male; 20 female).
| Officers per 1,000 residents here: | 1.58 |
| Massachusetts average: | 2.53 |
 Recent articles from our blog. Our writers, many of them Ph.D. graduates or candidates, create easy-to-read articles on a wide variety of topics.

 | Winchester, Lexington, Weston, Arlington, Newton (47 replies) |
| Murder in Newton (7 replies) |
| Newton elementary schools and neighborhoods (12 replies) |
| Advice needed on Newton villages. (17 replies) |
| Thoughts on this house in Newton for sale (19 replies) |
| Newton, MA. Accessory Apartments now legal (6 replies) |
Latest news from Newton, MA collected exclusively by city-data.com from local newspapers, TV, and radio stations
Newton, MA City Guides:
Ancestries: Irish (8.2%), Italian (7.3%), Eastern European (5.2%), Russian (5.2%), American (4.5%), European (3.5%).
Current Local Time: EST time zone
Elevation: 100 feet
Land area: 18.1 square miles.
Population density: 4,840 people per square mile (average).
20,132 residents are foreign born (10.3% Asia, 7.3% Europe, 2.3% Latin America).
| This city: | 22.8% |
| Massachusetts: | 17.6% |
Median real estate property taxes paid for housing units with mortgages in 2022: $10,001 (0.9%)
Median real estate property taxes paid for housing units with no mortgage in 2022: $9,868 (0.9%)
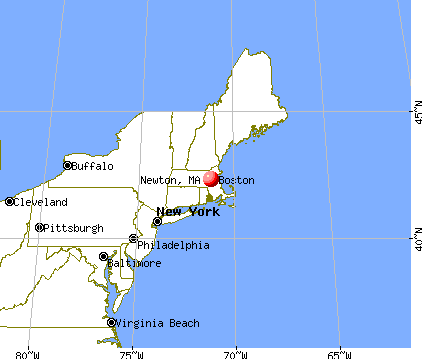
Nearest city with pop. 200,000+: Boston, MA  (6.3 miles , pop. 589,141).
Nearest city with pop. 1,000,000+: Bronx, NY (172.1 miles , pop. 1,332,650).
Nearest cities:
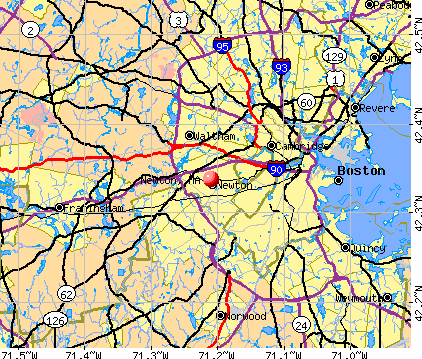
), Latitude: 42.34 N, Longitude: 71.21 W
Daytime population change due to commuting: +14,252 (+16.3%)
Workers who live and work in this city: 22,047 (48.9%)
Area codes: 617, 857

Property values in Newton, MA
Newton, Massachusetts accommodation & food services, waste management - Economy and Business Data
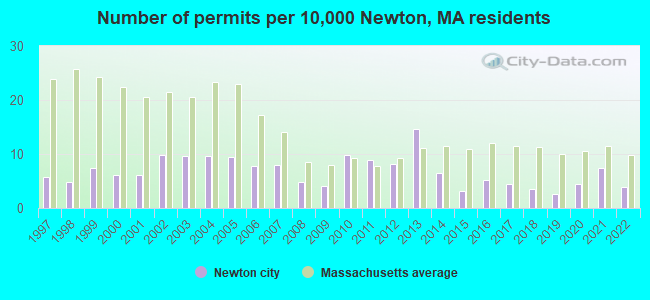
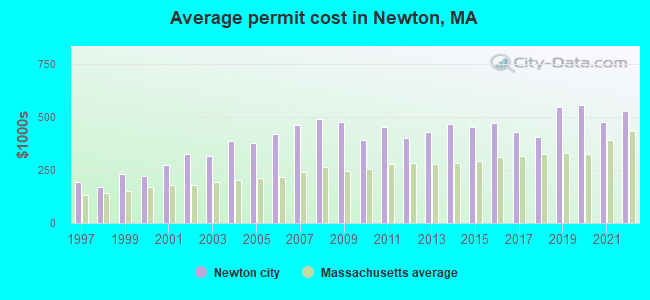
Single-family new house construction building permits:
- 2022: 33 buildings, average cost: $529,600
- 2021: 62 buildings, average cost: $478,000
- 2020: 37 buildings, average cost: $558,400
- 2019: 21 buildings, average cost: $547,600
- 2018: 29 buildings, average cost: $406,000
- 2017: 38 buildings, average cost: $428,100
- 2016: 43 buildings, average cost: $474,500
- 2015: 27 buildings, average cost: $452,000
- 2014: 55 buildings, average cost: $466,500
- 2013: 123 buildings, average cost: $429,200
- 2012: 68 buildings, average cost: $404,200
- 2011: 74 buildings, average cost: $452,400
- 2010: 82 buildings, average cost: $394,300
- 2009: 34 buildings, average cost: $479,300
- 2008: 40 buildings, average cost: $489,600
- 2007: 67 buildings, average cost: $465,100
- 2006: 66 buildings, average cost: $419,900
- 2005: 79 buildings, average cost: $378,400
- 2004: 81 buildings, average cost: $388,800
- 2003: 81 buildings, average cost: $315,700
- 2002: 82 buildings, average cost: $326,200
- 2001: 51 buildings, average cost: $272,900
- 2000: 52 buildings, average cost: $223,900
- 1999: 62 buildings, average cost: $232,900
- 1998: 40 buildings, average cost: $169,600
- 1997: 48 buildings, average cost: $194,000
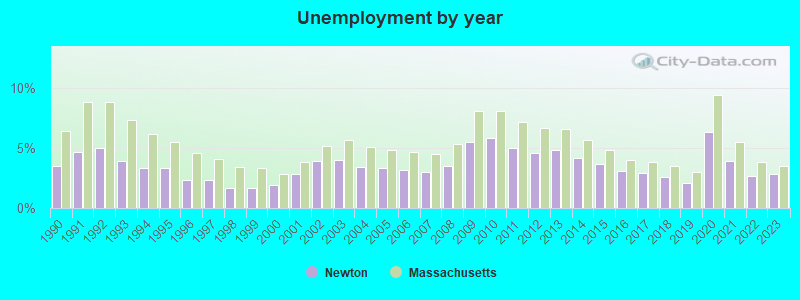
| Here: | 2.8% |
| Massachusetts: | 3.5% |
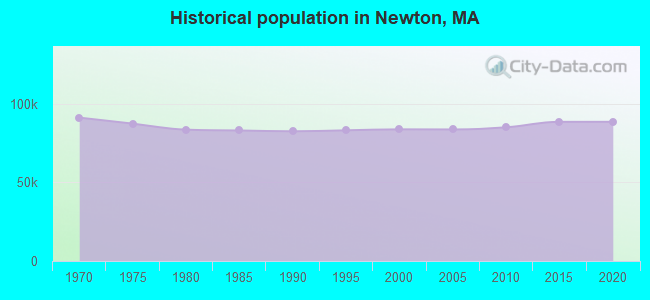
Population change in the 1990s: +1,252 (+1.5%).
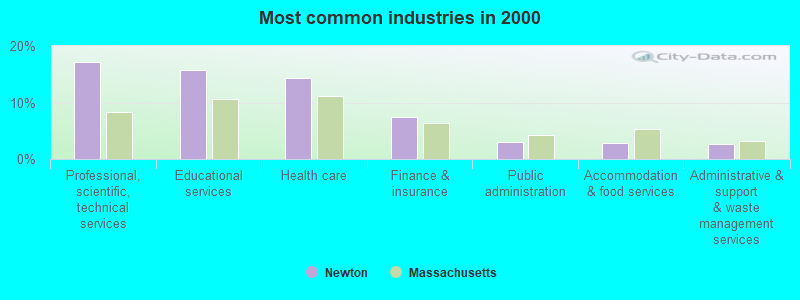
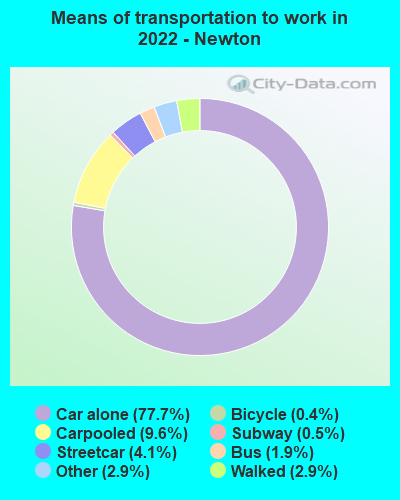
- Professional, scientific, technical services (17.1%)
- Educational services (15.7%)
- Health care (14.4%)
- Finance & insurance (7.5%)
- Public administration (3.1%)
- Accommodation & food services (2.8%)
- Administrative & support & waste management services (2.7%)
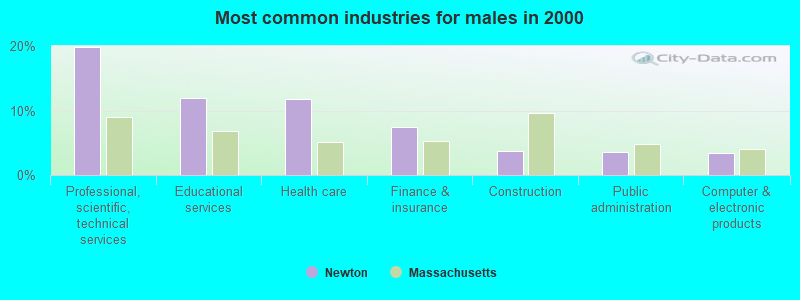
- Professional, scientific, technical services (19.8%)
- Educational services (12.0%)
- Health care (11.8%)
- Finance & insurance (7.4%)
- Construction (3.7%)
- Public administration (3.5%)
- Computer & electronic products (3.4%)
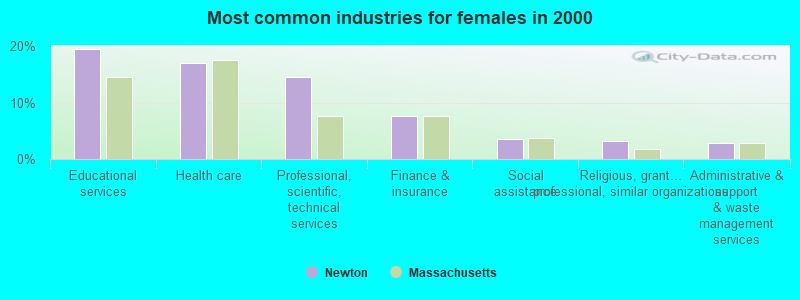
- Educational services (19.5%)
- Health care (17.0%)
- Professional, scientific, technical services (14.5%)
- Finance & insurance (7.6%)
- Social assistance (3.5%)
- Religious, grantmaking, civic, professional, similar organizations (3.1%)
- Administrative & support & waste management services (2.8%)
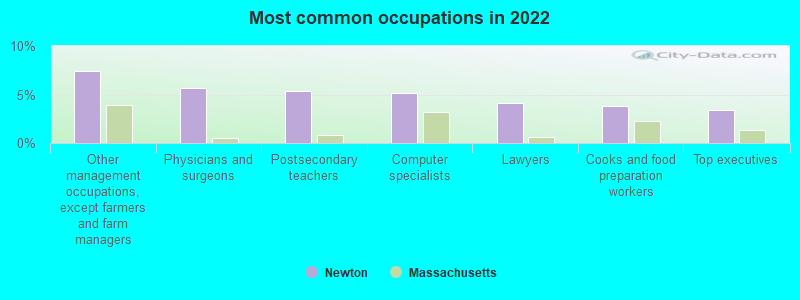
- Other management occupations, except farmers and farm managers (7.5%)
- Physicians and surgeons (5.6%)
- Postsecondary teachers (5.3%)
- Computer specialists (5.1%)
- Lawyers (4.1%)
- Cooks and food preparation workers (3.8%)
- Top executives (3.4%)
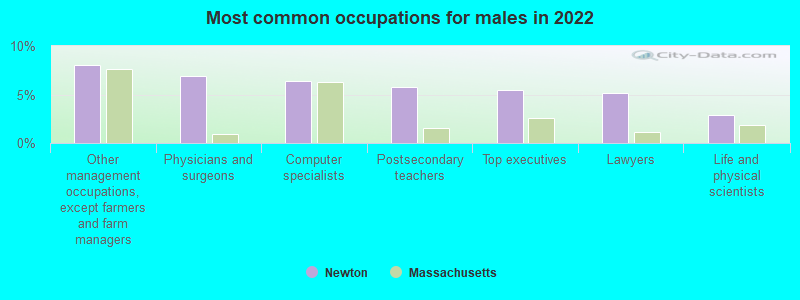
- Other management occupations, except farmers and farm managers (8.1%)
- Physicians and surgeons (6.9%)
- Computer specialists (6.4%)
- Postsecondary teachers (5.8%)
- Top executives (5.5%)
- Lawyers (5.2%)
- Life and physical scientists (2.9%)
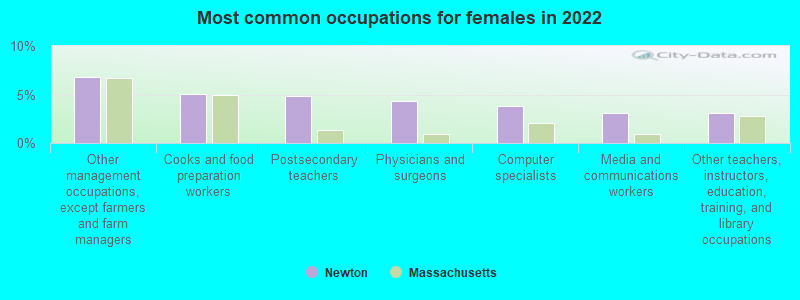
- Other management occupations, except farmers and farm managers (6.8%)
- Cooks and food preparation workers (5.1%)
- Postsecondary teachers (4.9%)
- Physicians and surgeons (4.3%)
- Computer specialists (3.9%)
- Media and communications workers (3.1%)
- Other teachers, instructors, education, training, and library occupations (3.1%)
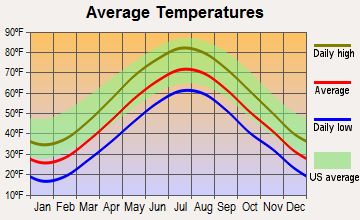
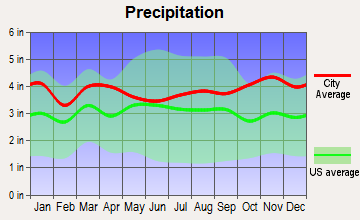
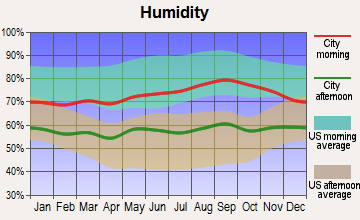
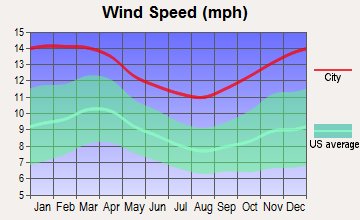
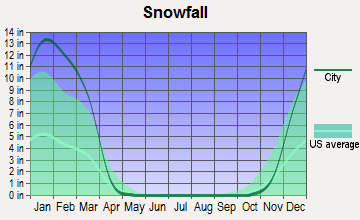
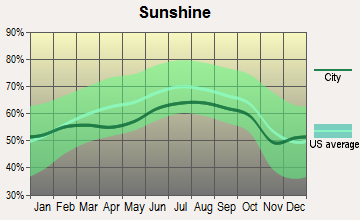
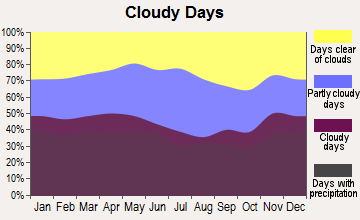
Average climate in Newton, Massachusetts
Based on data reported by over 4,000 weather stations
|
|


(lower is better)
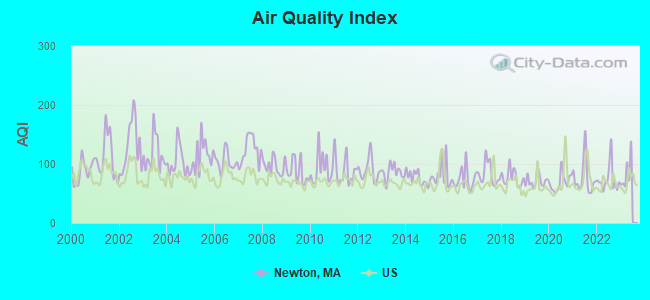
Air Quality Index (AQI) level in 2022 was 74.3. This is about average.
| City: | 74.3 |
| U.S.: | 72.6 |
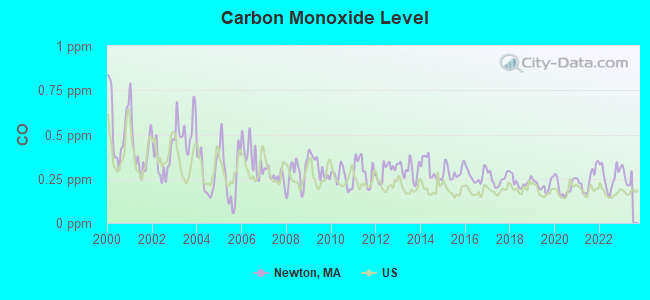
Carbon Monoxide (CO) [ppm] level in 2022 was 0.259. This is about average. Closest monitor was 2.8 miles away from the city center.
| City: | 0.259 |
| U.S.: | 0.251 |
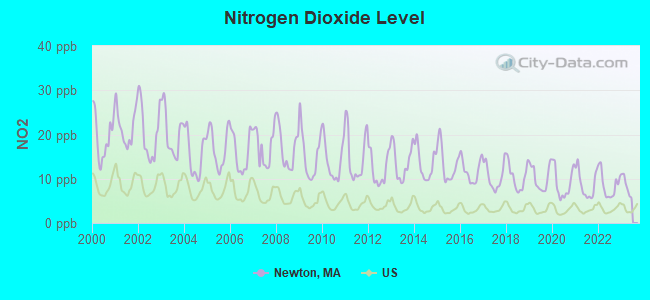
Nitrogen Dioxide (NO2) [ppb] level in 2022 was 8.57. This is significantly worse than average. Closest monitor was 2.8 miles away from the city center.
| City: | 8.57 |
| U.S.: | 5.11 |
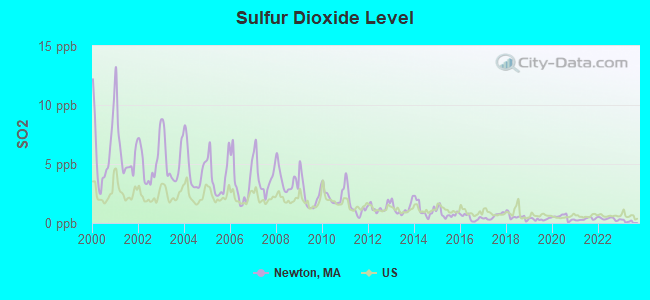
Sulfur Dioxide (SO2) [ppb] level in 2022 was 0.358. This is significantly better than average. Closest monitor was 2.8 miles away from the city center.
| City: | 0.358 |
| U.S.: | 1.515 |
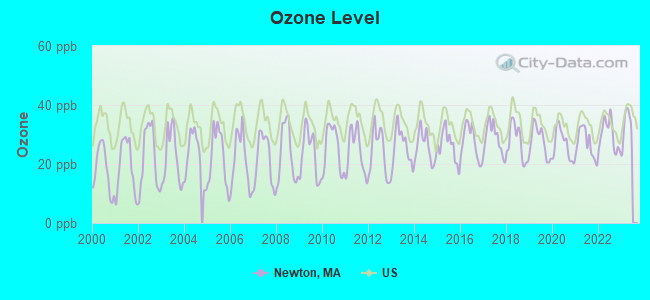
Ozone [ppb] level in 2022 was 29.9. This is about average. Closest monitor was 2.8 miles away from the city center.
| City: | 29.9 |
| U.S.: | 33.3 |
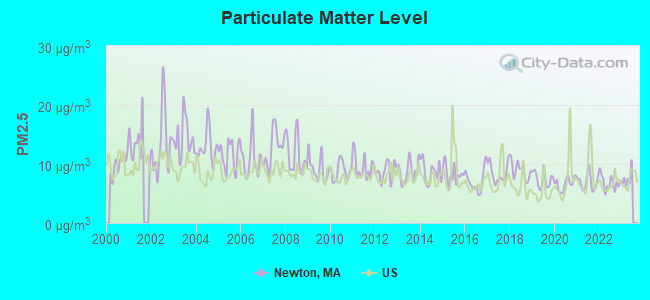
Particulate Matter (PM2.5) [µg/m3] level in 2022 was 6.83. This is about average. Closest monitor was 5.8 miles away from the city center.
| City: | 6.83 |
| U.S.: | 8.11 |
Tornado activity:
Newton-area historical tornado activity is near Massachusetts state average. It is 40% smaller than the overall U.S. average.
On 6/9/1953, a category F4 (max. wind speeds 207-260 mph) tornado 16.1 miles away from the Newton city center killed 90 people and injured 1228 people and caused between $50,000,000 and $500,000,000 in damages.
On 9/29/1974, a category F3 (max. wind speeds 158-206 mph) tornado 18.2 miles away from the city center injured one person and caused between $50,000 and $500,000 in damages.
Earthquake activity:
Newton-area historical earthquake activity is significantly above Massachusetts state average. It is 73% smaller than the overall U.S. average.On 10/7/1983 at 10:18:46, a magnitude 5.3 (5.1 MB, 5.3 LG, 5.1 ML, Class: Moderate, Intensity: VI - VII) earthquake occurred 193.5 miles away from the city center
On 4/20/2002 at 10:50:47, a magnitude 5.3 (5.3 ML, Depth: 3.0 mi) earthquake occurred 195.5 miles away from the city center
On 1/19/1982 at 00:14:42, a magnitude 4.7 (4.5 MB, 4.7 MD, 4.5 LG, Class: Light, Intensity: IV - V) earthquake occurred 82.8 miles away from Newton center
On 10/16/2012 at 23:12:25, a magnitude 4.7 (4.7 ML, Depth: 10.0 mi) earthquake occurred 91.5 miles away from Newton center
On 4/20/2002 at 10:50:47, a magnitude 5.2 (5.2 MB, 4.2 MS, 5.2 MW, 5.0 MW) earthquake occurred 194.9 miles away from the city center
On 8/22/1992 at 12:20:32, a magnitude 4.8 (4.8 MB, 3.8 MS, 4.7 LG, Depth: 6.2 mi) earthquake occurred 228.4 miles away from Newton center
Magnitude types: regional Lg-wave magnitude (LG), body-wave magnitude (MB), duration magnitude (MD), local magnitude (ML), surface-wave magnitude (MS), moment magnitude (MW)
Natural disasters:
The number of natural disasters in Middlesex County (31) is a lot greater than the US average (15).Major Disasters (Presidential) Declared: 17
Emergencies Declared: 14
Causes of natural disasters: Floods: 12, Storms: 9, Hurricanes: 6, Snowstorms: 6, Winter Storms: 5, Blizzards: 2, Snows: 2, Explosion: 1, Heavy Rain: 1, Snowfall: 1, Water Main Break: 1, Wind: 1 (Note: some incidents may be assigned to more than one category).
Main business address for: ASPECT MEDICAL SYSTEMS INC (ELECTROMEDICAL & ELECTROTHERAPEUTIC APPARATUS), PRO PHARMACEUTICALS INC (PHARMACEUTICAL PREPARATIONS), FIVE STAR QUALITY CARE INC (SERVICES-SKILLED NURSING CARE FACILITIES), MFIC CORP (LABORATORY APPARATUS & FURNITURE), MATRITECH INC/DE/ (IN VITRO & IN VIVO DIAGNOSTIC SUBSTANCES).
Hospitals in Newton:
- HOSPICE OF THE GOOD SHEPHERD (2042 BEACON STREET)
- NEWTON-WELLESLEY HOSPITAL (Voluntary non-profit - Other, 2014 WASHINGTON STREET)
Home Health Centers in Newton:
- AT HOME SENIOR CARE, INC (1340 CENTRE STREET, SUITE 208)
- CARETENDERS (29 CRAFTS STREET, SUITE 330)
- CITY HOME CARE, LLC (90 OAK STREET)
- KIMBERLY QUALITY CARE (ONE GATEWAY CENTER SUITE 102)
- KMS HOME CARE (2000 COMMONWEALTH AVENUE)
- MEDICAL RESOURCES HOME HEALTH (433 WATERTOWN STREET)
Nursing Homes in Newton:
Amtrak stations near Newton:
- 7 miles: BACK BAY (BOSTON, 145 DARTMOUTH ST.) . Services: ticket office, partially wheelchair accessible, enclosed waiting area, public restrooms, public payphones, vending machines, ATM, paid short-term parking, paid long-term parking, call for car rental service, taxi stand, public transit connection.
- 8 miles: BOSTON, NORTH STATION (BOSTON, 126 CAUSEWAY ST.) . Services: ticket office, enclosed waiting area.
- 8 miles: BOSTON (SO. STA) (BOSTON, ATLANTIC AVE. & SUMMER ST.) . Services: ticket office, fully wheelchair accessible, enclosed waiting area, public restrooms, public payphones, full-service food facilities and snack bar, ATM, paid short-term parking, paid long-term parking, call for car rental service, taxi stand, intercity bus service, public transit connection.
Colleges/Universities in Newton:
- Lasell College (Full-time enrollment: 1,872; Location: 1844 Commonwealth Avenue; Private, not-for-profit; Website: www.lasell.edu/; Offers Master's degree)
- Mount Ida College (Full-time enrollment: 1,320; Location: 777 Dedham Street; Private, not-for-profit; Website: www.mountida.edu; Offers Master's degree)
- Massachusetts School of Professional Psychology (Full-time enrollment: 227; Location: One Wells Avenue; Private, not-for-profit; Website: www.mspp.edu; Offers Doctor's degree)
- New England School of Acupuncture (Full-time enrollment: 179; Location: 150 California St.; Private, not-for-profit; Website: www.nesa.edu; Offers Master's degree)
Colleges/universities with over 2000 students nearest to Newton:
- Boston College (about 2 miles; Chestnut Hill, MA; Full-time enrollment: 12,070)
- Brandeis University (about 3 miles; Waltham, MA; FT enrollment: 6,966)
- Massachusetts Bay Community College (about 4 miles; Wellesley Hills, MA; FT enrollment: 3,636)
- Bentley University (about 4 miles; Waltham, MA; FT enrollment: 5,229)
- Babson College (about 5 miles; Wellesley, MA; FT enrollment: 3,230)
- Harvard University (about 6 miles; Cambridge, MA; FT enrollment: 20,857)
- Emmanuel College (about 6 miles; Boston, MA; FT enrollment: 2,287)
Private high schools in Newton:
- NEWTON COUNTRY DAY SCHOOL (Students: 406, Location: 785 CENTRE ST, Grades: 5-12, Girls only)
- MT ALVERNIA HIGH SCHOOL (Students: 217, Location: 790 CENTRE ST, Grades: 7-12, Girls only)
- TRINITY CATHOLIC HIGH SCHOOL (Students: 192, Location: 575 WASHINGTON ST, Grades: 9-12)
- STERLING EAST-BOSTON CAMPUS (Students: 10, Location: 90 WELLS AVE, Grades: 7-12)
Public elementary/middle schools in Newton:
- BIGELOW MIDDLE (Students: 495, Location: 42 VERNON ST, Grades: 6-8)
- LINCOLN-ELIOT (Students: 281, Location: 191 PEARL STREET, Grades: KG-5)
- OAK HILL MIDDLE (Location: 130 WHEELER RD, Grades: 6-8)
- UNDERWOOD (Location: 101 VERNON STREET, Grades: KG-5)
Private elementary/middle schools in Newton:
- JACKSON SCHOOL (Students: 263, Location: 200 JACKSON RD, Grades: KG-6)
- NEWTON MONTESSORI SCHOOL (Students: 207, Location: 80 CRESCENT AVE, Grades: PK-6)
User-submitted facts and corrections:
- John Ward Elementary School at 10 Dolphin Road added by Newton Resident
- Please add to houses of worship: Temple Shalom of Newton 175 Temple St. West Newton, MA 02465 www.templeshalom.org 617-332-9550
Points of interest:
Notable locations in Newton: Newtonville Station (A), West Newton Station (B), Victory Field (C), Harthorn Playground (D), Brae Burn Country Club (E), Woodland County Club (F), Cold Spring Playground (G), Waban Playground (H), Richardson Field (I), Burr Playground (J), Crescent Hill Country Club (K), Sidney Hill Country Club (L), Oak Hill Playground (M), Charles River Country Club (N), Lincoln Playground (O), Chestnut Hill Plaza (P), Chestnut Hill Station (Q), Putterham Meadows Country Club (R), Boston Edison Power Station (S), Newton Commonwealth Country Club (T). Display/hide their locations on the map
Shopping Centers: Auburndale Shopping Center (1), The Mall at Chestnut Hill (2), Chestnut Hill Shopping Center (3), Boylston Street Shopping Center (4), The Mall at Chestnut Hill Shopping Center (5), 200 Boylston Street Shopping Center (6). Display/hide their locations on the map
Main business address in Newton include: ASPECT MEDICAL SYSTEMS INC (A), PRO PHARMACEUTICALS INC (B), FIVE STAR QUALITY CARE INC (C), MFIC CORP (D), MATRITECH INC/DE/ (E). Display/hide their locations on the map
Churches in Newton include: Union Church on Waban (A), Saint Ignatius Church (B), First Church in Chestnut Hill (C), Church of the Good Shepherd (D), United Methodist Church (E), Trinity Church of Newton Center (F), Temple Shalom of Newton (G), Temple Emanuel Church (H), Temple Beth Avodah Church (I). Display/hide their locations on the map
Cemeteries: Boston Catholic Cemetery (1), Common Street Cemetery (2), Newton Cemetery (3), East Parish Burying Ground (4). Display/hide their locations on the map
Lakes, reservoirs, and swamps: Bulloughs Pond (A), Crystal Lake (B), Hammond Pond (C), Silver Lake (D), Strongs Pond (E), Newton Reservoir (F), Charles River Reservoir (G), Waban Hill Reservoir (H). Display/hide their locations on the map
Streams, rivers, and creeks: Cheese Cake Brook (A), Hurd Brook (B), Rosemary Brook (C), South Meadow Brook (D). Display/hide their locations on the map
Parks in Newton include: Webster Park Historic District (1), Linwood Park (2), Allison Park (3), Lowell Park (4), Edmands Park (5), Kenrick Park (6), Farlow Park (7), Cabot Park (8), Lassell Neighborhood Historic District (9). Display/hide their locations on the map
Beach: Harvey Beach (A). Display/hide its location on the map
Tourist attractions: Jackson Homestead Museum (Cultural Attractions- Events- & Facilities; 527 Washington Street) (1), Custom Front Page (Arcades & Amusements; 3 Glenwood Avenue) (2). Display/hide their approximate locations on the map
Hotel: Sheraton Newton Hotel (320 Washington Street) (1). Display/hide its approximate location on the map
Birthplace of: John Krasinski - Actor, Julie Taymor - Film and theatre director, Amy Poehler - Actress and comedienne, Jack Lemmon - (1925-2001), actor, James Harris Simons - Billionaire, Mark Foley, Eli Roth - Film actor, Jane Morgan - Actress and singer, Edward C. Tolman - Psychologist, Suzyn Waldman - Musical theatre actor.
Drinking water stations with addresses in Newton and their reported violations in the past:
JCC CAMP KINGSWOOD #1 (Serves ME, Population served: 270, Groundwater):Past health violations:YMCA CAMP FRANK A. DAY (Address: 276 CHURCH STREET , Population served: 250, Groundwater):Past monitoring violations:
- MCL, Monthly (TCR) - In JUL-2010, Contaminant: Coliform. Follow-up actions: St Public Notif requested (JUL-30-2010), St Formal NOV issued (JUL-30-2010), St Public Notif received (AUG-11-2010), St Compliance achieved (AUG-18-2010)
- MCL, Monthly (TCR) - In AUG-2008, Contaminant: Coliform. Follow-up actions: St Public Notif requested (SEP-02-2008), St Formal NOV issued (SEP-02-2008), St Public Notif received (JUL-15-2009), St Compliance achieved (JUL-21-2009)
- One routine major monitoring violation
Past health violations:NORTH SHORE WATER ASSOC (Serves ME, Population served: 63, Groundwater):Past monitoring violations:
- MCL, Monthly (TCR) - In SEP-2013, Contaminant: Coliform. Follow-up actions: St AO (w/o penalty) issued (OCT-25-2013)
- MCL, Monthly (TCR) - In AUG-2009, Contaminant: Coliform. Follow-up actions: St AO (w/o penalty) issued (OCT-13-2009)
- 4 routine major monitoring violations
- 3 minor monitoring violations
- 23 regular monitoring violations
Past health violations:Past monitoring violations:
- MCL, Monthly (TCR) - In SEP-2013, Contaminant: Coliform. Follow-up actions: St Public Notif requested (OCT-22-2013), St Formal NOV issued (OCT-22-2013), St Public Notif received (FEB-06-2014), St Compliance achieved (MAY-16-2014)
- MCL, Monthly (TCR) - In AUG-2013, Contaminant: Coliform. Follow-up actions: St Public Notif requested (AUG-26-2013), St Formal NOV issued (AUG-26-2013), St Public Notif received (NOV-15-2013), St Compliance achieved (MAY-16-2014)
- MCL, Monthly (TCR) - In APR-2005, Contaminant: Coliform. Follow-up actions: St Compliance achieved (SEP-12-2005), St Public Notif requested (NOV-29-2005), St Violation/Reminder Notice (NOV-29-2005), St Intentional no-action (AUG-19-2011)
- Monitoring, Repeat Major (TCR) - In MAY-2005, Contaminant: Coliform (TCR). Follow-up actions: St Public Notif requested (NOV-29-2005), St Violation/Reminder Notice (NOV-29-2005), St Compliance achieved (SEP-10-2007), St Intentional no-action (AUG-19-2011)
- 4 routine major monitoring violations
Drinking water stations with addresses in Newton that have no violations reported:
- NEWTON WATER DEPT. (MWRA) (Population served: 89,918, Primary Water Source Type: Purch surface water)
| This city: | 2.5 people |
| Massachusetts: | 2.5 people |
| This city: | 67.3% |
| Whole state: | 63.0% |
| This city: | 4.7% |
| Whole state: | 7.0% |
Likely homosexual households (counted as self-reported same-sex unmarried-partner households)
- Lesbian couples: 0.6% of all households
- Gay men: 0.4% of all households
People in group quarters in Newton in 2010:
- 6,316 people in college/university student housing
- 474 people in nursing facilities/skilled-nursing facilities
- 115 people in other noninstitutional facilities
- 91 people in group homes intended for adults
- 66 people in workers' group living quarters and job corps centers
- 25 people in residential treatment centers for adults
- 9 people in group homes for juveniles (non-correctional)
- 7 people in emergency and transitional shelters (with sleeping facilities) for people experiencing homelessness
People in group quarters in Newton in 2000:
- 4,744 people in college dormitories (includes college quarters off campus)
- 612 people in nursing homes
- 108 people in religious group quarters
- 33 people in homes for the mentally retarded
- 26 people in homes for the mentally ill
- 23 people in other nonhousehold living situations
- 22 people in other noninstitutional group quarters
- 9 people in mental (psychiatric) hospitals or wards
Banks with most branches in Newton (2011 data):
- Eastern Bank: Needham Street Branch at 188 Needham Street, branch established on 1997/06/02; Newton Branch at 1255 Centre Street, branch established on 2005/09/26. Info updated 2011/03/30: Bank assets: $7,812.9 mil, Deposits: $6,295.8 mil, headquarters in Boston, MA, positive income, Commercial Lending Specialization, 94 total offices, Holding Company: Eastern Bank Corporation
- RBS Citizens, National Association: Newton Four Corners Branch at 1126 Beacon Street, branch established on 1988/11/16; Newton Corner Branch at 300 Washington Street, branch established on 1894/01/01. Info updated 2007/09/19: Bank assets: $106,940.6 mil, Deposits: $75,690.2 mil, headquarters in Providence, RI, positive income, 1135 total offices, Holding Company: Uk Financial Investments Limited
- Bank of America, National Association: Newton-Upper Falls Branch at 235 Needham Street, branch established on 1955/11/08; Newton Center Branch at 808 Beacon Street, branch established on 1986/04/15. Info updated 2009/11/18: Bank assets: $1,451,969.3 mil, Deposits: $1,077,176.8 mil, headquarters in Charlotte, NC, positive income, 5782 total offices, Holding Company: Bank Of America Corporation
- Brookline Bank: Newton Centre Branch at 10 Langley Road, branch established on 2000/10/29; Walnut Street Branch at 323 Walnut Street, branch established on 2004/12/15. Info updated 2011/07/21: Bank assets: $2,854.7 mil, Deposits: $2,040.1 mil, headquarters in Brookline, MA, positive income, Commercial Lending Specialization, 20 total offices, Holding Company: Brookline Bancorp, Inc.
- Boston Private Bank & Trust Company: Center Street Newton Branch at 1223 - 1227 Centre Street, branch established on 2002/08/01. Info updated 2011/06/08: Bank assets: $5,848.9 mil, Deposits: $4,643.9 mil, headquarters in Boston, MA, positive income, Commercial Lending Specialization, 24 total offices, Holding Company: Boston Private Financial Holdings, Inc.
- The Village Bank: Nonantum Branch at 411 Watertown Street, branch established on 1913/01/01. Info updated 2006/11/03: Bank assets: $705.4 mil, Deposits: $601.9 mil, headquarters in Auburndale, MA, positive income, 8 total offices
- Citibank, National Association: Newton Center Financial Center Branc at 792 Beacon Street, branch established on 2007/02/26. Info updated 2012/01/10: Bank assets: $1,288,658.0 mil, Deposits: $882,541.0 mil, headquarters in Sioux Falls, SD, positive income, International Specialization, 1048 total offices, Holding Company: Citigroup Inc.
- Sovereign Bank, National Association: Newton Branch at 780 Beacon Street, branch established on 1978/10/06. Info updated 2012/01/31: Bank assets: $78,146.9 mil, Deposits: $48,042.9 mil, headquarters in Wilmington, DE, positive income, Commercial Lending Specialization, 718 total offices, Holding Company: Banco Santander, S.A.
- Silicon Valley Bank: Boston Loan Production Branch at One Newton Executive Park, Suite 200, 2221 Washington Street, branch established on 2000/10/30. Info updated 2006/11/03: Bank assets: $18,760.9 mil, Deposits: $16,815.1 mil, headquarters in Santa Clara, CA, positive income, Commercial Lending Specialization, 5 total offices, Holding Company: Svb Financial Group
For population 15 years and over in Newton:
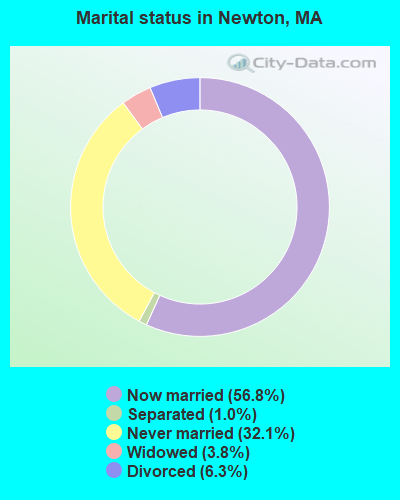
- Never married: 32.1%
- Now married: 56.8%
- Separated: 1.0%
- Widowed: 3.8%
- Divorced: 6.3%
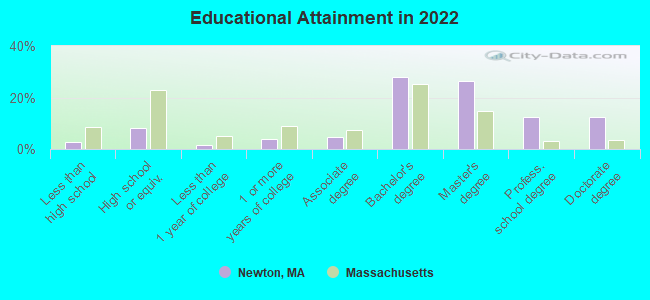
For population 25 years and over in Newton:
- High school or higher: 97.3%
- Bachelor's degree or higher: 79.1%
- Graduate or professional degree: 51.3%
- Unemployed: 2.1%
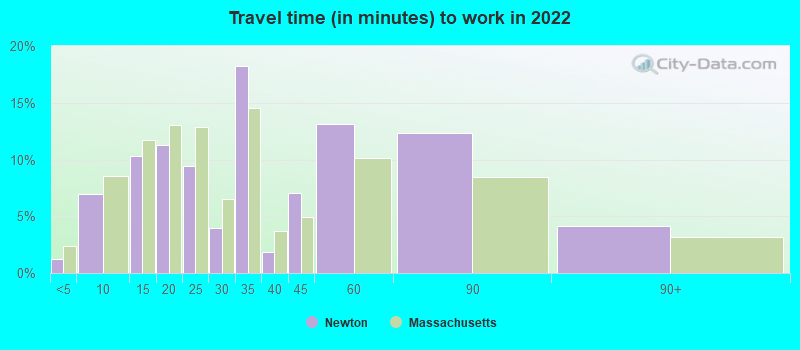
- Mean travel time to work (commute): 16.9 minutes
| Here: | 10.1 |
| Massachusetts average: | 13.0 |
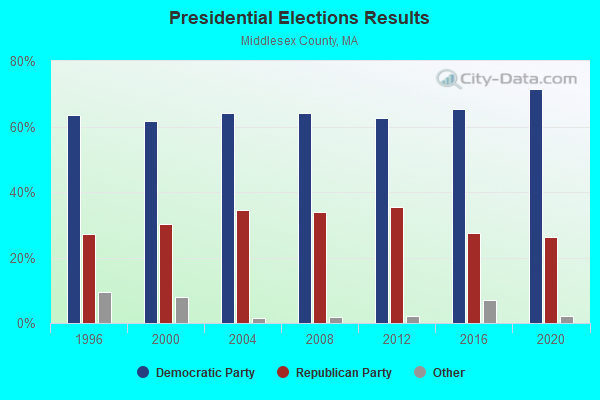
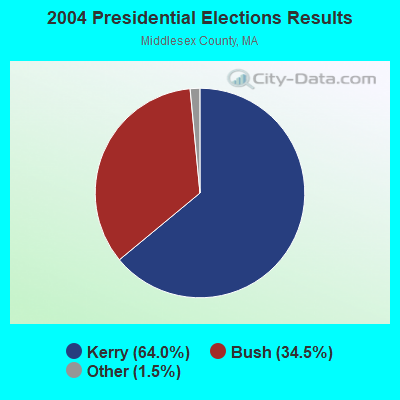
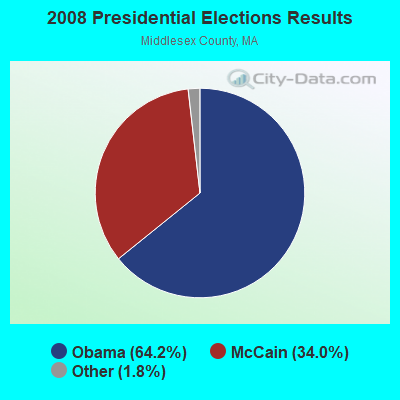
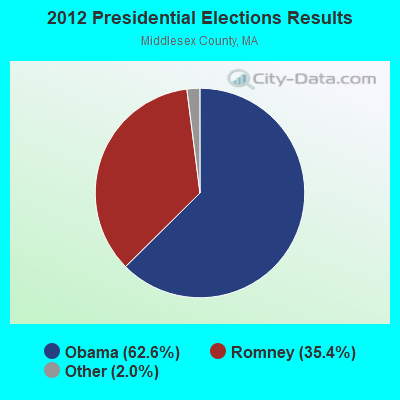
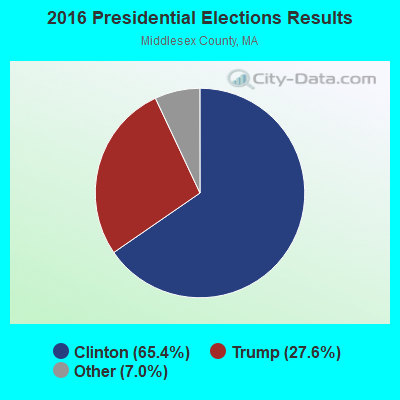
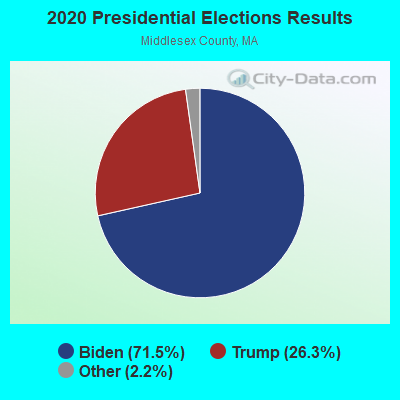
Graphs represent county-level data. Detailed 2008 Election Results
Neighborhoods in Newton:
(Newton, Massachusetts Neighborhood Map)Religion statistics for Newton, MA (based on Middlesex County data)
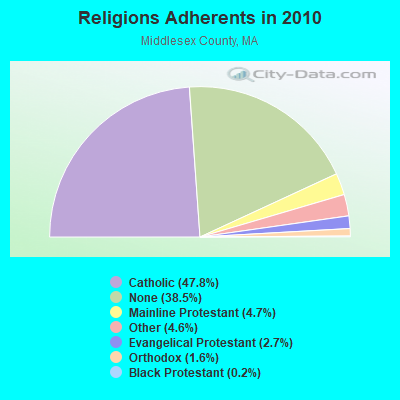
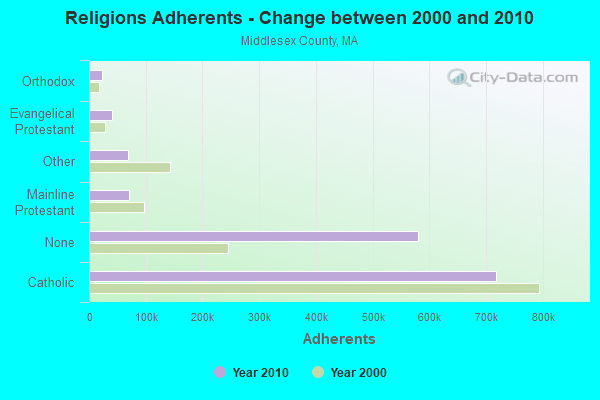
| Religion | Adherents | Congregations |
|---|---|---|
| Catholic | 718,209 | 107 |
| Mainline Protestant | 70,053 | 269 |
| Other | 68,480 | 199 |
| Evangelical Protestant | 41,270 | 304 |
| Orthodox | 23,641 | 28 |
| Black Protestant | 2,276 | 8 |
| None | 579,156 | - |
Food Environment Statistics:
| Here: | 1.71 / 10,000 pop. |
| State: | 1.98 / 10,000 pop. |
| Middlesex County: | 0.03 / 10,000 pop. |
| Massachusetts: | 0.05 / 10,000 pop. |
| Here: | 2.14 / 10,000 pop. |
| Massachusetts: | 2.22 / 10,000 pop. |
| This county: | 1.38 / 10,000 pop. |
| Massachusetts: | 1.77 / 10,000 pop. |
| This county: | 7.84 / 10,000 pop. |
| Massachusetts: | 8.76 / 10,000 pop. |
| Middlesex County: | 7.8% |
| State: | 8.1% |
| Middlesex County: | 21.5% |
| State: | 22.5% |
| This county: | 18.0% |
| State: | 16.5% |
Health and Nutrition:
| Newton: | 57.6% |
| State: | 50.5% |
| This city: | 58.4% |
| Massachusetts: | 48.0% |
| This city: | 27.5 |
| Massachusetts: | 28.4 |
| Newton: | 17.5% |
| Massachusetts: | 20.7% |
| Newton: | 8.7% |
| State: | 10.4% |
| Newton: | 7.0 |
| State: | 6.8 |
| Newton: | 32.6% |
| Massachusetts: | 33.4% |
| This city: | 63.7% |
| Massachusetts: | 57.1% |
| Newton: | 81.6% |
| Massachusetts: | 79.2% |
More about Health and Nutrition of Newton, MA Residents
| Local government employment and payroll (March 2022) | |||||
| Function | Full-time employees | Monthly full-time payroll | Average yearly full-time wage | Part-time employees | Monthly part-time payroll |
|---|---|---|---|---|---|
| Elementary and Secondary - Instruction | 2,016 | $13,768,382 | $81,955 | 619 | $2,164,739 |
| Elementary and Secondary - Other Total | 231 | $1,572,322 | $81,679 | 47 | $31,630 |
| Firefighters | 181 | $1,973,137 | $130,816 | 0 | $0 |
| Streets and Highways | 142 | $1,022,488 | $86,407 | 2 | $2,247 |
| Police Protection - Officers | 125 | $1,400,990 | $134,495 | 16 | $27,228 |
| Other Government Administration | 72 | $637,849 | $106,308 | 9 | $25,611 |
| Police - Other | 56 | $473,369 | $101,436 | 47 | $52,955 |
| Financial Administration | 56 | $392,061 | $84,013 | 1 | $2,375 |
| Local Libraries | 43 | $241,078 | $67,278 | 41 | $50,141 |
| Health | 42 | $264,689 | $75,625 | 2 | $3,482 |
| Other and Unallocable | 35 | $146,736 | $50,309 | 0 | $0 |
| Parks and Recreation | 30 | $207,655 | $83,062 | 36 | $25,682 |
| Water Supply | 16 | $102,185 | $76,639 | 0 | $0 |
| Sewerage | 13 | $91,549 | $84,507 | 0 | $0 |
| Judicial and Legal | 12 | $98,840 | $98,840 | 0 | $0 |
| Fire - Other | 10 | $82,162 | $98,594 | 0 | $0 |
| Solid Waste Management | 7 | $42,514 | $72,881 | 0 | $0 |
| Natural Resources | 6 | $37,626 | $75,252 | 0 | $0 |
| Welfare | 5 | $34,235 | $82,164 | 1 | $2,076 |
| Totals for Government | 3,098 | $22,589,865 | $87,501 | 821 | $2,388,165 |
Newton government finances - Expenditure in 2021 (per resident):
- Construction - General Public Buildings: $99,000 ($1.13)
- Current Operations - Elementary and Secondary Education: $278,984,000 ($3192.73)
General - Other: $40,262,000 ($460.76)
Sewerage: $26,724,000 ($305.83)
Local Fire Protection: $22,514,000 ($257.65)
Police Protection: $19,689,000 ($225.32)
Water Utilities: $18,367,000 ($210.19)
Solid Waste Management: $9,864,000 ($112.88)
Regular Highways: $9,727,000 ($111.32)
Parks and Recreation: $6,237,000 ($71.38)
Libraries: $4,417,000 ($50.55)
Housing and Community Development: $4,337,000 ($49.63)
Central Staff Services: $4,272,000 ($48.89)
General Public Buildings: $4,242,000 ($48.55)
Health - Other: $3,476,000 ($39.78)
Financial Administration: $2,648,000 ($30.30)
Judicial and Legal Services: $1,491,000 ($17.06)
Protective Inspection and Regulation - Other: $1,462,000 ($16.73)
Public Welfare - Other: $186,000 ($2.13)
Natural Resources - Other: $141,000 ($1.61)
- General - Interest on Debt: $11,308,000 ($129.41)
- Intergovernmental to Local - Other - Elementary and Secondary Education: $1,481,000 ($16.95)
Other - Central Staff Services: $48,000 ($0.55)
Other - Health - Other: $45,000 ($0.51)
Other - Transit Utilities: $2,000 ($0.02)
- Intergovernmental to State - Transit Utilities: $5,968,000 ($68.30)
General - Other: $105,000 ($1.20)
- Other Capital Outlay - General - Other: $10,991,000 ($125.78)
Elementary and Secondary Education: $10,205,000 ($116.79)
Sewerage: $6,426,000 ($73.54)
Regular Highways: $3,790,000 ($43.37)
Water Utilities: $3,227,000 ($36.93)
Police Protection: $276,000 ($3.16)
Local Fire Protection: $252,000 ($2.88)
Protective Inspection and Regulation - Other: $202,000 ($2.31)
General Public Building: $199,000 ($2.28)
Parks and Recreation: $150,000 ($1.72)
Housing and Community Development: $93,000 ($1.06)
Natural Resources - Other: $66,000 ($0.76)
Financial Administration: $14,000 ($0.16)
- Total Salaries and Wages: $186,258,000 ($2131.56)
- Water Utilities - Interest on Debt: $498,000 ($5.70)
Newton government finances - Revenue in 2021 (per resident):
- Charges - Sewerage: $33,924,000 ($388.23)
Other: $8,464,000 ($96.86)
Elementary and Secondary Education - Other: $1,592,000 ($18.22)
Elementary and Secondary Education School Lunch: $681,000 ($7.79)
Elementary and Secondary Education School Tuition and Transportation: $326,000 ($3.73)
Parks and Recreation: $7,000 ($0.08)
- Federal Intergovernmental - Other: $34,376,000 ($393.40)
Education: $6,970,000 ($79.77)
Housing and Community Development: $4,142,000 ($47.40)
Highways: $68,000 ($0.78)
- Miscellaneous - General Revenue - Other: $3,084,000 ($35.29)
Interest Earnings: $608,000 ($6.96)
Donations From Private Sources: $350,000 ($4.01)
Fines and Forfeits: $193,000 ($2.21)
Special Assessments: $44,000 ($0.50)
- Revenue - Water Utilities: $27,887,000 ($319.14)
- State Intergovernmental - Education: $45,134,000 ($516.52)
General Local Government Support: $6,677,000 ($76.41)
Highways: $4,467,000 ($51.12)
Other: $1,207,000 ($13.81)
Housing and Community Development: $121,000 ($1.38)
Public Welfare: $20,000 ($0.23)
- Tax - Property: $393,886,000 ($4507.68)
Other License: $8,575,000 ($98.13)
Other Selective Sales: $2,035,000 ($23.29)
Newton government finances - Debt in 2021 (per resident):
- Long Term Debt - Beginning Outstanding - Unspecified Public Purpose: $342,824,000 ($3923.32)
Outstanding Unspecified Public Purpose: $329,381,000 ($3769.48)
Retired Unspecified Public Purpose: $19,168,000 ($219.36)
Issue, Unspecified Public Purpose: $5,725,000 ($65.52)
- Short Term Debt Outstanding - End of Fiscal Year: $5,309,000 ($60.76)
Newton government finances - Cash and Securities in 2021 (per resident):
- Bond Funds - Cash and Securities: $35,416,000 ($405.31)
- Other Funds - Cash and Securities: $220,413,000 ($2522.44)
6.91% of this county's 2021 resident taxpayers lived in other counties in 2020 ($102,955 average adjusted gross income)
| Here: | 6.91% |
| Massachusetts average: | 6.35% |
0.01% of residents moved from foreign countries ($137 average AGI)
Middlesex County: 0.01% Massachusetts average: 0.01%
Top counties from which taxpayers relocated into this county between 2020 and 2021:
| from Suffolk County, MA | |
| from Essex County, MA | |
| from Norfolk County, MA |
8.22% of this county's 2020 resident taxpayers moved to other counties in 2021 ($123,369 average adjusted gross income)
| Here: | 8.22% |
| Massachusetts average: | 7.18% |
0.01% of residents moved to foreign countries ($124 average AGI)
Middlesex County: 0.01% Massachusetts average: 0.02%
Top counties to which taxpayers relocated from this county between 2020 and 2021:
| to Suffolk County, MA | |
| to Essex County, MA | |
| to Worcester County, MA |
| Businesses in Newton, MA | ||||
| Name | Count | Name | Count | |
|---|---|---|---|---|
| AT&T | 1 | Nissan | 1 | |
| CVS | 2 | Panera Bread | 1 | |
| Chipotle | 1 | Quiznos | 1 | |
| Curves | 1 | RadioShack | 1 | |
| Domino's Pizza | 1 | Starbucks | 3 | |
| Dunkin Donuts | 9 | Subway | 1 | |
| FedEx | 22 | T-Mobile | 1 | |
| Holiday Inn | 2 | T.J.Maxx | 1 | |
| Jones New York | 1 | Toys"R"Us | 1 | |
| Marriott | 1 | True Value | 2 | |
| Marshalls | 1 | UPS | 7 | |
| MasterBrand Cabinets | 9 | Walgreens | 2 | |
| McDonald's | 3 | Whole Foods Market | 2 | |
| Nike | 1 | YMCA | 2 | |
Strongest AM radio stations in Newton:
- WWZN (1510 AM; 50 kW; BOSTON, MA; Owner: ROSE CITY RADIO CORPORATION)
- WRCA (1330 AM; 25 kW; WALTHAM, MA; Owner: WRCA LICENSE, LLC)
- WEEI (850 AM; 50 kW; BOSTON, MA; Owner: ENTERCOM BOSTON LICENSE, LLC)
- WNTN (1550 AM; 10 kW; NEWTON, MA; Owner: COLT COMMUNICATIONS, LLC)
- WUNR (1600 AM; 20 kW; BROOKLINE, MA; Owner: CHAMPION BROADCASTING SYSTEMS, INC.)
- WRKO (680 AM; 50 kW; BOSTON, MA; Owner: ENTERCOM BOSTON LICENSE, LLC)
- WKOX (1200 AM; 50 kW; FRAMINGHAM, MA; Owner: CAPSTAR TX LIMITED PARTNERSHIP)
- WBIX (1060 AM; 40 kW; NATICK, MA; Owner: LANGER BROADCASTING CORPORATION)
- WAMG (890 AM; 25 kW; DEDHAM, MA; Owner: MEGA COMMUNICATIONS OF DEDHAM LICENSEE, LLC)
- WBPS (1150 AM; 5 kW; BOSTON, MA; Owner: MEGA COMMUNICATIONS OF BOSTON LICENSEE, L.L.C.)
- WBZ (1030 AM; 50 kW; BOSTON, MA; Owner: INFINITY BROADCASTING OPERATIONS, INC.)
- WEZE (590 AM; 5 kW; BOSTON, MA; Owner: NEW ENGLAND CONTINENTAL MEDIA, INC.)
- WILD (1090 AM; daytime; 5 kW; BOSTON, MA; Owner: RADIO ONE OF BOSTON LICENSES, LLC)
Strongest FM radio stations in Newton:
- WBMX (98.5 FM; BOSTON, MA; Owner: INFINITY RADIO OPERATIONS INC.)
- WJMN (94.5 FM; BOSTON, MA; Owner: AMFM RADIO LICENSES, L.L.C.)
- WCRB (102.5 FM; WALTHAM, MA; Owner: CHARLES RIVER BROADCASTING WCRB LICE)
- WTKK (96.9 FM; BOSTON, MA; Owner: GREATER BOSTON RADIO, INC.)
- WROR-FM (105.7 FM; FRAMINGHAM, MA; Owner: GREATER BOSTON RADIO, INC.)
- WBOS (92.9 FM; BROOKLINE, MA; Owner: GREATER BOSTON RADIO, INC.)
- WBUR-FM (90.9 FM; BOSTON, MA; Owner: TRUSTEES OF BOSTON UNIVERSITY)
- WGBH (89.7 FM; BOSTON, MA; Owner: WGBH EDUCATIONAL FOUNDATION)
- WODS (103.3 FM; BOSTON, MA; Owner: INFINITY BROADCASTING OPERATIONS, INC.)
- WZBC (90.3 FM; NEWTON, MA; Owner: TRUSTEES OF BOSTON COLLEGE)
- WXKS-FM (107.9 FM; MEDFORD, MA; Owner: AMFM RADIO LICENSES, L.L.C.)
- WMJX (106.7 FM; BOSTON, MA; Owner: GREATER BOSTON RADIO, INC.)
- WBCN (104.1 FM; BOSTON, MA; Owner: HEMISPHERE BROADCASTING CORPORATION)
- WZLX (100.7 FM; BOSTON, MA; Owner: INFINITY BROADCASTING CORPORATION OF BOSTON)
- WERS (88.9 FM; BOSTON, MA; Owner: EMERSON COLLEGE)
- W267AI (101.3 FM; BOSTON, MA; Owner: MCC BROADCASTING COMPANY, INC.)
- WHRB (95.3 FM; CAMBRIDGE, MA; Owner: HARVARD RADIO BROADCASTING CO., INC.)
- WBRS (100.1 FM; WALTHAM, MA; Owner: BRANDEIS UNIVERSITY)
- WFNX (101.7 FM; LYNN, MA; Owner: MCC BROADCASTING COMPANY, INC.)
- WMBR (88.1 FM; CAMBRIDGE, MA; Owner: TECHNOLOGY BROADCASTING CORPORATION)
TV broadcast stations around Newton:
- WHDH-TV (Channel 7; BOSTON, MA; Owner: WHDH-TV)
- WCVB-TV (Channel 5; BOSTON, MA; Owner: WCVB HEARST-ARGYLE TV, INC.)
- WGBH-TV (Channel 2; BOSTON, MA; Owner: WGBH EDUCATIONAL FOUNDATION)
- WMFP (Channel 62; LAWRENCE, MA; Owner: WSAH LICENSE, INC.)
- WBZ-TV (Channel 4; BOSTON, MA; Owner: VIACOM INC.)
- WGBX-TV (Channel 44; BOSTON, MA; Owner: WGBH EDUCATIONAL FOUNDATION)
- WSBK-TV (Channel 38; BOSTON, MA; Owner: VIACOM INC.)
- WLVI-TV (Channel 56; CAMBRIDGE, MA; Owner: WLVI, INC.)
- WFXT (Channel 25; BOSTON, MA; Owner: FOX TELEVISION STATIONS INC.)
- W40BO (Channel 40; BOSTON, MA; Owner: PAXSON COMMUNICATIONS LPTV, INC.)
- WBPX (Channel 68; BOSTON, MA; Owner: PAXSON BOSTON-68 LICENSE, INC.)
- WTMU-LP (Channel 32; BOSTON, MA; Owner: ZGS BOSTON, INC.)
- WCEA-LP (Channel 58; BOSTON, MA; Owner: CHANNEL 19 TV CORPORATION)
- WUTF (Channel 66; MARLBOROUGH, MA; Owner: TELEFUTURA BOSTON LLC)
- WUNI (Channel 27; WORCESTER, MA; Owner: ENTRAVISION HOLDINGS, LLC)
- WWDP (Channel 46; NORWELL, MA; Owner: NORWELL TELEVISION, LLC)
- WFXZ-CA (Channel 24; BOSTON, MA; Owner: BOSTON BROADCASTING CORP.)
- WLNE-TV (Channel 6; NEW BEDFORD, MA; Owner: FREEDOM BROADCASTING OF SOUTHERN NEW ENGLAND, INC.)
- WNAC-TV (Channel 64; PROVIDENCE, RI; Owner: WNAC, LLC)
- WPRI-TV (Channel 12; PROVIDENCE, RI; Owner: TVL BROADCASTING OF RHODE ISLAND, LLC)
- WJAR (Channel 10; PROVIDENCE, RI; Owner: OUTLET BROADCASTING, INC.)
- WSBE-TV (Channel 36; PROVIDENCE, RI; Owner: RHODE ISLAND PUBLIC TELECOM. AUTHORITY)
- WNDS (Channel 50; DERRY, NH; Owner: CTV OF DERRY, INC)
Medal of Honor Recipients
Medal of Honor Recipients born in Newton: Charles Church Roberts, David G. Ouellet, Robert F. Foley.
- National Bridge Inventory (NBI) Statistics
- 96Number of bridges
- 860ft / 262mTotal length
- $315,947,000Total costs
- 4,093,384Total average daily traffic
- 159,646Total average daily truck traffic
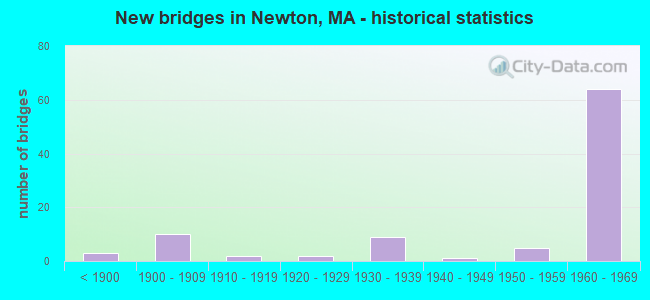
- New bridges - historical statistics
- 3Before 1900
- 101900-1909
- 21910-1919
- 21920-1929
- 91930-1939
- 11940-1949
- 51950-1959
- 641960-1969
FCC Registered Commercial Land Mobile Towers: 4 (See the full list of FCC Registered Commercial Land Mobile Towers in Newton, MA)
FCC Registered Private Land Mobile Towers: 3 (See the full list of FCC Registered Private Land Mobile Towers)
FCC Registered Broadcast Land Mobile Towers: 32 (See the full list of FCC Registered Broadcast Land Mobile Towers)
FCC Registered Microwave Towers: 46 (See the full list of FCC Registered Microwave Towers in this town)
FCC Registered Paging Towers: 1 (See the full list of FCC Registered Paging Towers)
FCC Registered Amateur Radio Licenses: 218 (See the full list of FCC Registered Amateur Radio Licenses in Newton)
FAA Registered Aircraft: 25 (See the full list of FAA Registered Aircraft in Newton)
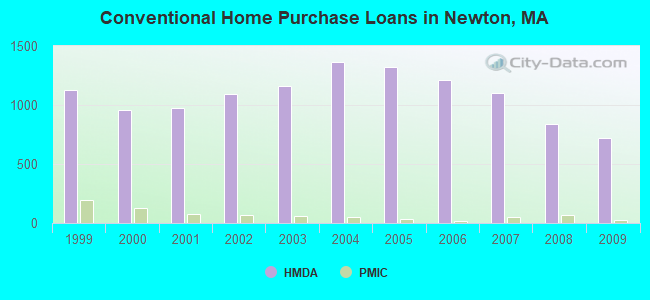
| Home Mortgage Disclosure Act Aggregated Statistics For Year 2009 (Based on 18 full tracts) | ||||||||||||
| A) FHA, FSA/RHS & VA Home Purchase Loans | B) Conventional Home Purchase Loans | C) Refinancings | D) Home Improvement Loans | E) Loans on Dwellings For 5+ Families | F) Non-occupant Loans on < 5 Family Dwellings (A B C & D) | |||||||
|---|---|---|---|---|---|---|---|---|---|---|---|---|
| Number | Average Value | Number | Average Value | Number | Average Value | Number | Average Value | Number | Average Value | Number | Average Value | |
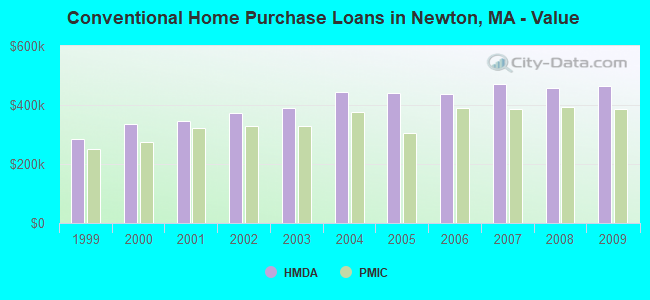
| LOANS ORIGINATED | 50 | $399,920 | 717 | $465,646 | 3,597 | $374,270 | 93 | $281,796 | 5 | $675,000 | 92 | $433,533 |
| APPLICATIONS APPROVED, NOT ACCEPTED | 1 | $533,000 | 62 | $496,532 | 208 | $430,038 | 7 | $364,857 | 0 | $0 | 11 | $513,636 |
| APPLICATIONS DENIED | 10 | $401,500 | 78 | $434,731 | 493 | $457,564 | 20 | $381,900 | 1 | $102,000 | 30 | $367,367 |
| APPLICATIONS WITHDRAWN | 2 | $512,500 | 95 | $485,189 | 397 | $403,940 | 9 | $327,111 | 0 | $0 | 22 | $389,364 |
| FILES CLOSED FOR INCOMPLETENESS | 2 | $349,000 | 25 | $413,400 | 136 | $393,816 | 2 | $1,220,000 | 0 | $0 | 5 | $318,400 |
Detailed mortgage data for all 18 tracts in Newton, MA
| Private Mortgage Insurance Companies Aggregated Statistics For Year 2009 (Based on 16 full tracts) | ||||
| A) Conventional Home Purchase Loans | B) Refinancings | |||
|---|---|---|---|---|
| Number | Average Value | Number | Average Value | |
| LOANS ORIGINATED | 26 | $387,500 | 18 | $350,667 |
| APPLICATIONS APPROVED, NOT ACCEPTED | 8 | $468,750 | 4 | $374,750 |
| APPLICATIONS DENIED | 14 | $384,429 | 7 | $378,857 |
| APPLICATIONS WITHDRAWN | 2 | $404,500 | 2 | $461,000 |
| FILES CLOSED FOR INCOMPLETENESS | 4 | $321,500 | 1 | $340,000 |
2002 - 2018 National Fire Incident Reporting System (NFIRS) incidents
- Fire incident types reported to NFIRS in Newton, MA
- 1,86360.2%Structure Fires
- 87028.1%Outside Fires
- 2789.0%Mobile Property/Vehicle Fires
- 822.7%Other
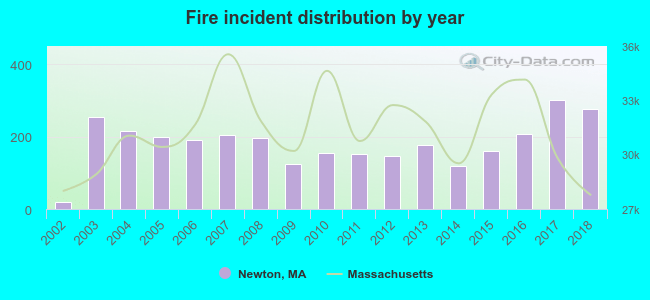 Based on the data from the years 2002 - 2018 the average number of fire incidents per year is 182. The highest number of fire incidents - 300 took place in 2017, and the least - 18 in 2002. The data has a growing trend.
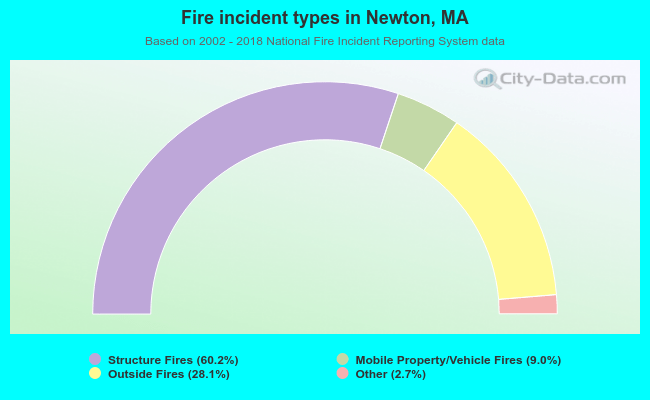 When looking into fire subcategories, the most incidents belonged to: Structure Fires (60.2%), and Outside Fires (28.1%).
Fire-safe hotels and motels in Newton, Massachusetts:
- Hotel Indigo Boston - Newton Riverside, 399 Grove St, Newton, Massachusetts 02462 , Phone: (617) 969-5300, Fax: (617) 965-3493
- Crowne Plaza Boston-Newton, 320 Washington St, Newton, Massachusetts 02458 , Phone: (617) 969-3010
| Most common first names in Newton, MA among deceased individuals | ||
| Name | Count | Lived (average) |
|---|---|---|
| Mary | 761 | 80.9 years |
| John | 459 | 74.8 years |
| Joseph | 323 | 76.5 years |
| William | 266 | 76.3 years |
| Margaret | 259 | 82.2 years |
| Helen | 230 | 79.6 years |
| James | 217 | 75.1 years |
| Anna | 193 | 82.8 years |
| Edward | 189 | 76.6 years |
| George | 189 | 75.4 years |
| Most common last names in Newton, MA among deceased individuals | ||
| Last name | Count | Lived (average) |
|---|---|---|
| Murphy | 97 | 77.8 years |
| Cohen | 86 | 80.5 years |
| Smith | 78 | 78.7 years |
| Brown | 63 | 79.6 years |
| Sullivan | 62 | 79.7 years |
| Johnson | 45 | 79.2 years |
| White | 45 | 80.5 years |
| Miller | 44 | 80.3 years |
| Macdonald | 39 | 77.9 years |
| Levine | 36 | 79.2 years |
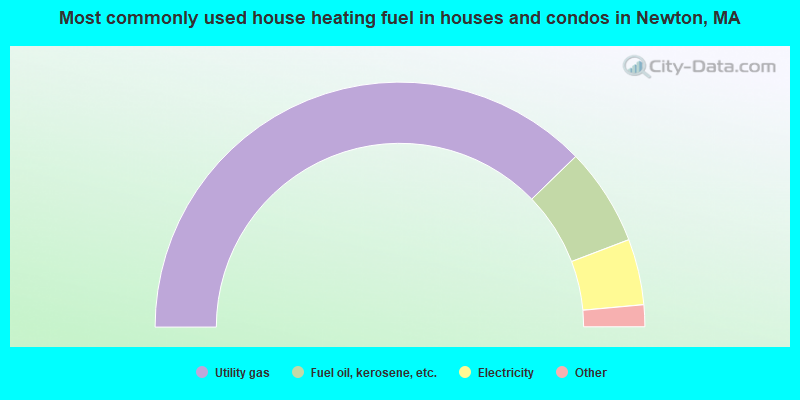
- 75.5%Utility gas
- 12.9%Fuel oil, kerosene, etc.
- 8.7%Electricity
- 1.9%Bottled, tank, or LP gas
- 0.6%Other fuel
- 0.5%Solar energy
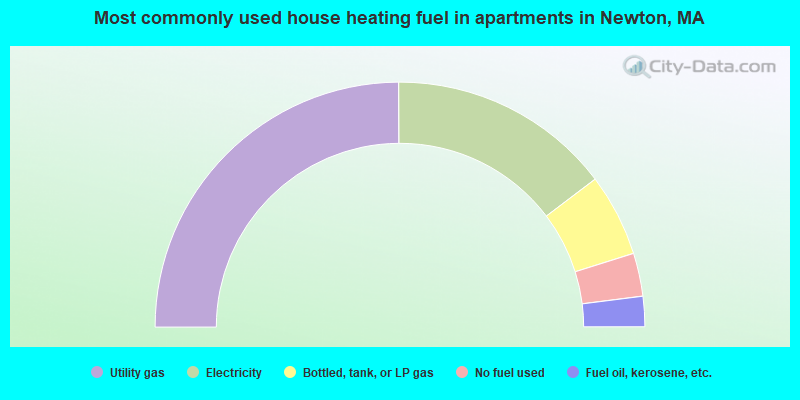
- 49.8%Utility gas
- 29.5%Electricity
- 10.9%Bottled, tank, or LP gas
- 5.7%No fuel used
- 4.0%Fuel oil, kerosene, etc.
Newton compared to Massachusetts state average:
- Median household income above state average.
- Median house value above state average.
- Unemployed percentage significantly below state average.
- Black race population percentage significantly below state average.
- Hispanic race population percentage significantly below state average.
- Percentage of population with a bachelor's degree or higher significantly above state average.
Newton on our top lists:
- #2 on the list of "Top 101 cities with the lowest number of auto thefts per 100,000 residents (population 50,000+)"
- #3 on the list of "Top 101 cities with the most people having professional degrees (population 50,000+)"
- #3 on the list of "Top 100 best educated cities (highest percentage of bachelor degree holding residents) (pop. 50,000+)"
- #6 on the list of "Top 101 cities with the most people having Doctorate degrees (population 50,000+)"
- #6 on the list of "Top 101 cities with largest percentage of females in occupations: arts, design, entertainment, sports, and media occupations (population 50,000+)"
- #6 on the list of "Top 101 cities with largest percentage of males in occupations: health diagnosing and treating practitioners and other technical occupations (population 50,000+)"
- #6 on the list of "Top 101 cities with largest percentage of males in occupations: legal occupations (population 50,000+)"
- #7 on the list of "Top 101 cities with the biggest property tax revenues per resident (population 10,000+)"
- #7 on the list of "Top 101 cities with the smallest city-data.com crime index per police officer (population 50,000+)"
- #8 on the list of "Top 101 cities with the most people having Master's or Doctorate degrees (population 50,000+)"
- #8 on the list of "Top 101 cities with the highest average wind speeds (population 50,000+)"
- #10 on the list of "Top 101 cities with largest percentage of females in occupations: life, physical, and social science occupations (population 50,000+)"
- #10 on the list of "Top 100 cities with highest median household income (pop. 50,000+)"
- #11 on the list of "Top 101 cities with largest percentage of males in industries: health care and social assistance (population 50,000+)"
- #11 on the list of "Top 101 cities with the lowest city-data.com crime index (population 50,000+)"
- #12 on the list of "Top 101 cities with the lowest number of thefts per 100,000 residents (population 50,000+)"
- #12 on the list of "Top 101 cities with largest percentage of males in occupations: life, physical, and social science occupations (population 50,000+)"
- #12 on the list of "Top 101 cities with largest percentage of females in occupations: health diagnosing and treating practitioners and other technical occupations (population 50,000+)"
- #17 on the list of "Top 100 safest cities (lowest city-data.com crime index) (pop. 50,000+)"
- #20 on the list of "Top 101 cities with largest percentage of males in industries: educational services (population 50,000+)"
- #12 (02468) on the list of "Top 101 zip codes with the largest percentage of taxpayers reporting taxable interest in 2012 (pop 5,000+)"
- #15 (02468) on the list of "Top 101 zip codes with the largest percentage of taxpayers reporting net capital gain/loss in 2012 (pop 5,000+)"
- #16 (02468) on the list of "Top 101 zip codes with the largest percentage of taxpayers using charity contributions deductions in 2012 (pop 5,000+)"
- #38 (02468) on the list of "Top 101 zip codes with the highest 2012 average reported profit/loss from business (pop 5,000+)"
- #50 (02468) on the list of "Top 101 zip codes with the largest percentage of taxpayers reporting profit/loss from business in 2012 (pop 5,000+)"
- #80 (02459) on the list of "Top 101 zip codes with the largest percentage of Ukrainian first ancestries (pop 5,000+)"
- #80 (02468) on the list of "Top 101 zip codes with the highest average reported salary/wage in 2012 (pop 5,000+)"
- #87 (02468) on the list of "Top 101 zip codes with the largest percentage of Lithuanian first ancestries (pop 5,000+)"
- #88 (02468) on the list of "Top 101 zip codes with the largest percentage of Russian first ancestries"
- #97 (02465) on the list of "Top 101 zip codes with the highest 2012 average net capital gain/loss (pop 5,000+)"
- #98 (02468) on the list of "Top 101 zip codes with the largest percentage of Greek first ancestries (pop 5,000+)"
- #4 on the list of "Top 101 counties with the most Orthodox adherents"
- #7 on the list of "Top 101 counties with the most Catholic adherents"
- #7 on the list of "Top 101 counties with the most Mainline Protestant congregations"
- #7 on the list of "Top 101 counties with the most Orthodox congregations"
- #8 on the list of "Top 101 counties with the lowest percentage of residents that keep firearms around their homes"

|
|
Total of 7236 patent applications in 2008-2024.