Boston, Massachusetts and North Hempstead, New York are both desirable places to live or visit, but they offer different experiences. Boston, one of America's oldest cities, charms visitors with its historic sites, harbor setting, and vibrant culture. North Hempstead, with its suburban feel, is an attractive destination for those looking for a more relaxed environment. Here, we'll compare these cities across different aspects including crime and safety, cost of living, education, and more, to provide a comprehensive comparison of living in these two unique locations.
Distance between
Boston, MA and
North Hempstead, NY : 170.7 miles
Boston's population is larger by 189%. Its population has grown by 65,635 people (11.1%) since 2000. The population of North Hempstead has grown by 3,711 people (1.7%) during that time.
Safety is a significant consideration when choosing where to move. Boston and North Hempstead both have lower crime rates compared to the national average. However, North Hempstead's crime rate is lower than Boston's. The closer proximity to New York City potentially influences the higher crime rate in Boston. Visitors to both cities should exercise the usual caution in urban areas, particularly at night.
Cost of Living
Cost of living is another critical aspect of relocation. Generally, Boston has a higher cost of living, especially when it comes to housing and healthcare. However, North Hempstead isn't cheap either, due to its close proximity to New York City. Food, utilities, and transportation are relatively comparable in both cities.
Income Tax
In terms of income tax, Massachusetts imposes a flat rate of 5.05%, while New York applies a progressive tax rate that can reach up to 8.82%. This difference could significantly impact workers with higher incomes.
Property Tax
Property taxes are also higher in North Hempstead compared to Boston. Significant differences in property tax rates can influence homeownership costs and can be a deciding factor when choosing where to live.
Sales Tax
The sales tax is slightly lower in Boston at 6.25%, compared to 8.63% in North Hempstead. This difference can impact the overall cost of living, particularly for those who tend to make large purchases.
Income
Type
Boston
North Hempstead
Estimated median household income
$79,283
$141,417
Estimated per capita income
$50,337
$71,121
Cost of living index (U.S. average is 100)
143.8
173.2
If you make $50,000 in Boston, you will have to make $60,223 in North Hempstead to maintain the same standard of living.
Geographical Conditions
Boston is located on the Eastern Seaboard, boasting a gorgeous harbor and numerous parks. North Hempstead is located on Long Island and offers beautiful beaches, harbors, and conservation areas.
Both cities excel in education. Boston is renowned for its universities, including Harvard and MIT, while North Hempstead has excellent primary and secondary schools. The high level of education in Boston provides an excellent environment for students, while North Hempstead's outstanding schooling system is great for families with children.
Both cities have robust economies, but they cater to different industries. Boston is a hub for technology, education, and healthcare, with many job opportunities in these sectors. In contrast, North Hempstead's economy is more diverse, with retail, healthcare, and professional services among its top industries. Unemployment rates in both areas are typically lower than the national average.
Biggest Employers
Boston's biggest employers are primarily in the educational and healthcare sectors, including Boston University, Massachusetts General Hospital, and Brigham and Women’s Hospital. In North Hempstead, top employers include Northwell Health, Winthrop-University Hospital, and the Town of North Hempstead.
Building permits
Type
Average value
Count
City
Boston
North Hempstead
Boston
North Hempstead
1997
$105,700
$144,100
85
55
1998
$92,600
$144,100
88
55
1999
$105,800
$104,800
127
81
2000
$111,900
$180,400
96
46
2001
$134,300
$174,000
78
57
2002
$144,700
$207,200
71
71
2003
$151,900
$181,600
100
122
2004
$160,600
$287,900
102
104
2005
$173,400
$281,700
97
96
2006
$190,600
$305,800
94
74
2007
$199,900
$281,500
48
18
2008
$216,200
$377,300
23
38
2009
$224,400
$342,600
38
14
2010
$214,700
$373,500
23
33
2011
$218,700
$399,700
33
28
2012
$230,500
$332,100
40
18
2013
$233,000
$413,400
34
24
2014
$239,900
$347,100
48
45
2015
$254,600
$347,000
48
56
2016
$260,900
$382,400
56
48
2017
$264,200
$428,900
52
49
2018
$266,500
$619,700
49
43
2019
$264,000
$515,300
37
37
2020
$380,500
$448,900
24
30
2021
$350,000
$497,800
53
11
There were 53 building permits issued in Boston in 2012 (20 more than in 2011) compared to 11 building permits issued in North Hempstead in 2012 (17 less than in 2011).
In Boston (Suffolk County), 77.4% voted for Democrats and 20.8% for Republicans in 2012 Presidential Election. In North Hempstead (Nassau County), 53.4% voted for Democrats and 45.7% for Republicans.
Elections
Type
Democrats
Republicans
Other
Year
Boston
North Hempstead
Boston
North Hempstead
Boston
North Hempstead
2020
80.6%
54.3%
17.5%
44.7%
1.9%
1.0%
2016
78.5%
51.2%
16.1%
45.3%
5.4%
3.4%
2012
77.4%
53.4%
20.8%
45.7%
1.8%
0.9%
2008
76.9%
54.0%
21.2%
45.6%
1.8%
0.4%
2004
75.9%
52.3%
22.8%
46.7%
1.3%
1.0%
2000
71.5%
58.0%
20.5%
38.5%
8.0%
3.5%
1996
73.0%
55.7%
19.9%
36.1%
7.0%
8.1%
Breakdown of population affiliated with a religious congregation
Type
Adherents
Congregations
Religion
Boston
North Hempstead
Boston
North Hempstead
CATHOLIC CHURCH
46.1%
50.6%
12.4%
9.7%
AMERICAN BAPTIST CHURCHES IN THE USA
1.2%
0.2%
8.9%
1.6%
MUSLIM ESTIMATE
1.1%
1.2%
2.4%
1.5%
EPISCOPAL CHURCH
1.0%
0.9%
4.7%
5.4%
SEVENTH DAY ADVENTIST CHURCH
0.7%
0.2%
4.0%
3.2%
SOUTHERN BAPTIST CONVENTION
0.6%
0.0%
6.9%
0.7%
LUTHERAN CHURCH
0.1%
0.3%
0.4%
1.1%
EVANGELICAL LUTHERAN CHURCH IN AMERICA
0.0%
1.1%
0.7%
5.0%
Weather
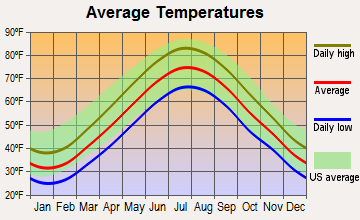
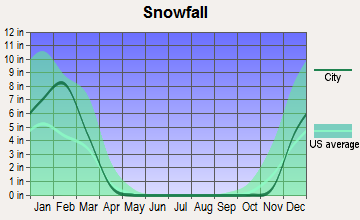
While both cities experience four distinct seasons, there are noticeable differences in their climates. Boston tends to have colder winters with more snow, while North Hempstead has milder winters and more rain throughout the year. Summers in both cities are generally warm, but Boston's coastal location can lead to cooler temperatures and sea breezes.
Weather and climate
Type
Boston
North Hempstead
Temperature - Average
50.6°F
53.2°F
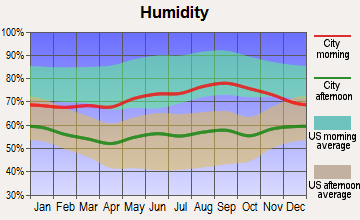
Humidity - Average morning or afternoon humidity
69.9%
68.6%
Humidity - Differences between morning and afternoon humidity
23.1%
25.2%
Humidity - Maximum monthly morning or afternoon humidity
78%
76.4%
Humidity - Minimum monthly morning or afternoon humidity
55%
51.2%
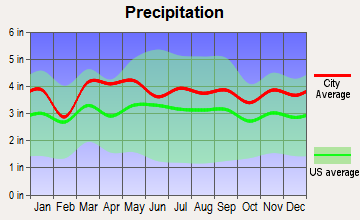
Precipitation - Yearly average
46.3 in
45.5 in
Snowfall - Yearly average
88.3 in
52.7 in
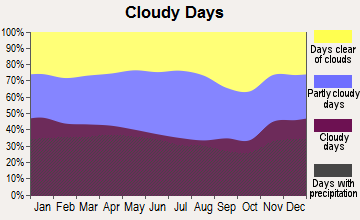
Clouds - Number of days clear of clouds
16.4%
16.4%
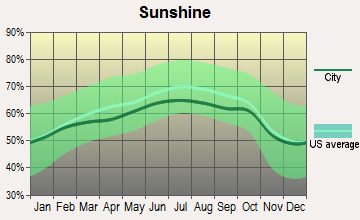
Sunshine amount - Average
63.7%
60.2%
Sunshine amount - Differences during a year
20%
20%
Sunshine amount - Maximum monthly
68%
64%
Sunshine amount - Minimum monthly
48%
44%
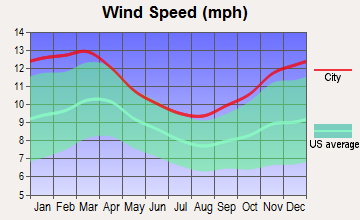
Wind speed - Average
12.5 mph
11.5 mph
Average climate in Boston, Massachusetts
Average climate in North Hempstead, New York
Air pollution
Type
AQI
CO
NO2
OZONE
PB
PM10
PM25
SO2
Year
Boston
North Hempstead
Boston
North Hempstead
Boston
North Hempstead
Boston
North Hempstead
North Hempstead
North Hempstead
Boston
North Hempstead
Boston
North Hempstead
2018
76
96
0.24
0.28
12.3
15.9
26.1
25.3
N/A
N/A
N/A
N/A
9.2
6.7
0.5
0.3
2017
83
95
0.26
0.17
12.5
16.2
26.4
25.5
N/A
N/A
N/A
N/A
8.9
6.7
0.6
0.4
2016
75
96
0.27
0.26
14.1
16.9
24.4
25.2
N/A
N/A
N/A
N/A
7.4
6.8
0.5
0.5
2015
81
102
0.30
0.29
15.7
18.1
23.4
24.3
N/A
N/A
N/A
N/A
8.9
7.9
0.8
1.1
2014
76
95
0.30
0.31
14.0
18.0
24.5
24.1
N/A
N/A
N/A
N/A
9.3
7.8
1.2
1.3
2013
86
100
0.30
0.32
13.5
18.5
26.2
24.8
N/A
N/A
N/A
N/A
9.8
8.8
1.3
1.5
2012
89
102
0.29
0.36
11.8
18.1
23.5
25.1
N/A
N/A
N/A
N/A
9.5
9.1
1.4
1.9
2011
87
110
0.30
0.37
14.8
20.4
24.2
24.3
N/A
N/A
N/A
N/A
10.5
10.9
1.6
2.4
2010
92
108
0.26
0.42
13.8
19.5
25.0
24.5
N/A
N/A
N/A
N/A
10.0
10.0
2.3
2.6
2009
86
106
0.32
0.40
15.3
21.6
23.5
20.9
N/A
N/A
N/A
N/A
9.7
10.1
2.4
3.7
2008
96
113
0.26
0.47
16.6
22.8
22.9
21.8
0.013
N/A
N/A
N/A
12.4
11.5
3.8
4.6
2007
124
120
0.28
0.52
18.5
23.8
19.9
20.9
0.016
N/A
N/A
N/A
13.9
12.1
4.0
4.5
2006
103
116
0.38
0.52
15.8
24.0
20.9
20.3
0.018
N/A
N/A
N/A
12.5
12.8
3.5
4.7
2005
115
107
0.28
0.61
17.0
26.4
22.1
19.5
N/A
N/A
N/A
N/A
12.7
N/A
4.3
5.9
2004
104
96
0.26
0.62
15.6
26.1
22.5
18.3
0.030
N/A
N/A
N/A
13.7
N/A
4.6
5.6
2003
116
105
0.55
0.72
20.1
27.6
22.4
18.9
0.025
N/A
26.9
N/A
14.5
N/A
5.2
6.0
2002
130
115
0.35
0.67
19.8
27.6
21.8
19.5
N/A
N/A
25.6
N/A
13.5
N/A
5.0
5.4
2001
112
117
0.44
0.62
19.9
27.7
20.7
20.1
N/A
N/A
24.1
N/A
13.6
N/A
5.9
6.7
2000
88
110
0.57
0.65
18.8
27.4
19.2
18.5
N/A
N/A
22.2
N/A
10.0
N/A
5.6
6.6
Natural disasters
Type
Boston
North Hempstead
Tornado activity compared to U.S. average
55.3%
51.8%
Earthquake activity compared to U.S. average
26.6%
30.3%
Natural disasters compared to U.S. average
33%
25%
Transportation
Public transportation in Boston is extensive with its MBTA subway, bus, and ferry services. North Hempstead doesn't have its subway system but is well served by buses and has direct train access to New York City. Traffic can be a challenge in both areas, especially during rush hour.
Transport
Type
Boston
North Hempstead
Amtrak stations
3
0
Amtrak stations nearby
3
3
FAA registered aircraft
224
0
FAA registered aircraft manufacturers and dealers
4
0
Means of transportation to work
Type
Boston
North Hempstead
Bicycle
1.7%
0.2%
Bus
7.1%
2.3%
Carpooled
6.8%
9%
Car alone
54.7%
64.5%
Ferryboat
0.2%
0%
Railroad
0.5%
14.5%
Streetcar
13.5%
0%
Subway
3.2%
1.2%
Taxicab
0.4%
0.3%
Walked
10%
3.6%
Average travel time to work
Type
Boston
North Hempstead
Average
38.6 min
35.2 min
Real Estate
When it comes to real estate, both cities have expensive housing markets due to high demand and limited supply. However, in general, real estate in Boston is significantly more expensive than in North Hempstead. Both cities offer a mix of housing options, including condos, townhouses, and single-family homes.
Neighborhoods
Boston offers various neighborhoods, each with its unique vibe, like the historic Beacon Hill or the vibrant North End. North Hempstead, with its suburban setting, offers quieter neighborhoods with plenty of green spaces—Great Neck and Mineola are popular areas.
Houses and residents
Type
Boston
North Hempstead
Houses
307,025
78,927
Average household size (people)
2.3
2.9
Houses occupied
271,941 (88.6%)
76,820 (97.3%)
Houses occupied by owners
94,497 (34.7%)
60,270 (78.5%)
Houses occupied by renters
177,444 (65.3%)
16,550 (21.5%)
Median rent asked for vacant for-rent units
$2,632
$2,429
Median price asked for vacant for-sale houses and condos
$1,040,328
$543,123
Estimated median house or condo value
$659,700
$868,288
Median number of rooms in apartments
3.9
4.1
Median number of rooms in houses and condos
5.4
7
Renting percentage
66.1%
21.9%
Housing density (houses/condos per square mile)
6,340.1
1,473.1
Household income disparities
48.2%
32%
Housing units without a mortgage
1,250 (1.8%)
19,645 (37.1%)
Housing units with both a second mortgage and home equity loan
7,686 (11.2%)
164 (0.3%)
Housing units with a mortgage
67,144 (98.2%)
33,305 (62.9%)
Housing units with a home equity loan
218 (0.3%)
4,188 (7.9%)
Housing units with a second mortgage
9,540 (13.9%)
2,281 (4.3%)
Housing units lacking complete kitchen facilities
1.4%
0.4%
Housing units lacking complete plumbing facilities
Self-employed workers in own not incorporated business
11,605
8,268
State government workers
12,810
2,777
Unpaid family workers
303
297
Industries and Occupations
While both cities boast diverse industries and occupations, there are certain sectors that stand out. In Boston, the highest employing industries include healthcare and social assistance, educational services, and finance. In North Hempstead, the highest employing sectors encompass healthcare, retail, and professional services.
Both cities have high-quality healthcare facilities. Boston is renowned worldwide for its hospitals and research institutions, while North Hempstead residents benefit from nearby New York City's medical centers. Health insurance coverage is broadly similar in both areas.
Health (county statistics)
Type
Boston
North Hempstead
General health status score of residents in this county from 1 (poor) to 5 (excellent)
Boston boasts well-developed infrastructure with a large network of highways, hospitals, and public amenities. North Hempstead, being a suburban town, has a smaller infrastructure, but its proximity to New York City means easy access to world-class facilities. Both cities have reliable public utilities and services.
Infrastructure
Type
Boston
North Hempstead
TV stations
22
30
Culture and Food
In terms of culture and food, both cities have rich offerings. Boston is famous for its seafood, particularly clam chowder and lobsters, and its vibrant arts scene with numerous galleries and theaters. North Hempstead offers diverse culinary options due to its multicultural population and its proximity to NYC ensures access to world-class cultural events.
Sports Teams
For sports enthusiasts, Boston is home to several professional sports teams, including the Boston Red Sox, Boston Celtics, and New England Patriots. While North Hempstead doesn't have its own major sports teams, it's a short commute to New York City, where fans can catch the Yankees, Mets, Giants, or Knicks in action.


 Boston, MA
 North Hempstead, NY