In this article, we will compare the living conditions in two diverse cities - Bronx, NY and St. Paul, MN. This is an in-depth study for people looking to relocate or for tourists looking to explore. We will look at various dimensions like crime and safety, weather, cost of living, education, work, economy, infrastructure, industries, occupations, and more. Each city has its unique strengths and aspects that could be challenges, and this detailed comparison will cover all these aspects.
Bronx, NY, has seen an overall decrease in crime rate over the years, but it remains higher than in St. Paul, MN, which is known for its relative safety. Bronx's crime statistics reveal a higher crime rate than the national average. It's important to be aware and understand the safest neighborhoods if considering a move or visit. St. Paul has a lower crime rate than the national average, making it a safer place for families and tourists.
Cost of Living
Living in the Bronx can prove more expensive than living in St. Paul because of higher housing costs. While New York City on the whole is expensive, Bronx is relatively less expensive than Manhattan or Brooklyn, but still pricier than St. Paul. On average, utility costs, groceries, health care, and transportation are also higher in the Bronx compared to St. Paul.
Income Tax
New Yorkers pay one of the highest state income taxes in the country, with rates ranging from 4% to 8.82%. In Minnesota, tax rates vary between 5.35% and 9.85%, depending on income level. This makes both states' income tax structure progressive.
Property Tax
Property tax rates differ significantly between these two cities. The Bronx, or rather New York City in general, has lower property tax rates (0.90%) than St. Paul (1.09%), which could be a consideration for property owners.
Sales Tax
Sales tax in Bronx, NY, is quite high, at 8.875%, compared to St. Paul, MN, where it's 7.875%. This difference could be significant for lower-income households or bargain-seeking tourists.
Income
Type
Bronx
St. Paul
Estimated median household income
$43,011
$66,098
Estimated per capita income
$23,354
$36,313
Cost of living index (U.S. average is 100)
172.8
114.5
If you make $50,000 in St. Paul, you will have to make $75,459 in Bronx to maintain the same standard of living.
Geographical Conditions
The Bronx, located on the mainland, offers a more urban geography with beaches along the Long Island Sound. St. Paul, located along the Mississippi River, offers dramatic river bluffs and quiet, serene landscapes, combining urban and natural elements.
Geographical information
Type
Bronx
St. Paul
Land area
42 sq. miles
52.8 sq. miles
Population density
32,928 people per sq. mile
5,821.5 people per sq. mile
Elevation
120 feet
770 feet
Relative area comparison
Bronx, NY St. Paul, MN
Education
Both cities possess strong educational sectors. The Bronx is part of the vast New York City school system and boasts several top universities, such as Fordham University. St. Paul is home to acclaimed institutions like the University of St. Thomas and Macalester College. Each city offers robust selections of primary, secondary, and higher education options.
The Bronx and St. Paul leverage their diverse income streams. The Bronx, part of New York City, has a vast economy with thriving sectors like finance, health care, and manufacturing. St. Paul, on the other hand, relies on healthcare, retail, and education services. With significant employers in both cities, both job seekers and tourists have plenty to consider.
Biggest Employers
In the Bronx, the biggest employers include Montefiore Medical Center, Bronx Lebanon Hospital, and Fordham University. In St. Paul, massive employers are the State of Minnesota, United Health Group, and 3M Company. These large employers reflect the industries that are dominant in each of the cities.
In Bronx (Bronx County), 91.9% voted for Democrats and 8.1% for Republicans in 2012 Presidential Election. In St. Paul (Ramsey County), 66.6% voted for Democrats and 31.2% for Republicans.
Elections
Type
Democrats
Republicans
Other
Year
Bronx
St. Paul
Bronx
St. Paul
Bronx
St. Paul
2020
83.7%
71.8%
16.0%
26.3%
0.3%
1.9%
2016
88.6%
65.2%
9.5%
26.0%
2.0%
8.8%
2012
91.9%
66.6%
8.1%
31.2%
0.0%
2.2%
2008
89.0%
66.2%
11.0%
32.2%
0.0%
1.6%
2004
82.9%
63.5%
16.5%
35.9%
0.6%
0.7%
2000
86.5%
57.0%
11.8%
36.1%
1.7%
7.0%
1996
85.8%
58.7%
10.5%
29.3%
3.7%
12.0%
Breakdown of population affiliated with a religious congregation
Type
Adherents
Congregations
Religion
Bronx
St. Paul
Bronx
St. Paul
CATHOLIC CHURCH
25.5%
24.5%
11.5%
11.5%
MUSLIM ESTIMATE
2.8%
0.8%
3.9%
1.3%
AMERICAN BAPTIST CHURCHES IN THE USA
0.7%
0.7%
4.4%
3.4%
SEVENTH DAY ADVENTIST CHURCH
0.7%
0.1%
6.5%
1.6%
EPISCOPAL CHURCH
0.4%
1.1%
3.7%
3.2%
EVANGELICAL LUTHERAN CHURCH IN AMERICA
0.2%
7.8%
2.6%
14.2%
LUTHERAN CHURCH
0.1%
1.4%
0.6%
3.7%
SALVATION ARMY
0.1%
0.4%
0.3%
0.8%
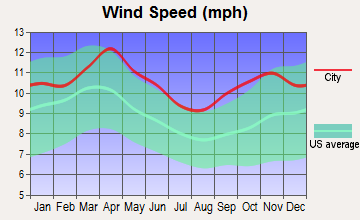
Weather
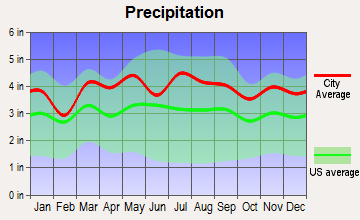
Hailing from the Northeast and Midwest respectively, the Bronx and St. Paul offer differing climates. The Bronx experiences a humid subtropical climate, with hot summers, moderate to heavy snow in winter, and rainfall spread throughout the year. Conversely, St. Paul endures a hot-summer humid continental climate with cold, snowy winters and warm summers.
Weather and climate
Type
Bronx
St. Paul
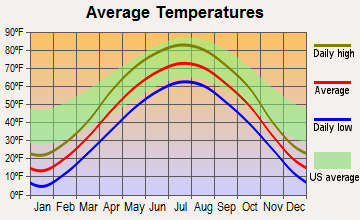
Temperature - Average
54.7°F
45.6°F
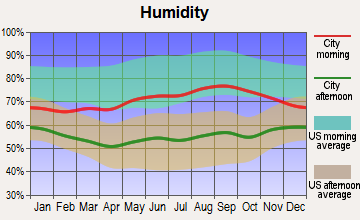
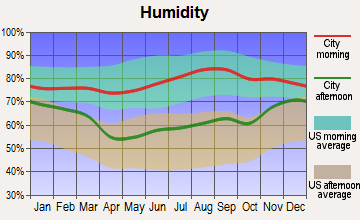
Humidity - Average morning or afternoon humidity
67.2%
74.9%
Humidity - Differences between morning and afternoon humidity
26.4%
33%
Humidity - Maximum monthly morning or afternoon humidity
75.6%
84%
Humidity - Minimum monthly morning or afternoon humidity
49.2%
51%
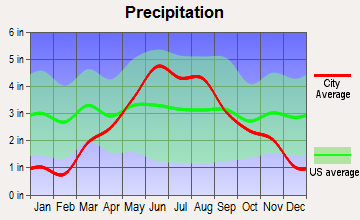
Precipitation - Yearly average
47 in
31.8 in
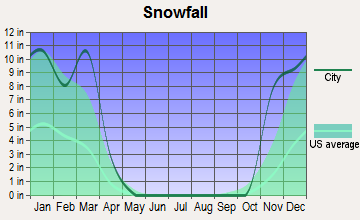
Snowfall - Yearly average
54.5 in
98.6 in
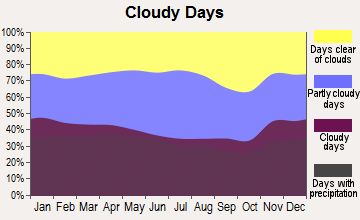
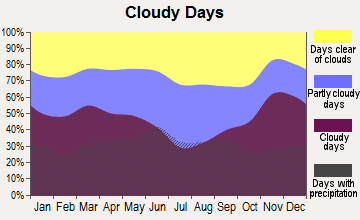
Clouds - Number of days clear of clouds
16.5%
15.8%
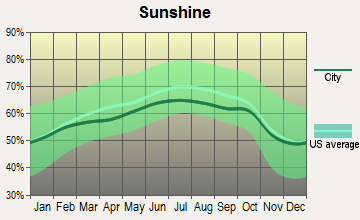
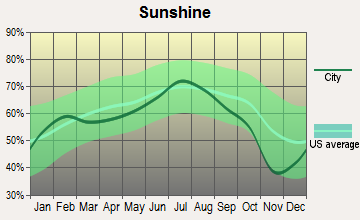
Sunshine amount - Average
60.2%
61.8%
Sunshine amount - Differences during a year
20%
37%
Sunshine amount - Maximum monthly
64%
74%
Sunshine amount - Minimum monthly
44%
37%
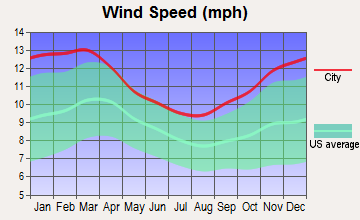
Wind speed - Average
10.7 mph
10.5 mph
Average climate in Bronx, New York
Average climate in St. Paul, Minnesota
Air pollution
Type
AQI
CO
NO2
OZONE
PB
PM10
PM25
SO2
Year
Bronx
St. Paul
Bronx
St. Paul
Bronx
St. Paul
Bronx
St. Paul
Bronx
St. Paul
Bronx
St. Paul
Bronx
St. Paul
Bronx
St. Paul
2018
102
81
0.31
0.24
15.8
11.6
24.4
28.2
N/A
N/A
N/A
20.4
7.4
8.5
0.6
1.0
2017
100
71
0.04
0.26
15.7
11.9
24.6
27.9
N/A
N/A
N/A
19.5
7.0
7.5
0.6
1.2
2016
98
76
0.30
0.28
16.4
11.2
24.6
26.7
N/A
N/A
N/A
18.2
7.2
6.8
0.8
1.2
2015
105
80
0.28
0.28
18.0
12.4
23.6
27.8
N/A
N/A
N/A
21.3
8.6
7.5
1.4
1.0
2014
99
83
0.32
0.25
18.0
14.2
23.6
26.8
N/A
N/A
N/A
23.1
8.4
8.1
1.7
0.9
2013
103
81
0.39
N/A
18.9
11.6
23.5
32.1
N/A
N/A
N/A
22.6
9.3
7.2
2.1
0.9
2012
104
80
0.44
N/A
18.8
7.7
23.9
29.0
N/A
N/A
N/A
25.6
9.7
8.3
3.1
0.2
2011
113
90
0.46
0.22
20.9
7.8
22.1
30.1
N/A
N/A
N/A
25.4
11.6
10.0
4.5
0.3
2010
113
101
0.53
N/A
20.2
9.6
23.7
28.3
N/A
0.002
N/A
24.7
10.8
11.1
4.7
0.5
2009
107
103
0.53
N/A
22.3
7.4
19.5
N/A
N/A
0.002
N/A
21.4
10.8
11.0
5.4
1.1
2008
114
92
0.53
N/A
23.3
8.8
19.9
N/A
0.013
0.004
N/A
18.3
12.1
11.0
5.9
1.0
2007
122
102
0.60
N/A
24.6
9.2
19.1
N/A
0.016
0.004
N/A
21.6
13.2
11.4
7.0
0.6
2006
120
88
0.50
N/A
25.0
9.5
18.9
N/A
0.018
0.007
N/A
20.5
12.8
10.4
7.0
1.2
2005
115
107
0.60
N/A
27.0
12.3
17.8
N/A
N/A
0.004
N/A
22.0
N/A
12.1
9.3
1.5
2004
109
103
0.62
N/A
25.6
11.0
16.7
N/A
0.030
0.004
N/A
23.9
N/A
11.9
8.8
2.3
2003
110
114
0.75
N/A
27.4
12.5
17.1
N/A
0.022
0.004
26.9
25.9
N/A
13.0
8.9
2.2
2002
124
95
0.67
0.42
27.9
15.7
17.4
N/A
0.008
0.006
25.0
N/A
N/A
11.1
8.6
1.1
2001
126
82
0.66
0.75
30.0
17.5
17.8
32.4
0.020
0.011
22.8
N/A
N/A
9.3
10.0
1.1
2000
115
68
0.68
0.75
29.4
16.6
16.0
31.2
0.022
0.009
22.2
N/A
N/A
N/A
10.2
1.4
Natural disasters
Type
Bronx
St. Paul
Tornado activity compared to U.S. average
58.3%
129.5%
Earthquake activity compared to U.S. average
31%
43.1%
Natural disasters compared to U.S. average
14%
18%
Transportation
Public transportation is highly prevalent in the Bronx, with options such as subways, buses, and taxis. St. Paul's public transit includes bus lines and light rail. Commuting is generally easier in St. Paul due to short travel distances and less congestion. For tourists, both cities offer efficient public transportation to major attractions and destinations.
Transport
Type
Bronx
St. Paul
Amtrak stations
0
1
Amtrak stations nearby
3
1
FAA registered aircraft
39
0
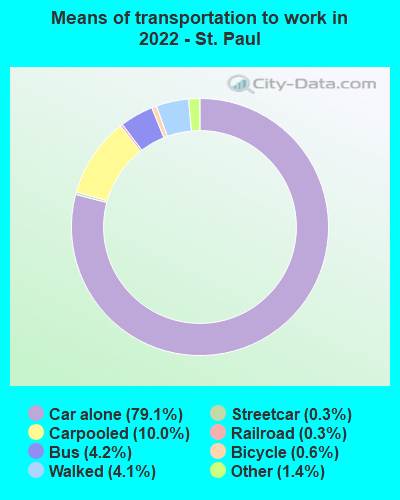
Means of transportation to work
Type
Bronx
St. Paul
Bicycle
0.2%
1%
Bus
15.6%
4.4%
Carpooled
9.3%
9.4%
Car alone
27%
79.9%
Railroad
2%
0.2%
Streetcar
0.2%
0%
Subway
34.6%
0%
Taxicab
1.3%
0.2%
Walked
7.2%
3.7%
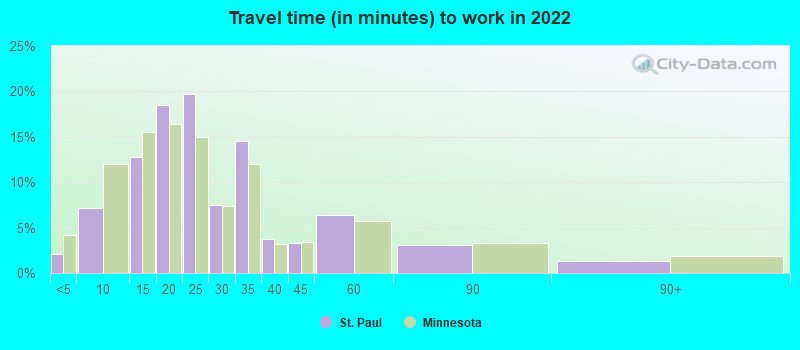
Average travel time to work
Type
Bronx
St. Paul
Average
44.2 min
25.8 min
Real Estate
Real estate in the Bronx is relatively more expensive, with median home prices above the national average. St. Paul offers more affordable housing options, with median prices significantly below the national average. However, both cities offer a range of options from high-end to affordable rents.
Neighborhoods
The Bronx is renowned for its vibrant neighborhoods like Little Italy, Riverdale, and Belmont. St. Paul offers quieter, family-friendly neighborhoods like Macalester-Groveland, St. Anthony Park, and Highland Park. Each city features its unique mix of passionate cultures and diverse communities.
Houses and residents
Type
Bronx
St. Paul
Houses
490,659
131,275
Average household size (people)
2.8
2.5
Houses occupied
463,212 (94.4%)
121,964 (92.9%)
Houses occupied by owners
90,522 (19.5%)
67,642 (55.5%)
Houses occupied by renters
372,690 (80.5%)
54,322 (44.5%)
Median rent asked for vacant for-rent units
$1,273
$1,437
Median price asked for vacant for-sale houses and condos
$708,992
$431,254
Estimated median house or condo value
$465,000
$267,700
Median number of rooms in apartments
3.7
3.7
Median number of rooms in houses and condos
5.1
6.5
Renting percentage
80.7%
48.7%
Housing density (houses/condos per square mile)
11,675
2,487.8
Household income disparities
50.2%
44.1%
Housing units without a mortgage
12,021 (34%)
934 (1.9%)
Housing units with both a second mortgage and home equity loan
105 (0.3%)
3,112 (6.5%)
Housing units with a mortgage
23,339 (66%)
47,031 (98.1%)
Housing units with a home equity loan
2,053 (5.8%)
441 (0.9%)
Housing units with a second mortgage
2,159 (6.1%)
4,559 (9.5%)
Housing units lacking complete kitchen facilities
1.4%
1.2%
Housing units lacking complete plumbing facilities
Self-employed workers in own not incorporated business
16,572
6,217
State government workers
14,515
9,418
Unpaid family workers
1,000
0
Industries and Occupations
Bronx's economy is driven by sectors like education, healthcare, retail trade, and construction. Employment fields in St.Paul, however, are more concentrated in healthcare & social assistance, retail trade, and educational services. St Paul also has a notable presence of public administration jobs due to it being the state capital.
The Bronx has numerous top-rated hospitals including the Montefiore Medical Center and NYC Health + Hospitals/Jacobi. St. Paul is equipped with excellent healthcare services, with major hospitals like Region’s Hospital and St. Joseph’s Hospital. Access to healthcare in both cities is robust and comprehensive.
Health (county statistics)
Type
Bronx
St. Paul
General health status score of residents in this county from 1 (poor) to 5 (excellent)
Infrastructure in the Bronx, due to its larger population and age of the borough, is more densely developed and can, at times, struggle with maintaining pace with the needs of its residents. St. Paul, with a smaller population, has more manageable urban infrastructure and fewer challenges with maintenance and access to facilities such as parks, libraries, and public services.
Infrastructure
Type
Bronx
St. Paul
TV stations
30
18
Bank branches located here
118
12
Bank institutions located here
24
8
Drinking water stations with no reported violations in the past
1
2
Drinking water stations with reported violations in the past
4
1
Schools
School facilities
Type
Bronx
St. Paul
Private elementary/middle schools
54
19
Private high schools
20
8
Public elementary/middle schools
285
76
Public high schools
155
50
Colleges/Universities
9
0
Culture and Food
A culturally diverse city, the Bronx offers a wealth of activities and food. Known for its influence on hip hop culture and Yankees Stadium, it's also famous for its food, with a variety of cuisines on display. St. Paul, while smaller, boasts a rich history, vibrant arts scene, and wide range of food options from classic Midwestern fare to international cuisines.
Sports Teams
Bronx is internationally known for being home to the New York Yankees. St. Paul is no slouch in sports, having the Minnesota Wild NHL team and sharing Minnesota Twins MLB and Minnesota Vikings NFL teams with its twin city, Minneapolis.


 Bronx, NY
 St. Paul, MN