St. Paul, Minnesota

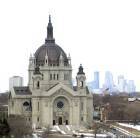
St. Paul: Cathedral of St. Paul

St. Paul: View of St. Paul

St. Paul: Statue on the MN State Capitol Bldg

St. Paul: From the High Bridge in St. Paul

St. Paul: Capital of St. Paul
St. Paul: St Anthony Park Neighborhood, St. Paul

St. Paul: Saint Paul skyline on a clear June day
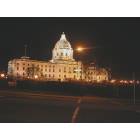
St. Paul: The Capital
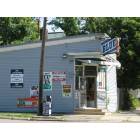
St. Paul: Inner City Grocer, St. Paul
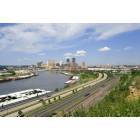
St. Paul: St. Paul Skyline From Dayton'sBluff
St. Paul: Cathedral of St. Paul with Minneapolis Skyline
- see
53
more - add
your
Submit your own pictures of this city and show them to the world
- OSM Map
- General Map
- Google Map
- MSN Map
Population change since 2000: +5.6%
 |
| Males: 152,303 | |
| Females: 150,873 |
| Median resident age: | 34.1 years |
| Minnesota median age: | 39.0 years |
Zip codes: 55101, 55102, 55103, 55104, 55105, 55107, 55114, 55116, 55130, 55155.
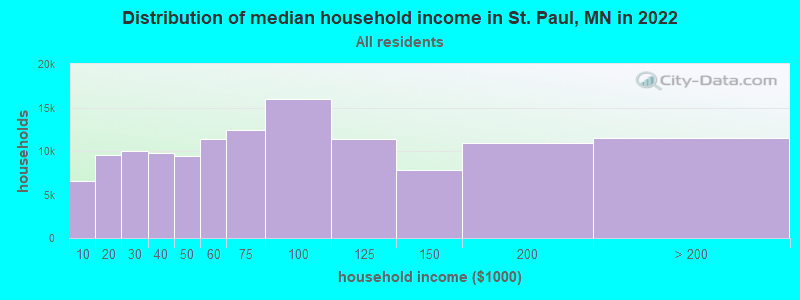
St. Paul Zip Code Map| St. Paul: | $67,725 |
| MN: | $82,338 |
Estimated per capita income in 2022: $41,137 (it was $20,216 in 2000)
St. Paul city income, earnings, and wages data
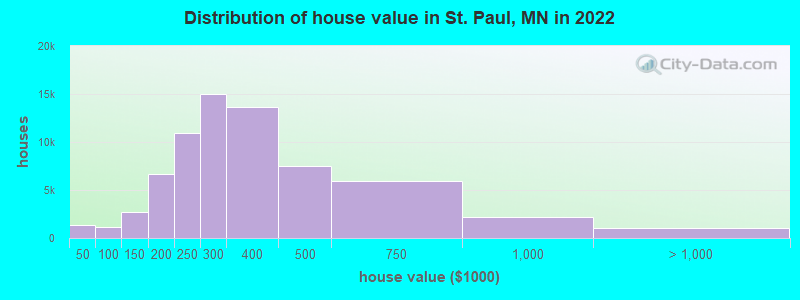
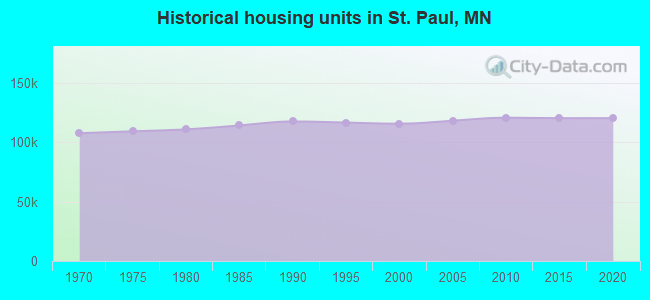
Estimated median house or condo value in 2022: $287,600 (it was $105,000 in 2000)
| St. Paul: | $287,600 |
| MN: | $314,600 |
Mean prices in 2022: all housing units: $346,607; detached houses: $354,567; townhouses or other attached units: $334,987; in 2-unit structures: $251,389; in 3-to-4-unit structures: $343,417; in 5-or-more-unit structures: $235,089; mobile homes: $237,492
Median gross rent in 2022: $1,216.
(9.3% for White Non-Hispanic residents, 28.0% for Black residents, 21.0% for Hispanic or Latino residents, 42.4% for American Indian residents, 23.9% for Native Hawaiian and other Pacific Islander residents, 18.8% for other race residents, 16.4% for two or more races residents)
Detailed information about poverty and poor residents in St. Paul, MN

Compare current foreclosures near St. Paul, MN:
| Photo | Address | Area | Beds / Baths | Price | Details |
|---|---|---|---|---|---|

|
#1
Saint Croix Ave W
Stillwater, MN 55082
|
2,314 sq. feet
|
2 baths 3 beds |
$344,000
|
show details |

|
#2
Granite St
Saint Paul, MN 55117
|
2,136 sq. feet
|
2 baths 4 beds |
$172,000
|
show details |

|
#3
Bedford Ave
Minneapolis, MN 55436
|
1,726 sq. feet
|
1 baths 3 beds |
$299,900
|
show details |

|
#4
Groveland Ave Apt 1708
Minneapolis, MN 55403
|
739 sq. feet
|
1 baths 1 beds |
$98,000
|
show details |

|
#5
Parklawn Ave Apt 109
Minneapolis, MN 55435
|
1,121 sq. feet
|
2 baths 2 beds |
$105,000
|
show details |

|
#6
Harriet Ave Apt 111
Minneapolis, MN 55408
|
602 sq. feet
|
1 baths 1 beds |
$83,125
|
show details |

|
#7
Quebec Ave N
Minneapolis, MN 55428
|
1,226 sq. feet
|
1 baths 2 beds |
$334,500
|
show details |

|
#8
W 44th St Apt 7
Minneapolis, MN 55410
|
710 sq. feet
|
1 baths 2 beds |
$169,900
|
show details |

|
#9
1st Ave S
Minneapolis, MN 55408
|
1,932 sq. feet
|
2 baths 3 beds |
$369,900
|
show details |

|
#10
76th Street E. Unit
Inver Grove Heights, MN 55076
|
1,048 sq. feet
|
2 baths 2 beds |
$219,900
|
show details |
| Photo | Address | Area | Beds / Baths | Price | Details |
|---|---|---|---|---|---|

|
#11
Portland Ave # 1412
Minneapolis, MN 55415
|
1,333 sq. feet
|
2 baths 2 beds |
$424,900
|
show details |

|
#12
Wacouta St Unit Unit Gl-D
Saint Paul, MN 55101
|
- sq. feet
|
1 baths 1 beds |
$179,900
|
show details |

|
#13
Rice Creek Ter
Saint Paul, MN 55112
|
2,248 sq. feet
|
2 baths 4 beds |
show details | |

|
#14
Timber Way
Stillwater, MN 55082
|
1,635 sq. feet
|
2 baths 3 beds |
show details | |

|
#15
Peacan Ave N
Stillwater, MN 55082
|
2,716 sq. feet
|
1 baths 2 beds |
show details | |

|
#16
83rd Ave N
Minneapolis, MN 55443
|
948 sq. feet
|
2 baths 2 beds |
show details | |

|
#17
105th Ave NW
Minneapolis, MN 55433
|
1,260 sq. feet
|
1 baths 2 beds |
show details | |

|
#18
Newton Ave N
Minneapolis, MN 55412
|
1,180 sq. feet
|
1 baths 2 beds |
show details | |

|
#19
30th Ave N
Minneapolis, MN 55411
|
884 sq. feet
|
1 baths 2 beds |
show details | |

|
#20
Winnetka Ave N
Minneapolis, MN 55428
|
962 sq. feet
|
1 baths 3 beds |
show details |
| Photo | Address | Area | Beds / Baths | Price | Details |
|---|---|---|---|---|---|

|
#21
Morgan Ave N
Minneapolis, MN 55430
|
1,800 sq. feet
|
2 baths 5 beds |
show details | |

|
#22
10th Ave S
Minneapolis, MN 55423
|
928 sq. feet
|
1 baths 3 beds |
show details | |

|
#23
Hale Ave S
Cottage Grove, MN 55016
|
1,326 sq. feet
|
1 baths 4 beds |
show details | |

|
#24
79th Way NE
Minneapolis, MN 55432
|
1,144 sq. feet
|
2 baths 4 beds |
show details | |

|
#25
Irving Ave N
Minneapolis, MN 55411
|
1,456 sq. feet
|
1 baths 3 beds |
show details | |

|
#26
Sanburnol Dr NE
Minneapolis, MN 55432
|
1,440 sq. feet
|
3 baths 6 beds |
show details | |

|
#27
Stevens Ave S
Minneapolis, MN 55420
|
1,109 sq. feet
|
1 baths 3 beds |
show details | |

|
#28
Windsor Ln N
Minneapolis, MN 55443
|
1,353 sq. feet
|
2 baths 2 beds |
show details | |

|
#29
43rd Avenue N
Minneapolis, MN 55442
|
1,211 sq. feet
|
2 baths 2 beds |
show details | |

|
#30
Salem Ave
Minneapolis, MN 55416
|
925 sq. feet
|
2 baths 2 beds |
show details |
| Photo | Address | Area | Beds / Baths | Price | Details |
|---|---|---|---|---|---|

|
#31
Toledo Ave N
Minneapolis, MN 55443
|
960 sq. feet
|
1 baths 2 beds |
show details | |

|
#32
Flanders Rd
Saint Paul, MN 55109
|
1,640 sq. feet
|
2 baths 4 beds |
show details | |

|
#33
York Ave N
Minneapolis, MN 55422
|
1,076 sq. feet
|
1 baths 2 beds |
show details | |

|
#34
Margaret St
Saint Paul, MN 55106
|
1,275 sq. feet
|
1 baths 3 beds |
show details | |

|
#35
17th Ave N
Minneapolis, MN 55411
|
3,482 sq. feet
|
6 baths 8 beds |
show details | |

|
#36
Belmont Ln W
Saint Paul, MN 55113
|
978 sq. feet
|
1 baths 3 beds |
show details | |

|
#37
W Diamond Lake Rd
Minneapolis, MN 55419
|
1,288 sq. feet
|
2 baths 2 beds |
show details | |

|
#38
Bridlewood Dr
Saint Paul, MN 55119
|
1,385 sq. feet
|
1 baths 3 beds |
show details | |

|
#39
72nd Ln N Apt 202
Minneapolis, MN 55428
|
892 sq. feet
|
1 baths 2 beds |
show details | |

|
#40
Prairie Rd
Saint Paul, MN 55110
|
1,518 sq. feet
|
2 baths 3 beds |
show details |
| Photo | Address | Area | Beds / Baths | Price | Details |
|---|---|---|---|---|---|

|
#41
18th Ave S
Minneapolis, MN 55423
|
1,124 sq. feet
|
1 baths 3 beds |
show details | |

|
#42
Maple St
Saint Paul, MN 55106
|
1,436 sq. feet
|
2 baths 3 beds |
show details | |

|
#43
Bidwell St
Saint Paul, MN 55107
|
1,108 sq. feet
|
2 baths 2 beds |
show details | |

|
#44
48th St N
Saint Paul, MN 55128
|
1,323 sq. feet
|
2 baths 2 beds |
show details | |

|
#45
Mclean Ave
Saint Paul, MN 55106
|
1,400 sq. feet
|
1 baths 3 beds |
show details | |

|
#46
Jessamine Ave E
Saint Paul, MN 55106
|
1,379 sq. feet
|
1 baths 3 beds |
show details | |

|
#47
Oakmede Ln
Saint Paul, MN 55110
|
1,100 sq. feet
|
3 baths 3 beds |
show details | |

|
#48
Wilson Ave
Saint Paul, MN 55106
|
833 sq. feet
|
2 baths 2 beds |
show details | |

|
#49
Carver Ct
Burnsville, MN 55337
|
1,300 sq. feet
|
3 baths 5 beds |
show details | |

|
Check over 1 million property listings on Foreclosure.com!
|
browse all offers | |||


- 157,26751.9%White alone
- 50,38216.6%Asian alone
- 47,21115.6%Black alone
- 27,2989.0%Hispanic
- 18,3336.0%Two or more races
- 1,4040.5%Other race alone
- 1,2270.4%American Indian alone
- 380.01%Native Hawaiian and Other
Pacific Islander alone
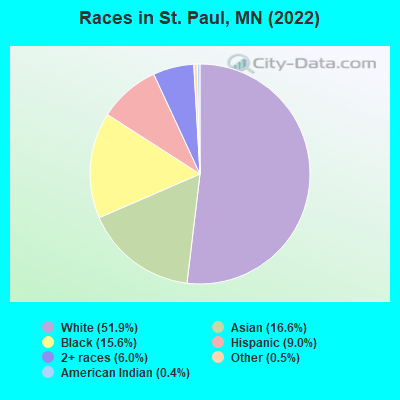
Races in St. Paul detailed stats: ancestries, foreign born residents, place of birth
According to our research of Minnesota and other state lists, there were 91 registered sex offenders living in St. Paul, Minnesota as of April 27, 2024.
The ratio of all residents to sex offenders in St. Paul is 3,323 to 1.
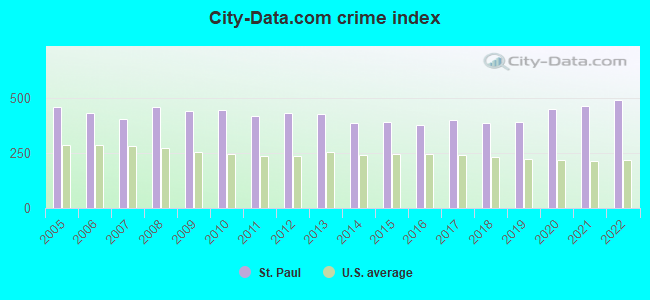
The City-Data.com crime index weighs serious crimes and violent crimes more heavily. Higher means more crime, U.S. average is 246.1. It adjusts for the number of visitors and daily workers commuting into cities.
- means the value is smaller than the state average.- means the value is about the same as the state average.
- means the value is bigger than the state average.
- means the value is much bigger than the state average.
Crime rate in St. Paul detailed stats: murders, rapes, robberies, assaults, burglaries, thefts, arson
Full-time law enforcement employees in 2021, including police officers: 760 (627 officers - 531 male; 96 female).
| Officers per 1,000 residents here: | 2.02 |
| Minnesota average: | 1.76 |
 Recent articles from our blog. Our writers, many of them Ph.D. graduates or candidates, create easy-to-read articles on a wide variety of topics.

 | Is St. Paul a better place to live than Minneapolis now? (29 replies) |
| Would love to learn from the St. Paul community about spiritual centers! (0 replies) |
| Why Do St. Paul Drivers encourage J-Walking? (43 replies) |
| Driving tour of St. Paul (11 replies) |
| More information on Minneapolis/St. Paul area? (36 replies) |
| St. Paul catching up with crime in Minneapolis (28 replies) |
Latest news from St. Paul, MN collected exclusively by city-data.com from local newspapers, TV, and radio stations
Ancestries: German (8.6%), Somali (3.8%), Irish (3.4%), Norwegian (3.2%), European (3.0%), Ethiopian (3.0%).
Current Local Time: CST time zone
Incorporated in 1854
Elevation: 770 feet
Land area: 52.8 square miles.
Population density: 5,745 people per square mile (average).
60,185 residents are foreign born (9.8% Asia, 4.8% Africa, 3.0% Latin America).
| This city: | 19.9% |
| Minnesota: | 8.5% |
Median real estate property taxes paid for housing units with mortgages in 2022: $3,498 (1.2%)
Median real estate property taxes paid for housing units with no mortgage in 2022: $3,537 (1.3%)
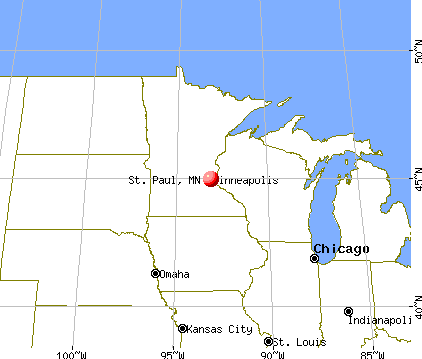
Nearest city with pop. 1,000,000+: Chicago, IL  (347.7 miles , pop. 2,896,016).
Nearest cities:
), ), ), ), Latitude: 44.95 N, Longitude: 93.11 W
Daytime population change due to commuting: +14,626 (+4.8%)
Workers who live and work in this city: 78,167 (49.2%)
Property values in St. Paul, MN
Detailed articles:
- Saint Paul: Introduction
- Saint Paul Basic Facts
- Saint Paul: Communications
- Saint Paul: Convention Facilities
- Saint Paul: Economy
- Saint Paul: Education and Research
- Saint Paul: Geography and Climate
- Saint Paul: Health Care
- Saint Paul: History
- Saint Paul: Municipal Government
- Saint Paul: Population Profile
- Saint Paul: Recreation
- Saint Paul: Transportation
St. Paul tourist attractions:
- Cathedral of St. Paul, Saint Paul, MN
- Como Lakeside Pavilion, St. Paul, MN
- Como Park Zoo and Conservatory, Saint Paul, MN
- Como Town - St. Paul, Minnesota - Family-Oriented Amusement and Theme Park
- Como Zoo and Conservatory in Saint Paul, Minnesota
- Crowne Plaza Hotel St. Paul - Riverfront, St. Paul, MN
- Embassy Suites Hotel St. Paul - Downtown, St. Paul, MN
- Fort Snelling State Park, Saint Paul, MN
- Gibbs Farm Museum, St. Paul, MN
- Hilton Garden Inn St. Paul City Center, St. Paul, MN
- History Center Museum, Saint Paul, MN
- James J Hill Mansion, Saint Paul, MN
- Landmark Center, St. Paul, MN
- Minnesota Centennial Showboat, Saint Paul, MN
- Minnesota Children's Museum, St. Paul, MN
- Minnesota Museum of American Art, Saint Paul, MN
- Minnesota State Capitol, Saint Paul, MN
- Minnesota Transportation Museum, St. Paul, MN
- Phalen Beach, St. Paul, MN
- Saint Paul Hotel, St. Paul, MN
- Saint Paul River Centre, St. Paul, MN
- Schubert Club Museum of Musical Instruments, St. Paul, MN
- Science Museum of Minnesota, Saint Paul, MN
- St. Croix River, Saint Paul, MN
- Summit Avenue, Saint Paul, MN
- The Raptor Center, St. Paul, MN
- Wabasha Street Caves, Saint Paul, MN
- Xcel Energy Center, St. Paul, Minnesota
St. Paul, Minnesota accommodation & food services, waste management - Economy and Business Data
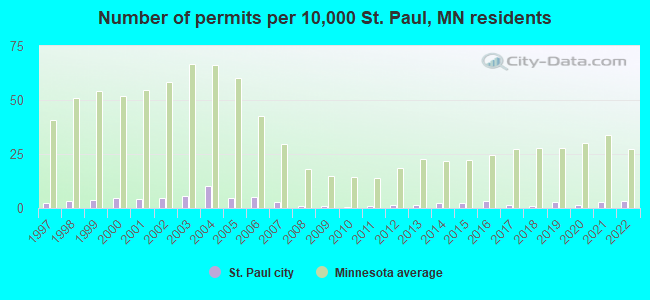
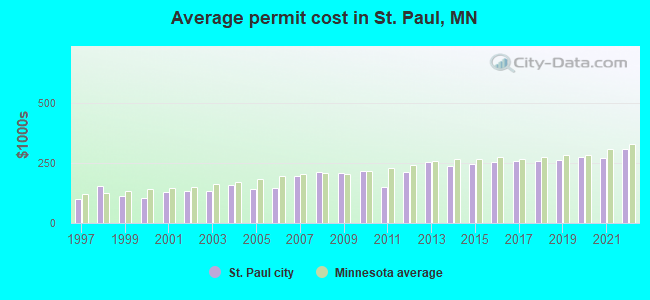
Single-family new house construction building permits:
- 2022: 97 buildings, average cost: $311,200
- 2021: 77 buildings, average cost: $270,800
- 2020: 41 buildings, average cost: $276,900
- 2019: 74 buildings, average cost: $265,000
- 2018: 25 buildings, average cost: $258,500
- 2017: 39 buildings, average cost: $257,500
- 2016: 88 buildings, average cost: $255,900
- 2015: 60 buildings, average cost: $244,800
- 2014: 70 buildings, average cost: $237,500
- 2013: 45 buildings, average cost: $254,400
- 2012: 34 buildings, average cost: $213,100
- 2011: 31 buildings, average cost: $151,700
- 2010: 18 buildings, average cost: $216,800
- 2009: 21 buildings, average cost: $209,300
- 2008: 30 buildings, average cost: $213,300
- 2007: 74 buildings, average cost: $198,100
- 2006: 140 buildings, average cost: $144,800
- 2005: 139 buildings, average cost: $143,500
- 2004: 289 buildings, average cost: $157,500
- 2003: 153 buildings, average cost: $133,800
- 2002: 129 buildings, average cost: $133,300
- 2001: 116 buildings, average cost: $131,100
- 2000: 130 buildings, average cost: $103,800
- 1999: 111 buildings, average cost: $114,100
- 1998: 90 buildings, average cost: $155,100
- 1997: 60 buildings, average cost: $102,100
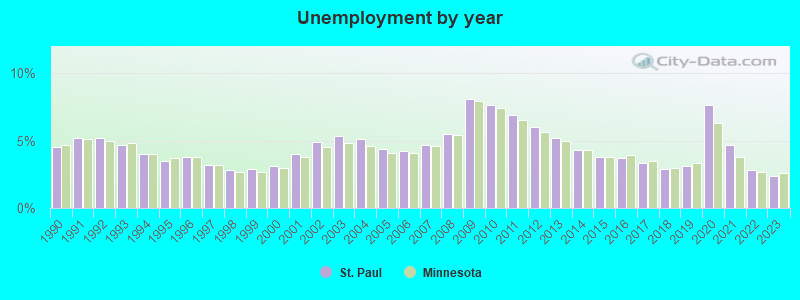
| Here: | 2.4% |
| Minnesota: | 2.6% |
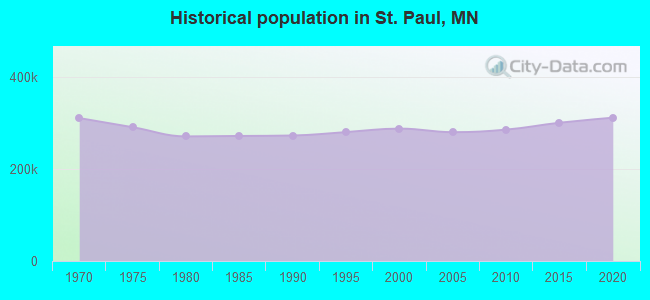
Population change in the 1990s: +14,813 (+5.4%).
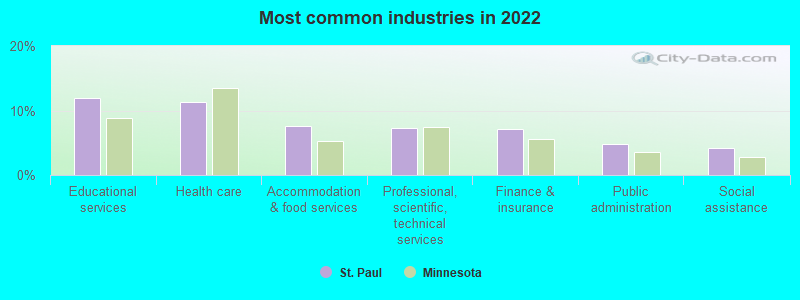
- Educational services (11.9%)
- Health care (11.4%)
- Accommodation & food services (7.7%)
- Professional, scientific, technical services (7.3%)
- Finance & insurance (7.1%)
- Public administration (4.9%)
- Social assistance (4.2%)
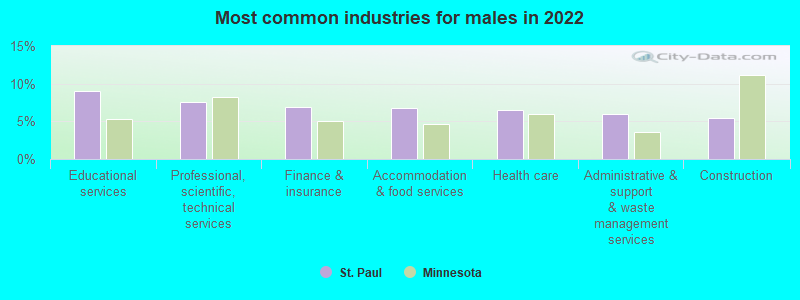
- Educational services (9.0%)
- Professional, scientific, technical services (7.6%)
- Finance & insurance (6.9%)
- Accommodation & food services (6.8%)
- Health care (6.5%)
- Administrative & support & waste management services (6.0%)
- Construction (5.5%)
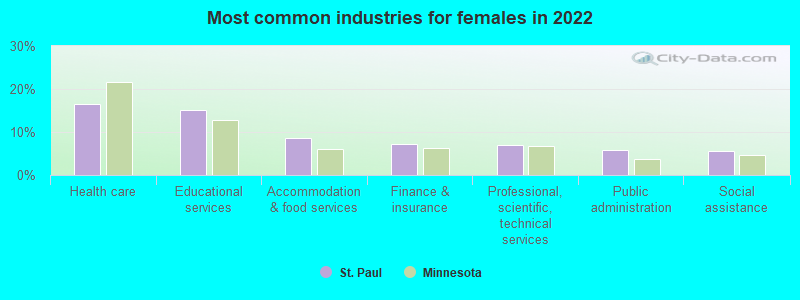
- Health care (16.5%)
- Educational services (15.0%)
- Accommodation & food services (8.5%)
- Finance & insurance (7.3%)
- Professional, scientific, technical services (7.1%)
- Public administration (5.9%)
- Social assistance (5.6%)

- Other management occupations, except farmers and farm managers (7.0%)
- Cooks and food preparation workers (5.5%)
- Computer specialists (4.0%)
- Nursing, psychiatric, and home health aides (3.4%)
- Laborers and material movers, hand (2.9%)
- Building and grounds cleaning and maintenance occupations (2.8%)
- Other production occupations, including supervisors (2.4%)

- Computer specialists (6.1%)
- Other management occupations, except farmers and farm managers (5.3%)
- Cooks and food preparation workers (4.7%)
- Laborers and material movers, hand (4.2%)
- Other production occupations, including supervisors (3.4%)
- Building and grounds cleaning and maintenance occupations (3.2%)
- Construction laborers (2.3%)

- Other management occupations, except farmers and farm managers (8.7%)
- Cooks and food preparation workers (6.2%)
- Nursing, psychiatric, and home health aides (4.8%)
- Other teachers, instructors, education, training, and library occupations (3.2%)
- Other financial specialists (3.2%)
- Other office and administrative support workers, including supervisors (3.0%)
- Information and record clerks, except customer service representatives (2.7%)
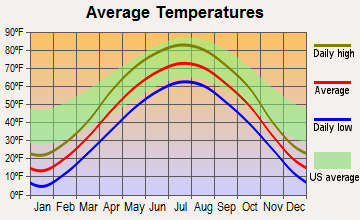
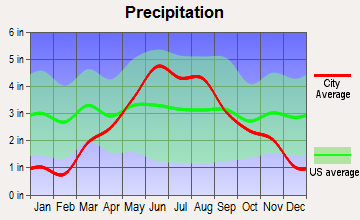
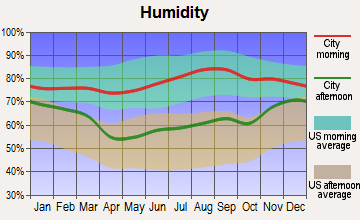
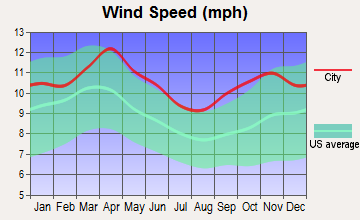
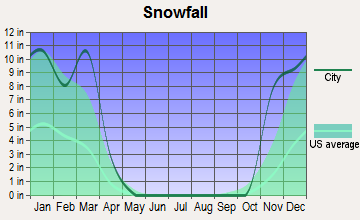
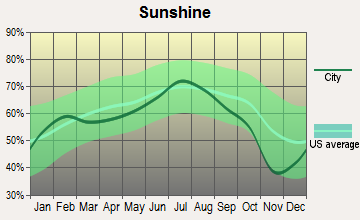
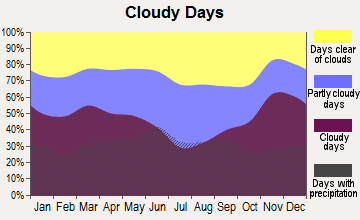
Average climate in St. Paul, Minnesota
Based on data reported by over 4,000 weather stations
|
|

(lower is better)
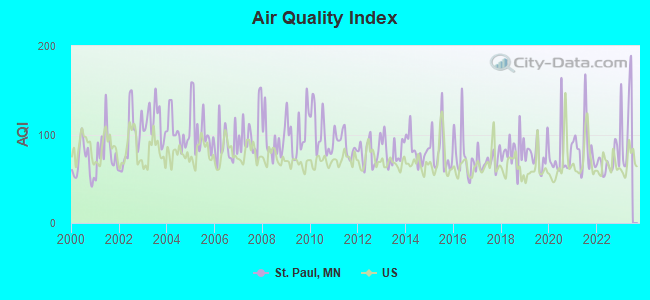
Air Quality Index (AQI) level in 2022 was 68.4. This is about average.
| City: | 68.4 |
| U.S.: | 72.6 |
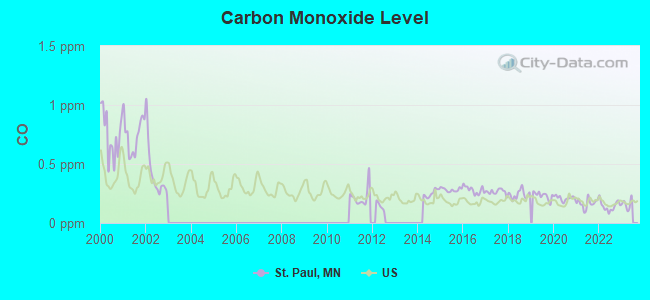
Carbon Monoxide (CO) [ppm] level in 2022 was 0.144. This is significantly better than average. Closest monitor was 0.4 miles away from the city center.
| City: | 0.144 |
| U.S.: | 0.251 |
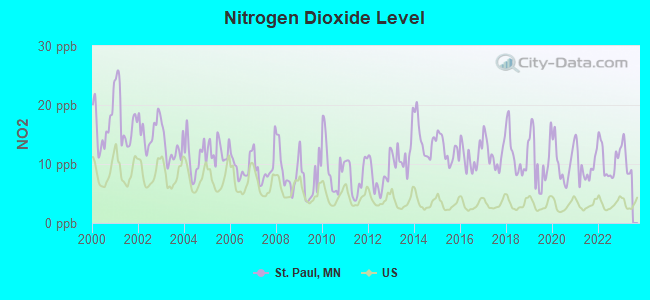
Nitrogen Dioxide (NO2) [ppb] level in 2022 was 10.5. This is significantly worse than average. Closest monitor was 0.9 miles away from the city center.
| City: | 10.5 |
| U.S.: | 5.1 |
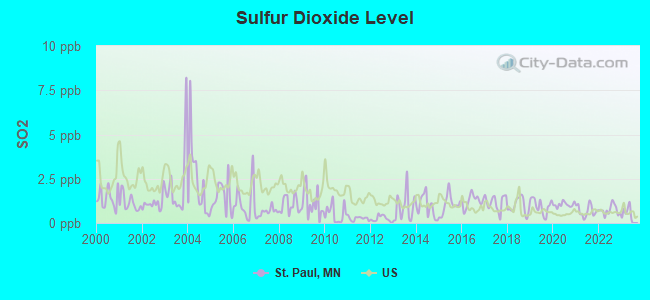
Sulfur Dioxide (SO2) [ppb] level in 2022 was 0.733. This is significantly better than average. Closest monitor was 0.9 miles away from the city center.
| City: | 0.733 |
| U.S.: | 1.515 |
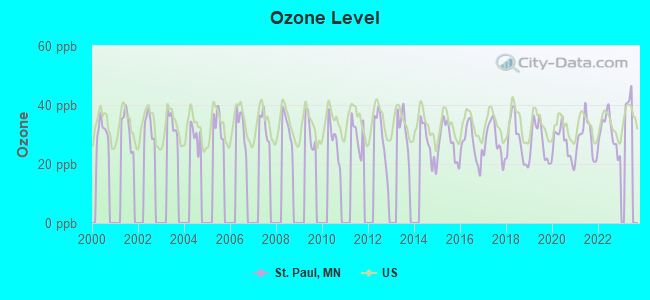
Ozone [ppb] level in 2022 was 30.7. This is about average. Closest monitor was 0.9 miles away from the city center.
| City: | 30.7 |
| U.S.: | 33.3 |
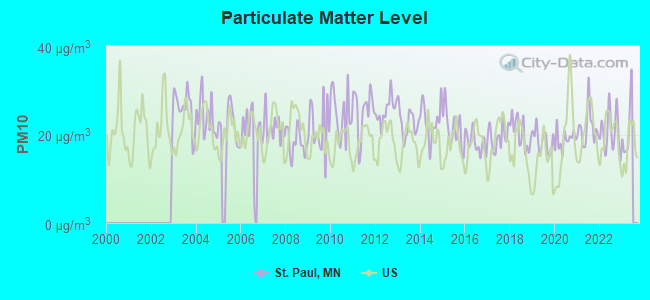
Particulate Matter (PM10) [µg/m3] level in 2022 was 20.6. This is about average. Closest monitor was 0.8 miles away from the city center.
| City: | 20.6 |
| U.S.: | 19.2 |
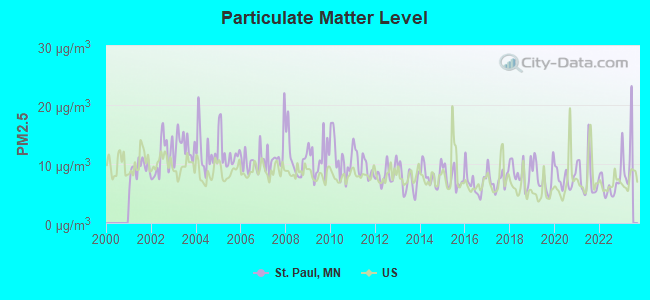
Particulate Matter (PM2.5) [µg/m3] level in 2022 was 6.20. This is better than average. Closest monitor was 0.7 miles away from the city center.
| City: | 6.20 |
| U.S.: | 8.11 |
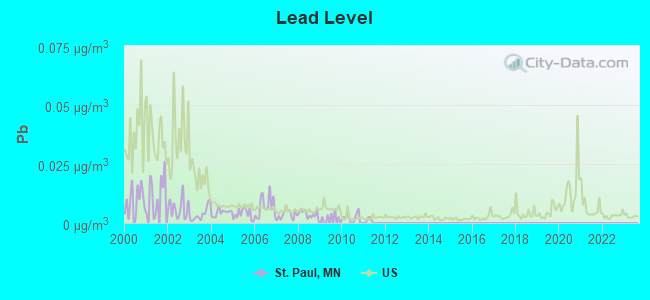
Lead (Pb) [µg/m3] level in 2010 was 0.00204. This is significantly better than average. Closest monitor was 0.9 miles away from the city center.
| City: | 0.00204 |
| U.S.: | 0.00931 |
Tornado activity:
St. Paul-area historical tornado activity is slightly above Minnesota state average. It is 30% greater than the overall U.S. average.
On 5/6/1965, a category F4 (max. wind speeds 207-260 mph) tornado 9.7 miles away from the St. Paul city center killed 3 people and injured 175 people and caused between $5,000,000 and $50,000,000 in damages.
On 5/6/1965, a category F4 tornado 13.1 miles away from the city center killed 6 people and injured 158 people and caused between $5,000,000 and $50,000,000 in damages.
Earthquake activity:
St. Paul-area historical earthquake activity is significantly above Minnesota state average. It is 57% smaller than the overall U.S. average.On 7/9/1975 at 14:54:15, a magnitude 4.6 (4.6 MB, Class: Light, Intensity: IV - V) earthquake occurred 150.7 miles away from the city center
On 6/5/1993 at 01:24:53, a magnitude 4.1 (4.1 LG, Depth: 6.2 mi) earthquake occurred 162.4 miles away from the city center
On 3/4/1983 at 06:32:18, a magnitude 4.6 (4.4 MB, 4.6 LG, 4.4 ML) earthquake occurred 314.2 miles away from the city center
On 10/20/1995 at 15:57:18, a magnitude 3.7 (3.7 LG, Depth: 3.1 mi, Class: Light, Intensity: II - III) earthquake occurred 191.1 miles away from the city center
On 2/9/1994 at 08:45:35, a magnitude 3.1 (3.1 LG, Depth: 3.1 mi) earthquake occurred 92.3 miles away from St. Paul center
On 11/3/2002 at 20:41:56, a magnitude 4.3 (4.3 MB, Depth: 3.1 mi) earthquake occurred 325.5 miles away from St. Paul center
Magnitude types: regional Lg-wave magnitude (LG), body-wave magnitude (MB), local magnitude (ML)
Natural disasters:
The number of natural disasters in Ramsey County (18) is near the US average (15).Major Disasters (Presidential) Declared: 13
Emergencies Declared: 3
Causes of natural disasters: Floods: 14, Storms: 8, Tornadoes: 5, Winds: 3, Drought: 1, Hurricane: 1, Landslide: 1, Mudslide: 1, Winter Storm: 1, Other: 1 (Note: some incidents may be assigned to more than one category).

Hospitals and medical centers near St. Paul:
- GALTIER HEALTH CENTER (Nursing Home, about 1 miles away; SAINT PAUL, MN)
- BETHEL CARE CENTER (Nursing Home, about 1 miles away; SAINT PAUL, MN)
- CAPITOL DIALYSIS OF DAVITA (Dialysis Facility, about 1 miles away; SAINT PAUL, MN)
- HEALTHEAST BETHESDA LUTHERAN HOME (Hospital, about 1 miles away; SAINT PAUL, MN)
- HOSPICE ST PAUL OF BETHESDA LUTHERAN (Hospital, about 1 miles away; SAINT PAUL, MN)
- HEALTHEAST TRANS CARE CENTER BETHESDA (Nursing Home, about 1 miles away; SAINT PAUL, MN)
- ST PAULS CHURCH HOME (Nursing Home, about 1 miles away; SAINT PAUL, MN)
Airports and heliports located in St. Paul:
- St Paul Downtown Holman Fld Airport (STP) (Runways: 3, Air Taxi Ops: 7,530, Itinerant Ops: 28,318, Local Ops: 20,975, Military Ops: 9,652)
- Lake Elmo Airport (21D) (Runways: 2, Air Taxi Ops: 1,147, Itinerant Ops: 14,561, Local Ops: 10,621, Military Ops: 169)
- Children's Hospital - St Paul Heliport (MY79)
- Regions Hospital Heliport (7MN1)
- St Joseph's Heliport (12MN)
Colleges/universities with over 2000 students nearest to St. Paul:
- Saint Paul College (about 1 miles; Saint Paul, MN; Full-time enrollment: 4,778)
- Metropolitan State University (about 2 miles; Saint Paul, MN; FT enrollment: 6,159)
- Concordia University-Saint Paul (about 2 miles; Saint Paul, MN; FT enrollment: 2,501)
- Hamline University (about 3 miles; Saint Paul, MN; FT enrollment: 3,818)
- Macalester College (about 3 miles; Saint Paul, MN; FT enrollment: 2,174)
- University of St Thomas (about 4 miles; Saint Paul, MN; FT enrollment: 8,762)
- St Catherine University (about 4 miles; Saint Paul, MN; FT enrollment: 3,771)
Biggest public high schools in St. Paul:
- MN ONLINE HIGH SCHOOL - I.S. (Location: 2314 UNIVERSITY AVE W STE 10, Grades: 9-12)
- METRO DEAF SCHOOL (Location: 1471 BREWSTER ST, Grades: PK-12, Charter school)
- COMMUNITY OF PEACE ACADEMY SEC. (Location: 471 MAGNOLIA AVE E, Grades: 9-12, Charter school)
- MTCS CONNECTIONS ACADEMY (Location: 1336 ENERGY PARK DR, Grades: KG-12, Charter school)
- CYBER VILLAGE ACADEMY (Location: 768 HAMLINE AVE S, Grades: 3-12, Charter school)
- HIGHER GROUND SECONDARY ACADEMY (Location: 1381 MARSHALL AVE, Grades: 7-12, Charter school)
- JENNINGS EXPERIENTIAL HIGH SCHOOL (Location: 2455 UNIVERSITY AVE WEST, Grades: 9-12, Charter school)
- FACE TO FACE ACADEMY (Location: 1165 ARCADE ST, Grades: 9-12, Charter school)
- HIGH SCHOOL FOR RECORDING ARTS (Location: 1166 UNIVERSITY AVE, Grades: 9-12, Charter school)
- AVALON SCHOOL (Location: 700 GLENDALE ST, Grades: 9-12, Charter school)
Private high schools in St. Paul:
- CRETIN DERHAM HALL (Students: 1,320, Location: 550 ALBERT ST S, Grades: 9-12)
- ST PAUL ACADEMY - SUMMIT (Students: 869, Location: 1712 RANDOLPH AVE, Grades: KG-12)
- HILL MURRAY SCHOOL (Students: 765, Location: 2625 LARPENTEUR AVE E, Grades: 7-12)
- MOUNDS PARK ACADEMY (Students: 581, Location: 2051 LARPENTEUR AVE E, Grades: PK-12)
- ST AGNES SCHOOL (Students: 524, Location: 530 LAFOND AVE, Grades: KG-12)
- ST PAUL PREPARATORY SCHOOL (Students: 195, Location: 380 JACKSON ST, Grades: 9-12)
- CHRIST'S HOUSEHOLD OF FAITH (Students: 167, Location: 355 MARSHALL AVE, Grades: UG-12)
- FAITH BAPTIST CHRISTIAN SCHOOL (Students: 40, Location: 1365 WESTMINSTER ST, Grades: PK-12)
Biggest public elementary/middle schools in St. Paul:
- COMMUNITY OF PEACE ACADEMY (Location: 471 MAGNOLIA AVE E, Grades: KG-8, Charter school)
- ACHIEVE LANGUAGE ACADEMY (Location: 2169 STILLWATER AVE, Grades: PK-8, Charter school)
- HIGHER GROUND ACADEMY (Location: 1381 MARSHALL AVE, Grades: KG-6, Charter school)
- ST. PAUL CITY PRIMARY SCHOOL (Location: 260 EDMUND AVE, Grades: KG-5, Charter school)
- ST. PAUL CITY MIDDLE SCHOOL (Location: 643 VIRGINIA ST, Grades: 6-8, Charter school)
- LIFE PREP (Location: 930 GERANIUM AVE EAST, Grades: KG-6, Charter school)
- TWIN CITIES ACADEMY (Location: 835 E 5TH ST, Grades: 6-8, Charter school)
- ACADEMIA CESAR CHAVEZ CHARTER SCH. (Location: 1800 AMES AVE, Grades: KG-6, Charter school)
- AFSA MIDDLE SCHOOL (Location: 1435 MIDWAY PARKWAY, Grades: 5-8, Charter school)
- HOPE COMMUNITY ACADEMY (Location: 720 PAYNE AVE, Grades: KG-8, Charter school)
Biggest private elementary/middle schools in St. Paul:
- NATIVITY OF OUR LORD SCHOOL (Students: 759, Location: 1900 STANFORD AVE, Grades: KG-8)
- HIGHLAND CATHOLIC SCHOOL (Students: 400, Location: 2017 BOHLAND AVE, Grades: PK-8)
- ST THOMAS MORE SCHOOL (Students: 349, Location: 1065 SUMMIT AVE, Grades: KG-8)
- HOLY SPIRIT SCHOOL (Students: 309, Location: 515 ALBERT ST S, Grades: PK-8)
- ST MARKS SCHOOL (Students: 306, Location: 1983 DAYTON AVE, Grades: PK-8)
- ST PASCAL BAYLON SCHOOL (Students: 232, Location: 1757 CONWAY ST, Grades: PK-8)
- MATERNITY OF MARY - ST ANDREW SCHOOL (Students: 214, Location: 592 ARLINGTON AVE W, Grades: PK-8)
- OAK HILL MONTESSORI (Students: 192, Location: 4665 HODGSON RD, Grades: PK-8)
- CENTRAL LUTHERAN SCHOOL (Students: 191, Location: 775 LEXINGTON PKWY N, Grades: PK-8)
- ST MATTHEW'S SCHOOL (Students: 170, Location: 497 HUMBOLDT AVE, Grades: PK-8)
User-submitted facts and corrections:
- Birthplace of: F. Scott Fitzgerald - author, born Sept. 24th, 1896
- I NOTICED Lake Phalen is not mentioned, it's a big lake on the east side of downtown. They have car races on it for winter carnival.
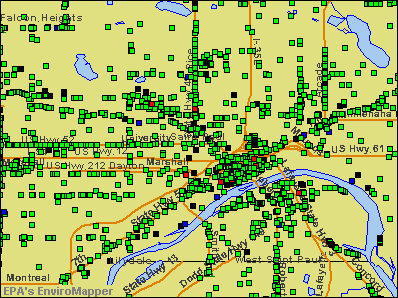
Points of interest:
Notable locations in St. Paul: Como Park Golf Course (A), Phalen Park Golf Course (B), Town and Country Club (C), Midway Stadium (D), Hillcrest Golf Club (E), Cathedral Hill (F), James Hill Reference Library (G), Metro Saint Paul Water Treatment Facility (H), Union Station (I), World Trade Center (J), Wilder Center (K), Healtheast Ambulance Transportation (L), Saint Paul Orphange (M), House of the Good Shepherd (N), Saint Paul Fire Training Office and Tower (O), Saint Paul Fire Department Headquarters (P), Saint Paul Fire Department Station 23 (Q), Xcel Energy Center (R), Touchstone Energy Center (S), Science Museum of Minnesota (T). Display/hide their locations on the map
Shopping Centers: Bandana Square Shopping Center (1), Carriage Hill Plaza Shopping Center (2), Ford Parkway Plaza Shopping Center (3), Galtier Plaza Shopping Center (4), Highland Crossing Shopping Center (5), Highland Shopping Center (6), Highland Village Center Shopping Center (7), Hillcrest Shopping Center (8), Lexington Shopping Center (9). Display/hide their locations on the map
Churches in St. Paul include: Zion Church (A), Convent of the Visitation (B), Word of Life Christian Fellowship Church (C), Warrendale Presbyterian Church (D), Victory Temple Church (E), Unity Unitarian Church (F), Twin Cities Deaf Assembly of God Church (G), Taiwan Christian Church in the Twin Cities (H), Summit Avenue Assembly of God Church (I). Display/hide their locations on the map
Cemeteries: Oakland Cemetery (1), Sons of Moses Cemetery (2), Sons of Jacob Cemetery (3), Calvary Cemetery (4), Chesed Shel Emes Cemetery (5), Riverview Cemetery (6), Elmhurst Cemetery (7). Display/hide their locations on the map
Lakes: Upper Lake (A), Pigs Eye Lake (B), Lake Phalen (C), Frost Lake (D), Crosby Lake (E), Lake Como (F). Display/hide their locations on the map
Streams, rivers, and creeks: Trout Brook (A), Battle Creek (B), Fish Creek (C), Minnesota River (D). Display/hide their locations on the map
Parks in St. Paul include: East View Playground (1), Hampden Park (2), Hayden Heights Playground (3), Hazel Park Playground (4), Highland Park (5), Highwood Park (6), Hillcrest Park (7), Horton Park (8), Indian Mounds Park (9). Display/hide their locations on the map
Tourist attraction: Snowy Egret Books (Nature Centers; 1237 Carroll Avenue) (1). Display/hide its approximate location on the map
Birthplace of: Lindsey Vonn - Alpine skier, Warren E. Burger - Chief Justice of the, Dick Gordon (sports writer) - Minnesota sports journalist, Christopher Cox - Former politician, Tim Pawlenty - Politician, Tim Kaine - Civil rights lawyer, Dave Winfield - Baseball player, Heidemarie Stefanyshyn-Piper - Astronaut, Josh Hartnett - Film actor, Jon Wiener - Writer.
Drinking water stations with addresses in St. Paul and their reported violations in the past:
LEXINGTON RIVERSIDE CONDOMINIUM (Population served: 200, Groundwater):Past health violations:
- MCL, Monthly (TCR) - Between APR-2010 and JUN-2010, Contaminant: Coliform. Follow-up actions: St Tech Assistance Visit (MAY-07-2010), St Formal NOV issued (MAY-07-2010), St Public Notif requested (MAY-07-2010), St Compliance Meeting conducted (MAY-07-2010), St Compliance achieved (MAY-24-2010)
Drinking water stations with addresses in St. Paul that have no violations reported:
- FIVE STAR MOBILE HOME PARK (Population served: 415, Primary Water Source Type: Groundwater)
- ELMS ESTATES, INC. (Population served: 53, Primary Water Source Type: Groundwater)
| This city: | 2.5 people |
| Minnesota: | 2.5 people |
| This city: | 53.8% |
| Whole state: | 64.6% |
| This city: | 8.2% |
| Whole state: | 6.9% |
Likely homosexual households (counted as self-reported same-sex unmarried-partner households)
- Lesbian couples: 0.6% of all households
- Gay men: 0.4% of all households
People in group quarters in St. Paul in 2010:
- 6,251 people in college/university student housing
- 1,608 people in nursing facilities/skilled-nursing facilities
- 1,163 people in other noninstitutional facilities
- 904 people in group homes intended for adults
- 602 people in emergency and transitional shelters (with sleeping facilities) for people experiencing homelessness
- 459 people in local jails and other municipal confinement facilities
- 128 people in residential treatment centers for adults
- 98 people in correctional residential facilities
- 96 people in correctional facilities intended for juveniles
- 90 people in group homes for juveniles (non-correctional)
- 39 people in workers' group living quarters and job corps centers
People in group quarters in St. Paul in 2000:
- 5,269 people in college dormitories (includes college quarters off campus)
- 2,352 people in nursing homes
- 960 people in other noninstitutional group quarters
- 537 people in local jails and other confinement facilities (including police lockups)
- 425 people in homes for the mentally retarded
- 281 people in religious group quarters
- 244 people in other nonhousehold living situations
- 239 people in job corps and vocational training facilities
- 223 people in other group homes
- 184 people in homes or halfway houses for drug/alcohol abuse
- 141 people in residential treatment centers for emotionally disturbed children
- 93 people in mental (psychiatric) hospitals or wards
- 87 people in homes for the mentally ill
- 69 people in short-term care, detention or diagnostic centers for delinquent children
- 44 people in homes for the physically handicapped
- 42 people in hospitals or wards for drug/alcohol abuse
- 5 people in homes for abused, dependent, and neglected children
Banks with branches in St. Paul (2011 data):
- American Bank of St. Paul: Phalen Branch at 1425 Maryland Ave. East, branch established on 1964/04/27; Highland Branch at 2310 West Seventh Street, branch established on 1995/08/07. Info updated 2006/11/03: Bank assets: $413.3 mil, Deposits: $387.8 mil, headquarters in Saint Paul, MN, negative income in the last year, Commercial Lending Specialization, 10 total offices, Holding Company: American Bancorporation
- TCF National Bank: Midway Cub Branch at 1440 University Avenue, branch established on 1995/11/08; Scenic Hills Branch at 1988 Suburban Avenue, branch established on 1923/01/01. Info updated 2009/11/23: Bank assets: $19,007.0 mil, Deposits: $12,377.0 mil, headquarters in Sioux Falls, SD, positive income, Commercial Lending Specialization, 441 total offices, Holding Company: Tcf Financial Corporation
- Capital Bank: Drive-In Branch at 1020 Rice Street, branch established on 1972/12/22; at 1020 Rice Street, branch established on 1956/07/30. Info updated 2006/11/03: Bank assets: $36.6 mil, Deposits: $32.5 mil, local headquarters, positive income, 2 total offices, Holding Company: First Sleepy Eye Bancorporation, Inc.
- University National Bank: St. Paul Branch at 1351 Arcade Street, branch established on 1891/01/01; at 200 University Avenue West, branch established on 1962/07/17. Info updated 2011/04/18: Bank assets: $417.3 mil, Deposits: $384.5 mil, local headquarters, positive income, 2 total offices, Holding Company: University Financial Corp, Inc. Dba Sunrise Community Banks
- Western Bank: at 663 University Avenue, branch established on 1915/06/11. Info updated 2006/11/03: Bank assets: $384.3 mil, Deposits: $329.7 mil, local headquarters, positive income, Commercial Lending Specialization, 5 total offices, Holding Company: Western Bancshares, Inc.
- Wells Fargo Bank, National Association: Macalaster Groveland Branch at 1827 Grand Avenue, branch established on 1985/12/31. Info updated 2011/04/05: Bank assets: $1,161,490.0 mil, Deposits: $905,653.0 mil, headquarters in Sioux Falls, SD, positive income, 6395 total offices, Holding Company: Wells Fargo & Company
- BankCherokee: Grand Avenue Branch at 985 Grand Avenue, branch established on 1986/01/13. Info updated 2006/11/03: Bank assets: $241.1 mil, Deposits: $211.3 mil, headquarters in Saint Paul, MN, negative income in the last year, Commercial Lending Specialization, 4 total offices, Holding Company: Cherokee Bancshares, Inc.
- Bremer Bank, National Association: Midway Branch at 427 North Snelling Ave, branch established on 1891/01/01. Info updated 2006/11/03: Bank assets: $2,725.5 mil, Deposits: $2,268.8 mil, headquarters in South St. Paul, MN, positive income, Commercial Lending Specialization, 29 total offices, Holding Company: Otto Bremer Foundation
For population 15 years and over in St. Paul:
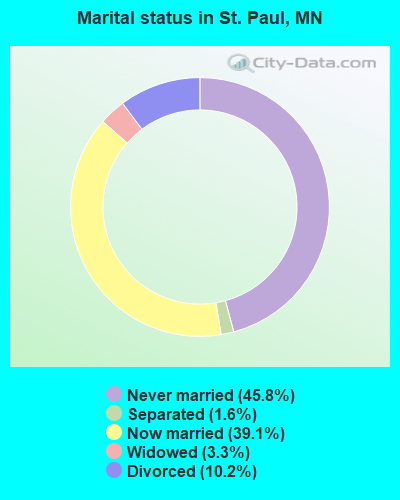
- Never married: 45.8%
- Now married: 39.1%
- Separated: 1.6%
- Widowed: 3.3%
- Divorced: 10.2%
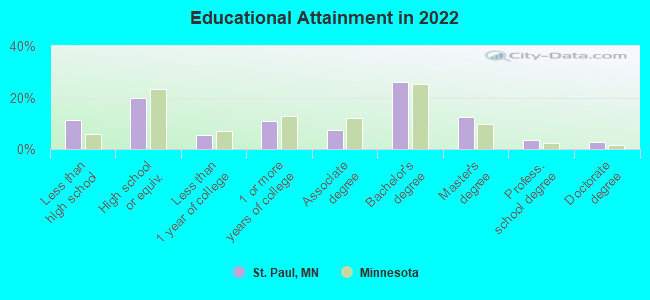
For population 25 years and over in St. Paul:
- High school or higher: 88.6%
- Bachelor's degree or higher: 45.0%
- Graduate or professional degree: 18.9%
- Unemployed: 5.7%
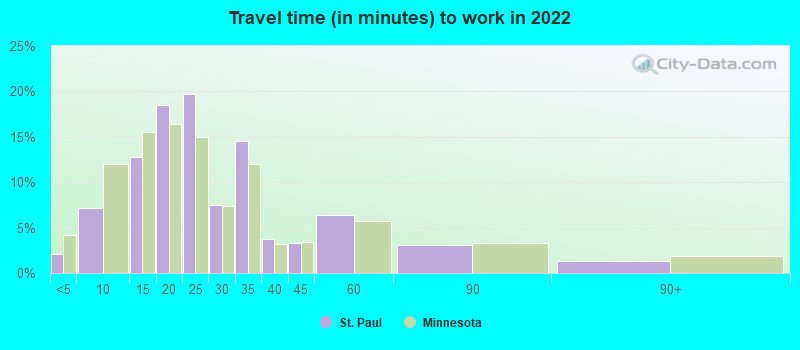
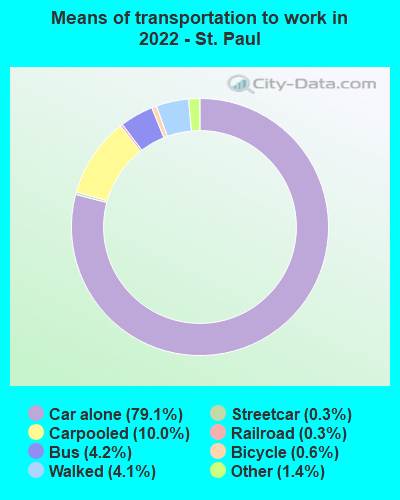
- Mean travel time to work (commute): 16.6 minutes
| Here: | 15.5 |
| Minnesota average: | 10.9 |
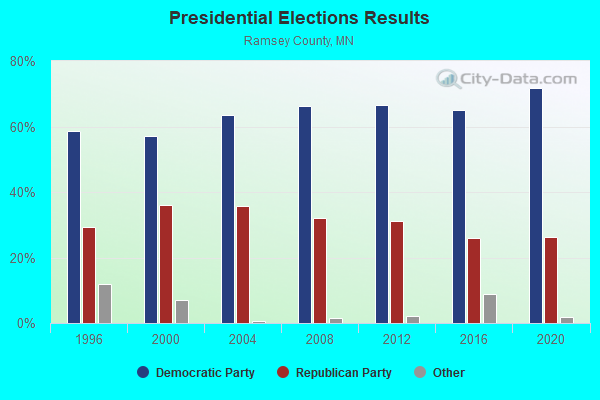
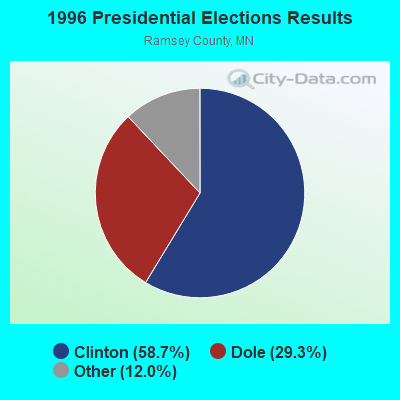
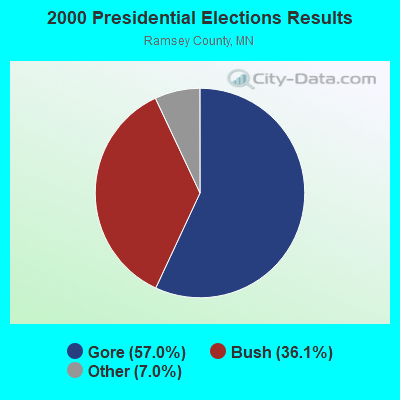

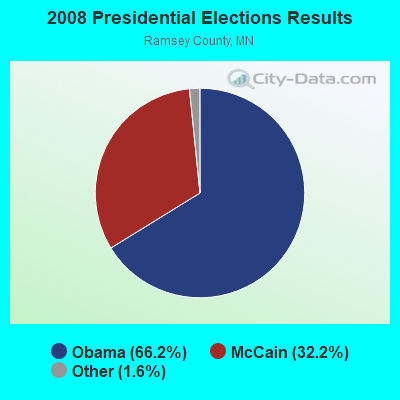
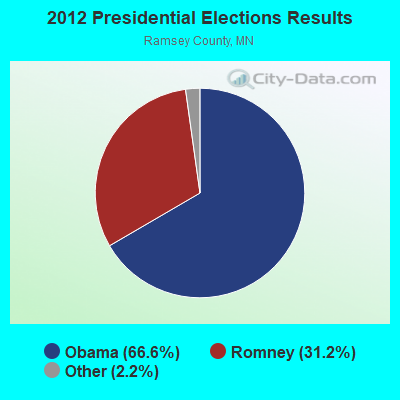
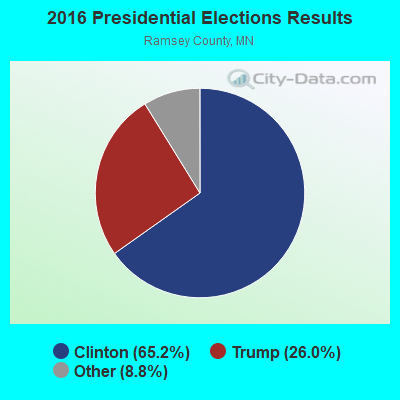
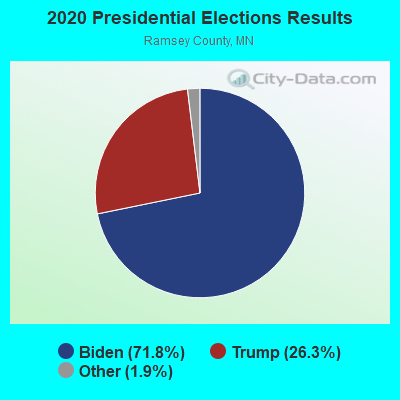
Graphs represent county-level data. Detailed 2008 Election Results
Religion statistics for St. Paul, MN (based on Ramsey County data)
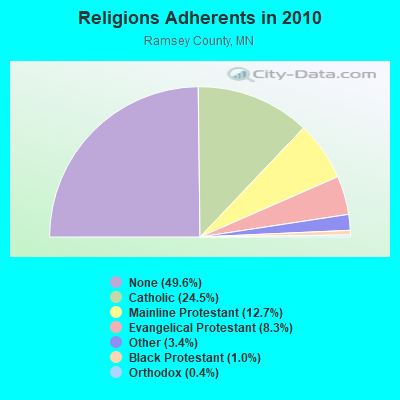
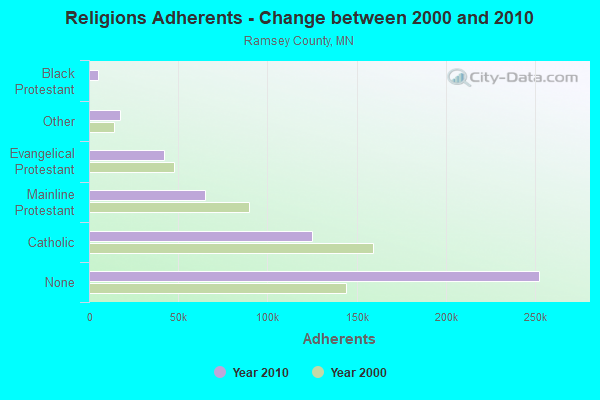
| Religion | Adherents | Congregations |
|---|---|---|
| Catholic | 124,823 | 44 |
| Mainline Protestant | 64,738 | 123 |
| Evangelical Protestant | 42,137 | 154 |
| Other | 17,440 | 38 |
| Black Protestant | 5,032 | 13 |
| Orthodox | 2,070 | 9 |
| None | 252,400 | - |
Food Environment Statistics:
| This county: | 1.83 / 10,000 pop. |
| State: | 1.83 / 10,000 pop. |
| This county: | 0.06 / 10,000 pop. |
| State: | 0.13 / 10,000 pop. |
| This county: | 0.54 / 10,000 pop. |
| Minnesota: | 0.49 / 10,000 pop. |
| This county: | 2.77 / 10,000 pop. |
| Minnesota: | 3.90 / 10,000 pop. |
| Here: | 6.76 / 10,000 pop. |
| Minnesota: | 6.98 / 10,000 pop. |
| Ramsey County: | 7.3% |
| State: | 6.5% |
| This county: | 25.5% |
| State: | 25.9% |
| This county: | 14.7% |
| Minnesota: | 13.0% |
Health and Nutrition:
| St. Paul: | 50.9% |
| State: | 50.6% |
| St. Paul: | 49.4% |
| Minnesota: | 48.4% |
| This city: | 28.1 |
| Minnesota: | 28.5 |
| St. Paul: | 19.6% |
| Minnesota: | 21.0% |
| St. Paul: | 11.0% |
| Minnesota: | 9.8% |
| St. Paul: | 6.8 |
| Minnesota: | 6.8 |
| This city: | 30.9% |
| State: | 33.5% |
| Here: | 58.5% |
| Minnesota: | 57.7% |
| This city: | 81.2% |
| Minnesota: | 79.3% |
More about Health and Nutrition of St. Paul, MN Residents
St. Paul government finances - Expenditure in 2021 (per resident):
- Construction - Regular Highways: $58,791,000 ($193.92)
Housing and Community Development: $12,862,000 ($42.42)
Sea and Inland Port Facilities: $672,000 ($2.22)
- Current Operations - Housing and Community Development: $167,279,000 ($551.76)
Police Protection: $138,136,000 ($455.63)
General - Other: $126,524,000 ($417.33)
Local Fire Protection: $68,343,000 ($225.42)
Parks and Recreation: $56,207,000 ($185.39)
Sewerage: $54,168,000 ($178.67)
Sea and Inland Port Facilities: $54,078,000 ($178.37)
Water Utilities: $51,835,000 ($170.97)
Regular Highways: $48,004,000 ($158.34)
Protective Inspection and Regulation - Other: $19,734,000 ($65.09)
Libraries: $18,020,000 ($59.44)
Parking Facilities: $10,187,000 ($33.60)
Solid Waste Management: $8,658,000 ($28.56)
Central Staff Services: $5,315,000 ($17.53)
Financial Administration: $3,763,000 ($12.41)
Health - Other: $1,816,000 ($5.99)
- General - Interest on Debt: $38,739,000 ($127.78)
- Other Capital Outlay - Parks and Recreation: $27,944,000 ($92.17)
Water Utilities: $17,556,000 ($57.91)
Sewerage: $6,212,000 ($20.49)
General - Other: $3,425,000 ($11.30)
Housing and Community Development: $3,211,000 ($10.59)
Police Protection: $2,122,000 ($7.00)
Local Fire Protection: $1,795,000 ($5.92)
- Total Salaries and Wages: $2,015,000 ($6.65)
- Water Utilities - Interest on Debt: $532,000 ($1.75)
St. Paul government finances - Revenue in 2021 (per resident):
- Charges - Sewerage: $77,041,000 ($254.11)
Housing and Community Development: $70,540,000 ($232.67)
Other: $54,987,000 ($181.37)
Sea and Inland Port Facilities: $35,281,000 ($116.37)
Parking Facilities: $11,955,000 ($39.43)
Parks and Recreation: $10,547,000 ($34.79)
Regular Highways: $6,804,000 ($22.44)
Solid Waste Management: $1,046,000 ($3.45)
- Federal Intergovernmental - Housing and Community Development: $84,093,000 ($277.37)
Health and Hospitals: $23,582,000 ($77.78)
Highways: $10,681,000 ($35.23)
Other: $4,952,000 ($16.33)
- Local Intergovernmental - Other: $9,780,000 ($32.26)
Highways: $2,676,000 ($8.83)
Water Utilities: $183,000 ($0.60)
Sewerage: $73,000 ($0.24)
- Miscellaneous - Special Assessments: $27,457,000 ($90.56)
General Revenue - Other: $23,049,000 ($76.03)
Interest Earnings: $11,947,000 ($39.41)
Sale of Property: $2,707,000 ($8.93)
Fines and Forfeits: $1,288,000 ($4.25)
- Revenue - Water Utilities: $79,849,000 ($263.38)
- State Intergovernmental - General Local Government Support: $69,279,000 ($228.51)
Other: $34,012,000 ($112.19)
Highways: $10,096,000 ($33.30)
Housing and Community Development: $1,291,000 ($4.26)
Water Utilities: $50,000 ($0.16)
- Tax - Property: $185,294,000 ($611.18)
Public Utilities Sales: $27,062,000 ($89.26)
General Sales and Gross Receipts: $17,774,000 ($58.63)
Other License: $15,249,000 ($50.30)
Other Selective Sales: $1,647,000 ($5.43)
Amusements Sales: $289,000 ($0.95)
St. Paul government finances - Debt in 2021 (per resident):
- Long Term Debt - Beginning Outstanding - Public Debt for Private Purpose: $2,239,400,000 ($7386.47)
Outstanding Nonguaranteed - Industrial Revenue: $1,820,572,000 ($6005.00)
Retired Nonguaranteed - Public Debt for Private Purpose: $1,325,829,000 ($4373.13)
Beginning Outstanding - Unspecified Public Purpose: $868,073,000 ($2863.26)
Outstanding Unspecified Public Purpose: $740,635,000 ($2442.92)
Issue, Unspecified Public Purpose: $192,556,000 ($635.13)
Retired Unspecified Public Purpose: $108,401,000 ($357.55)
Issue, Nonguaranteed - Public Debt for Private Purpose: $7,000,000 ($23.09)
St. Paul government finances - Cash and Securities in 2021 (per resident):
- Bond Funds - Cash and Securities: $4,225,000 ($13.94)
- Other Funds - Cash and Securities: $377,088,000 ($1243.79)
- Sinking Funds - Cash and Securities: $1,883,554,000 ($6212.74)
8.61% of this county's 2021 resident taxpayers lived in other counties in 2020 ($57,378 average adjusted gross income)
| Here: | 8.61% |
| Minnesota average: | 7.43% |
0.01% of residents moved from foreign countries ($84 average AGI)
Ramsey County: 0.01% Minnesota average: 0.00%
Top counties from which taxpayers relocated into this county between 2020 and 2021:
| from Hennepin County, MN | |
| from Washington County, MN | |
| from Dakota County, MN |
| Businesses in St. Paul, MN | ||||
| Name | Count | Name | Count | |
|---|---|---|---|---|
| ALDI | 2 | Holiday Inn | 3 | |
| American Eagle Outfitters | 1 | Hot Topic | 1 | |
| Arby's | 5 | Houlihan's | 1 | |
| Bakers Square | 1 | J.Crew | 1 | |
| Barnes & Noble | 1 | Jimmy John's | 3 | |
| Ben & Jerry's | 1 | Little Caesars Pizza | 3 | |
| Blockbuster | 3 | Macy's | 1 | |
| Budget Car Rental | 2 | McDonald's | 12 | |
| Burger King | 3 | Nike | 8 | |
| Caribou Coffee | 14 | OfficeMax | 1 | |
| Carson Pirie Scott | 1 | Pac Sun | 1 | |
| Chipotle | 3 | Pottery Barn | 1 | |
| Domino's Pizza | 1 | Starbucks | 3 | |
| Express | 1 | Super 8 | 1 | |
| Famous Footwear | 1 | T.J.Maxx | 1 | |
| Foot Locker | 2 | The Room Place | 1 | |
| Forever 21 | 1 | Trader Joe's | 1 | |
| Haworth | 1 | White Castle | 3 | |
Strongest AM radio stations in St. Paul:
- KSTP (1500 AM; 50 kW; ST. PAUL, MN; Owner: KSTP-AM, LLC (DELAWARE))
- KTIS (900 AM; 25 kW; MINNEAPOLIS, MN; Owner: NORTHWESTERN COLLEGE)
- WCTS (1030 AM; 50 kW; MAPLEWOOD, MN; Owner: CNTL. BAPT. THEO/AL SEMI MINNEAPOLIS)
- KUOM (770 AM; daytime; 5 kW; MINNEAPOLIS, MN)
- WCCO (830 AM; 50 kW; MINNEAPOLIS, MN; Owner: INFINITY MEDIA CORPORATION)
- KFAN (1130 AM; 50 kW; MINNEAPOLIS, MN; Owner: AMFM RADIO LICENSES, L.L.C.)
- KLBB (1400 AM; 1 kW; ST. PAUL, MN; Owner: 1400, INC.)
- KKMS (980 AM; 5 kW; RICHFIELD, MN)
- WWTC (1280 AM; 5 kW; MINNEAPOLIS, MN; Owner: SCA LICENSE CORPORATION)
- WMNN (1330 AM; 10 kW; MINNEAPOLIS, MN; Owner: MINNESOTA PUBLIC RADIO.)
- WDGY (630 AM; 8 kW; HUDSON, WI; Owner: 630 RADIO, INCORPORATED)
- KDIZ (1440 AM; 5 kW; GOLDEN VALLEY, MN; Owner: KQRS, INC.)
- KYCR (1570 AM; 4 kW; GOLDEN VALLEY, MN; Owner: COMMON GROUND BROADCASTING COMPANY,)
Strongest FM radio stations in St. Paul:
- KNOF (95.3 FM; ST. PAUL, MN; Owner: SELBY GOSPEL BROADCASTING CORPORATION)
- KNOW-FM (91.1 FM; MINNEAPOLIS-ST. PAUL, MN; Owner: MINNESOTA PUBLIC RADIO)
- WLTE (102.9 FM; MINNEAPOLIS, MN; Owner: INFINITY MEDIA CORPORATION)
- KSTP-FM (94.5 FM; ST. PAUL, MN; Owner: KSTP-FM, LLC, A DELAWARE LLC)
- KEEY-FM (102.1 FM; ST. PAUL, MN; Owner: AMFM RADIO LICENSES, L.L.C.)
- KTIS-FM (98.5 FM; MINNEAPOLIS, MN; Owner: NORTHWESTERN COLLEGE)
- KDWB-FM (101.3 FM; RICHFIELD, MN; Owner: AMFM RADIO LICENSES, L.L.C.)
- KQRS-FM (92.5 FM; GOLDEN VALLEY, MN; Owner: KQRS, Inc.)
- KSJN (99.5 FM; MINNEAPOLIS, MN; Owner: MINNESOTA PUBLIC RADIO)
- KXXR (93.7 FM; MINNEAPOLIS, MN; Owner: KQRS, INC.)
- KBEM-FM (88.5 FM; MINNEAPOLIS, MN; Owner: BD. OF EDUCATION, S.S.D. NO. 1)
- K294AM (106.7 FM; WEST ST. PAUL, MN; Owner: FRESH AIR, INCORPORATED)
- WMCN (91.7 FM; ST. PAUL, MN; Owner: MACALESTER COLLEGE)
- K214DF (90.7 FM; GOLDEN VALLEY, MN; Owner: EDUCATIONAL MEDIA FOUNDATION)
- KTCZ-FM (97.1 FM; MINNEAPOLIS, MN; Owner: AMFM RADIO LICENSES, L.L.C.)
- KFAI (90.3 FM; MINNEAPOLIS, MN; Owner: FRESH AIR, INC.)
- KQQL (107.9 FM; ANOKA, MN; Owner: AMFM RADIO LICENSES, L.L.C.)
- WXPT (104.1 FM; ST. LOUIS PARK, MN; Owner: THE AUDIO HOUSE, INC.)
- WCAL (89.3 FM; NORTHFIELD, MN; Owner: ST. OLAF COLLEGE)
- WFMP (107.1 FM; COON RAPIDS, MN; Owner: WFMP-FM, LLC)
TV broadcast stations around St. Paul:
- KMSP-TV (Channel 9; MINNEAPOLIS, MN; Owner: FOX TELEVISION STATIONS, INC.)
- KTCA-TV (Channel 2; ST. PAUL, MN; Owner: TWIN CITIES PUBLIC TELEVISION, INC.)
- KARE (Channel 11; MINNEAPOLIS, MN; Owner: MULTIMEDIA HOLDINGS CORPORATION)
- KSTP-TV (Channel 5; ST. PAUL, MN; Owner: HUBBARD BROADCASTING, INC.)
- KTCI-TV (Channel 17; ST. PAUL, MN; Owner: TWIN CITIES PUBLIC TELEVISION, INC.)
- WCCO-TV (Channel 4; MINNEAPOLIS, MN; Owner: CBS BROADCASTING INC.)
- KMWB (Channel 23; MINNEAPOLIS, MN; Owner: KLGT LICENSEE, LLC)
- KSTC-TV (Channel 45; MINNEAPOLIS, MN; Owner: HUBBARD BROADCASTING, INC.)
- WFTC (Channel 29; MINNEAPOLIS, MN; Owner: FOX TELEVISION STATIONS, INC.)
- K07UI (Channel 7; MINNEAPOLIS, ETC., MN; Owner: WORD OF GOD FELLOWSHIP, INC.)
- K58BS (Channel 58; MINNEAPOLIS, MN; Owner: TRINITY BROADCASTING NETWORK)
- K67HG (Channel 67; MINNEAPOLIS, MN; Owner: VENTANA TELEVISION, INC.)
- K14KH (Channel 14; MINNEAPOLIS, MN; Owner: THREE ANGELS BROADCASTING NETWORK)
- K19ER (Channel 19; ST. PAUL, MN; Owner: CATHOLIC VIEWS BROADCASTS, INC.)
- W62BD (Channel 62; MINNEAPOLIS, MN; Owner: WORD OF GOD FELLOWSHIP, INC.)
- WBWX-CA (Channel 13; MINNEAPOLIS, MN; Owner: THE BOX WORLDWIDE LLC)
- KPXM (Channel 41; ST. CLOUD, MN; Owner: PAXSON MINNEAPOLIS LICENSE, INC.)
- W55AP (Channel 55; RIVER FALLS, WI; Owner: STATE OF WISCONSIN - EDUCATIONAL COMMUNICATIONS BOARD)
Medal of Honor Recipients
Medal of Honor Recipients born in St. Paul: Charles H. Montrose, Jesse Farley Dyer, Richard E. Fleming, Robert J. Pruden.
- National Bridge Inventory (NBI) Statistics
- 516Number of bridges
- 7,621ft / 2,323mTotal length
- $24,476,989,000Total costs
- 16,200,537Total average daily traffic
- 528,626Total average daily truck traffic
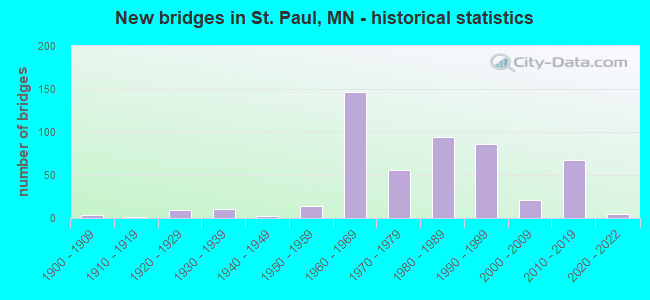
- New bridges - historical statistics
- 1Before 1900
- 41900-1909
- 11910-1919
- 91920-1929
- 101930-1939
- 21940-1949
- 141950-1959
- 1461960-1969
- 561970-1979
- 941980-1989
- 861990-1999
- 212000-2009
- 672010-2019
- 52020-2022
FCC Registered Commercial Land Mobile Towers: 1 (See the full list of FCC Registered Commercial Land Mobile Towers in St. Paul, MN)
FCC Registered Private Land Mobile Towers: 3 (See the full list of FCC Registered Private Land Mobile Towers)
FCC Registered Broadcast Land Mobile Towers: 115 (See the full list of FCC Registered Broadcast Land Mobile Towers)
FCC Registered Microwave Towers: 97 (See the full list of FCC Registered Microwave Towers in this town)
FCC Registered Paging Towers: 21 (See the full list of FCC Registered Paging Towers)
FCC Registered Amateur Radio Licenses: 37 (See the full list of FCC Registered Amateur Radio Licenses in St. Paul)
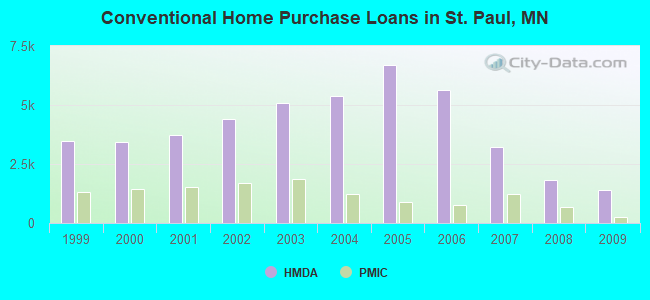
| Home Mortgage Disclosure Act Aggregated Statistics For Year 2009 (Based on 81 full tracts) | ||||||||||||||
| A) FHA, FSA/RHS & VA Home Purchase Loans | B) Conventional Home Purchase Loans | C) Refinancings | D) Home Improvement Loans | E) Loans on Dwellings For 5+ Families | F) Non-occupant Loans on < 5 Family Dwellings (A B C & D) | G) Loans On Manufactured Home Dwelling (A B C & D) | ||||||||
|---|---|---|---|---|---|---|---|---|---|---|---|---|---|---|
| Number | Average Value | Number | Average Value | Number | Average Value | Number | Average Value | Number | Average Value | Number | Average Value | Number | Average Value | |
| LOANS ORIGINATED | 1,526 | $145,805 | 1,412 | $149,187 | 4,422 | $191,758 | 311 | $73,736 | 56 | $1,038,054 | 685 | $120,923 | 2 | $44,000 |
| APPLICATIONS APPROVED, NOT ACCEPTED | 85 | $134,082 | 105 | $145,943 | 476 | $178,574 | 45 | $43,644 | 5 | $369,000 | 40 | $118,025 | 2 | $31,000 |
| APPLICATIONS DENIED | 170 | $126,447 | 216 | $126,051 | 1,679 | $175,175 | 235 | $61,209 | 9 | $342,778 | 218 | $125,257 | 7 | $51,000 |
| APPLICATIONS WITHDRAWN | 179 | $135,749 | 186 | $144,968 | 1,026 | $182,912 | 70 | $73,214 | 3 | $290,000 | 131 | $130,603 | 1 | $148,000 |
| FILES CLOSED FOR INCOMPLETENESS | 27 | $121,037 | 24 | $143,333 | 354 | $159,576 | 27 | $95,148 | 0 | $0 | 16 | $117,938 | 0 | $0 |
Detailed mortgage data for all 82 tracts in St. Paul, MN
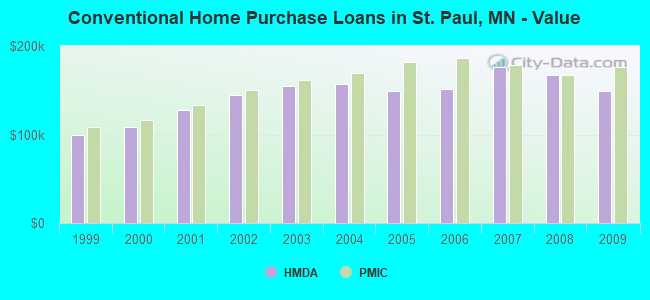
| Private Mortgage Insurance Companies Aggregated Statistics For Year 2009 (Based on 74 full tracts) | ||||||
| A) Conventional Home Purchase Loans | B) Refinancings | C) Non-occupant Loans on < 5 Family Dwellings (A & B) | ||||
|---|---|---|---|---|---|---|
| Number | Average Value | Number | Average Value | Number | Average Value | |
| LOANS ORIGINATED | 260 | $176,077 | 94 | $214,713 | 2 | $68,500 |
| APPLICATIONS APPROVED, NOT ACCEPTED | 57 | $158,140 | 42 | $214,190 | 2 | $107,500 |
| APPLICATIONS DENIED | 27 | $167,000 | 15 | $196,267 | 0 | $0 |
| APPLICATIONS WITHDRAWN | 24 | $163,792 | 9 | $259,667 | 1 | $152,000 |
| FILES CLOSED FOR INCOMPLETENESS | 13 | $153,385 | 4 | $273,750 | 1 | $31,000 |
2002 - 2011 National Fire Incident Reporting System (NFIRS) incidents
- Fire incident types reported to NFIRS in St. Paul, MN
- 9835.9%Outside Fires
- 9434.4%Mobile Property/Vehicle Fires
- 6523.8%Structure Fires
- 165.9%Other
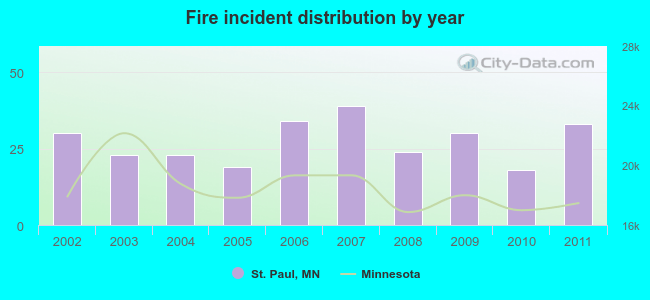 Based on the data from the years 2002 - 2011 the average number of fire incidents per year is 27. The highest number of reported fire incidents - 39 took place in 2007, and the least - 18 in 2010. The data has a rising trend.
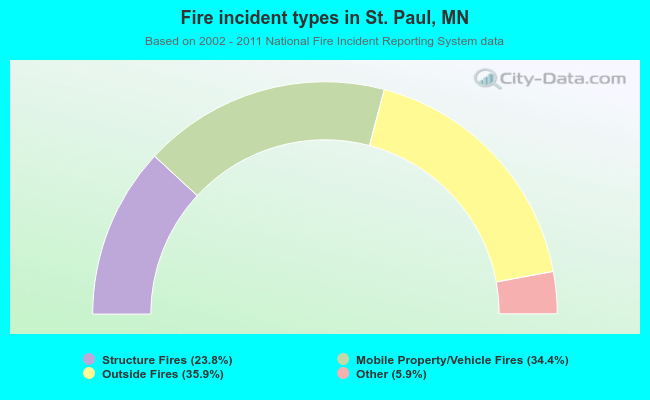 When looking into fire subcategories, the most reports belonged to: Outside Fires (35.9%), and Mobile Property/Vehicle Fires (34.4%).
Fire-safe hotels and motels in St. Paul, Minnesota:
- Holiday Inn St. Paul Downtown, 175 W 7TH St, St. Paul, Minnesota 55102 , Phone: (651) 556-1407, Fax: (651) 556-1413
- Hotel Metro St. Paul, 2201 Burns Ave, St. Paul, Minnesota 55119 , Phone: (651) 731-2220, Fax: (651) 731-0243
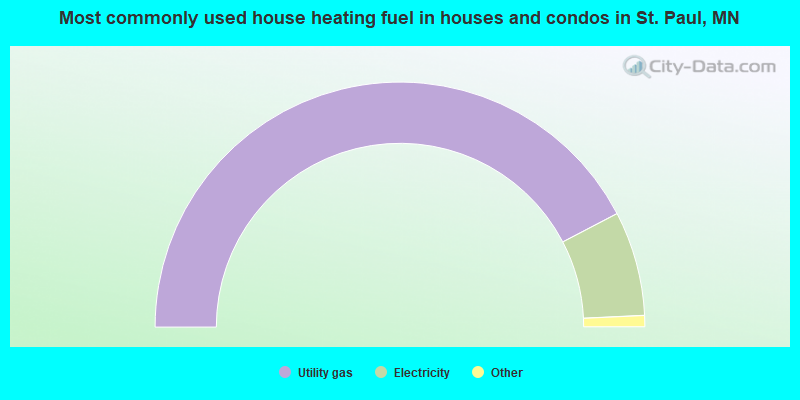
- 84.7%Utility gas
- 13.8%Electricity
- 0.7%Bottled, tank, or LP gas
- 0.5%Other fuel
- 0.1%No fuel used
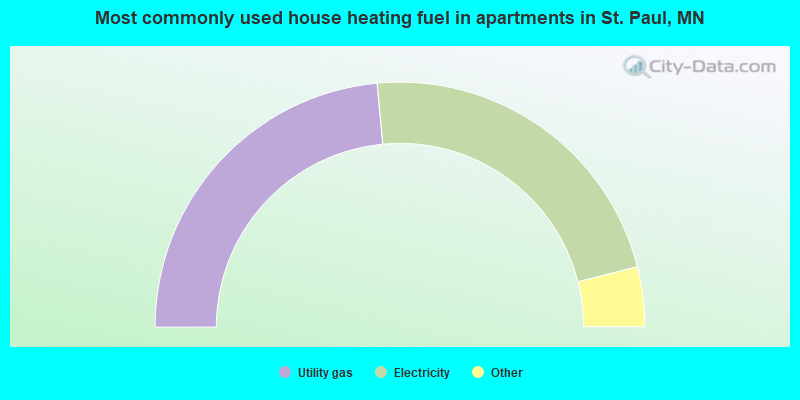
- 47.0%Utility gas
- 45.0%Electricity
- 3.1%No fuel used
- 2.1%Other fuel
- 1.9%Bottled, tank, or LP gas
- 0.4%Solar energy
- 0.2%Wood
- 0.2%Fuel oil, kerosene, etc.
St. Paul compared to Minnesota state average:
- Unemployed percentage below state average.
- Black race population percentage above state average.
- Median age significantly below state average.
- Foreign-born population percentage significantly above state average.
- Renting percentage above state average.
- House age above state average.
- Percentage of population with a bachelor's degree or higher above state average.
St. Paul, MN compared to other similar cities:
St. Paul on our top lists:
- #18 on the list of "Top 101 cities with the largest temperature differences during a year (population 50,000+)"
- #20 on the list of "Top 101 cities with the most residents born in Thailand (population 500+)"
- #21 on the list of "Top 101 cities with the coldest winters (population 50,000+)"
- #22 on the list of "Top 101 cities with the lowest daily low temperatures (population 50,000+)"
- #28 on the list of "Top 101 cities with the most residents born in Laos (population 500+)"
- #28 on the list of "Top 100 cities with old houses but young residents (pop. 50,000+)"
- #31 on the list of "Top 101 cities with largest percentage of males in occupations: arts, design, entertainment, sports, and media occupations (population 50,000+)"
- #38 on the list of "Top 101 cities with the lowest average temperatures (population 50,000+)"
- #48 on the list of "Top 101 cities with the largest percentage of likely lesbian couples (counted as self-reported female-female unmarried-partner households) (population 50,000+)"
- #48 on the list of "Top 100 cities with oldest houses (pop. 50,000+)"
- #54 on the list of "Top 101 cities with the lowest percentage of family households, population 100,000+"
- #56 on the list of "Top 101 cities with the most residents born in Eastern Africa (population 500+)"
- #67 on the list of "Top 101 cities with the most residents born in Other Eastern Africa (population 500+)"
- #68 on the list of "Top 101 cities with the highest number of arson incidents per 100,000 residents, excludes tourist destinations and others with a lot of outsiders visiting based on city industries data (population 50,000+)"
- #68 on the list of "Top 101 cities with the highest average snowfall in a year (population 50,000+)"
- #70 on the list of "Top 101 cities with the most residents born in Ethiopia (population 500+)"
- #71 on the list of "Top 101 cities with largest percentage of males in occupations: education, training, and library occupations (population 50,000+)"
- #77 on the list of "Top 101 cities with the least cars per house, population 50,000+"
- #80 on the list of "Top 101 cities with the highest number of auto thefts per 100,000 residents, excludes tourist destinations and others with a lot of outsiders visiting based on city industries data (population 50,000+)"
- #80 on the list of "Top 100 most racially diverse cities (pop. 50,000+)"
- #86 (55102) on the list of "Top 101 zip codes with the most big companies in 2005 (at least 1000 employees)"
- #87 (55101) on the list of "Top 101 zip codes with the largest percentage of Norwegian first ancestries (pop 5,000+)"
- #13 on the list of "Top 101 counties with the highest percentage of residents that exercised in the past month"
- #14 on the list of "Top 101 counties with the highest carbon monoxide air pollution readings in 2012 (ppm)"
- #34 on the list of "Top 101 counties with the highest percentage of residents that visited a dentist within the past year"
- #34 on the list of "Top 101 counties with the largest increase in the number of births per 1000 residents 2000-2006 to 2007-2013 (pop 50,000+)"
- #38 on the list of "Top 101 counties with the largest increase in the number of infant deaths per 1000 residents 2000-2006 to 2007-2013 (pop. 50,000+)"
State forum archive:

|
|
Total of 5026 patent applications in 2008-2024.