Maplewood, Minnesota Submit your own pictures of this city and show them to the world
OSM Map
General Map
Google Map
MSN Map
OSM Map
General Map
Google Map
MSN Map
OSM Map
General Map
Google Map
MSN Map
OSM Map
General Map
Google Map
MSN Map
Please wait while loading the map...
Population in 2022: 40,000 (100% urban, 0% rural). Population change since 2000: +14.5%Males: 19,792 Females: 20,208
March 2022 cost of living index in Maplewood: 113.6 (more than average, U.S. average is 100) Percentage of residents living in poverty in 2022: 10.7%for White Non-Hispanic residents , 9.0% for Black residents , 20.2% for Hispanic or Latino residents , 28.5% for American Indian residents , 0.5% for other race residents , 27.1% for two or more races residents )
Profiles of local businesses
Business Search - 14 Million verified businesses
Data:
Median household income ($)
Median household income (% change since 2000)
Household income diversity
Ratio of average income to average house value (%)
Ratio of average income to average rent
Median household income ($) - White
Median household income ($) - Black or African American
Median household income ($) - Asian
Median household income ($) - Hispanic or Latino
Median household income ($) - American Indian and Alaska Native
Median household income ($) - Multirace
Median household income ($) - Other Race
Median household income for houses/condos with a mortgage ($)
Median household income for apartments without a mortgage ($)
Races - White alone (%)
Races - White alone (% change since 2000)
Races - Black alone (%)
Races - Black alone (% change since 2000)
Races - American Indian alone (%)
Races - American Indian alone (% change since 2000)
Races - Asian alone (%)
Races - Asian alone (% change since 2000)
Races - Hispanic (%)
Races - Hispanic (% change since 2000)
Races - Native Hawaiian and Other Pacific Islander alone (%)
Races - Native Hawaiian and Other Pacific Islander alone (% change since 2000)
Races - Two or more races (%)
Races - Two or more races (% change since 2000)
Races - Other race alone (%)
Races - Other race alone (% change since 2000)
Racial diversity
Unemployment (%)
Unemployment (% change since 2000)
Unemployment (%) - White
Unemployment (%) - Black or African American
Unemployment (%) - Asian
Unemployment (%) - Hispanic or Latino
Unemployment (%) - American Indian and Alaska Native
Unemployment (%) - Multirace
Unemployment (%) - Other Race
Population density (people per square mile)
Population - Males (%)
Population - Females (%)
Population - Males (%) - White
Population - Males (%) - Black or African American
Population - Males (%) - Asian
Population - Males (%) - Hispanic or Latino
Population - Males (%) - American Indian and Alaska Native
Population - Males (%) - Multirace
Population - Males (%) - Other Race
Population - Females (%) - White
Population - Females (%) - Black or African American
Population - Females (%) - Asian
Population - Females (%) - Hispanic or Latino
Population - Females (%) - American Indian and Alaska Native
Population - Females (%) - Multirace
Population - Females (%) - Other Race
Coronavirus confirmed cases (Apr 27, 2024)
Deaths caused by coronavirus (Apr 27, 2024)
Coronavirus confirmed cases (per 100k population) (Apr 27, 2024)
Deaths caused by coronavirus (per 100k population) (Apr 27, 2024)
Daily increase in number of cases (Apr 27, 2024)
Weekly increase in number of cases (Apr 27, 2024)
Cases doubled (in days) (Apr 27, 2024)
Hospitalized patients (Apr 18, 2022)
Negative test results (Apr 18, 2022)
Total test results (Apr 18, 2022)
COVID Vaccine doses distributed (per 100k population) (Sep 19, 2023)
COVID Vaccine doses administered (per 100k population) (Sep 19, 2023)
COVID Vaccine doses distributed (Sep 19, 2023)
COVID Vaccine doses administered (Sep 19, 2023)
Likely homosexual households (%)
Likely homosexual households (% change since 2000)
Likely homosexual households - Lesbian couples (%)
Likely homosexual households - Lesbian couples (% change since 2000)
Likely homosexual households - Gay men (%)
Likely homosexual households - Gay men (% change since 2000)
Cost of living index
Median gross rent ($)
Median contract rent ($)
Median monthly housing costs ($)
Median house or condo value ($)
Median house or condo value ($ change since 2000)
Mean house or condo value by units in structure - 1, detached ($)
Mean house or condo value by units in structure - 1, attached ($)
Mean house or condo value by units in structure - 2 ($)
Mean house or condo value by units in structure by units in structure - 3 or 4 ($)
Mean house or condo value by units in structure - 5 or more ($)
Mean house or condo value by units in structure - Boat, RV, van, etc. ($)
Mean house or condo value by units in structure - Mobile home ($)
Median house or condo value ($) - White
Median house or condo value ($) - Black or African American
Median house or condo value ($) - Asian
Median house or condo value ($) - Hispanic or Latino
Median house or condo value ($) - American Indian and Alaska Native
Median house or condo value ($) - Multirace
Median house or condo value ($) - Other Race
Median resident age
Resident age diversity
Median resident age - Males
Median resident age - Females
Median resident age - White
Median resident age - Black or African American
Median resident age - Asian
Median resident age - Hispanic or Latino
Median resident age - American Indian and Alaska Native
Median resident age - Multirace
Median resident age - Other Race
Median resident age - Males - White
Median resident age - Males - Black or African American
Median resident age - Males - Asian
Median resident age - Males - Hispanic or Latino
Median resident age - Males - American Indian and Alaska Native
Median resident age - Males - Multirace
Median resident age - Males - Other Race
Median resident age - Females - White
Median resident age - Females - Black or African American
Median resident age - Females - Asian
Median resident age - Females - Hispanic or Latino
Median resident age - Females - American Indian and Alaska Native
Median resident age - Females - Multirace
Median resident age - Females - Other Race
Commute - mean travel time to work (minutes)
Travel time to work - Less than 5 minutes (%)
Travel time to work - Less than 5 minutes (% change since 2000)
Travel time to work - 5 to 9 minutes (%)
Travel time to work - 5 to 9 minutes (% change since 2000)
Travel time to work - 10 to 19 minutes (%)
Travel time to work - 10 to 19 minutes (% change since 2000)
Travel time to work - 20 to 29 minutes (%)
Travel time to work - 20 to 29 minutes (% change since 2000)
Travel time to work - 30 to 39 minutes (%)
Travel time to work - 30 to 39 minutes (% change since 2000)
Travel time to work - 40 to 59 minutes (%)
Travel time to work - 40 to 59 minutes (% change since 2000)
Travel time to work - 60 to 89 minutes (%)
Travel time to work - 60 to 89 minutes (% change since 2000)
Travel time to work - 90 or more minutes (%)
Travel time to work - 90 or more minutes (% change since 2000)
Marital status - Never married (%)
Marital status - Now married (%)
Marital status - Separated (%)
Marital status - Widowed (%)
Marital status - Divorced (%)
Median family income ($)
Median family income (% change since 2000)
Median non-family income ($)
Median non-family income (% change since 2000)
Median per capita income ($)
Median per capita income (% change since 2000)
Median family income ($) - White
Median family income ($) - Black or African American
Median family income ($) - Asian
Median family income ($) - Hispanic or Latino
Median family income ($) - American Indian and Alaska Native
Median family income ($) - Multirace
Median family income ($) - Other Race
Median year house/condo built
Median year apartment built
Year house built - Built 2005 or later (%)
Year house built - Built 2000 to 2004 (%)
Year house built - Built 1990 to 1999 (%)
Year house built - Built 1980 to 1989 (%)
Year house built - Built 1970 to 1979 (%)
Year house built - Built 1960 to 1969 (%)
Year house built - Built 1950 to 1959 (%)
Year house built - Built 1940 to 1949 (%)
Year house built - Built 1939 or earlier (%)
Average household size
Household density (households per square mile)
Average household size - White
Average household size - Black or African American
Average household size - Asian
Average household size - Hispanic or Latino
Average household size - American Indian and Alaska Native
Average household size - Multirace
Average household size - Other Race
Occupied housing units (%)
Vacant housing units (%)
Owner occupied housing units (%)
Renter occupied housing units (%)
Vacancy status - For rent (%)
Vacancy status - For sale only (%)
Vacancy status - Rented or sold, not occupied (%)
Vacancy status - For seasonal, recreational, or occasional use (%)
Vacancy status - For migrant workers (%)
Vacancy status - Other vacant (%)
Residents with income below the poverty level (%)
Residents with income below 50% of the poverty level (%)
Children below poverty level (%)
Poor families by family type - Married-couple family (%)
Poor families by family type - Male, no wife present (%)
Poor families by family type - Female, no husband present (%)
Poverty status for native-born residents (%)
Poverty status for foreign-born residents (%)
Poverty among high school graduates not in families (%)
Poverty among people who did not graduate high school not in families (%)
Residents with income below the poverty level (%) - White
Residents with income below the poverty level (%) - Black or African American
Residents with income below the poverty level (%) - Asian
Residents with income below the poverty level (%) - Hispanic or Latino
Residents with income below the poverty level (%) - American Indian and Alaska Native
Residents with income below the poverty level (%) - Multirace
Residents with income below the poverty level (%) - Other Race
Air pollution - Air Quality Index (AQI)
Air pollution - CO
Air pollution - NO2
Air pollution - SO2
Air pollution - Ozone
Air pollution - PM10
Air pollution - PM25
Air pollution - Pb
Crime - Murders per 100,000 population
Crime - Rapes per 100,000 population
Crime - Robberies per 100,000 population
Crime - Assaults per 100,000 population
Crime - Burglaries per 100,000 population
Crime - Thefts per 100,000 population
Crime - Auto thefts per 100,000 population
Crime - Arson per 100,000 population
Crime - City-data.com crime index
Crime - Violent crime index
Crime - Property crime index
Crime - Murders per 100,000 population (5 year average)
Crime - Rapes per 100,000 population (5 year average)
Crime - Robberies per 100,000 population (5 year average)
Crime - Assaults per 100,000 population (5 year average)
Crime - Burglaries per 100,000 population (5 year average)
Crime - Thefts per 100,000 population (5 year average)
Crime - Auto thefts per 100,000 population (5 year average)
Crime - Arson per 100,000 population (5 year average)
Crime - City-data.com crime index (5 year average)
Crime - Violent crime index (5 year average)
Crime - Property crime index (5 year average)
1996 Presidential Elections Results (%) - Democratic Party (Clinton)
1996 Presidential Elections Results (%) - Republican Party (Dole)
1996 Presidential Elections Results (%) - Other
2000 Presidential Elections Results (%) - Democratic Party (Gore)
2000 Presidential Elections Results (%) - Republican Party (Bush)
2000 Presidential Elections Results (%) - Other
2004 Presidential Elections Results (%) - Democratic Party (Kerry)
2004 Presidential Elections Results (%) - Republican Party (Bush)
2004 Presidential Elections Results (%) - Other
2008 Presidential Elections Results (%) - Democratic Party (Obama)
2008 Presidential Elections Results (%) - Republican Party (McCain)
2008 Presidential Elections Results (%) - Other
2012 Presidential Elections Results (%) - Democratic Party (Obama)
2012 Presidential Elections Results (%) - Republican Party (Romney)
2012 Presidential Elections Results (%) - Other
2016 Presidential Elections Results (%) - Democratic Party (Clinton)
2016 Presidential Elections Results (%) - Republican Party (Trump)
2016 Presidential Elections Results (%) - Other
2020 Presidential Elections Results (%) - Democratic Party (Biden)
2020 Presidential Elections Results (%) - Republican Party (Trump)
2020 Presidential Elections Results (%) - Other
Ancestries Reported - Arab (%)
Ancestries Reported - Czech (%)
Ancestries Reported - Danish (%)
Ancestries Reported - Dutch (%)
Ancestries Reported - English (%)
Ancestries Reported - French (%)
Ancestries Reported - French Canadian (%)
Ancestries Reported - German (%)
Ancestries Reported - Greek (%)
Ancestries Reported - Hungarian (%)
Ancestries Reported - Irish (%)
Ancestries Reported - Italian (%)
Ancestries Reported - Lithuanian (%)
Ancestries Reported - Norwegian (%)
Ancestries Reported - Polish (%)
Ancestries Reported - Portuguese (%)
Ancestries Reported - Russian (%)
Ancestries Reported - Scotch-Irish (%)
Ancestries Reported - Scottish (%)
Ancestries Reported - Slovak (%)
Ancestries Reported - Subsaharan African (%)
Ancestries Reported - Swedish (%)
Ancestries Reported - Swiss (%)
Ancestries Reported - Ukrainian (%)
Ancestries Reported - United States (%)
Ancestries Reported - Welsh (%)
Ancestries Reported - West Indian (%)
Ancestries Reported - Other (%)
Educational Attainment - No schooling completed (%)
Educational Attainment - Less than high school (%)
Educational Attainment - High school or equivalent (%)
Educational Attainment - Less than 1 year of college (%)
Educational Attainment - 1 or more years of college (%)
Educational Attainment - Associate degree (%)
Educational Attainment - Bachelor's degree (%)
Educational Attainment - Master's degree (%)
Educational Attainment - Professional school degree (%)
Educational Attainment - Doctorate degree (%)
School Enrollment - Nursery, preschool (%)
School Enrollment - Kindergarten (%)
School Enrollment - Grade 1 to 4 (%)
School Enrollment - Grade 5 to 8 (%)
School Enrollment - Grade 9 to 12 (%)
School Enrollment - College undergrad (%)
School Enrollment - Graduate or professional (%)
School Enrollment - Not enrolled in school (%)
School enrollment - Public schools (%)
School enrollment - Private schools (%)
School enrollment - Not enrolled (%)
Median number of rooms in houses and condos
Median number of rooms in apartments
Housing units lacking complete plumbing facilities (%)
Housing units lacking complete kitchen facilities (%)
Density of houses
Urban houses (%)
Rural houses (%)
Households with people 60 years and over (%)
Households with people 65 years and over (%)
Households with people 75 years and over (%)
Households with one or more nonrelatives (%)
Households with no nonrelatives (%)
Population in households (%)
Family households (%)
Nonfamily households (%)
Population in families (%)
Family households with own children (%)
Median number of bedrooms in owner occupied houses
Mean number of bedrooms in owner occupied houses
Median number of bedrooms in renter occupied houses
Mean number of bedrooms in renter occupied houses
Median number of vehichles in owner occupied houses
Mean number of vehichles in owner occupied houses
Median number of vehichles in renter occupied houses
Mean number of vehichles in renter occupied houses
Mortgage status - with mortgage (%)
Mortgage status - with second mortgage (%)
Mortgage status - with home equity loan (%)
Mortgage status - with both second mortgage and home equity loan (%)
Mortgage status - without a mortgage (%)
Average family size
Average family size - White
Average family size - Black or African American
Average family size - Asian
Average family size - Hispanic or Latino
Average family size - American Indian and Alaska Native
Average family size - Multirace
Average family size - Other Race
Geographical mobility - Same house 1 year ago (%)
Geographical mobility - Moved within same county (%)
Geographical mobility - Moved from different county within same state (%)
Geographical mobility - Moved from different state (%)
Geographical mobility - Moved from abroad (%)
Place of birth - Born in state of residence (%)
Place of birth - Born in other state (%)
Place of birth - Native, outside of US (%)
Place of birth - Foreign born (%)
Housing units in structures - 1, detached (%)
Housing units in structures - 1, attached (%)
Housing units in structures - 2 (%)
Housing units in structures - 3 or 4 (%)
Housing units in structures - 5 to 9 (%)
Housing units in structures - 10 to 19 (%)
Housing units in structures - 20 to 49 (%)
Housing units in structures - 50 or more (%)
Housing units in structures - Mobile home (%)
Housing units in structures - Boat, RV, van, etc. (%)
House/condo owner moved in on average (years ago)
Renter moved in on average (years ago)
Year householder moved into unit - Moved in 1999 to March 2000 (%)
Year householder moved into unit - Moved in 1995 to 1998 (%)
Year householder moved into unit - Moved in 1990 to 1994 (%)
Year householder moved into unit - Moved in 1980 to 1989 (%)
Year householder moved into unit - Moved in 1970 to 1979 (%)
Year householder moved into unit - Moved in 1969 or earlier (%)
Means of transportation to work - Drove car alone (%)
Means of transportation to work - Carpooled (%)
Means of transportation to work - Public transportation (%)
Means of transportation to work - Bus or trolley bus (%)
Means of transportation to work - Streetcar or trolley car (%)
Means of transportation to work - Subway or elevated (%)
Means of transportation to work - Railroad (%)
Means of transportation to work - Ferryboat (%)
Means of transportation to work - Taxicab (%)
Means of transportation to work - Motorcycle (%)
Means of transportation to work - Bicycle (%)
Means of transportation to work - Walked (%)
Means of transportation to work - Other means (%)
Working at home (%)
Industry diversity
Most Common Industries - Agriculture, forestry, fishing and hunting, and mining (%)
Most Common Industries - Agriculture, forestry, fishing and hunting (%)
Most Common Industries - Mining, quarrying, and oil and gas extraction (%)
Most Common Industries - Construction (%)
Most Common Industries - Manufacturing (%)
Most Common Industries - Wholesale trade (%)
Most Common Industries - Retail trade (%)
Most Common Industries - Transportation and warehousing, and utilities (%)
Most Common Industries - Transportation and warehousing (%)
Most Common Industries - Utilities (%)
Most Common Industries - Information (%)
Most Common Industries - Finance and insurance, and real estate and rental and leasing (%)
Most Common Industries - Finance and insurance (%)
Most Common Industries - Real estate and rental and leasing (%)
Most Common Industries - Professional, scientific, and management, and administrative and waste management services (%)
Most Common Industries - Professional, scientific, and technical services (%)
Most Common Industries - Management of companies and enterprises (%)
Most Common Industries - Administrative and support and waste management services (%)
Most Common Industries - Educational services, and health care and social assistance (%)
Most Common Industries - Educational services (%)
Most Common Industries - Health care and social assistance (%)
Most Common Industries - Arts, entertainment, and recreation, and accommodation and food services (%)
Most Common Industries - Arts, entertainment, and recreation (%)
Most Common Industries - Accommodation and food services (%)
Most Common Industries - Other services, except public administration (%)
Most Common Industries - Public administration (%)
Occupation diversity
Most Common Occupations - Management, business, science, and arts occupations (%)
Most Common Occupations - Management, business, and financial occupations (%)
Most Common Occupations - Management occupations (%)
Most Common Occupations - Business and financial operations occupations (%)
Most Common Occupations - Computer, engineering, and science occupations (%)
Most Common Occupations - Computer and mathematical occupations (%)
Most Common Occupations - Architecture and engineering occupations (%)
Most Common Occupations - Life, physical, and social science occupations (%)
Most Common Occupations - Education, legal, community service, arts, and media occupations (%)
Most Common Occupations - Community and social service occupations (%)
Most Common Occupations - Legal occupations (%)
Most Common Occupations - Education, training, and library occupations (%)
Most Common Occupations - Arts, design, entertainment, sports, and media occupations (%)
Most Common Occupations - Healthcare practitioners and technical occupations (%)
Most Common Occupations - Health diagnosing and treating practitioners and other technical occupations (%)
Most Common Occupations - Health technologists and technicians (%)
Most Common Occupations - Service occupations (%)
Most Common Occupations - Healthcare support occupations (%)
Most Common Occupations - Protective service occupations (%)
Most Common Occupations - Fire fighting and prevention, and other protective service workers including supervisors (%)
Most Common Occupations - Law enforcement workers including supervisors (%)
Most Common Occupations - Food preparation and serving related occupations (%)
Most Common Occupations - Building and grounds cleaning and maintenance occupations (%)
Most Common Occupations - Personal care and service occupations (%)
Most Common Occupations - Sales and office occupations (%)
Most Common Occupations - Sales and related occupations (%)
Most Common Occupations - Office and administrative support occupations (%)
Most Common Occupations - Natural resources, construction, and maintenance occupations (%)
Most Common Occupations - Farming, fishing, and forestry occupations (%)
Most Common Occupations - Construction and extraction occupations (%)
Most Common Occupations - Installation, maintenance, and repair occupations (%)
Most Common Occupations - Production, transportation, and material moving occupations (%)
Most Common Occupations - Production occupations (%)
Most Common Occupations - Transportation occupations (%)
Most Common Occupations - Material moving occupations (%)
People in Group quarters - Institutionalized population (%)
People in Group quarters - Correctional institutions (%)
People in Group quarters - Federal prisons and detention centers (%)
People in Group quarters - Halfway houses (%)
People in Group quarters - Local jails and other confinement facilities (including police lockups) (%)
People in Group quarters - Military disciplinary barracks (%)
People in Group quarters - State prisons (%)
People in Group quarters - Other types of correctional institutions (%)
People in Group quarters - Nursing homes (%)
People in Group quarters - Hospitals/wards, hospices, and schools for the handicapped (%)
People in Group quarters - Hospitals/wards and hospices for chronically ill (%)
People in Group quarters - Hospices or homes for chronically ill (%)
People in Group quarters - Military hospitals or wards for chronically ill (%)
People in Group quarters - Other hospitals or wards for chronically ill (%)
People in Group quarters - Hospitals or wards for drug/alcohol abuse (%)
People in Group quarters - Mental (Psychiatric) hospitals or wards (%)
People in Group quarters - Schools, hospitals, or wards for the mentally retarded (%)
People in Group quarters - Schools, hospitals, or wards for the physically handicapped (%)
People in Group quarters - Institutions for the deaf (%)
People in Group quarters - Institutions for the blind (%)
People in Group quarters - Orthopedic wards and institutions for the physically handicapped (%)
People in Group quarters - Wards in general hospitals for patients who have no usual home elsewhere (%)
People in Group quarters - Wards in military hospitals for patients who have no usual home elsewhere (%)
People in Group quarters - Juvenile institutions (%)
People in Group quarters - Long-term care (%)
People in Group quarters - Homes for abused, dependent, and neglected children (%)
People in Group quarters - Residential treatment centers for emotionally disturbed children (%)
People in Group quarters - Training schools for juvenile delinquents (%)
People in Group quarters - Short-term care, detention or diagnostic centers for delinquent children (%)
People in Group quarters - Type of juvenile institution unknown (%)
People in Group quarters - Noninstitutionalized population (%)
People in Group quarters - College dormitories (includes college quarters off campus) (%)
People in Group quarters - Military quarters (%)
People in Group quarters - On base (%)
People in Group quarters - Barracks, unaccompanied personnel housing (UPH), (Enlisted/Officer), ;and similar group living quarters for military personnel (%)
People in Group quarters - Transient quarters for temporary residents (%)
People in Group quarters - Military ships (%)
People in Group quarters - Group homes (%)
People in Group quarters - Homes or halfway houses for drug/alcohol abuse (%)
People in Group quarters - Homes for the mentally ill (%)
People in Group quarters - Homes for the mentally retarded (%)
People in Group quarters - Homes for the physically handicapped (%)
People in Group quarters - Other group homes (%)
People in Group quarters - Religious group quarters (%)
People in Group quarters - Dormitories (%)
People in Group quarters - Agriculture workers' dormitories on farms (%)
People in Group quarters - Job Corps and vocational training facilities (%)
People in Group quarters - Other workers' dormitories (%)
People in Group quarters - Crews of maritime vessels (%)
People in Group quarters - Other nonhousehold living situations (%)
People in Group quarters - Other noninstitutional group quarters (%)
Residents speaking English at home (%)
Residents speaking English at home - Born in the United States (%)
Residents speaking English at home - Native, born elsewhere (%)
Residents speaking English at home - Foreign born (%)
Residents speaking Spanish at home (%)
Residents speaking Spanish at home - Born in the United States (%)
Residents speaking Spanish at home - Native, born elsewhere (%)
Residents speaking Spanish at home - Foreign born (%)
Residents speaking other language at home (%)
Residents speaking other language at home - Born in the United States (%)
Residents speaking other language at home - Native, born elsewhere (%)
Residents speaking other language at home - Foreign born (%)
Class of Workers - Employee of private company (%)
Class of Workers - Self-employed in own incorporated business (%)
Class of Workers - Private not-for-profit wage and salary workers (%)
Class of Workers - Local government workers (%)
Class of Workers - State government workers (%)
Class of Workers - Federal government workers (%)
Class of Workers - Self-employed workers in own not incorporated business and Unpaid family workers (%)
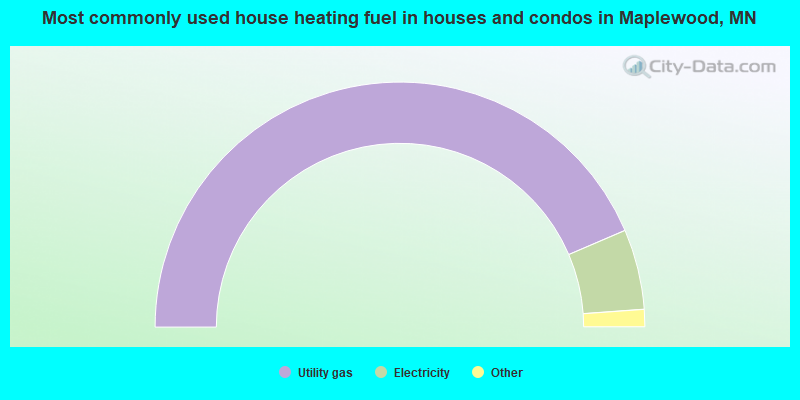
House heating fuel used in houses and condos - Utility gas (%)
House heating fuel used in houses and condos - Bottled, tank, or LP gas (%)
House heating fuel used in houses and condos - Electricity (%)
House heating fuel used in houses and condos - Fuel oil, kerosene, etc. (%)
House heating fuel used in houses and condos - Coal or coke (%)
House heating fuel used in houses and condos - Wood (%)
House heating fuel used in houses and condos - Solar energy (%)
House heating fuel used in houses and condos - Other fuel (%)
House heating fuel used in houses and condos - No fuel used (%)
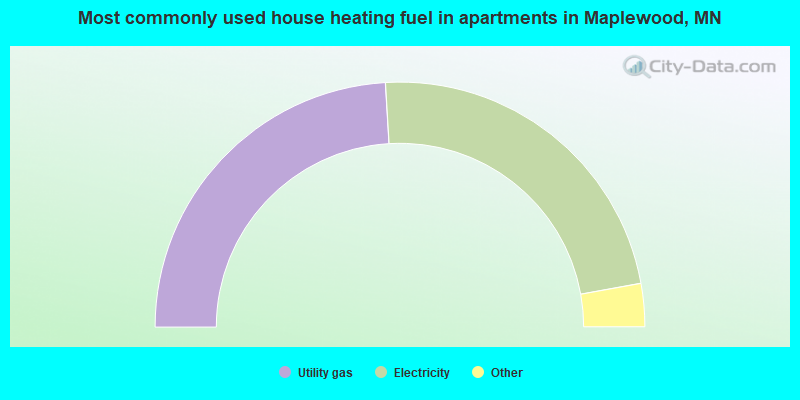
House heating fuel used in apartments - Utility gas (%)
House heating fuel used in apartments - Bottled, tank, or LP gas (%)
House heating fuel used in apartments - Electricity (%)
House heating fuel used in apartments - Fuel oil, kerosene, etc. (%)
House heating fuel used in apartments - Coal or coke (%)
House heating fuel used in apartments - Wood (%)
House heating fuel used in apartments - Solar energy (%)
House heating fuel used in apartments - Other fuel (%)
House heating fuel used in apartments - No fuel used (%)
Armed forces status - In Armed Forces (%)
Armed forces status - Civilian (%)
Armed forces status - Civilian - Veteran (%)
Armed forces status - Civilian - Nonveteran (%)
Fatal accidents locations in years 2005-2021
Fatal accidents locations in 2005
Fatal accidents locations in 2006
Fatal accidents locations in 2007
Fatal accidents locations in 2008
Fatal accidents locations in 2009
Fatal accidents locations in 2010
Fatal accidents locations in 2011
Fatal accidents locations in 2012
Fatal accidents locations in 2013
Fatal accidents locations in 2014
Fatal accidents locations in 2015
Fatal accidents locations in 2016
Fatal accidents locations in 2017
Fatal accidents locations in 2018
Fatal accidents locations in 2019
Fatal accidents locations in 2020
Fatal accidents locations in 2021
Alcohol use - People drinking some alcohol every month (%)
Alcohol use - People not drinking at all (%)
Alcohol use - Average days/month drinking alcohol
Alcohol use - Average drinks/week
Alcohol use - Average days/year people drink much
Audiometry - Average condition of hearing (%)
Audiometry - People that can hear a whisper from across a quiet room (%)
Audiometry - People that can hear normal voice from across a quiet room (%)
Audiometry - Ears ringing, roaring, buzzing (%)
Audiometry - Had a job exposure to loud noise (%)
Audiometry - Had off-work exposure to loud noise (%)
Blood Pressure & Cholesterol - Has high blood pressure (%)
Blood Pressure & Cholesterol - Checking blood pressure at home (%)
Blood Pressure & Cholesterol - Frequently checking blood cholesterol (%)
Blood Pressure & Cholesterol - Has high cholesterol level (%)
Consumer Behavior - Money monthly spent on food at supermarket/grocery store
Consumer Behavior - Money monthly spent on food at other stores
Consumer Behavior - Money monthly spent on eating out
Consumer Behavior - Money monthly spent on carryout/delivered foods
Consumer Behavior - Income spent on food at supermarket/grocery store (%)
Consumer Behavior - Income spent on food at other stores (%)
Consumer Behavior - Income spent on eating out (%)
Consumer Behavior - Income spent on carryout/delivered foods (%)
Current Health Status - General health condition (%)
Current Health Status - Blood donors (%)
Current Health Status - Has blood ever tested for HIV virus (%)
Current Health Status - Left-handed people (%)
Dermatology - People using sunscreen (%)
Diabetes - Diabetics (%)
Diabetes - Had a blood test for high blood sugar (%)
Diabetes - People taking insulin (%)
Diet Behavior & Nutrition - Diet health (%)
Diet Behavior & Nutrition - Milk product consumption (# of products/month)
Diet Behavior & Nutrition - Meals not home prepared (#/week)
Diet Behavior & Nutrition - Meals from fast food or pizza place (#/week)
Diet Behavior & Nutrition - Ready-to-eat foods (#/month)
Diet Behavior & Nutrition - Frozen meals/pizza (#/month)
Drug Use - People that ever used marijuana or hashish (%)
Drug Use - Ever used hard drugs (%)
Drug Use - Ever used any form of cocaine (%)
Drug Use - Ever used heroin (%)
Drug Use - Ever used methamphetamine (%)
Health Insurance - People covered by health insurance (%)
Kidney Conditions-Urology - Avg. # of times urinating at night
Medical Conditions - People with asthma (%)
Medical Conditions - People with anemia (%)
Medical Conditions - People with psoriasis (%)
Medical Conditions - People with overweight (%)
Medical Conditions - Elderly people having difficulties in thinking or remembering (%)
Medical Conditions - People who ever received blood transfusion (%)
Medical Conditions - People having trouble seeing even with glass/contacts (%)
Medical Conditions - People with arthritis (%)
Medical Conditions - People with gout (%)
Medical Conditions - People with congestive heart failure (%)
Medical Conditions - People with coronary heart disease (%)
Medical Conditions - People with angina pectoris (%)
Medical Conditions - People who ever had heart attack (%)
Medical Conditions - People who ever had stroke (%)
Medical Conditions - People with emphysema (%)
Medical Conditions - People with thyroid problem (%)
Medical Conditions - People with chronic bronchitis (%)
Medical Conditions - People with any liver condition (%)
Medical Conditions - People who ever had cancer or malignancy (%)
Mental Health - People who have little interest in doing things (%)
Mental Health - People feeling down, depressed, or hopeless (%)
Mental Health - People who have trouble sleeping or sleeping too much (%)
Mental Health - People feeling tired or having little energy (%)
Mental Health - People with poor appetite or overeating (%)
Mental Health - People feeling bad about themself (%)
Mental Health - People who have trouble concentrating on things (%)
Mental Health - People moving or speaking slowly or too fast (%)
Mental Health - People having thoughts they would be better off dead (%)
Oral Health - Average years since last visit a dentist
Oral Health - People embarrassed because of mouth (%)
Oral Health - People with gum disease (%)
Oral Health - General health of teeth and gums (%)
Oral Health - Average days a week using dental floss/device
Oral Health - Average days a week using mouthwash for dental problem
Oral Health - Average number of teeth
Pesticide Use - Households using pesticides to control insects (%)
Pesticide Use - Households using pesticides to kill weeds (%)
Physical Activity - People doing vigorous-intensity work activities (%)
Physical Activity - People doing moderate-intensity work activities (%)
Physical Activity - People walking or bicycling (%)
Physical Activity - People doing vigorous-intensity recreational activities (%)
Physical Activity - People doing moderate-intensity recreational activities (%)
Physical Activity - Average hours a day doing sedentary activities
Physical Activity - Average hours a day watching TV or videos
Physical Activity - Average hours a day using computer
Physical Functioning - People having limitations keeping them from working (%)
Physical Functioning - People limited in amount of work they can do (%)
Physical Functioning - People that need special equipment to walk (%)
Physical Functioning - People experiencing confusion/memory problems (%)
Physical Functioning - People requiring special healthcare equipment (%)
Prescription Medications - Average number of prescription medicines taking
Preventive Aspirin Use - Adults 40+ taking low-dose aspirin (%)
Reproductive Health - Vaginal deliveries (%)
Reproductive Health - Cesarean deliveries (%)
Reproductive Health - Deliveries resulted in a live birth (%)
Reproductive Health - Pregnancies resulted in a delivery (%)
Reproductive Health - Women breastfeeding newborns (%)
Reproductive Health - Women that had a hysterectomy (%)
Reproductive Health - Women that had both ovaries removed (%)
Reproductive Health - Women that have ever taken birth control pills (%)
Reproductive Health - Women taking birth control pills (%)
Reproductive Health - Women that have ever used Depo-Provera or injectables (%)
Reproductive Health - Women that have ever used female hormones (%)
Sexual Behavior - People 18+ that ever had sex (vaginal, anal, or oral) (%)
Sexual Behavior - Males 18+ that ever had vaginal sex with a woman (%)
Sexual Behavior - Males 18+ that ever performed oral sex on a woman (%)
Sexual Behavior - Males 18+ that ever had anal sex with a woman (%)
Sexual Behavior - Males 18+ that ever had any sex with a man (%)
Sexual Behavior - Females 18+ that ever had vaginal sex with a man (%)
Sexual Behavior - Females 18+ that ever performed oral sex on a man (%)
Sexual Behavior - Females 18+ that ever had anal sex with a man (%)
Sexual Behavior - Females 18+ that ever had any kind of sex with a woman (%)
Sexual Behavior - Average age people first had sex
Sexual Behavior - Average number of female sex partners in lifetime (males 18+)
Sexual Behavior - Average number of female vaginal sex partners in lifetime (males 18+)
Sexual Behavior - Average age people first performed oral sex on a woman (18+)
Sexual Behavior - Average number of woman performed oral sex on in lifetime (18+)
Sexual Behavior - Average number of male sex partners in lifetime (males 18+)
Sexual Behavior - Average number of male anal sex partners in lifetime (males 18+)
Sexual Behavior - Average age people first performed oral sex on a man (18+)
Sexual Behavior - Average number of male oral sex partners in lifetime (18+)
Sexual Behavior - People using protection when performing oral sex (%)
Sexual Behavior - Average number of times people have vaginal or anal sex a year
Sexual Behavior - People having sex without condom (%)
Sexual Behavior - Average number of male sex partners in lifetime (females 18+)
Sexual Behavior - Average number of male vaginal sex partners in lifetime (females 18+)
Sexual Behavior - Average number of female sex partners in lifetime (females 18+)
Sexual Behavior - Circumcised males 18+ (%)
Sleep Disorders - Average hours sleeping at night
Sleep Disorders - People that has trouble sleeping (%)
Smoking-Cigarette Use - People smoking cigarettes (%)
Taste & Smell - People 40+ having problems with smell (%)
Taste & Smell - People 40+ having problems with taste (%)
Taste & Smell - People 40+ that ever had wisdom teeth removed (%)
Taste & Smell - People 40+ that ever had tonsils teeth removed (%)
Taste & Smell - People 40+ that ever had a loss of consciousness because of a head injury (%)
Taste & Smell - People 40+ that ever had a broken nose or other serious injury to face or skull (%)
Taste & Smell - People 40+ that ever had two or more sinus infections (%)
Weight - Average height (inches)
Weight - Average weight (pounds)
Weight - Average BMI
Weight - People that are obese (%)
Weight - People that ever were obese (%)
Weight - People trying to lose weight (%)
According to our research of Minnesota and other state lists, there were 3 registered sex offenders living in Maplewood, Minnesota as of April 27, 2024 . The ratio of all residents to sex offenders in Maplewood is 13,453 to 1.The ratio of registered sex offenders to all residents in this city is lower than the state average.
Officers per 1,000 residents here:
1.22Minnesota average:
1.76
Latest news from Maplewood, MN collected exclusively by city-data.com from local newspapers, TV, and radio stations
Maplewood, MN City Guides: Ancestries: German (12.2%), American (5.3%), Norwegian (4.0%), Polish (2.6%), Swedish (2.3%), Irish (2.3%).
Current Local Time:
Land area: 17.3 square miles.
Population density: 2,309 people per square mile (low).
6,945 residents are foreign born (9.0% Asia , 4.1% Latin America , 2.0% Africa ).
This city:
17.1%Minnesota:
8.5%
Median real estate property taxes paid for housing units with mortgages in 2022: $3,634 (1.1%)Median real estate property taxes paid for housing units with no mortgage in 2022: $3,592 (1.3%)
Nearest city with pop. 50,000+: St. Paul, MN
Nearest city with pop. 1,000,000+: Chicago, IL
Nearest cities:
Latitude: 44.99 N, Longitude: 93.02 W
Daytime population change due to commuting: +5,229 (+12.9%)Workers who live and work in this city: 4,349 (21.4%)
Property values in Maplewood, MN
Single-family new house construction building permits:
2022: 7 buildings , average cost: $462,1002021: 4 buildings , average cost: $477,5002020: 5 buildings , average cost: $266,3002019: 2 buildings , average cost: $225,5002018: 7 buildings , average cost: $293,6002017: 4 buildings , average cost: $179,5002016: 14 buildings , average cost: $238,4002015: 11 buildings , average cost: $204,5002014: 25 buildings , average cost: $196,6002013: 23 buildings , average cost: $171,7002012: 18 buildings , average cost: $174,4002011: 16 buildings , average cost: $177,1002010: 21 buildings , average cost: $165,9002009: 20 buildings , average cost: $193,8002008: 114 buildings , average cost: $114,8002007: 52 buildings , average cost: $193,3002006: 104 buildings , average cost: $193,8002005: 244 buildings , average cost: $149,4002004: 125 buildings , average cost: $155,7002003: 98 buildings , average cost: $190,9002002: 131 buildings , average cost: $173,1002001: 166 buildings , average cost: $143,3002000: 64 buildings , average cost: $186,2001999: 96 buildings , average cost: $157,1001998: 140 buildings , average cost: $142,9001997: 177 buildings , average cost: $126,500Unemployment in December 2023:
Population change in the 1990s: +4,377 (+14.3%).
Most common occupations in Maplewood, MN (%)
Both Males Females
Other office and administrative support workers, including supervisors (5.4%)
Computer specialists (4.2%)
Other management occupations, except farmers and farm managers (3.3%)
Secretaries and administrative assistants (3.2%)
Material recording, scheduling, dispatching, and distributing workers (3.2%)
Other production occupations, including supervisors (3.2%)
Other sales and related occupations, including supervisors (3.1%)
Computer specialists (6.3%)
Driver/sales workers and truck drivers (4.9%)
Electrical equipment mechanics and other installation, maintenance, and repair workers, including supervisors (4.3%)
Other production occupations, including supervisors (4.3%)
Material recording, scheduling, dispatching, and distributing workers (4.2%)
Other management occupations, except farmers and farm managers (3.7%)
Other sales and related occupations, including supervisors (3.5%)
Other office and administrative support workers, including supervisors (8.4%)
Secretaries and administrative assistants (6.5%)
Registered nurses (4.4%)
Information and record clerks, except customer service representatives (4.3%)
Preschool, kindergarten, elementary, and middle school teachers (3.7%)
Child care workers (3.3%)
Bookkeeping, accounting, and auditing clerks (3.2%)
Tornado activity:
Maplewood-area historical tornado activity is slightly above Minnesota state average. It is 28% greater than the overall U.S. average.
On 5/6/1965, a category F4 (max. wind speeds 207-260 mph) tornado 12.6 miles away from the Maplewood city center killed 6 people and injured 158 people and caused between $5,000,000 and $50,000,000 in damages.
On 5/6/1965, a category F4 tornado 12.8 miles away from the city center killed 3 people and injured 175 people and caused between $5,000,000 and $50,000,000 in damages.
Earthquake activity:
Maplewood-area historical earthquake activity is significantly above Minnesota state average. It is 58% smaller than the overall U.S. average. On 7/9/1975 at 14:54:15, a magnitude 4.6 (4.6 MB, Class: Light, Intensity: IV - V) earthquake occurred 154.0 miles away from the city center On 6/5/1993 at 01:24:53, a magnitude 4.1 (4.1 LG, Depth: 6.2 mi) earthquake occurred 165.8 miles away from the city center On 3/4/1983 at 06:32:18, a magnitude 4.6 (4.4 MB, 4.6 LG, 4.4 ML) earthquake occurred 318.9 miles away from the city center On 10/20/1995 at 15:57:18, a magnitude 3.7 (3.7 LG, Depth: 3.1 mi, Class: Light, Intensity: II - III) earthquake occurred 194.4 miles away from the city center On 2/9/1994 at 08:45:35, a magnitude 3.1 (3.1 LG, Depth: 3.1 mi) earthquake occurred 96.7 miles away from the city center On 11/3/2002 at 20:41:56, a magnitude 4.3 (4.3 MB, Depth: 3.1 mi) earthquake occurred 330.6 miles away from Maplewood center Magnitude types: regional Lg-wave magnitude (LG), body-wave magnitude (MB), local magnitude (ML) Natural disasters: The number of natural disasters in Ramsey County (18) is near the US average (15).Major Disasters (Presidential) Declared: 13Emergencies Declared: 3Floods: 14, Storms: 8, Tornadoes: 5, Winds: 3, Drought: 1, Hurricane: 1, Landslide: 1, Mudslide: 1, Winter Storm: 1, Other: 1 (Note: some incidents may be assigned to more than one category). Hospitals and medical centers in Maplewood: DCI COPE (1362 EAST COPE AVENUE) DCI LARPENTEUR (1951 LARPENTEUR AVENUE EAST) HEALTHEAST ST JOHN'S HOSPITAL (Voluntary non-profit - Private, provides emergency services, 1575 BEAM AVENUE) RAJWOOD (2951 BARTELMY LANE) GOOD SAMARITAN SOCIETY - MAPLEWOOD (550 EAST ROSELAWN AVENUE)
MAPLEWOOD CARE CENTER (1900 SHERREN AVENUE)
MAPLEWOOD MAPLE MANOR CARE CTR (550 E ROSELAWN AVE)
RAMSEY COUNTY CARE CENTER (2000 WHITE BEAR AVENUE)
FMC - MAPLEWOOD HEIGHTS (2017 WOODLYN AVE)
MAPLEWOOD DIALYSIS OF DAVITA (2785 WHITE BEAR AVE, SUITE 201)
Amtrak station near Maplewood: 9 miles: ST. PAUL/MINNEAPOLIS (ST. PAUL, 730 TRANSFER RD.) Services: ticket office, fully wheelchair accessible, enclosed waiting area, public restrooms, public payphones, vending machines, free short-term parking, free long-term parking, call for car rental service, taxi stand.
College/University in Maplewood: Regency Beauty Institute-Maplewood Full-time enrollment: 69; Location: 3000 White Bear Avenue North; Private, for-profit; Website: www.regency.edu)
Colleges/universities with over 2000 students nearest to Maplewood:
Metropolitan State University (about 4 miles; Saint Paul, MN ; Full-time enrollment: 6,159)
Century College (about 4 miles; White Bear Lake, MN ; FT enrollment: 7,393)
Saint Paul College (about 6 miles; Saint Paul, MN ; FT enrollment: 4,778)
Concordia University-Saint Paul (about 8 miles; Saint Paul, MN ; FT enrollment: 2,501)
Hamline University (about 8 miles; Saint Paul, MN ; FT enrollment: 3,818)
University of Northwestern-St Paul (about 8 miles; Saint Paul, MN ; FT enrollment: 2,680)
Bethel University (about 8 miles; Saint Paul, MN ; FT enrollment: 4,061)
Public high schools in Maplewood: FAIRVIEW ADOLESCENT PROGRAM Location: 2355 ARIEL STREET N, STE B, Grades: 6-12)HARMONY LEARNING CENTER Location: 1961 E COUNTY ROAD C, Grades: KG-12)
PHOENIX ACADEMY Location: 2055 WHITE BEAR AVE N, Grades: 7-12)Private high school in Maplewood: LIBERTY CLASSICAL ACADEMY Students: 150, Location: 2696 HAZELWOOD ST, Grades: PK-12)
Public elementary/middle schools in Maplewood: ELEMENTARY ALP @ JOHN GLENN Location: 1560 E CTY RD B, Grades: KG-6)
CARVER ELEMENTARY Location: 2680 UPPER AFTON RD, Grades: KG-5)JOHN GLENN MIDDLE Location: 1560 E COUNTY RD B, Grades: 6-8)WEAVER ELEMENTARY Location: 2135 BIRMINGHAM ST, Grades: KG-5)
MAPLEWOOD MIDDLE Location: 2410 HOLLOWAY ST, Grades: 6-8)EDGERTON ELEMENTARY Location: 1929 EDGERTON ST, Grades: KG-6)
HARAMBEE ELEMENTARY SCHOOL Location: 30 COUNTY ROAD B E, Grades: KG-6)
Private elementary/middle schools in Maplewood: MINNESOTA WALDORF SCHOOL Students: 192, Location: 70 COUNTY ROAD B E, Grades: PK-8)
GETHSEMANE LUTHERAN SCHOOL Students: 170, Location: 2410 STILLWATER RD E, Grades: PK-8)ST JEROME ELEMENTARY SCHOOL Students: 165, Location: 384 ROSELAWN AVE E, Grades: PK-8)
PRESENTATION OF MARY SCHOOL Students: 156, Location: 1695 KENNARD ST, Grades: KG-8)
See full list of schools located in Maplewood
Notable locations in Maplewood: (A) , Saint Paul Waterworks (B) , McCarrons Lake Filtration Plant (C) , Keller Golf Course (D) , Goodrich Golf Course (E) , Aldrich Arena (F) , Maplewood Fire Department Station 4 (G) , Maplewood Fire Department Station 7 (H) , Maplewood Fire Department Station 3 (I) , Maplewood Fire Department Station 1 (J) , Maplewood Fire Department Station 2 (K) . Display/hide their locations on the map
Shopping Centers: (1) , Crown Plaza Shopping Center (2) , Maple Ridge Shopping Center (3) , Maplewood East Shopping Center (4) , Maplewood Mall Shopping Center (5) , Maplewood Square Shopping Center (6) , Maplewood Town Center Shopping Center (7) , Plaza 3000 Shopping Center (8) , Ryan Center Shopping Center (9) . Display/hide their locations on the map
Churches in Maplewood include: (A) , Salvation Army (B) , Redeeming Love Church (C) , New Creation Full Gospel Baptist Church (D) , Lake Phalen Community Church (E) , Holy Redeemer Parish Church (F) , Trinity Church (G) . Display/hide their locations on the map
Cemeteries: (1) , Forest Lawn Cemetery (2) , Union Cemetery (3) , Mount Zion Cemetery (4) . Display/hide their locations on the map
Lakes and reservoirs: (A) , Wakefield Lake (B) , Round Lake (C) , Three M Lake (D) , Markham Pond (E) , Sandy Lake (F) , Kohlman Lake (G) , Keller Lake (H) . Display/hide their locations on the map
Parks in Maplewood include: (1) , Keller Park (2) , Wakefield Park (3) , Pleasantview Park (4) , Crestview Park (5) , Mailand Park (6) , Vista Hills Park (7) , Lions Park (8) , Maplewood Nature Center (9) . Display/hide their locations on the map
Birthplace of: Jim O'Brien (ice hockey) - Ice hockey player, Kevin Manthei - Film score composer, Allie Thunstrom - Ice hockey player, Eric Coleman - College basketball player (Northern Iowa Panthers).
Ramsey County has a predicted average indoor radon screening level greater than 4 pCi/L (pico curies per liter) - Highest Potential Average household size: This city:
2.5 peopleMinnesota:
2.5 people
Percentage of family households: This city:
64.6%Whole state:
64.6%
Percentage of households with unmarried partners: This city:
6.8%Whole state:
6.9%
Likely homosexual households (counted as self-reported same-sex unmarried-partner households)
Lesbian couples: 0.4% of all households Gay men: 0.3% of all households
People in group quarters in Maplewood in 2010:
429 people in local jails and other municipal confinement facilities
362 people in nursing facilities/skilled-nursing facilities
229 people in group homes intended for adults
53 people in emergency and transitional shelters (with sleeping facilities) for people experiencing homelessness
45 people in other noninstitutional facilities
9 people in group homes for juveniles (non-correctional)
4 people in residential treatment centers for adults
People in group quarters in Maplewood in 2000:
337 people in nursing homes
260 people in homes for the mentally retarded
82 people in religious group quarters
75 people in other group homes
54 people in other noninstitutional group quarters
9 people in other nonhousehold living situations
Banks with most branches in Maplewood (2011 data):
TCF National Bank: Maplewood East Cub Branch, Maplewood Branch, Maplewood Cub Branch. Info updated 2009/11/23: Bank assets: $19,007.0 mil, Deposits: $12,377.0 mil, headquarters in Sioux Falls, SD, positive income , Commercial Lending Specialization, 441 total offices , Holding Company: Tcf Financial Corporation
Summit Community Bank: at 1275 East County Road D, branch established on 2007/05/07. Info updated 2007/05/08: Bank assets: $61.9 mil, Deposits: $49.1 mil, local headquarters , positive income , Commercial Lending Specialization, 1 total offices , Holding Company: Hayward Bancshares, Inc.
U.S. Bank National Association: Maplewood Branch at 1760 Beam Avenue, branch established on 2000/10/03. Info updated 2012/01/30: Bank assets: $330,470.8 mil, Deposits: $236,091.5 mil, headquarters in Cincinnati, OH, positive income , 3121 total offices , Holding Company: U.S. Bancorp
Premier Bank: at 2866 White Bear Avenue, branch established on 1974/08/01. Info updated 2006/11/03: Bank assets: $551.0 mil, Deposits: $499.9 mil, local headquarters , negative income in the last year , Commercial Lending Specialization, 7 total offices
Wells Fargo Bank, National Association: Maplewood Mall Branch at 2945 White Bear Avenue N, branch established on 1971/11/18. Info updated 2011/04/05: Bank assets: $1,161,490.0 mil, Deposits: $905,653.0 mil, headquarters in Sioux Falls, SD, positive income , 6395 total offices , Holding Company: Wells Fargo & Company
Bremer Bank, National Association: Maplewood Branch at 2965 Whitebear Avenue, branch established on 1891/01/01. Info updated 2006/11/03: Bank assets: $2,725.5 mil, Deposits: $2,268.8 mil, headquarters in South St. Paul, MN, positive income , Commercial Lending Specialization, 29 total offices , Holding Company: Otto Bremer Foundation
Lake Area Bank: Maplewood Branch at 1535a Beam Avenue, branch established on 1998/12/10. Info updated 2008/06/04: Bank assets: $274.3 mil, Deposits: $233.1 mil, headquarters in Lindstrom, MN, negative income in the last year , Commercial Lending Specialization, 8 total offices , Holding Company: Freedom Bancorporation, Inc.
Western Bank: Mccarrons Lake Branch at 1740 North Rice Street, branch established on 1982/03/15. Info updated 2006/11/03: Bank assets: $384.3 mil, Deposits: $329.7 mil, headquarters in St. Paul, MN, positive income , Commercial Lending Specialization, 5 total offices , Holding Company: Western Bancshares, Inc.
Alerus Financial, National Association: Maplewood Branch at 2520 White Bear Avenue, branch established on 2002/08/08. Info updated 2012/02/24: Bank assets: $1,154.4 mil, Deposits: $988.9 mil, headquarters in Grand Forks, ND, positive income , Commercial Lending Specialization, 16 total offices , Holding Company: Alerus Financial Corporation
For population 15 years and over in Maplewood:
Never married: 34.4%Now married: 46.1%Separated: 1.1%Widowed: 4.4%Divorced: 14.0% For population 25 years and over in Maplewood:
High school or higher: 91.3%Bachelor's degree or higher: 35.2%Graduate or professional degree: 9.9%Unemployed: 3.0%Mean travel time to work (commute): 17.9 minutes
Education Gini index (Inequality in education) Here:
12.4Minnesota average:
10.9
Religion statistics for Maplewood, MN (based on Ramsey County data)
Religion Adherents Congregations Catholic 124,823 44 Mainline Protestant 64,738 123 Evangelical Protestant 42,137 154 Other 17,440 38 Black Protestant 5,032 13 Orthodox 2,070 9 None 252,400 -
Source: Clifford Grammich, Kirk Hadaway, Richard Houseal, Dale E.Jones, Alexei Krindatch, Richie Stanley and Richard H.Taylor. 2012. 2010 U.S.Religion Census: Religious Congregations & Membership Study. Association of Statisticians of American Religious Bodies. Jones, Dale E., et al. 2002. Congregations and Membership in the United States 2000. Nashville, TN: Glenmary Research Center. Graphs represent county-level data
Food Environment Statistics: Number of grocery stores : 91Ramsey County :
1.83 / 10,000 pop.Minnesota :
1.83 / 10,000 pop.
Number of supercenters and club stores : 3Ramsey County :
0.06 / 10,000 pop.Minnesota :
0.13 / 10,000 pop.
Number of convenience stores (no gas) : 27Ramsey County :
0.54 / 10,000 pop.Minnesota :
0.49 / 10,000 pop.
Number of convenience stores (with gas) : 138Ramsey County :
2.77 / 10,000 pop.State :
3.90 / 10,000 pop.
Number of full-service restaurants : 337Ramsey County :
6.76 / 10,000 pop.State :
6.98 / 10,000 pop.
Adult obesity rate : Here :
25.5%Minnesota :
25.9%
Low-income preschool obesity rate : Ramsey County :
14.7%Minnesota :
13.0%
Health and Nutrition: Healthy diet rate : Maplewood:
49.7%Minnesota:
50.6%
Average overall health of teeth and gums : Maplewood:
46.3%Minnesota:
48.4%
Average BMI : Maplewood:
28.7Minnesota:
28.5
People feeling badly about themselves : This city:
21.2%Minnesota:
21.0%
People not drinking alcohol at all : Maplewood:
11.2%State:
9.8%
Average hours sleeping at night : Maplewood:
6.8Minnesota:
6.8
Overweight people : Maplewood:
34.5%State:
33.5%
General health condition : This city:
55.9%Minnesota:
57.7%
Average condition of hearing : Maplewood:
78.0%Minnesota:
79.3%
More about Health and Nutrition of Maplewood, MN Residents
Local government employment and payroll (March 2022)
Function
Full-time employees
Monthly full-time payroll
Average yearly full-time wage
Part-time employees
Monthly part-time payroll
Police Protection - Officers
50 $619,541 $148,690 0 $0 Firefighters
31 $281,372 $108,918 0 $0 Other Government Administration
20 $114,453 $68,672 7 $23,878 Financial Administration
14 $109,643 $93,980 0 $0 Streets and Highways
13 $80,899 $74,676 0 $0 Other and Unallocable
10 $79,511 $95,413 0 $0 Parks and Recreation
9 $53,849 $71,799 4 $1,612 Police - Other
6 $67,702 $135,404 2 $1,616 Health
6 $43,843 $87,686 1 $6,074 Housing and Community Development (Local)
5 $37,679 $90,430 1 $855 Sewerage
4 $29,667 $89,001 0 $0 Fire - Other
0 $0 5 $7,937
Totals for Government
168 $1,518,160 $108,440 20 $41,972
Maplewood government finances - Expenditure in 2021 (per resident):
Construction - Regular Highways: $12,028,000 ($300.70)
Current Operations - Police Protection: $9,689,000 ($242.22)
Sewerage: $4,990,000 ($124.75)Regular Highways: $3,852,000 ($96.30)Health - Other: $3,289,000 ($82.22)Local Fire Protection: $2,983,000 ($74.58)Central Staff Services: $2,421,000 ($60.52)Natural Resources - Other: $1,785,000 ($44.62)Housing and Community Development: $1,769,000 ($44.23)Financial Administration: $1,432,000 ($35.80)Solid Waste Management: $979,000 ($24.48)Parks and Recreation: $814,000 ($20.35)Protective Inspection and Regulation - Other: $615,000 ($15.38)General Public Buildings: $565,000 ($14.12)Judicial and Legal Services: $137,000 ($3.42)Water Utilities: $117,000 ($2.92)General - Interest on Debt: $3,164,000 ($79.10)
Other Capital Outlay - General Public Building: $577,000 ($14.43)
Police Protection: $485,000 ($12.12)Local Fire Protection: $195,000 ($4.88)Parks and Recreation: $155,000 ($3.88)
Maplewood government finances - Revenue in 2021 (per resident):
Charges - Sewerage: $5,244,000 ($131.10)
Natural Resources - Other: $3,117,000 ($77.92)Miscellaneous Commercial Activities: $2,969,000 ($74.22)Other: $1,399,000 ($34.98)Solid Waste Management: $953,000 ($23.82)Parks and Recreation: $107,000 ($2.67)Regular Highways: $1,000 ($0.03)Federal Intergovernmental - General Local Government Support: $3,119,000 ($77.97)
Health and Hospitals: $239,000 ($5.97)Other: $25,000 ($0.62)Local Intergovernmental - Highways: $247,000 ($6.17)
Other: $65,000 ($1.62)Housing and Community Development: $30,000 ($0.75)Miscellaneous - Special Assessments: $2,502,000 ($62.55)
General Revenue - Other: $1,910,000 ($47.75)Interest Earnings: $868,000 ($21.70)Fines and Forfeits: $157,000 ($3.92)Rents: $120,000 ($3.00)Sale of Property: $41,000 ($1.02)Donations From Private Sources: $7,000 ($0.17)Revenue - Water Utilities: $454,000 ($11.35)
State Intergovernmental - Highways: $2,091,000 ($52.27)
General Local Government Support: $1,125,000 ($28.12)Other: $1,018,000 ($25.45)Housing and Community Development: $16,000 ($0.40)Tax - Property: $24,989,000 ($624.73)
Public Utilities Sales: $2,247,000 ($56.17)Occupation and Business License - Other: $1,567,000 ($39.17)Alcoholic Beverage License: $182,000 ($4.55)Pari - mutuels Sales: $27,000 ($0.68)Public Utility License: $20,000 ($0.50)Other License: $2,000 ($0.05)
Maplewood government finances - Debt in 2021 (per resident):
Long Term Debt - Outstanding Unspecified Public Purpose: $60,657,000 ($1516.42)
Beginning Outstanding - Public Debt for Private Purpose: $58,076,000 ($1451.90)Beginning Outstanding - Unspecified Public Purpose: $55,545,000 ($1388.62)Outstanding Nonguaranteed - Industrial Revenue: $43,425,000 ($1085.62)Retired Nonguaranteed - Public Debt for Private Purpose: $14,651,000 ($366.27)Issue, Unspecified Public Purpose: $11,680,000 ($292.00)Retired Unspecified Public Purpose: $6,568,000 ($164.20)
Maplewood government finances - Cash and Securities in 2021 (per resident):
Other Funds - Cash and Securities: $37,074,000 ($926.85)
Sinking Funds - Cash and Securities: $57,546,000 ($1438.65)
8.61% of this county's 2021 resident taxpayers lived in other counties in 2020 ($57,378 average adjusted gross income )
Here:
8.61%Minnesota average:
7.43%
0.01% of residents moved from foreign countries ($84 average AGI )Ramsey County:
0.01%Minnesota average:
0.00%
Top counties from which taxpayers relocated into this county between 2020 and 2021:
Businesses in Maplewood, MN
Name Count Name Count
AMF Bowling 1 Marshalls 1 AT&T 2 MasterBrand Cabinets 1 Aeropostale 1 Maurices 1 Arby's 1 McDonald's 3 Ashley Furniture 1 Men's Wearhouse 1 Audi 1 Menards 1 AutoZone 2 Motherhood Maternity 1 Bakers Square 1 Nike 2 Barnes & Noble 1 Nissan 1 Bath & Body Works 1 OfficeMax 1 Buffalo Wild Wings 1 Old Country Buffet 1 Burger King 1 Old Navy 1 Burlington Coat Factory 1 Olive Garden 1 CVS 1 Outback 1 Caribou Coffee 4 Outback Steakhouse 1 Catherines 1 Panera Bread 1 Chevrolet 1 Papa John's Pizza 1 Chipotle 2 Payless 1 Cinnabon 1 PetSmart 1 Costco 1 Pizza Hut 2 Dairy Queen 2 Red Lobster 1 Days Inn 1 SAS Shoes 1 Deb 1 Sears 2 Dennys 2 Slumberland 1 Discount Tire 1 Spencer Gifts 1 FedEx 4 Sprint Nextel 3 Firestone Complete Auto Care 1 Subway 1 GNC 1 T-Mobile 4 GameStop 2 T.G.I. Driday's 1 Gap 1 Taco Bell 1 H&R Block 3 Toyota 1 Hollister Co. 1 Toys"R"Us 1 Home Depot 1 U-Haul 3 IHOP 1 UPS 2 JCPenney 1 Vans 3 Jones New York 2 Verizon Wireless 2 Kohl's 1 Victoria's Secret 1 La-Z-Boy 1 Walgreens 1 Little Caesars Pizza 1 Wendy's 1 Macy's 1 Wet Seal 1
Strongest AM radio stations in Maplewood:
KTIS (900 AM; 25 kW; MINNEAPOLIS, MN; Owner: NORTHWESTERN COLLEGE)
KSTP (1500 AM; 50 kW; ST. PAUL, MN; Owner: KSTP-AM, LLC (DELAWARE))
WCTS (1030 AM; 50 kW; MAPLEWOOD, MN; Owner: CNTL. BAPT. THEO/AL SEMI MINNEAPOLIS)
WCCO (830 AM; 50 kW; MINNEAPOLIS, MN; Owner: INFINITY MEDIA CORPORATION)
KUOM (770 AM; daytime; 5 kW; MINNEAPOLIS, MN)
KFAN (1130 AM; 50 kW; MINNEAPOLIS, MN; Owner: AMFM RADIO LICENSES, L.L.C.)
WDGY (630 AM; 8 kW; HUDSON, WI; Owner: 630 RADIO, INCORPORATED)
WMGT (1220 AM; 5 kW; STILLWATER, MN; Owner: ENDURANCE BROADCASTING, LLC)
KKMS (980 AM; 5 kW; RICHFIELD, MN)
WMNN (1330 AM; 10 kW; MINNEAPOLIS, MN; Owner: MINNESOTA PUBLIC RADIO.)
WWTC (1280 AM; 5 kW; MINNEAPOLIS, MN; Owner: SCA LICENSE CORPORATION)
KDIZ (1440 AM; 5 kW; GOLDEN VALLEY, MN; Owner: KQRS, INC.)
KLBP (1470 AM; 5 kW; BROOKLYN PARK, MN; Owner: 1400, INC.)
Strongest FM radio stations in Maplewood:
KNOW-FM (91.1 FM; MINNEAPOLIS-ST. PAUL, MN; Owner: MINNESOTA PUBLIC RADIO)
WLTE (102.9 FM; MINNEAPOLIS, MN; Owner: INFINITY MEDIA CORPORATION)
KEEY-FM (102.1 FM; ST. PAUL, MN; Owner: AMFM RADIO LICENSES, L.L.C.)
KSTP-FM (94.5 FM; ST. PAUL, MN; Owner: KSTP-FM, LLC, A DELAWARE LLC)
KTIS-FM (98.5 FM; MINNEAPOLIS, MN; Owner: NORTHWESTERN COLLEGE)
KDWB-FM (101.3 FM; RICHFIELD, MN; Owner: AMFM RADIO LICENSES, L.L.C.)
KQRS-FM (92.5 FM; GOLDEN VALLEY, MN; Owner: KQRS, Inc.)
KSJN (99.5 FM; MINNEAPOLIS, MN; Owner: MINNESOTA PUBLIC RADIO)
KXXR (93.7 FM; MINNEAPOLIS, MN; Owner: KQRS, INC.)
KBEM-FM (88.5 FM; MINNEAPOLIS, MN; Owner: BD. OF EDUCATION, S.S.D. NO. 1)
WXPT (104.1 FM; ST. LOUIS PARK, MN; Owner: THE AUDIO HOUSE, INC.)
KNOF (95.3 FM; ST. PAUL, MN; Owner: SELBY GOSPEL BROADCASTING CORPORATION)
KTCZ-FM (97.1 FM; MINNEAPOLIS, MN; Owner: AMFM RADIO LICENSES, L.L.C.)
K214DF (90.7 FM; GOLDEN VALLEY, MN; Owner: EDUCATIONAL MEDIA FOUNDATION)
K294AM (106.7 FM; WEST ST. PAUL, MN; Owner: FRESH AIR, INCORPORATED)
WFMP (107.1 FM; COON RAPIDS, MN; Owner: WFMP-FM, LLC)
KFAI (90.3 FM; MINNEAPOLIS, MN; Owner: FRESH AIR, INC.)
KQQL (107.9 FM; ANOKA, MN; Owner: AMFM RADIO LICENSES, L.L.C.)
WCAL (89.3 FM; NORTHFIELD, MN; Owner: ST. OLAF COLLEGE)
KJZI (100.3 FM; MINNEAPOLIS, MN; Owner: AMFM RADIO LICENSES, L.L.C.)
TV broadcast stations around Maplewood:
KMSP-TV (Channel 9; MINNEAPOLIS, MN; Owner: FOX TELEVISION STATIONS, INC.)
KTCA-TV (Channel 2; ST. PAUL, MN; Owner: TWIN CITIES PUBLIC TELEVISION, INC.)
KARE (Channel 11; MINNEAPOLIS, MN; Owner: MULTIMEDIA HOLDINGS CORPORATION)
KSTP-TV (Channel 5; ST. PAUL, MN; Owner: HUBBARD BROADCASTING, INC.)
KTCI-TV (Channel 17; ST. PAUL, MN; Owner: TWIN CITIES PUBLIC TELEVISION, INC.)
KMWB (Channel 23; MINNEAPOLIS, MN; Owner: KLGT LICENSEE, LLC)
WFTC (Channel 29; MINNEAPOLIS, MN; Owner: FOX TELEVISION STATIONS, INC.)
WCCO-TV (Channel 4; MINNEAPOLIS, MN; Owner: CBS BROADCASTING INC.)
KSTC-TV (Channel 45; MINNEAPOLIS, MN; Owner: HUBBARD BROADCASTING, INC.)
K07UI (Channel 7; MINNEAPOLIS, ETC., MN; Owner: WORD OF GOD FELLOWSHIP, INC.)
K58BS (Channel 58; MINNEAPOLIS, MN; Owner: TRINITY BROADCASTING NETWORK)
K67HG (Channel 67; MINNEAPOLIS, MN; Owner: VENTANA TELEVISION, INC.)
K14KH (Channel 14; MINNEAPOLIS, MN; Owner: THREE ANGELS BROADCASTING NETWORK)
K19ER (Channel 19; ST. PAUL, MN; Owner: CATHOLIC VIEWS BROADCASTS, INC.)
W62BD (Channel 62; MINNEAPOLIS, MN; Owner: WORD OF GOD FELLOWSHIP, INC.)
WBWX-CA (Channel 13; MINNEAPOLIS, MN; Owner: THE BOX WORLDWIDE LLC)
KPXM (Channel 41; ST. CLOUD, MN; Owner: PAXSON MINNEAPOLIS LICENSE, INC.)
W55AP (Channel 55; RIVER FALLS, WI; Owner: STATE OF WISCONSIN - EDUCATIONAL COMMUNICATIONS BOARD)
National Bridge Inventory (NBI) Statistics 40 Number of bridges279ft / 85.1m Total length $3,328,998,000 Total costs989,456 Total average daily traffic34,789 Total average daily truck traffic
New bridges - historical statistics
1 1930-1939 3 1950-1959 12 1960-1969 2 1970-1979 2 1980-1989 3 1990-1999 1 2000-2009 16 2010-2019
See full National Bridge Inventory statistics for Maplewood, MN
Home Mortgage Disclosure Act Aggregated Statistics For Year 2009(Based on 8 full tracts) A) FHA, FSA/RHS & VA B) Conventional C) Refinancings D) Home Improvement Loans E) Loans on Dwellings For 5+ Families F) Non-occupant Loans on G) Loans On Manufactured Number Average Value Number Average Value Number Average Value Number Average Value Number Average Value Number Average Value Number Average Value
LOANS ORIGINATED 230 $167,840 164 $149,903 764 $171,424 56 $73,508 1 $600,000 25 $129,940 6 $23,167 APPLICATIONS APPROVED, NOT ACCEPTED 22 $167,750 20 $112,396 105 $175,964 5 $16,158 0 $0 5 $162,400 8 $38,375 APPLICATIONS DENIED 29 $162,906 28 $82,647 247 $194,274 26 $48,516 4 $5,194,750 8 $202,468 15 $38,533 APPLICATIONS WITHDRAWN 22 $147,688 19 $152,049 188 $179,273 14 $104,982 0 $0 4 $110,000 1 $38,000 FILES CLOSED FOR INCOMPLETENESS 3 $129,117 8 $188,504 81 $165,980 3 $60,000 0 $0 0 $0 1 $39,000
Aggregated Statistics For Year 2008(Based on 8 full tracts) A) FHA, FSA/RHS & VA B) Conventional C) Refinancings D) Home Improvement Loans E) Loans on Dwellings For 5+ Families F) Non-occupant Loans on G) Loans On Manufactured Number Average Value Number Average Value Number Average Value Number Average Value Number Average Value Number Average Value Number Average Value
LOANS ORIGINATED 155 $182,107 233 $160,883 399 $174,397 79 $54,186 1 $3,700,000 39 $156,469 18 $38,056 APPLICATIONS APPROVED, NOT ACCEPTED 12 $128,127 39 $164,374 71 $166,907 9 $23,434 0 $0 8 $184,199 9 $46,553 APPLICATIONS DENIED 14 $180,120 54 $118,466 262 $190,453 49 $87,665 0 $0 28 $203,114 22 $40,759 APPLICATIONS WITHDRAWN 14 $172,601 46 $193,077 113 $202,315 18 $92,571 0 $0 9 $196,034 3 $16,333 FILES CLOSED FOR INCOMPLETENESS 2 $144,000 6 $189,642 37 $198,369 11 $73,856 0 $0 3 $208,283 0 $0
Aggregated Statistics For Year 2007(Based on 8 full tracts) A) FHA, FSA/RHS & VA B) Conventional C) Refinancings D) Home Improvement Loans E) Loans on Dwellings For 5+ Families F) Non-occupant Loans on G) Loans On Manufactured Number Average Value Number Average Value Number Average Value Number Average Value Number Average Value Number Average Value Number Average Value
LOANS ORIGINATED 28 $192,851 478 $160,370 580 $163,022 121 $48,480 4 $3,705,500 68 $132,030 16 $34,169 APPLICATIONS APPROVED, NOT ACCEPTED 3 $194,077 73 $165,472 119 $151,887 22 $42,484 0 $0 8 $194,240 6 $42,167 APPLICATIONS DENIED 3 $220,127 116 $158,827 370 $181,270 44 $62,386 0 $0 26 $150,789 17 $26,858 APPLICATIONS WITHDRAWN 1 $199,290 65 $171,956 162 $181,788 22 $85,436 0 $0 11 $132,176 2 $43,000 FILES CLOSED FOR INCOMPLETENESS 0 $0 15 $207,605 36 $217,957 4 $48,635 0 $0 1 $168,000 0 $0
Aggregated Statistics For Year 2006(Based on 8 full tracts) A) FHA, FSA/RHS & VA B) Conventional C) Refinancings D) Home Improvement Loans E) Loans on Dwellings For 5+ Families F) Non-occupant Loans on G) Loans On Manufactured Number Average Value Number Average Value Number Average Value Number Average Value Number Average Value Number Average Value Number Average Value
LOANS ORIGINATED 24 $207,225 686 $155,675 715 $160,316 149 $57,440 3 $2,953,333 90 $143,763 24 $34,773 APPLICATIONS APPROVED, NOT ACCEPTED 1 $157,000 139 $139,571 155 $167,443 25 $72,104 0 $0 29 $146,164 4 $39,750 APPLICATIONS DENIED 1 $116,000 193 $147,373 391 $171,921 62 $72,029 0 $0 27 $161,741 25 $29,796 APPLICATIONS WITHDRAWN 2 $139,500 82 $164,765 207 $183,746 26 $88,644 0 $0 24 $173,643 1 $18,000 FILES CLOSED FOR INCOMPLETENESS 0 $0 30 $145,963 74 $194,646 4 $24,000 0 $0 1 $153,000 0 $0
Aggregated Statistics For Year 2005(Based on 8 full tracts) A) FHA, FSA/RHS & VA B) Conventional C) Refinancings D) Home Improvement Loans E) Loans on Dwellings For 5+ Families F) Non-occupant Loans on G) Loans On Manufactured Number Average Value Number Average Value Number Average Value Number Average Value Number Average Value Number Average Value Number Average Value
LOANS ORIGINATED 38 $189,446 811 $157,673 975 $165,438 153 $46,439 4 $2,516,000 83 $149,547 28 $43,999 APPLICATIONS APPROVED, NOT ACCEPTED 4 $171,672 114 $141,232 167 $170,665 16 $96,889 1 $3,784,000 7 $181,430 17 $41,849 APPLICATIONS DENIED 1 $184,630 209 $138,413 420 $182,419 73 $66,451 0 $0 26 $144,874 42 $38,012 APPLICATIONS WITHDRAWN 1 $207,000 113 $156,875 344 $205,406 44 $113,269 0 $0 28 $192,873 4 $96,000 FILES CLOSED FOR INCOMPLETENESS 0 $0 26 $161,068 123 $215,485 7 $21,933 0 $0 3 $82,333 0 $0
Aggregated Statistics For Year 2004(Based on 8 full tracts) A) FHA, FSA/RHS & VA B) Conventional C) Refinancings D) Home Improvement Loans E) Loans on Dwellings For 5+ Families F) Non-occupant Loans on G) Loans On Manufactured Number Average Value Number Average Value Number Average Value Number Average Value Number Average Value Number Average Value Number Average Value
LOANS ORIGINATED 49 $183,058 610 $169,981 1,051 $161,450 167 $53,899 2 $3,046,815 65 $175,493 29 $36,709 APPLICATIONS APPROVED, NOT ACCEPTED 0 $0 76 $166,020 174 $159,946 17 $98,811 0 $0 10 $188,300 9 $33,156 APPLICATIONS DENIED 7 $166,286 124 $140,967 396 $180,875 71 $77,186 0 $0 28 $163,654 39 $41,858 APPLICATIONS WITHDRAWN 3 $170,070 62 $175,229 308 $186,622 34 $71,509 0 $0 14 $202,357 0 $0 FILES CLOSED FOR INCOMPLETENESS 2 $160,210 20 $192,174 75 $189,442 7 $102,943 0 $0 0 $0 0 $0
Aggregated Statistics For Year 2003(Based on 8 full tracts) A) FHA, FSA/RHS & VA B) Conventional C) Refinancings D) Home Improvement Loans E) Loans on Dwellings For 5+ Families F) Non-occupant Loans on Number Average Value Number Average Value Number Average Value Number Average Value Number Average Value Number Average Value
LOANS ORIGINATED 79 $167,736 602 $171,370 2,837 $142,598 156 $33,499 5 $1,135,000 102 $184,995 APPLICATIONS APPROVED, NOT ACCEPTED 4 $145,150 74 $137,509 255 $145,294 17 $49,587 1 $171,930 13 $144,708 APPLICATIONS DENIED 3 $167,367 110 $107,567 422 $149,152 42 $34,134 0 $0 29 $162,786 APPLICATIONS WITHDRAWN 3 $183,333 70 $150,342 487 $153,071 6 $32,667 1 $5,160,000 6 $137,162 FILES CLOSED FOR INCOMPLETENESS 2 $123,500 15 $191,750 64 $157,042 5 $30,000 0 $0 3 $143,613
Aggregated Statistics For Year 2002(Based on 8 full tracts) A) FHA, FSA/RHS & VA B) Conventional C) Refinancings D) Home Improvement Loans E) Loans on Dwellings For 5+ Families F) Non-occupant Loans on Number Average Value Number Average Value Number Average Value Number Average Value Number Average Value Number Average Value
LOANS ORIGINATED 90 $160,103 584 $154,125 1,981 $134,301 129 $27,079 3 $3,730,620 46 $127,562 APPLICATIONS APPROVED, NOT ACCEPTED 1 $132,000 60 $113,391 202 $131,200 24 $30,499 1 $350,000 6 $95,167 APPLICATIONS DENIED 2 $172,000 97 $83,635 343 $131,840 64 $25,513 1 $4,575,000 17 $172,411 APPLICATIONS WITHDRAWN 5 $148,800 52 $140,683 380 $142,888 12 $11,333 0 $0 3 $66,667 FILES CLOSED FOR INCOMPLETENESS 1 $114,000 13 $128,063 93 $132,440 2 $75,885 0 $0 0 $0
Aggregated Statistics For Year 2001(Based on 8 full tracts) A) FHA, FSA/RHS & VA B) Conventional C) Refinancings D) Home Improvement Loans E) Loans on Dwellings For 5+ Families F) Non-occupant Loans on Number Average Value Number Average Value Number Average Value Number Average Value Number Average Value Number Average Value
LOANS ORIGINATED 129 $141,755 539 $136,504 1,567 $120,213 158 $22,644 5 $1,257,000 50 $135,028 APPLICATIONS APPROVED, NOT ACCEPTED 3 $123,667 36 $102,706 142 $111,921 32 $26,335 0 $0 4 $92,750 APPLICATIONS DENIED 4 $163,602 88 $77,022 357 $106,429 58 $24,131 0 $0 6 $80,167 APPLICATIONS WITHDRAWN 5 $123,800 40 $176,683 339 $124,052 22 $32,409 0 $0 4 $89,000 FILES CLOSED FOR INCOMPLETENESS 2 $135,500 11 $107,182 71 $130,792 7 $18,571 1 $136,770 1 $112,000
Aggregated Statistics For Year 2000(Based on 8 full tracts) A) FHA, FSA/RHS & VA B) Conventional C) Refinancings D) Home Improvement Loans E) Loans on Dwellings For 5+ Families F) Non-occupant Loans on Number Average Value Number Average Value Number Average Value Number Average Value Number Average Value Number Average Value
LOANS ORIGINATED 91 $125,754 498 $117,446 402 $83,940 181 $23,596 1 $3,858,760 26 $76,134 APPLICATIONS APPROVED, NOT ACCEPTED 4 $126,750 52 $86,035 86 $83,072 37 $23,558 0 $0 0 $0 APPLICATIONS DENIED 7 $116,429 132 $73,418 200 $84,811 90 $19,593 0 $0 10 $76,194 APPLICATIONS WITHDRAWN 4 $126,750 30 $122,288 124 $87,016 18 $22,190 0 $0 1 $131,000 FILES CLOSED FOR INCOMPLETENESS 2 $104,500 6 $165,510 61 $105,978 2 $80,000 0 $0 0 $0
Aggregated Statistics For Year 1999(Based on 8 full tracts) A) FHA, FSA/RHS & VA B) Conventional C) Refinancings D) Home Improvement Loans E) Loans on Dwellings For 5+ Families F) Non-occupant Loans on Number Average Value Number Average Value Number Average Value Number Average Value Number Average Value Number Average Value
LOANS ORIGINATED 123 $118,845 505 $115,075 661 $90,312 199 $20,522 3 $2,314,277 25 $72,166 APPLICATIONS APPROVED, NOT ACCEPTED 4 $120,742 50 $87,725 152 $69,541 29 $20,548 2 $538,045 6 $70,133 APPLICATIONS DENIED 7 $122,189 139 $67,425 213 $83,007 54 $17,664 0 $0 8 $65,765 APPLICATIONS WITHDRAWN 4 $92,222 35 $122,676 174 $95,649 16 $27,659 0 $0 0 $0 FILES CLOSED FOR INCOMPLETENESS 1 $99,780 16 $109,886 56 $98,540 2 $18,375 0 $0 3 $69,293
Detailed HMDA statistics for the following Tracts:
0422.01
, 0422.02 , 0423.01 , 0423.02 , 0424.01 , 0424.02 , 0425.01 , 0425.02
Private Mortgage Insurance Companies Aggregated Statistics For Year 2009(Based on 8 full tracts) A) Conventional B) Refinancings C) Non-occupant Loans on Number Average Value Number Average Value Number Average Value
LOANS ORIGINATED 37 $180,401 15 $232,665 0 $0 APPLICATIONS APPROVED, NOT ACCEPTED 10 $140,526 4 $165,225 1 $115,000 APPLICATIONS DENIED 10 $171,390 5 $208,488 1 $161,000 APPLICATIONS WITHDRAWN 2 $129,720 1 $229,570 0 $0 FILES CLOSED FOR INCOMPLETENESS 3 $187,290 0 $0 0 $0
Aggregated Statistics For Year 2008(Based on 8 full tracts) A) Conventional B) Refinancings C) Non-occupant Loans on Number Average Value Number Average Value Number Average Value
LOANS ORIGINATED 91 $188,074 35 $208,927 2 $120,000 APPLICATIONS APPROVED, NOT ACCEPTED 25 $185,132 20 $247,238 1 $99,000 APPLICATIONS DENIED 10 $180,521 7 $252,000 5 $219,996 APPLICATIONS WITHDRAWN 3 $230,950 4 $200,750 0 $0 FILES CLOSED FOR INCOMPLETENESS 3 $188,333 0 $0 0 $0
Aggregated Statistics For Year 2007(Based on 8 full tracts) A) Conventional B) Refinancings C) Non-occupant Loans on Number Average Value Number Average Value Number Average Value
LOANS ORIGINATED 147 $194,018 62 $211,143 8 $176,356 APPLICATIONS APPROVED, NOT ACCEPTED 9 $211,254 12 $213,527 0 $0 APPLICATIONS DENIED 2 $220,000 0 $0 0 $0 APPLICATIONS WITHDRAWN 6 $187,500 3 $218,667 1 $217,000 FILES CLOSED FOR INCOMPLETENESS 0 $0 0 $0 0 $0
Aggregated Statistics For Year 2006(Based on 8 full tracts) A) Conventional B) Refinancings C) Non-occupant Loans on Number Average Value Number Average Value Number Average Value
LOANS ORIGINATED 74 $204,210 37 $224,946 2 $172,500 APPLICATIONS APPROVED, NOT ACCEPTED 2 $225,000 7 $292,286 1 $212,000 APPLICATIONS DENIED 3 $176,000 0 $0 0 $0 APPLICATIONS WITHDRAWN 1 $250,000 6 $202,528 0 $0 FILES CLOSED FOR INCOMPLETENESS 0 $0 0 $0 0 $0
Aggregated Statistics For Year 2005(Based on 8 full tracts) A) Conventional B) Refinancings C) Non-occupant Loans on D) Loans On Manufactured Number Average Value Number Average Value Number Average Value Number Average Value
LOANS ORIGINATED 79 $199,723 41 $207,517 5 $182,800 1 $157,000 APPLICATIONS APPROVED, NOT ACCEPTED 10 $240,696 11 $203,143 0 $0 0 $0 APPLICATIONS DENIED 0 $0 0 $0 0 $0 0 $0 APPLICATIONS WITHDRAWN 7 $225,143 5 $188,558 3 $119,333 0 $0 FILES CLOSED FOR INCOMPLETENESS 1 $312,610 0 $0 0 $0 0 $0
Aggregated Statistics For Year 2004(Based on 8 full tracts) A) Conventional B) Refinancings C) Non-occupant Loans on D) Loans On Manufactured Number Average Value Number Average Value Number Average Value Number Average Value
LOANS ORIGINATED 132 $193,159 53 $219,736 8 $178,164 1 $148,000 APPLICATIONS APPROVED, NOT ACCEPTED 19 $181,138 31 $207,828 3 $184,000 0 $0 APPLICATIONS DENIED 1 $182,680 3 $225,793 0 $0 0 $0 APPLICATIONS WITHDRAWN 8 $186,674 14 $212,873 7 $171,063 0 $0 FILES CLOSED FOR INCOMPLETENESS 1 $234,000 4 $173,652 0 $0 0 $0
Aggregated Statistics For Year 2003(Based on 8 full tracts) A) Conventional B) Refinancings C) Non-occupant Loans on Number Average Value Number Average Value Number Average Value
LOANS ORIGINATED 171 $185,785 173 $174,416 6 $147,833 APPLICATIONS APPROVED, NOT ACCEPTED 21 $198,762 29 $172,590 1 $120,000 APPLICATIONS DENIED 1 $180,000 2 $280,000 0 $0 APPLICATIONS WITHDRAWN 8 $173,566 9 $212,872 1 $92,000 FILES CLOSED FOR INCOMPLETENESS 2 $185,035 0 $0 0 $0
Aggregated Statistics For Year 2002(Based on 8 full tracts) A) Conventional B) Refinancings C) Non-occupant Loans on Number Average Value Number Average Value Number Average Value
LOANS ORIGINATED 166 $176,165 114 $172,025 8 $160,125 APPLICATIONS APPROVED, NOT ACCEPTED 21 $176,266 27 $151,033 0 $0 APPLICATIONS DENIED 2 $129,035 1 $92,000 1 $92,000 APPLICATIONS WITHDRAWN 16 $164,893 11 $204,770 7 $142,574 FILES CLOSED FOR INCOMPLETENESS 0 $0 6 $163,883 0 $0
Aggregated Statistics For Year 2001(Based on 8 full tracts) A) Conventional B) Refinancings C) Non-occupant Loans on Number Average Value Number Average Value Number Average Value
LOANS ORIGINATED 159 $162,215 112 $152,165 9 $189,752 APPLICATIONS APPROVED, NOT ACCEPTED 12 $163,941 16 $161,904 0 $0 APPLICATIONS DENIED 2 $158,000 6 $226,585 1 $154,000 APPLICATIONS WITHDRAWN 4 $161,465 5 $138,000 1 $117,000 FILES CLOSED FOR INCOMPLETENESS 0 $0 1 $158,000 0 $0
Aggregated Statistics For Year 2000(Based on 8 full tracts) A) Conventional B) Refinancings C) Non-occupant Loans on Number Average Value Number Average Value Number Average Value
LOANS ORIGINATED 164 $142,972 36 $126,704 3 $123,980 APPLICATIONS APPROVED, NOT ACCEPTED 9 $119,420 4 $113,250 2 $86,970 APPLICATIONS DENIED 1 $119,000 3 $127,667 0 $0 APPLICATIONS WITHDRAWN 0 $0 0 $0 0 $0 FILES CLOSED FOR INCOMPLETENESS 0 $0 0 $0 0 $0
Aggregated Statistics For Year 1999(Based on 8 full tracts) A) Conventional B) Refinancings C) Non-occupant Loans on Number Average Value Number Average Value Number Average Value
LOANS ORIGINATED 189 $138,158 78 $136,204 6 $186,007 APPLICATIONS APPROVED, NOT ACCEPTED 13 $139,953 11 $112,681 0 $0 APPLICATIONS DENIED 2 $127,055 2 $95,120 1 $94,910 APPLICATIONS WITHDRAWN 2 $148,905 3 $142,340 0 $0 FILES CLOSED FOR INCOMPLETENESS 0 $0 0 $0 0 $0
Detailed PMIC statistics for the following Tracts:
0422.01
, 0422.02 , 0423.01 , 0423.02 , 0424.01 , 0424.02 , 0425.01 , 0425.02 Fire-safe hotels and motels in Maplewood, Minnesota:
Best Western Maplewood Inn, 1780 E County Rd D, Maplewood, Minnesota 55109 Phone: (651) 770-2811, Fax: (651) 770-2811
Livinn Hotels, 285 Century Ave N, Maplewood, Minnesota 55119 Phone: (651) 738-1600, Fax: (952) 277-5139
All 2 fire-safe hotels and motels in Maplewood, Minnesota Maplewood compared to Minnesota state average:
Unemployed percentage significantly below state average. Hispanic race population percentage above state average. Foreign-born population percentage significantly above state average. Length of stay since moving in significantly above state average.
#84 on the list of "Top 101 cities with the most residents born in Laos (population 500+)"
#100 on the list of "Top 101 cities with the most residents born in Thailand (population 500+)"
#13 on the list of "Top 101 counties with the highest percentage of residents that exercised in the past month"
#14 on the list of "Top 101 counties with the highest carbon monoxide air pollution readings in 2012 (ppm)"
#34 on the list of "Top 101 counties with the highest percentage of residents that visited a dentist within the past year"
#34 on the list of "Top 101 counties with the largest increase in the number of births per 1000 residents 2000-2006 to 2007-2013 (pop 50,000+)"
#38 on the list of "Top 101 counties with the largest increase in the number of infant deaths per 1000 residents 2000-2006 to 2007-2013 (pop. 50,000+)"
Top Patent Applicants
John D. Hatlestad (59)
Richard J. Pokorny (36)
Naimul Karim (34)
Eric S. Olson (29)
Daniel P. Ross (28)
Lawrence W. Wales (28)
Douglas S. Dunn (26)
Surekha Palreddy (24)
Thu-Van T. Tran (24)
James M. Haase (22)
Total of 1206 patent applications in 2008-2024.
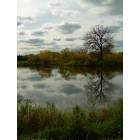
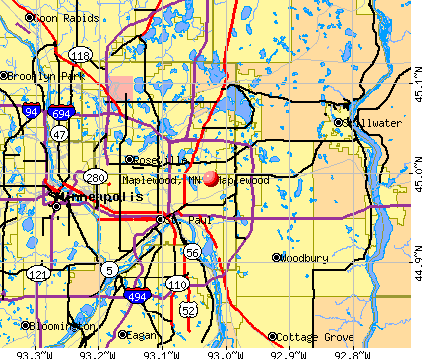


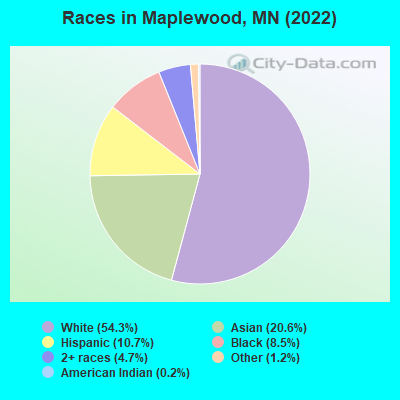
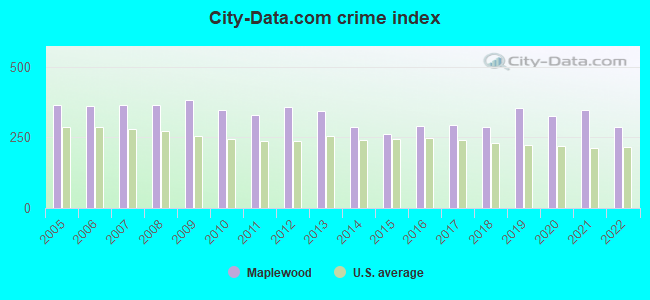
 Recent articles from our blog. Our writers, many of them Ph.D. graduates or candidates, create easy-to-read articles on a wide variety of topics.

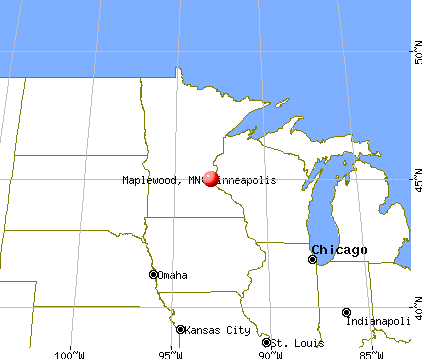
 (5.2 miles
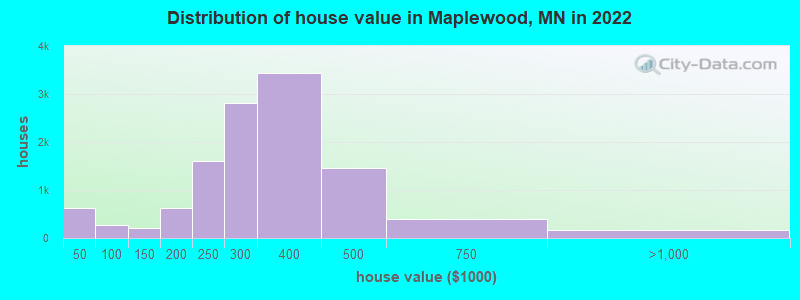
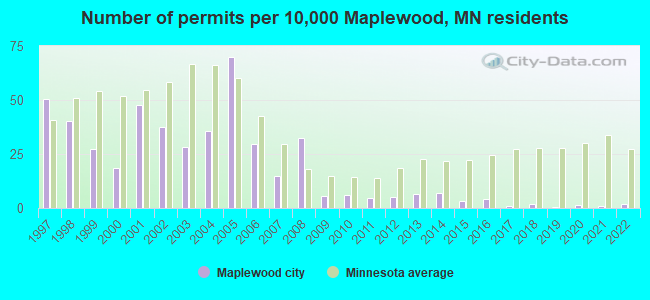
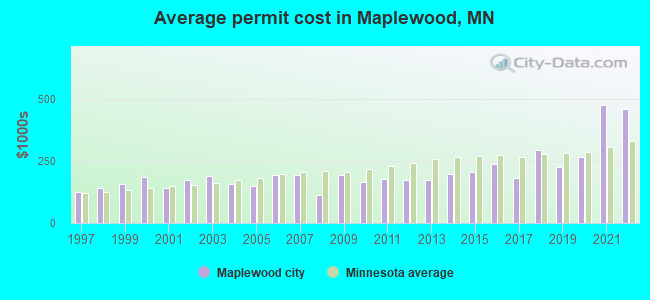
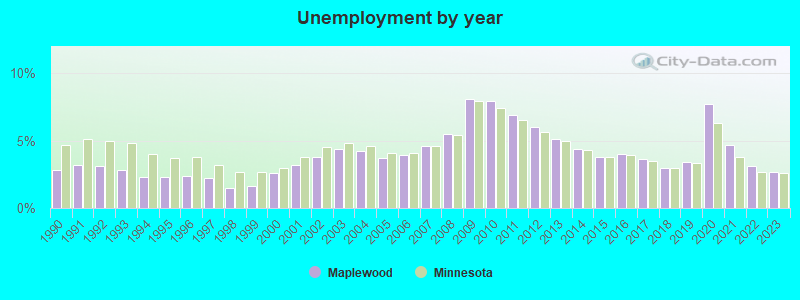
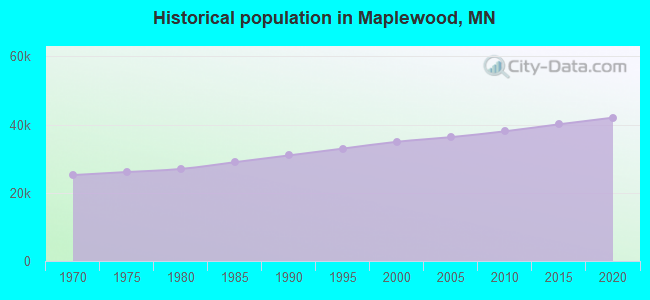
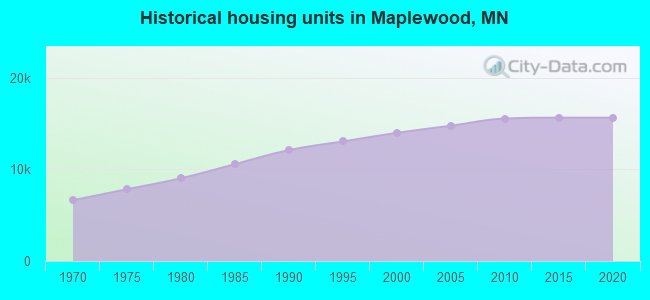
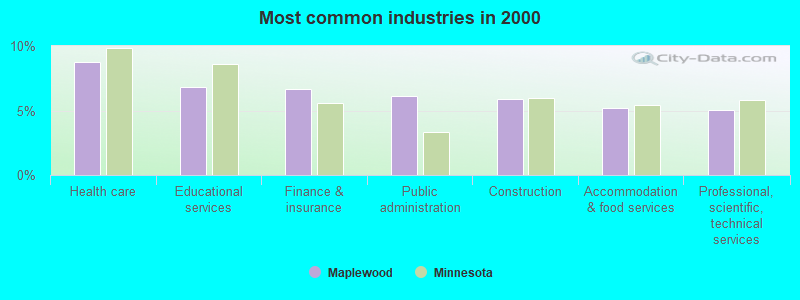
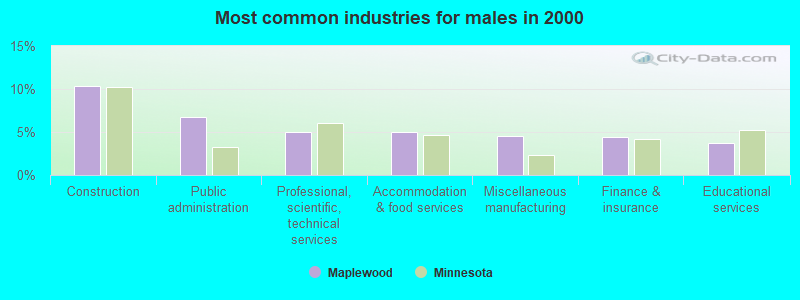
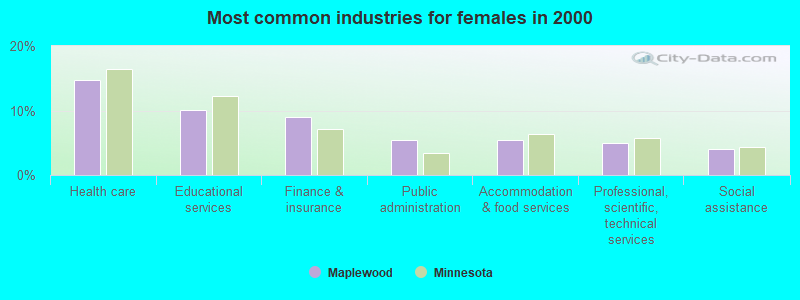
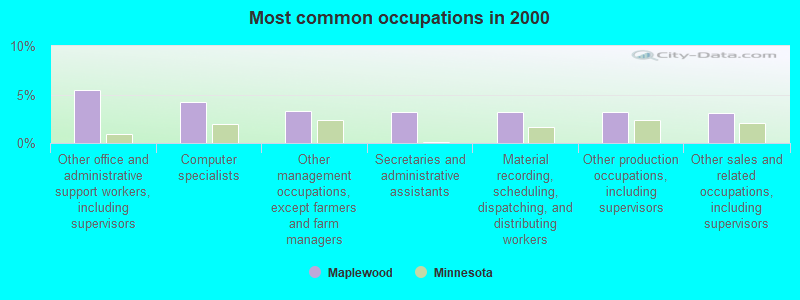
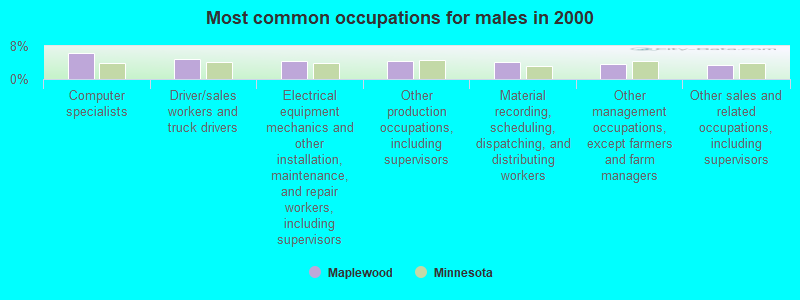

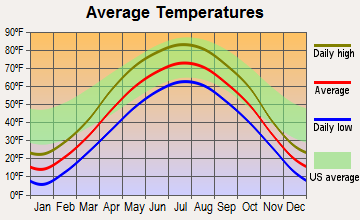
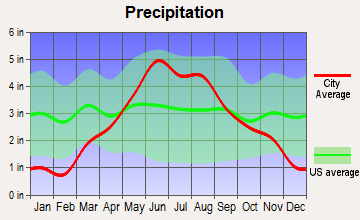
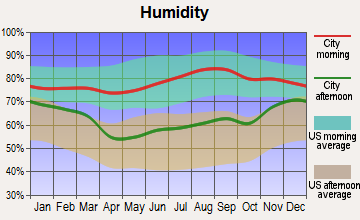
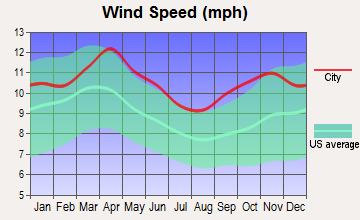
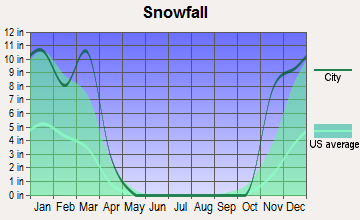
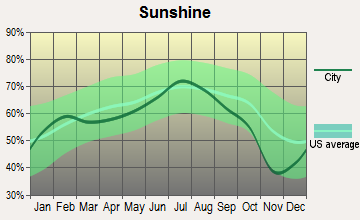
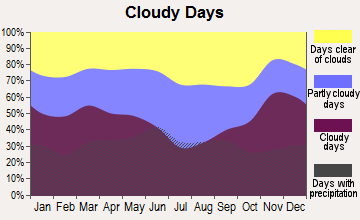


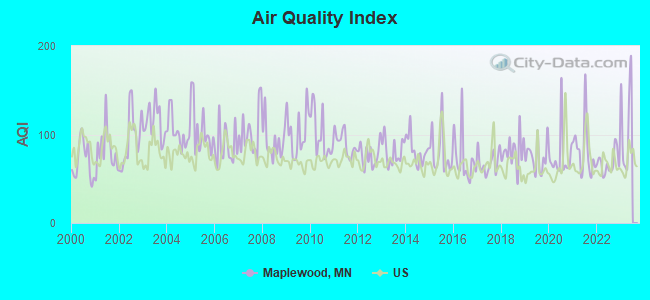
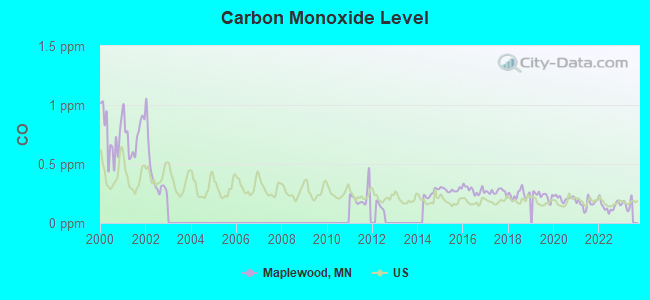
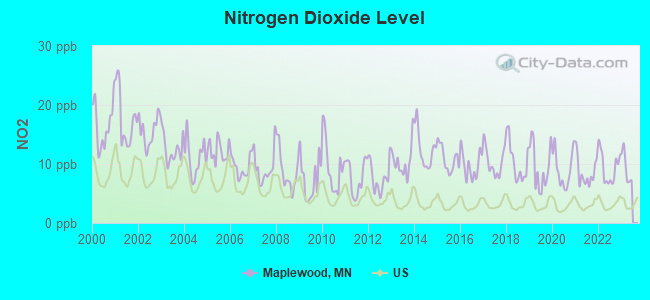
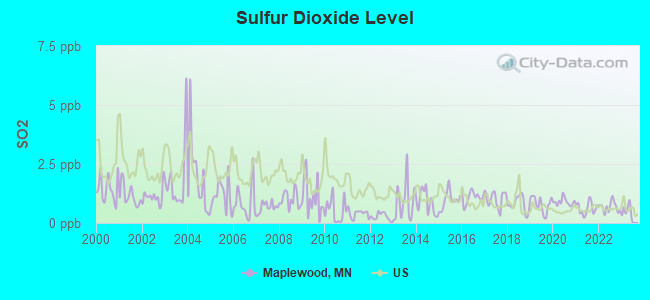
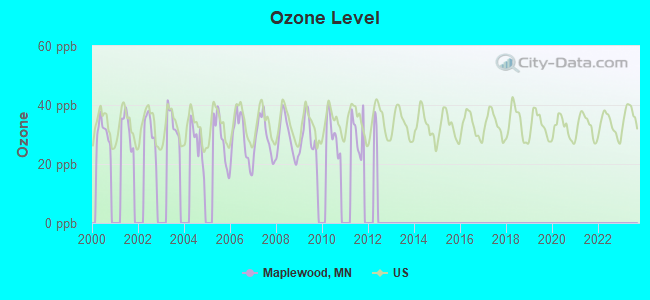
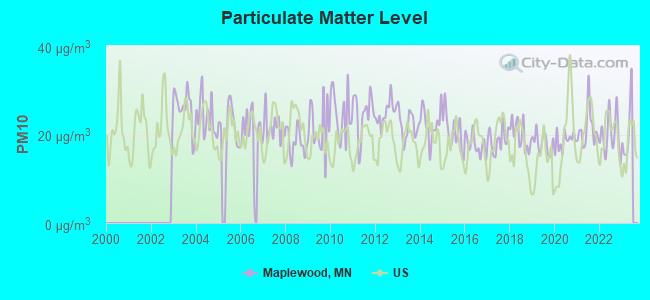
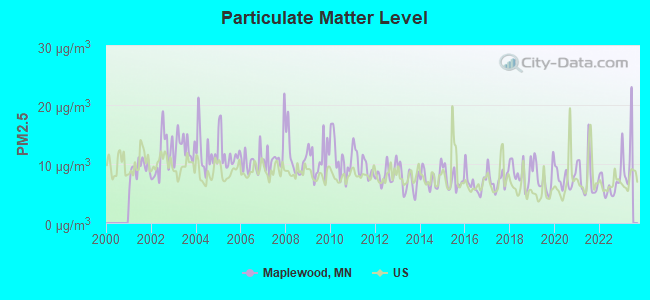
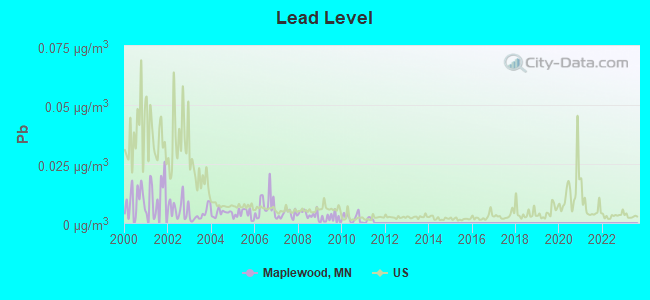

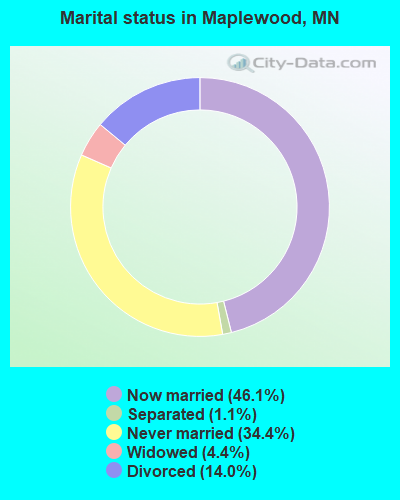
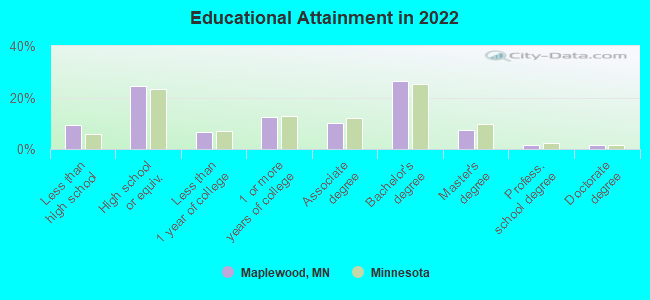
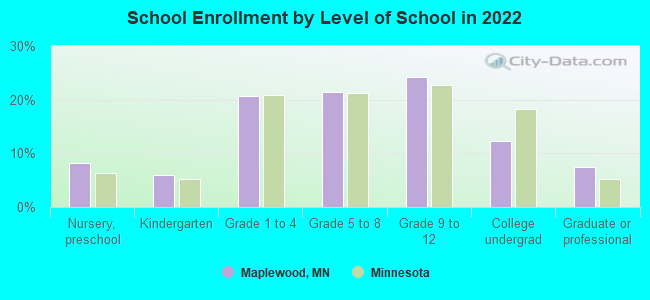
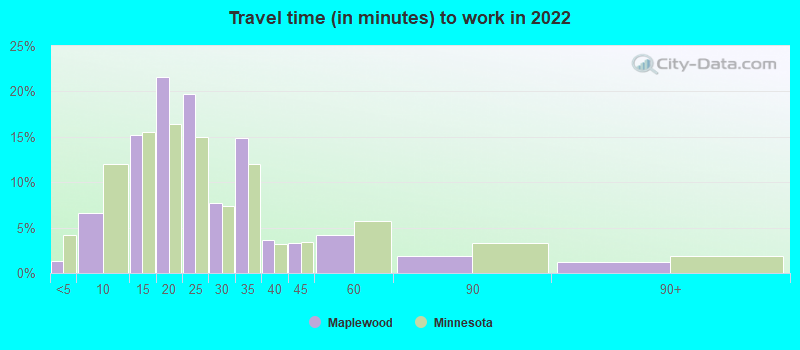
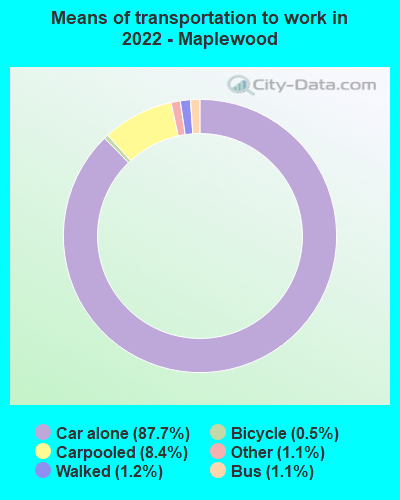
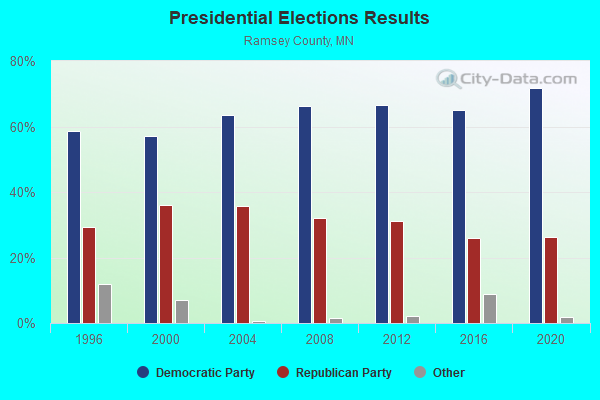
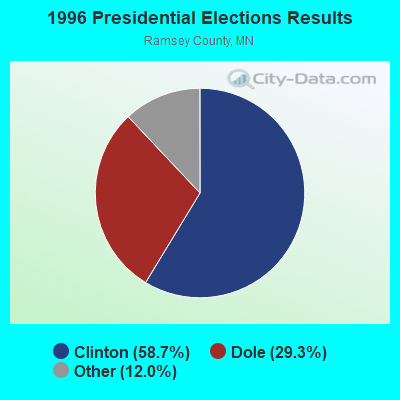
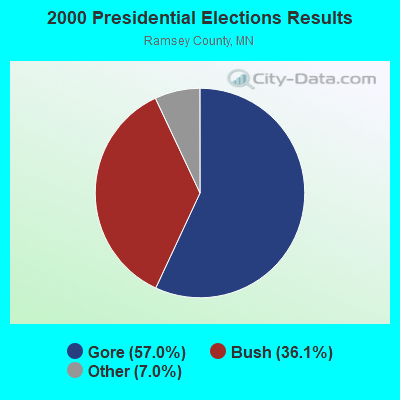
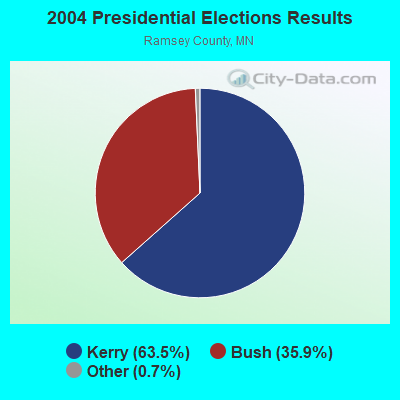
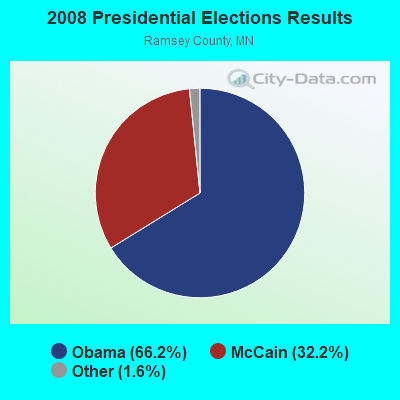
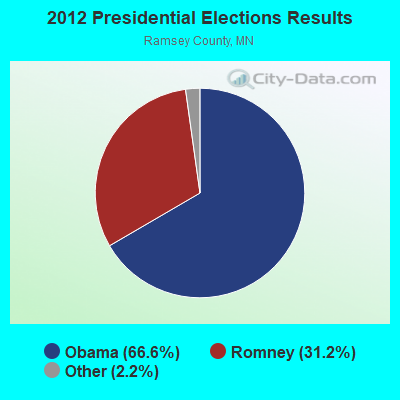
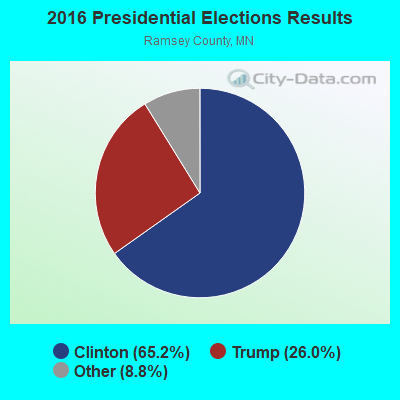
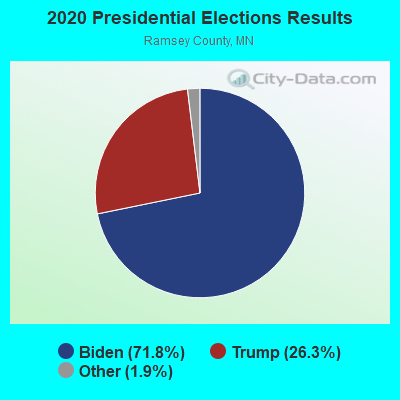
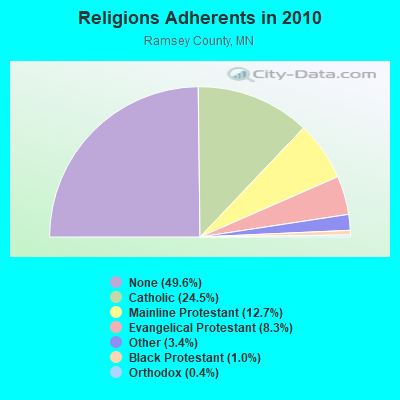
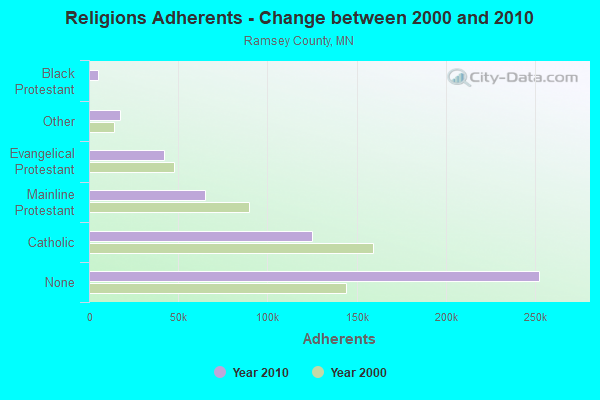
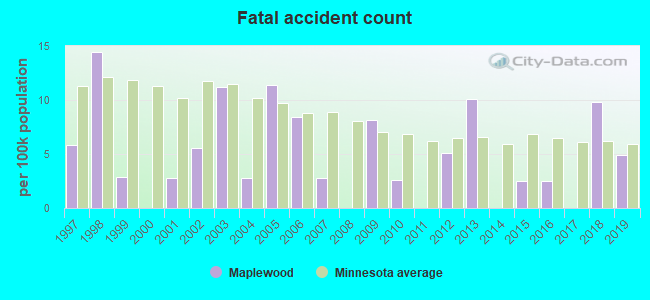
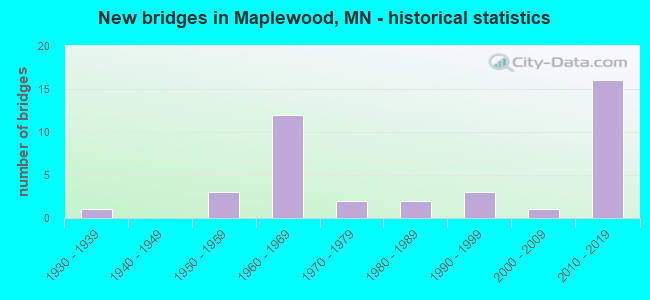
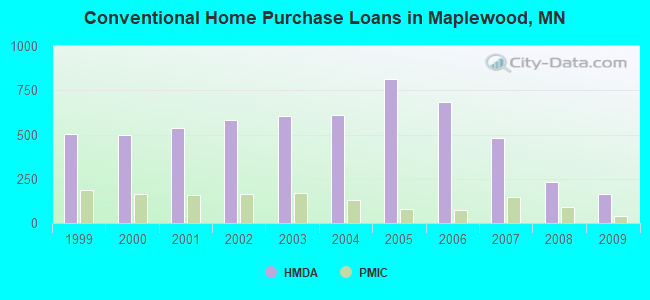
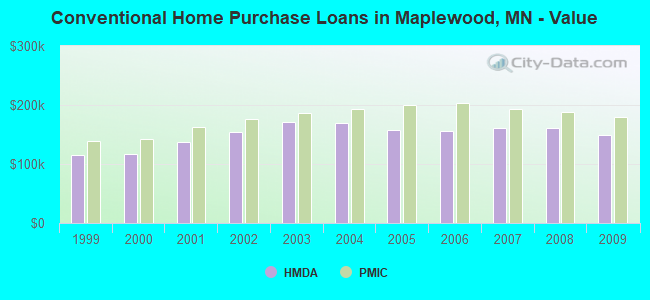
 According to the data from the years 2002 - 2018 the average number of fire incidents per year is 90. The highest number of fires - 135 took place in 2016, and the least - 9 in 2012. The data has a rising trend.
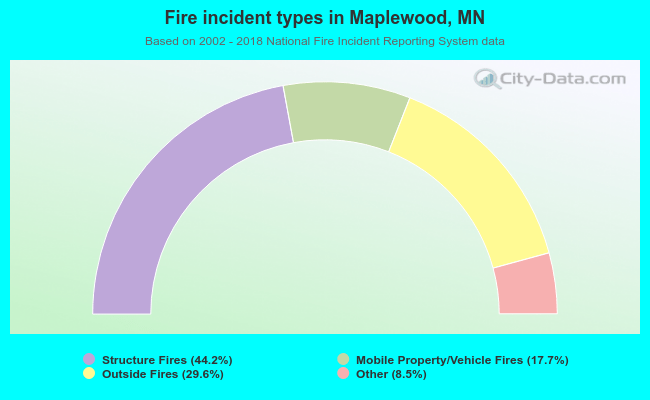 When looking into fire subcategories, the most reports belonged to: Structure Fires (44.2%), and Outside Fires (29.6%).