Estimated zip code population in 2022: 14,266 Zip code population in 2010: 12,991 Zip code population in 2000: 14,728
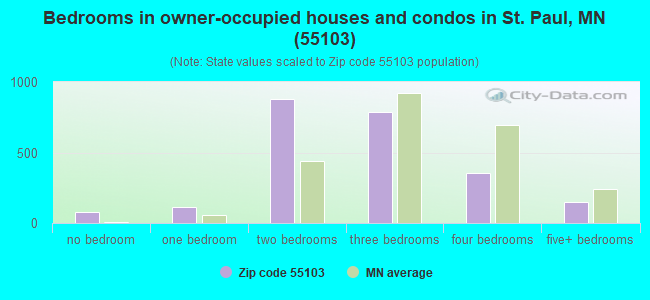
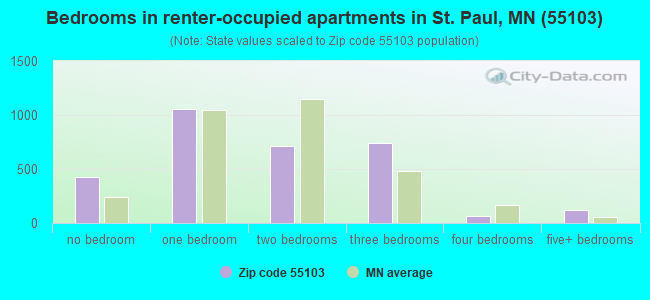
Houses and condos: 5,835 Renter-occupied apartments: 3,114
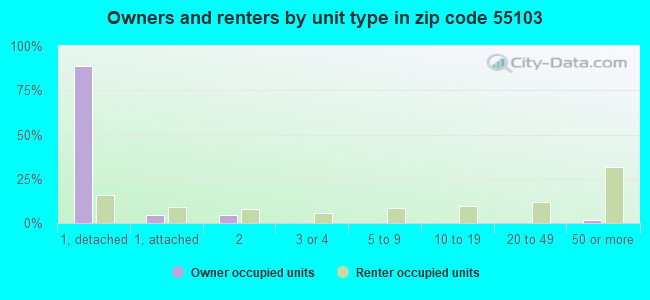
% of renters here:
57%
State:
28%
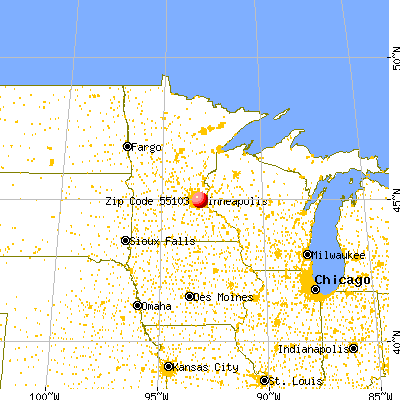
March 2022 cost of living index in zip code 55103: 114.7 (more than average, U.S. average is 100)
Land area: 2.1 sq. mi. Water area: 0.1 sq. mi.
Population density: 6,830 people per square mile
(high).
OSM Map
General Map
Google Map
MSN Map
OSM Map
General Map
Google Map
MSN Map
OSM Map
General Map
Google Map
MSN Map
OSM Map
General Map
Google Map
MSN Map
Please wait while loading the map...
Real estate property taxes paid for housing units in 2022:
This zip code:
1.2% ($2,855)
Minnesota:
1.0% ($3,087)
Median real estate property taxes paid for housing units with mortgages in 2022: $2,988 (1.1%) Median real estate property taxes paid for housing units with no mortgage in 2022: $2,636 (1.3%)
Business Search- 14 Million verified businesses
Males: 6,850
(48.0%)
Females: 7,415
(52.0%)
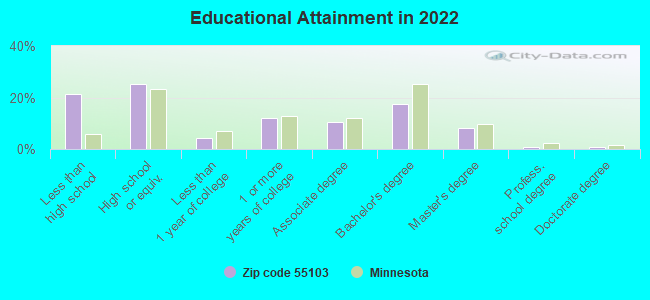
For population 25 years and over in 55103:
High school or higher: 78.6%
Bachelor's degree or higher: 27.0%
Graduate or professional degree: 9.4%
Unemployed: 3.3%
Mean travel time to work (commute): 22.9 minutes
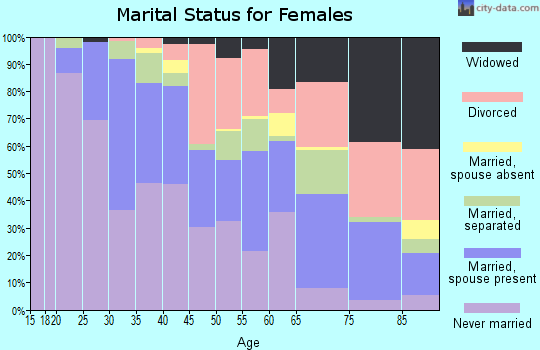
For population 15 years and over in 55103:
Never married: 50.1%
Now married: 35.7%
Separated: 0.9%
Widowed: 3.4%
Divorced: 9.9%
Zip code 55103 compared to state average:
Median household income below state average.
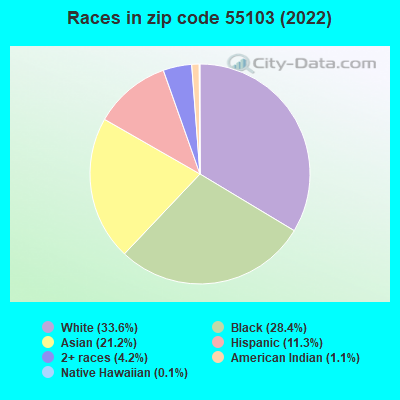
Black race population percentage significantly above state average.
Hispanic race population percentage above state average.
Median age below state average.
Foreign-born population percentage significantly above state average.
Renting percentage above state average.
Length of stay since moving in significantly above state average.
Number of rooms per house below state average.
House age above state average.
Percentage of population with a bachelor's degree or higher below state average.
Averages for the 2020 tax year for zip code 55103, filed in 2021:
Average Adjusted Gross Income (AGI) in 2020: $41,299 (Individual Income Tax Returns)
Here:
$41,299
State:
$82,178
Salary/wage: $37,225 (reported on 87.5% of returns)
Here:
$37,225
State:
$67,438
(% of AGI for various income ranges: 1183.4% for AGIs below $25k, 3827.6% for AGIs $25k-50k, 7295.6% for AGIs $50k-75k, 10449.0% for AGIs $75k-100k, 18092.6% for AGIs $100k-200k)
Taxable interest for individuals: $548 (reported on 15.1% of returns)
This zip code:
$548
Minnesota:
$1,814
(% of AGI for various income ranges: 4.1% for AGIs below $25k, 3.2% for AGIs $25k-50k, 20.7% for AGIs $50k-75k, 34.0% for AGIs $75k-100k, 41.6% for AGIs $100k-200k)
Ordinary dividends: $3,831 (reported on 8.9% of returns)
Here:
$3,831
State:
$6,928
(% of AGI for various income ranges: 10.6% for AGIs below $25k, 7.8% for AGIs $25k-50k, 43.8% for AGIs $50k-75k, 79.5% for AGIs $75k-100k, 235.8% for AGIs $100k-200k)
Net capital gain/loss in AGI: +$8,253 (reported on 8.2% of returns)
Here:
+$8,253
State:
+$20,591
(% of AGI for various income ranges: 2.3% for AGIs below $25k, 15.2% for AGIs $25k-50k, 47.1% for AGIs $50k-75k, 191.0% for AGIs $75k-100k, 437.9% for AGIs $100k-200k)
Profit/loss from business: +$8,885 (reported on 15.3% of returns)
Here:
+$8,885
State:
+$14,342
(% of AGI for various income ranges: 124.0% for AGIs below $25k, 155.6% for AGIs $25k-50k, 175.5% for AGIs $50k-75k, 481.5% for AGIs $75k-100k, 701.1% for AGIs $100k-200k)
Taxable individual retirement arrangement distribution: $15,465 (reported on 3.0% of returns)
55103:
$15,465
Minnesota:
$20,675
(% of AGI for various income ranges: 8.6% for AGIs below $25k, 25.2% for AGIs $25k-50k, 189.3% for AGIs $50k-75k, 553.7% for AGIs $100k-200k)
Total itemized deductions: $24,625 (reported on 4.2% of returns)
Here:
$24,625
State:
$33,311
(% of AGI for various income ranges: 68.6% for AGIs $25k-50k, 210.2% for AGIs $50k-75k, 525.0% for AGIs $75k-100k, 1023.7% for AGIs $100k-200k)
Charity contributions: $8,394 (reported on 3.1% of returns)
Here:
$8,394
State:
$11,879
(% of AGI for various income ranges: 8.9% for AGIs $25k-50k, 55.5% for AGIs $50k-75k, 74.5% for AGIs $75k-100k, 369.5% for AGIs $100k-200k)
Taxes paid: $6,767 (reported on 4.2% of returns)
55103:
$6,767
State:
$8,252
(% of AGI for various income ranges: 11.8% for AGIs $25k-50k, 63.5% for AGIs $50k-75k, 165.5% for AGIs $75k-100k, 286.3% for AGIs $100k-200k)
Earned income credit: $2,645 (reported on 28.1% of returns)
Here:
$2,645
State:
$2,055
(% of AGI for various income ranges: 142.6% for AGIs below $25k, 115.1% for AGIs $25k-50k, 2.0% for AGIs $50k-75k)
Percentage of individuals using paid preparers for their 2020 taxes: 94.1%
Here:
94%
State:
94%
(% for various income ranges: 93.1% for AGIs below $25k, 95.4% for AGIs $25k-50k, 93.8% for AGIs $50k-75k, 93.5% for AGIs $75k-100k, 93.9% for AGIs $100k-200k, 100.0% for AGIs over 200k)
Averages for the 2012 tax year for zip code 55103, filed in 2013:
Average Adjusted Gross Income (AGI) in 2012: $33,381 (Individual Income Tax Returns)
Here:
$33,381
State:
$67,192
Salary/wage: $31,142 (reported on 89.6% of returns)
Here:
$31,142
State:
$55,182
(% of AGI for various income ranges: 81.3% for AGIs below $25k, 91.3% for AGIs $25k-50k, 84.9% for AGIs $50k-75k, 83.7% for AGIs $75k-100k, 84.3% for AGIs $100k-200k, 55.7% for AGIs over 200k)
Taxable interest for individuals: $508 (reported on 16.8% of returns)
This zip code:
$508
Minnesota:
$1,664
(% of AGI for various income ranges: 0.2% for AGIs below $25k, 0.2% for AGIs $25k-50k, 0.5% for AGIs $50k-75k, 0.3% for AGIs $75k-100k, 0.2% for AGIs $100k-200k, 0.2% for AGIs over 200k)
Ordinary dividends: $2,337 (reported on 8.7% of returns)
Here:
$2,337
State:
$5,665
(% of AGI for various income ranges: 0.5% for AGIs below $25k, 0.3% for AGIs $25k-50k, 0.3% for AGIs $50k-75k, 0.7% for AGIs $75k-100k, 0.8% for AGIs $100k-200k, 2.2% for AGIs over 200k)
Net capital gain/loss in AGI: +$3,650 (reported on 5.7% of returns)
Here:
+$3,650
State:
+$16,131
(% of AGI for various income ranges: 4.2% for AGIs $100k-200k)
Profit/loss from business: +$7,582 (reported on 14.4% of returns)
Here:
+$7,582
State:
+$12,430
(% of AGI for various income ranges: 10.2% for AGIs below $25k, 1.6% for AGIs $25k-50k, 1.4% for AGIs $50k-75k, 1.7% for AGIs $75k-100k, 2.4% for AGIs $100k-200k)
Taxable individual retirement arrangement distribution: $9,121 (reported on 3.6% of returns)
55103:
$9,121
Minnesota:
$15,212
(% of AGI for various income ranges: 1.1% for AGIs below $25k, 0.7% for AGIs $25k-50k, 1.2% for AGIs $50k-75k, 1.2% for AGIs $75k-100k, 1.3% for AGIs $100k-200k)
Total itemized deductions: $17,701 (22% of AGI, reported on 16.6% of returns)
Here:
$17,701
State:
$24,665
Here:
21.6% of AGI
State:
19.6% of AGI
(% of AGI for various income ranges: 3.2% for AGIs below $25k, 6.5% for AGIs $25k-50k, 10.9% for AGIs $50k-75k, 12.5% for AGIs $75k-100k, 13.6% for AGIs $100k-200k, 13.1% for AGIs over 200k)
Charity contributions: $2,738 (reported on 13.0% of returns)
Here:
$2,738
State:
$3,948
(% of AGI for various income ranges: 0.2% for AGIs below $25k, 0.6% for AGIs $25k-50k, 1.5% for AGIs $50k-75k, 1.5% for AGIs $75k-100k, 1.7% for AGIs $100k-200k, 1.9% for AGIs over 200k)
Taxes paid: $6,968 (reported on 16.6% of returns)
55103:
$6,968
State:
$10,589
(% of AGI for various income ranges: 0.7% for AGIs below $25k, 1.8% for AGIs $25k-50k, 4.0% for AGIs $50k-75k, 4.9% for AGIs $75k-100k, 6.6% for AGIs $100k-200k, 7.9% for AGIs over 200k)
Earned income credit: $2,526 (reported on 36.9% of returns)
Here:
$2,526
State:
$2,037
(% of AGI for various income ranges: 11.0% for AGIs below $25k, 2.1% for AGIs $25k-50k)
Percentage of individuals using paid preparers for their 2012 taxes: 52.0%
Here:
52%
State:
55%
(% for various income ranges: 50.9% for AGIs below $25k, 54.0% for AGIs $25k-50k, 55.1% for AGIs $50k-75k, 45.8% for AGIs $75k-100k, 45.0% for AGIs $100k-200k, 100.0% for AGIs over 200k)
Averages for the 2004 tax year for zip code 55103, filed in 2005:
Average Adjusted Gross Income (AGI) in 2004: $28,534 (Individual Income Tax Returns)
Here:
$28,534
State:
$53,560
Salary/wage: $27,601 (reported on 89.5% of returns)
Here:
$27,601
State:
$46,177
(% of AGI for various income ranges: 89.0% for AGIs below $10k, 86.2% for AGIs $10k-25k, 91.0% for AGIs $25k-50k, 85.7% for AGIs $50k-75k, 89.2% for AGIs $75k-100k, 74.5% for AGIs over 100k)
Taxable interest for individuals: $693 (reported on 27.9% of returns)
This zip code:
$693
Minnesota:
$1,796
(% of AGI for various income ranges: 1.4% for AGIs below $10k, 1.1% for AGIs $10k-25k, 0.5% for AGIs $25k-50k, 0.8% for AGIs $50k-75k, 0.4% for AGIs $75k-100k, 0.3% for AGIs over 100k)
Taxable dividends: $1,239 (reported on 12.0% of returns)
Here:
$1,239
State:
$3,096
(% of AGI for various income ranges: 0.8% for AGIs below $10k, 0.5% for AGIs $10k-25k, 0.3% for AGIs $25k-50k, 0.6% for AGIs $50k-75k, 0.5% for AGIs $75k-100k, 1.0% for AGIs over 100k)
Net capital gain/loss: +$3,584 (reported on 8.5% of returns)
Here:
+$3,584
State:
+$10,864
(% of AGI for various income ranges: -0.3% for AGIs below $10k, -0.1% for AGIs $10k-25k, 0.1% for AGIs $25k-50k, 1.3% for AGIs $50k-75k, 1.9% for AGIs $75k-100k, 4.6% for AGIs over 100k)
Profit/loss from business: +$5,887 (reported on 12.4% of returns)
Here:
+$5,887
State:
+$10,442
(% of AGI for various income ranges: 6.8% for AGIs below $10k, 4.3% for AGIs $10k-25k, 1.7% for AGIs $25k-50k, 2.4% for AGIs $50k-75k, 1.3% for AGIs $75k-100k, 2.2% for AGIs over 100k)
IRA payment deduction: $2,244 (reported on 1.6% of returns)
55103:
$2,244
Minnesota:
$2,955
Total itemized deductions: $14,439 (25% of AGI, reported on 22.7% of returns)
Here:
$14,439
State:
$20,035
Here:
24.9% of AGI
State:
21.3% of AGI
(% of AGI for various income ranges: 6.6% for AGIs below $10k, 6.8% for AGIs $10k-25k, 9.8% for AGIs $25k-50k, 14.8% for AGIs $50k-75k, 15.6% for AGIs $75k-100k, 15.6% for AGIs over 100k)
Charity contributions deductions: $2,061 (3% of AGI, reported on 18.3% of returns)
Here:
$2,061
State:
$3,333
Here:
3.3% of AGI
State:
3.4% of AGI
(% of AGI for various income ranges: 0.2% for AGIs below $10k, 0.5% for AGIs $10k-25k, 1.0% for AGIs $25k-50k, 1.6% for AGIs $50k-75k, 2.0% for AGIs $75k-100k, 2.7% for AGIs over 100k)
Total tax: $3,701 (reported on 61.5% of returns)
55103:
$3,701
State:
$8,485
(% of AGI for various income ranges: 2.0% for AGIs below $10k, 3.4% for AGIs $10k-25k, 6.6% for AGIs $25k-50k, 9.2% for AGIs $50k-75k, 10.2% for AGIs $75k-100k, 16.5% for AGIs over 100k)
Earned income credit: $1,821 (reported on 29.2% of returns)
Here:
$1,821
State:
$1,523
Percentage of individuals using paid preparers for their 2004 taxes: 59.4%
Here:
59%
State:
59%
(% for various income ranges: 57.4% for AGIs below $10k, 65.1% for AGIs $10k-25k, 56.8% for AGIs $25k-50k, 56.5% for AGIs $50k-75k, 53.0% for AGIs $75k-100k, 62.2% for AGIs over 100k)
Likely homosexual households (counted as self-reported same-sex unmarried-partner households)
Lesbian couples: 0.2% of all households
Gay men: 0.1% of all households
Household received Food Stamps/SNAP in the past 12 months: 1,459 Household did not receive Food Stamps/SNAP in the past 12 months: 4,041
Women who had a birth in the past 12 months: 299 (233 now married, 66 unmarried) Women who did not have a birth in the past 12 months: 3,724 (1,093 now married, 2,627 unmarried)
Housing units in zip code 55103 with a mortgage: 1,506 (210 second mortgage, 151 both second mortgage and home equity loan) Houses without a mortgage: 15
Median monthly owner costs for units with a mortgage: $1,650 Median monthly owner costs for units without a mortgage: $592
Residents with income below the poverty level in 2022:
This zip code:
26.8%
Whole state:
9.6%
Residents with income below 50% of the poverty level in 2022:
This zip code:
14.2%
Whole state:
5.2%
Median number of rooms in houses and condos:
Here:
6.1
State:
7.1
Median number of rooms in apartments:
Here:
3.8
State:
3.8
Notable locations in this zip code not listed on our city pages
Churches in zip code 55103 include: Warrendale Presbyterian Church (A), Saint Philips Episcopal Church (B), Saint Andrews Catholic Church (C), Saint Agnes Church (D), Saint Adalberts Church (E), Camphor Memorial United Methodist Church (F). Display/hide their locations on the map
Parks in zip code 55103 include: Scheffer Playground (1), Martin Luther King Recreational Area (2), Central Village Park (3), Western Park (4), Orchard Park (5), Como Park (6). Display/hide their locations on the map
Tourist attractions (not listed on the city page) : Como Park - Como Park Zoo and Conservatory Campus (Cultural Attractions- Events- & Facilities; 1225 Estabrook Drive), St Paul City OFCS & Como Zoo (Nature Centers; 1250 Kaufman Drive North), Our Fair Carousel Inc (Amusement & Theme Parks; 1245 Midway Parkway).
2,152 married couples with children.
1,224 single-parent households (136 men, 1,088 women).
62.8% of residents of 55103 zip code speak English at home.
5.3% of residents speak Spanish at home (54% very well, 20% well, 25% not well, 1% not at all).
1.5% of residents speak other Indo-European language at home (80% very well, 6% well, 14% not well).
20.1% of residents speak Asian or Pacific Island language at home (30% very well, 27% well, 25% not well, 19% not at all).
11.4% of residents speak other language at home (51% very well, 31% well, 14% not well, 4% not at all).
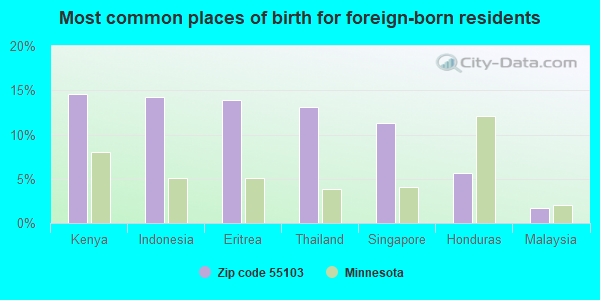
Foreign born population: 3,567 (25.0%) (62.2% of them are naturalized citizens)
This zip code:
25.0%
Whole state:
8.7%
15%Kenya
14%Indonesia
14%Eritrea
13%Thailand
11%Singapore
6%Honduras
2%Malaysia
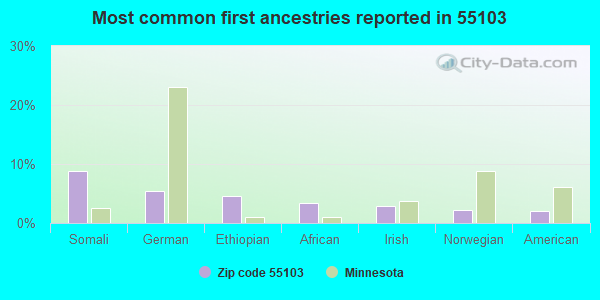
9%Somali
5%German
5%Ethiopian
3%African
3%Irish
2%Norwegian
2%American
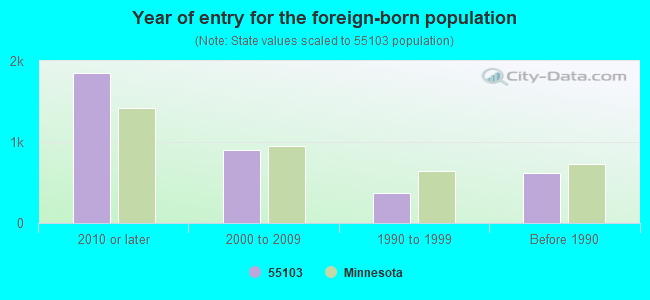
Year of entry for the foreign-born population
1,8522010 or later
9032000 to 2009
3751990 to 1999
617Before 1990
Major facilities with environmental interests located in this zip code:
BETHESDA LUTHERAN MEDICAL CENTER (559 CAPITOL BLVD in SAINT PAUL, MN)
AIR MINOR (AIRS/AFS) STATE MASTER (Minnesota Pollution Control Agency permits and compilance tracking) - RCRAINFO-MND071358519, CESQG, RCRIS-MND071358519, STATE MASTER (Minnesota Pollution Control Agency permits and compilance tracking) - AIRS-2712300093, AIR PROGRAM, AFS-2712300093, AIR SYNTHETIC MINOR CRITERIA AND HAZARDOUS AIR POLLUTANT INVENTORY (Inventory of air pollution sources) Conditionally Exempt Small Quantity Generators, less than 100 kg/month of hazardous waste (Resource Conservation and Recovery Act (tracking hazardous waste)) - notification Business SIC and NAICS classification: GENERAL MEDICAL AND SURGICAL HOSPITALS Organizations: MN SYNOD LUTHERAN CHURCH OF AMERICA (CONTACT/OWNER)
, HEALTHEAST MEDICAL RESEARCH INC (CONTACT/OWNER)
Alternative names: BETHESDA HEALTHEAST, BETHESDA LUTHERAN HOSPITAL (HEALTHEAST), HEALTH EAST BETHESDA
AAA METAL FINISHING (691 RICE ST in SAINT PAUL, MN)
AIR MINOR (AIRS/AFS) (Integrated Compliance Information System) - ICIS-05-2000-0490, FORMAL ENFORCEMENT ACTION STATE MASTER (Minnesota Pollution Control Agency permits and compilance tracking) - AIRS-2712300705, AIR PROGRAM, RCRAINFO-MND985698315, CESQG, RCRIS-MND985698315, HAZARDOUS WASTE PROGRAM (Resource Conservation and Recovery Act (tracking hazardous waste)) Business SIC classification: ELECTROPLATING, PLATING, POLISHING, ANODIZING, AND COLORING; NONCLASSIFIABLE ESTABLISHMENTS Organizations: AAA METAL FINISHING INC (CONTACT/OWNER)
BAY WEST TECHNOLOGIES INC (5 EMPIRE DR in SAINT PAUL, MN)
STATE MASTER (Minnesota Pollution Control Agency permits and compilance tracking) - RCRAINFO-MND982205437, CESQG, RCRIS-MND982205437, (Resource Conservation and Recovery Act (tracking hazardous waste)) Conditionally Exempt Small Quantity Generators, less than 100 kg/month of hazardous waste (Resource Conservation and Recovery Act (tracking hazardous waste)) Business SIC classification: FACILITIES SUPPORT MANAGEMENT SERVICES Business NAICS classification: REMEDIATION SERVICES. Organizations: ERICKSON RONDI (CONTACT/OWNER)
, BAYWEST INC (CONTACT/OWNER)
Alternative names: BAY WEST INC
B-G CLEANERS (475 RICE ST in SAINT PAUL, MN)
STATE MASTER (Minnesota Pollution Control Agency permits and compilance tracking) - RCRAINFO-MND081128464, CESQG, RCRIS-MND081128464, (Resource Conservation and Recovery Act (tracking hazardous waste)) Business SIC classification: DRYCLEANING PLANTS, EXCEPT RUG CLEANING Organizations: B G CLEANERS (CONTACT/OWNER)
MYSY ONE HOUR PHOTO (315 UNIVERSITY AVE in SAINT PAUL, MN)
STATE MASTER (Minnesota Pollution Control Agency permits and compilance tracking) - RCRAINFO-MND097887517, CESQG, RCRIS-MND097887517, (Resource Conservation and Recovery Act (tracking hazardous waste)) Business SIC classification: AUTOMOTIVE DEALERS Organizations: VANG PAISEE (CONTACT/OWNER)
BETHESDA UNIVERSITY FAMILY PRACTICE CLIN (590 PARK ST STE 310 in SAINT PAUL, MN)
STATE MASTER (Minnesota Pollution Control Agency permits and compilance tracking) - RCRAINFO-MND985672278, HAZARDOUS WASTE PROGRAM, RCRIS-MND985672278, (Resource Conservation and Recovery Act (tracking hazardous waste)) Business SIC classification: HEALTH AND ALLIED SERVICES Organizations: BETHESDA UNIV FAMILY PRACTICE CLINIC (CONTACT/OWNER)
Alternative names: BETHESDA UNIV FAMILY PRACTICE CLINIC
MODEL CITIES ABRAMS CLINIC (491 UNIVERSITY in SAINT PAUL, MN)
STATE MASTER (Minnesota Pollution Control Agency permits and compilance tracking) - RCRAINFO-MND020495784, CESQG, RCRIS-MND020495784, (Resource Conservation and Recovery Act (tracking hazardous waste)) Business SIC classification: HEALTH AND ALLIED SERVICES
CERTIFIED AUTO REPAIR (977 FRONT AVE in SAINT PAUL, MN)
STATE MASTER (Minnesota Pollution Control Agency permits and compilance tracking) - RCRAINFO-MND048445571, CESQG, RCRIS-MND048445571, (Resource Conservation and Recovery Act (tracking hazardous waste)) Alternative names: CERTIFIED AUTO RPR
ALS POLISHING AND PLATING (191 LAFOND AVE in SAINT PAUL, MN)
STATE MASTER (Minnesota Pollution Control Agency permits and compilance tracking) - RCRAINFO-MND985769405, CESQG, RCRIS-MND985769405, (Resource Conservation and Recovery Act (tracking hazardous waste)) Organizations: MORENO JUAN D (CONTACT/OWNER)
, ALS POLISHING & PLATING (CONTACT/OWNER)
PEAK DENTAL HEALTH INCORPORATED (590 PARK STREET SUITE 218 in SAINT PAUL, MN)
STATE MASTER (Minnesota Pollution Control Agency permits and compilance tracking) - RCRAINFO-MND985746239, HAZARDOUS WASTE PROGRAM, RCRIS-MND985746239, (Resource Conservation and Recovery Act (tracking hazardous waste)) Business SIC classification: OFFICES AND CLINICS OF DENTISTS
OLD HOME FOODS INC (370 UNIVERSITY AVE in SAINT PAUL, MN)
STATE MASTER (Minnesota Pollution Control Agency permits and compilance tracking) - RCRAINFO-MND006147474, CESQG, RCRIS-MND006147474, COMPLIANCE ACTIVITY (Tracking inspections of insecticide, fungicide, and rodenticide, and toxic substances) Conditionally Exempt Small Quantity Generators, less than 100 kg/month of hazardous waste (Resource Conservation and Recovery Act (tracking hazardous waste)) - notification Business SIC classification: NATURAL, PROCESSED, AND IMITATION CHEESE; FOOD PREPARATIONS Organizations: OLD HOME FOOD INC (CONTACT/OWNER)
APSARA ONE HOUR PHOTO (448 UNIVERSITY AVE W in SAINT PAUL, MN)
STATE MASTER (Minnesota Pollution Control Agency permits and compilance tracking) - RCRAINFO-MNR000054361, CESQG, RCRIS-MNR000054361, (Resource Conservation and Recovery Act (tracking hazardous waste)) Organizations: VAN DAVYVANN (CONTACT/OWNER)
NORTH STAR SERVICES MGMT LLC (27 EMPIRE DR in ST PAUL, MN)
STATE MASTER (Minnesota Pollution Control Agency permits and compilance tracking) - RCRIS-MNR000112615, CESQG (Resource Conservation and Recovery Act (tracking hazardous waste)) Organizations: CHRIST HOUSEHOLD OF FAITH (CONTACT/OWNER)
Housing units lacking complete plumbing facilities: 0.6% Housing units lacking complete kitchen facilities: 0.7%
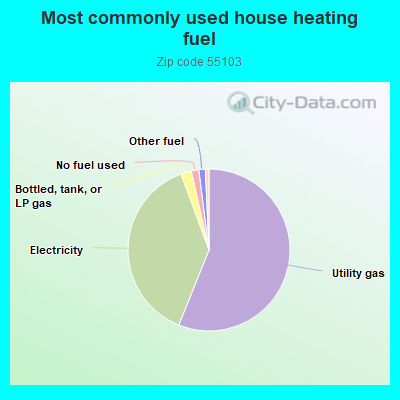
56.1%Utility gas
38.3%Electricity
2.1%Bottled, tank, or LP gas
1.5%No fuel used
1.3%Other fuel
0.7%Fuel oil, kerosene, etc.
Population in 1990: 12,169. Population change in the 1990s: +2,559 (+21.0%).
Place of birth for U.S.-born residents:
This state: 7,677
Northeast: 254
Midwest: 1,773
South: 585
West: 427
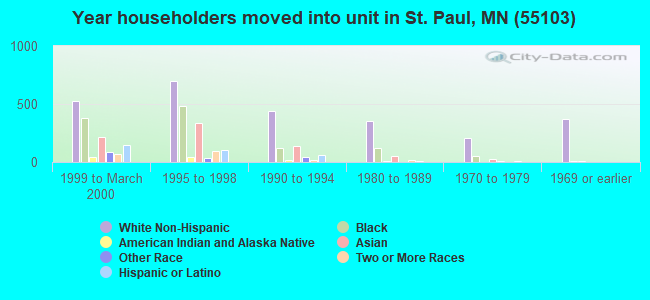
48% of the 55103 zip code residents lived in the same house 5 years ago. Out of people who lived in different houses, 51% lived in this county. Out of people who lived in different counties, 50% lived in Minnesota.
88% of the 55103 zip code residents lived in the same house 1 year ago. Out of people who lived in different houses, 58% moved from this county. Out of people who lived in different houses, 23% moved from different county within same state. Out of people who lived in different houses, 13% moved from different state. Out of people who lived in different houses, 4% moved from abroad.
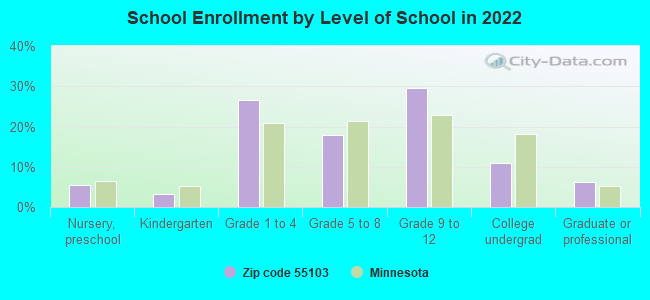
Private vs. public school enrollment:
Students in private schools in grades 1 to 8 (elementary and middle school): 159
Here:
9.7%
Minnesota:
12.9%
Students in private schools in grades 9 to 12 (high school): 87
Here:
7.9%
Minnesota:
8.6%
Students in private undergraduate colleges: 37
Here:
9.4%
Minnesota:
26.2%
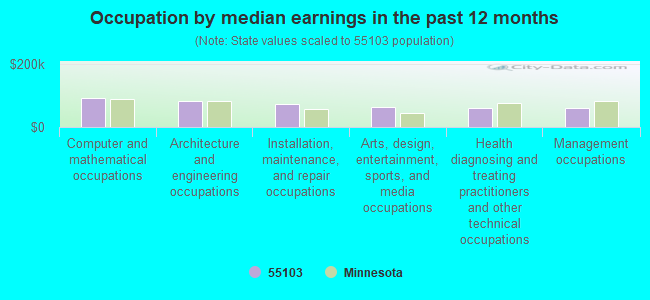
Occupation by median earnings in the past 12 months ($)
92,847Computer and mathematical occupations
81,456Architecture and engineering occupations
71,468Installation, maintenance, and repair occupations
64,274Arts, design, entertainment, sports, and media occupations
60,660Health diagnosing and treating practitioners and other technical occupations
59,206Management occupations
Companies with federal contracts located in this zip code:
RANI ENGINEERING, INC (556 RICE STREET in SAINT PAUL, MN; small business) : $1,961,635 in 45 contractsfrom 2000 to 2006
Contracts for Administrative and Service Buildings, Architect - Engineer Services (including landscaping, interior layout, and designing), Airfield, Communication and Missile Facilities, Other Architect and Engineering Services, and moreby Air Force, U.S. Army Corps of Engineers - civil program financing only, Army Signed by year:2000: $459,430; 2001: $64,228; 2002: $227,614; 2003: $458,259; 2004: $382,650; 2005: $288,076; 2006: $81,378.
Biggest contracts:
$219,468 with Air Force for Administrative and Service Buildings. Signed on 2002-09-28. Completion date: 2003-03-31.
$180,801 with U.S. Army Corps of Engineers - civil program financing only for Architect - Engineer Services (including landscaping, interior layout, and designing). Taking place in IN. Signed on 2000-07-12. Completion date: 2000-11-09.
$174,692 with Air Force for Airfield, Communication and Missile Facilities. Signed on 2003-09-30. Completion date: 2004-02-20.
$145,792 with Army for Other Architect and Engineering Services. Signed on 2004-02-10. Completion date: 2004-09-20.
KELLY CAPITAL I VENTURES, LP (161 SAINT ANTHONY AVE in SAINT PAUL, MN; small business)
$11,544 with Army for Lodging - Hotel/Motel. Signed on 2005-10-06. Completion date: 2005-10-08.
LONG ENTERPRISES INC (991 LEXINGTON PKWY N in SAINT PAUL, MN; small business)
$7,586 with Army for Food Services. Taking place in WA. Signed on 2006-02-09. Completion date: 2006-02-23.
Top industries in this zip code by the number of employees in 2005:
Administrative and Support and Waste Management and Remediation Services: Temporary Help Services (500-999 employees: 1 establishment, 100-249 employees: 2 establishments, 20-49 employees: 3 establishments, 5-9 employees: 2 establishments, 1-4 employees: 1 establishment)
Management of Companies and Enterprises: Corporate, Subsidiary, and Regional Managing Offices (500-999: 1, 1-4: 1)
Health Care and Social Assistance: Specialty (except Psychiatric and Substance Abuse) Hospitals (500-999: 1)
Health Care and Social Assistance: Home Health Care Services (100-249: 2, 50-99: 1, 10-19: 1, 1-4: 2)
Health Care and Social Assistance: Offices of Physicians (except Mental Health Specialists) (250-499: 1, 5-9: 1, 1-4: 2)
2002 - 2018 National Fire Incident Reporting System (NFIRS) incidents
According to the data from the years 2002 - 2018 the average number of fire incidents per year is 92. The highest number of reported fires - 121 took place in 2004, and the least - 71 in 2011. The data has a rising trend.
When looking into fire subcategories, the most incidents belonged to: Structure Fires (63.0%), and Outside Fires (21.5%).
Fire incident types reported to NFIRS in Zip Code 55103


 Nearest zip codes: 55102, 55101, 55155, 55130, 55104, 55117.
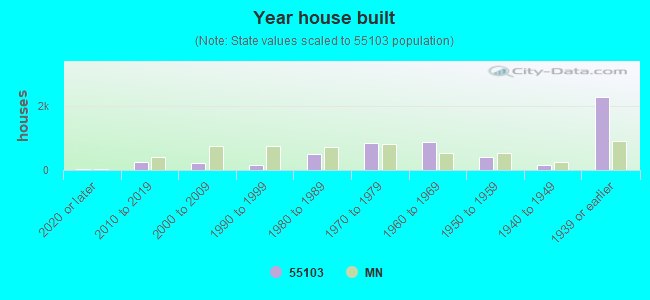


 According to the data from the years 2002 - 2018 the average number of fire incidents per year is 92. The highest number of reported fires - 121 took place in 2004, and the least - 71 in 2011. The data has a rising trend.
 When looking into fire subcategories, the most incidents belonged to: Structure Fires (63.0%), and Outside Fires (21.5%).