Estimated zip code population in 2022: 27,403 Zip code population in 2010: 28,455 Zip code population in 2000: 27,818
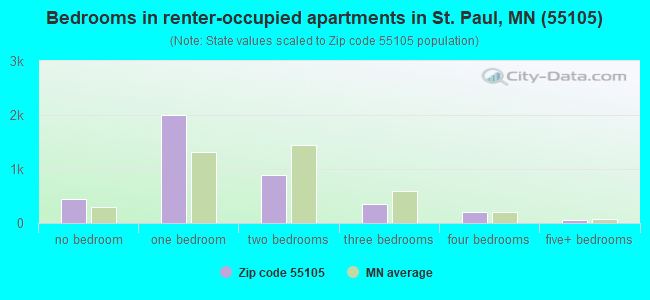
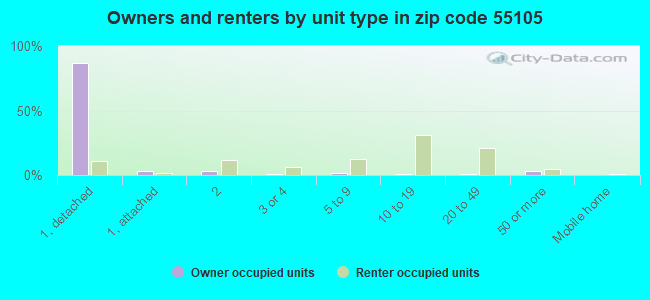
Houses and condos: 12,328 Renter-occupied apartments: 3,899
% of renters here:
33%
State:
28%
March 2022 cost of living index in zip code 55105: 114.1 (more than average, U.S. average is 100)
Land area: 3.6 sq. mi. Water area: 0.2 sq. mi.
Population density: 7,586 people per square mile
(high).
OSM Map
General Map
Google Map
MSN Map
OSM Map
General Map
Google Map
MSN Map
OSM Map
General Map
Google Map
MSN Map
OSM Map
General Map
Google Map
MSN Map
Please wait while loading the map...
Real estate property taxes paid for housing units in 2022:
This zip code:
1.3% ($6,548)
Minnesota:
1.0% ($3,087)
Median real estate property taxes paid for housing units with mortgages in 2022: $6,555 (1.3%) Median real estate property taxes paid for housing units with no mortgage in 2022: $6,480 (1.4%)
Estimated median house/condo value in 2022: $487,915
55105:
$487,915
Minnesota:
$314,600
Median resident age:
This zip code:
35.5 years
Minnesota median age:
39.0 years
Average household size:
This zip code:
2.1 people
Minnesota:
2.4 people
Averages for the 2020 tax year for zip code 55105, filed in 2021:
Average Adjusted Gross Income (AGI) in 2020: $133,760 (Individual Income Tax Returns)
Here:
$133,760
State:
$82,178
Salary/wage: $109,462 (reported on 82.9% of returns)
Here:
$109,462
State:
$67,438
(% of AGI for various income ranges: 1131.7% for AGIs below $25k, 3833.7% for AGIs $25k-50k, 6802.8% for AGIs $50k-75k, 10036.4% for AGIs $75k-100k, 20442.2% for AGIs $100k-200k, 106272.1% for AGIs over 200k)
Taxable interest for individuals: $2,100 (reported on 44.6% of returns)
This zip code:
$2,100
Minnesota:
$1,814
(% of AGI for various income ranges: 18.8% for AGIs below $25k, 29.2% for AGIs $25k-50k, 56.4% for AGIs $50k-75k, 78.0% for AGIs $75k-100k, 147.5% for AGIs $100k-200k, 1300.0% for AGIs over 200k)
Ordinary dividends: $10,660 (reported on 39.7% of returns)
Here:
$10,660
State:
$6,928
(% of AGI for various income ranges: 59.7% for AGIs below $25k, 98.4% for AGIs $25k-50k, 214.9% for AGIs $50k-75k, 363.0% for AGIs $75k-100k, 703.6% for AGIs $100k-200k, 6020.3% for AGIs over 200k)
Net capital gain/loss in AGI: +$32,946 (reported on 34.3% of returns)
Here:
+$32,946
State:
+$20,591
(% of AGI for various income ranges: 36.5% for AGIs below $25k, 96.2% for AGIs $25k-50k, 174.8% for AGIs $50k-75k, 360.0% for AGIs $75k-100k, 968.8% for AGIs $100k-200k, 20351.8% for AGIs over 200k)
Profit/loss from business: +$19,228 (reported on 17.8% of returns)
Here:
+$19,228
State:
+$14,342
(% of AGI for various income ranges: 110.6% for AGIs below $25k, 185.3% for AGIs $25k-50k, 191.5% for AGIs $50k-75k, 615.6% for AGIs $75k-100k, 868.2% for AGIs $100k-200k, 3344.8% for AGIs over 200k)
Taxable individual retirement arrangement distribution: $27,675 (reported on 12.7% of returns)
55105:
$27,675
Minnesota:
$20,675
(% of AGI for various income ranges: 62.3% for AGIs below $25k, 151.6% for AGIs $25k-50k, 295.9% for AGIs $50k-75k, 638.4% for AGIs $75k-100k, 1223.9% for AGIs $100k-200k, 2742.1% for AGIs over 200k)
Self-employed (Keogh) retirement plans: $24,825 (reported on 2.2% of returns)
55105:
$24,825
Minnesota:
$23,059
(% of AGI for various income ranges: 6.1% for AGIs below $25k, 21.7% for AGIs $50k-75k, 64.6% for AGIs $100k-200k, 919.7% for AGIs over 200k)
Total itemized deductions: $38,501 (reported on 18.2% of returns)
Here:
$38,501
State:
$33,311
(% of AGI for various income ranges: 109.5% for AGIs below $25k, 186.7% for AGIs $25k-50k, 503.2% for AGIs $50k-75k, 936.4% for AGIs $75k-100k, 1445.5% for AGIs $100k-200k, 8618.9% for AGIs over 200k)
Charity contributions: $17,686 (reported on 15.8% of returns)
Here:
$17,686
State:
$11,879
(% of AGI for various income ranges: 4.9% for AGIs below $25k, 25.3% for AGIs $25k-50k, 81.0% for AGIs $50k-75k, 145.7% for AGIs $75k-100k, 324.0% for AGIs $100k-200k, 4734.5% for AGIs over 200k)
Taxes paid: $9,100 (reported on 18.1% of returns)
55105:
$9,100
State:
$8,252
(% of AGI for various income ranges: 17.6% for AGIs below $25k, 48.4% for AGIs $25k-50k, 150.5% for AGIs $50k-75k, 355.7% for AGIs $75k-100k, 487.1% for AGIs $100k-200k, 1506.3% for AGIs over 200k)
Earned income credit: $1,167 (reported on 4.4% of returns)
Here:
$1,167
State:
$2,055
(% of AGI for various income ranges: 21.6% for AGIs below $25k, 14.4% for AGIs $25k-50k)
Percentage of individuals using paid preparers for their 2020 taxes: 92.1%
Here:
92%
State:
94%
(% for various income ranges: 89.6% for AGIs below $25k, 92.0% for AGIs $25k-50k, 92.0% for AGIs $50k-75k, 91.6% for AGIs $75k-100k, 93.0% for AGIs $100k-200k, 95.4% for AGIs over 200k)
Averages for the 2012 tax year for zip code 55105, filed in 2013:
Average Adjusted Gross Income (AGI) in 2012: $102,586 (Individual Income Tax Returns)
Here:
$102,586
State:
$67,192
Salary/wage: $82,389 (reported on 86.1% of returns)
Here:
$82,389
State:
$55,182
(% of AGI for various income ranges: 78.4% for AGIs below $25k, 82.8% for AGIs $25k-50k, 76.5% for AGIs $50k-75k, 72.6% for AGIs $75k-100k, 79.2% for AGIs $100k-200k, 59.5% for AGIs over 200k)
Taxable interest for individuals: $2,110 (reported on 48.4% of returns)
This zip code:
$2,110
Minnesota:
$1,664
(% of AGI for various income ranges: 1.2% for AGIs below $25k, 0.8% for AGIs $25k-50k, 0.7% for AGIs $50k-75k, 0.7% for AGIs $75k-100k, 0.5% for AGIs $100k-200k, 1.4% for AGIs over 200k)
Ordinary dividends: $7,873 (reported on 37.8% of returns)
Here:
$7,873
State:
$5,665
(% of AGI for various income ranges: 3.7% for AGIs below $25k, 1.6% for AGIs $25k-50k, 2.2% for AGIs $50k-75k, 2.6% for AGIs $75k-100k, 2.2% for AGIs $100k-200k, 3.6% for AGIs over 200k)
Net capital gain/loss in AGI: +$23,327 (reported on 29.9% of returns)
Here:
+$23,327
State:
+$16,131
(% of AGI for various income ranges: 0.7% for AGIs below $25k, 0.5% for AGIs $25k-50k, 1.0% for AGIs $50k-75k, 1.2% for AGIs $75k-100k, 1.7% for AGIs $100k-200k, 12.6% for AGIs over 200k)
Profit/loss from business: +$19,357 (reported on 18.5% of returns)
Here:
+$19,357
State:
+$12,430
(% of AGI for various income ranges: 7.0% for AGIs below $25k, 4.4% for AGIs $25k-50k, 3.2% for AGIs $50k-75k, 4.1% for AGIs $75k-100k, 4.1% for AGIs $100k-200k, 2.8% for AGIs over 200k)
Taxable individual retirement arrangement distribution: $17,167 (reported on 11.8% of returns)
55105:
$17,167
Minnesota:
$15,212
(% of AGI for various income ranges: 3.9% for AGIs below $25k, 2.1% for AGIs $25k-50k, 2.5% for AGIs $50k-75k, 3.5% for AGIs $75k-100k, 2.4% for AGIs $100k-200k, 1.3% for AGIs over 200k)
Self-employment retirement plans: $19,743 (reported on 2.3% of returns)
55105:
$19,743
Minnesota:
$17,874
(% of AGI for various income ranges: 0.4% for AGIs below $25k, 0.2% for AGIs $50k-75k, 0.2% for AGIs $75k-100k, 0.4% for AGIs $100k-200k, 0.6% for AGIs over 200k)
Total itemized deductions: $31,407 (18% of AGI, reported on 49.5% of returns)
Here:
$31,407
State:
$24,665
Here:
17.8% of AGI
State:
19.6% of AGI
(% of AGI for various income ranges: 13.3% for AGIs below $25k, 10.1% for AGIs $25k-50k, 15.5% for AGIs $50k-75k, 17.8% for AGIs $75k-100k, 17.9% for AGIs $100k-200k, 14.1% for AGIs over 200k)
Charity contributions: $5,506 (reported on 44.6% of returns)
Here:
$5,506
State:
$3,948
(% of AGI for various income ranges: 0.9% for AGIs below $25k, 1.1% for AGIs $25k-50k, 1.6% for AGIs $50k-75k, 2.1% for AGIs $75k-100k, 2.2% for AGIs $100k-200k, 3.0% for AGIs over 200k)
Taxes paid: $16,149 (reported on 49.4% of returns)
55105:
$16,149
State:
$10,589
(% of AGI for various income ranges: 3.6% for AGIs below $25k, 3.6% for AGIs $25k-50k, 6.3% for AGIs $50k-75k, 7.7% for AGIs $75k-100k, 9.1% for AGIs $100k-200k, 8.2% for AGIs over 200k)
Earned income credit: $1,148 (reported on 6.0% of returns)
Here:
$1,148
State:
$2,037
(% of AGI for various income ranges: 1.6% for AGIs below $25k, 0.2% for AGIs $25k-50k)
Percentage of individuals using paid preparers for their 2012 taxes: 47.4%
Here:
47%
State:
55%
(% for various income ranges: 37.7% for AGIs below $25k, 41.2% for AGIs $25k-50k, 49.7% for AGIs $50k-75k, 51.6% for AGIs $75k-100k, 52.7% for AGIs $100k-200k, 71.7% for AGIs over 200k)
Averages for the 2004 tax year for zip code 55105, filed in 2005:
Average Adjusted Gross Income (AGI) in 2004: $69,672 (Individual Income Tax Returns)
Here:
$69,672
State:
$53,560
Salary/wage: $59,943 (reported on 85.5% of returns)
Here:
$59,943
State:
$46,177
(% of AGI for various income ranges: 272.0% for AGIs below $10k, 73.8% for AGIs $10k-25k, 81.6% for AGIs $25k-50k, 79.1% for AGIs $50k-75k, 81.5% for AGIs $75k-100k, 67.9% for AGIs over 100k)
Taxable interest for individuals: $1,625 (reported on 54.8% of returns)
This zip code:
$1,625
Minnesota:
$1,796
(% of AGI for various income ranges: 19.6% for AGIs below $10k, 2.8% for AGIs $10k-25k, 1.2% for AGIs $25k-50k, 1.5% for AGIs $50k-75k, 0.8% for AGIs $75k-100k, 1.1% for AGIs over 100k)
Taxable dividends: $4,099 (reported on 42.1% of returns)
Here:
$4,099
State:
$3,096
(% of AGI for various income ranges: 18.8% for AGIs below $10k, 2.6% for AGIs $10k-25k, 1.9% for AGIs $25k-50k, 1.8% for AGIs $50k-75k, 1.8% for AGIs $75k-100k, 2.8% for AGIs over 100k)
Net capital gain/loss: +$12,310 (reported on 32.3% of returns)
Here:
+$12,310
State:
+$10,864
(% of AGI for various income ranges: 2.0% for AGIs below $10k, 1.3% for AGIs $10k-25k, 1.0% for AGIs $25k-50k, 1.1% for AGIs $50k-75k, 1.8% for AGIs $75k-100k, 8.8% for AGIs over 100k)
Profit/loss from business: +$16,859 (reported on 16.9% of returns)
Here:
+$16,859
State:
+$10,442
(% of AGI for various income ranges: 16.9% for AGIs below $10k, 7.5% for AGIs $10k-25k, 4.0% for AGIs $25k-50k, 4.1% for AGIs $50k-75k, 4.1% for AGIs $75k-100k, 3.8% for AGIs over 100k)
Profit/loss from farming: +$957 (reported on 0.2% of returns)
Here:
+$957
State:
-$962
IRA payment deduction: $2,747 (reported on 3.4% of returns)
55105:
$2,747
Minnesota:
$2,955
(% of AGI for various income ranges: 0.6% for AGIs below $10k, 0.5% for AGIs $10k-25k, 0.4% for AGIs $25k-50k, 0.2% for AGIs $50k-75k, 0.1% for AGIs $75k-100k, 0.0% for AGIs over 100k)
Self-employed pension: $16,061 (reported on 2.5% of returns)
Here:
$16,061
Minnesota:
$12,099
(% of AGI for various income ranges: 0.2% for AGIs $10k-25k, 0.2% for AGIs $25k-50k, 0.3% for AGIs $50k-75k, 0.5% for AGIs $75k-100k, 0.8% for AGIs over 100k)
Total itemized deductions: $22,669 (19% of AGI, reported on 50.0% of returns)
Here:
$22,669
State:
$20,035
Here:
19.4% of AGI
State:
21.3% of AGI
(% of AGI for various income ranges: 41.2% for AGIs below $10k, 15.3% for AGIs $10k-25k, 12.9% for AGIs $25k-50k, 18.4% for AGIs $50k-75k, 19.4% for AGIs $75k-100k, 15.7% for AGIs over 100k)
Charity contributions deductions: $4,247 (3% of AGI, reported on 45.4% of returns)
Here:
$4,247
State:
$3,333
Here:
3.4% of AGI
State:
3.4% of AGI
(% of AGI for various income ranges: 2.6% for AGIs below $10k, 1.4% for AGIs $10k-25k, 1.7% for AGIs $25k-50k, 2.5% for AGIs $50k-75k, 2.6% for AGIs $75k-100k, 3.2% for AGIs over 100k)
Total tax: $12,981 (reported on 83.7% of returns)
55105:
$12,981
State:
$8,485
(% of AGI for various income ranges: 7.3% for AGIs below $10k, 5.6% for AGIs $10k-25k, 9.0% for AGIs $25k-50k, 10.5% for AGIs $50k-75k, 10.9% for AGIs $75k-100k, 19.7% for AGIs over 100k)
Earned income credit: $929 (reported on 4.5% of returns)
Here:
$929
State:
$1,523
Percentage of individuals using paid preparers for their 2004 taxes: 47.5%
Here:
48%
State:
59%
(% for various income ranges: 36.7% for AGIs below $10k, 44.4% for AGIs $10k-25k, 43.8% for AGIs $25k-50k, 53.4% for AGIs $50k-75k, 50.6% for AGIs $75k-100k, 60.3% for AGIs over 100k)
Likely homosexual households (counted as self-reported same-sex unmarried-partner households)
Lesbian couples: 0.3% of all households
Gay men: 0.1% of all households
Household received Food Stamps/SNAP in the past 12 months: 284 Household did not receive Food Stamps/SNAP in the past 12 months: 11,363
Women who had a birth in the past 12 months: 196 (200 now married, 0 unmarried) Women who did not have a birth in the past 12 months: 8,077 (2,510 now married, 5,559 unmarried)
Housing units in zip code 55105 with a mortgage: 5,321 (709 second mortgage, 30 home equity loan, 574 both second mortgage and home equity loan) Houses without a mortgage: 183
Median monthly owner costs for units with a mortgage: $2,497 Median monthly owner costs for units without a mortgage: $983
Residents with income below the poverty level in 2022:
This zip code:
7.2%
Whole state:
9.6%
Residents with income below 50% of the poverty level in 2022:
This zip code:
3.2%
Whole state:
5.2%
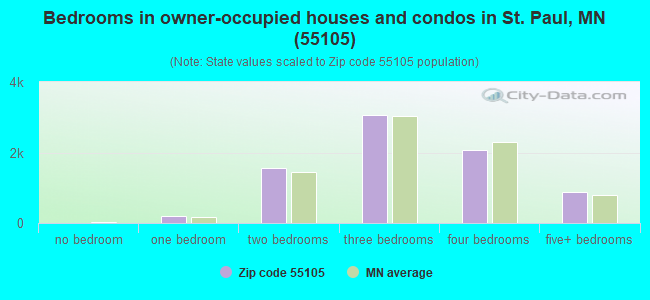
Median number of rooms in houses and condos:
Here:
7.5
State:
7.1
Median number of rooms in apartments:
Here:
3.7
State:
3.8
Notable locations in this zip code not listed on our city pages
Churches in zip code 55105 include: Convent of the Visitation (A), Saint Pauls United Church of Christ (B), Saint Pauls Church on the Hill (C), Nativity Catholic Church (D), Mount Zion Temple Church (E), MacAlester Plymouth United Presbyterian Church (F), Bethany Convent (G), Immaculate Heart of Mary Church (H), House of Hope Presbyterian Church (I). Display/hide their locations on the map
Parks in zip code 55105 include: Linwood Park (1), Edgecombe Recreational Area (2), Groveland Park (3), Mattocks Park (4). Display/hide their locations on the map
Tourist attractions (not listed on the city page) : Information Lost & Found (Cultural Attractions- Events- & Facilities; 1276 Juliet Avenue), Groveland Tap (Cultural Attractions- Events- & Facilities; 1834 St Clair Ave), Awe Vending & Amusements Inc (Amusement & Theme Parks; 476 Snelling Avenue South).
3,777 married couples with children.
617 single-parent households (141 men, 476 women).
91.0% of residents of 55105 zip code speak English at home.
3.9% of residents speak Spanish at home (88% very well, 10% well, 2% not well).
2.0% of residents speak other Indo-European language at home (93% very well, 4% well, 3% not well).
1.6% of residents speak Asian or Pacific Island language at home (69% very well, 28% well, 3% not at all).
0.9% of residents speak other language at home (94% very well, 6% well).
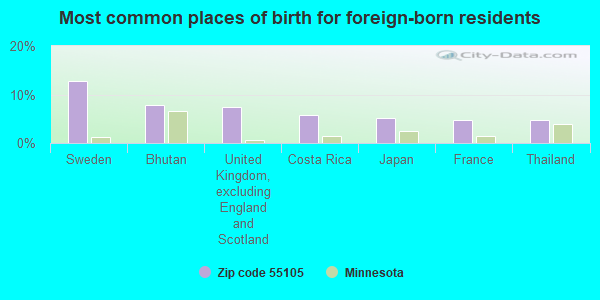
Foreign born population: 1,259 (4.6%) (52.0% of them are naturalized citizens)
This zip code:
4.6%
Whole state:
8.7%
13%Sweden
8%Bhutan
7%United Kingdom, excluding England and Scotland
6%Costa Rica
5%Japan
5%France
5%Thailand
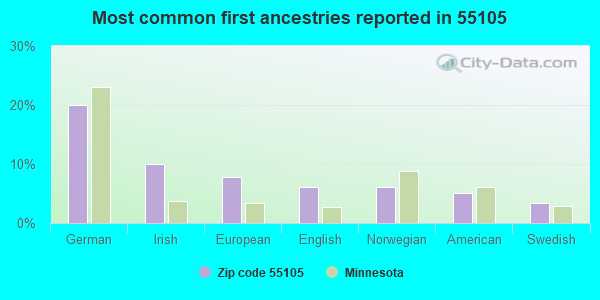
20%German
10%Irish
8%European
6%English
6%Norwegian
5%American
3%Swedish
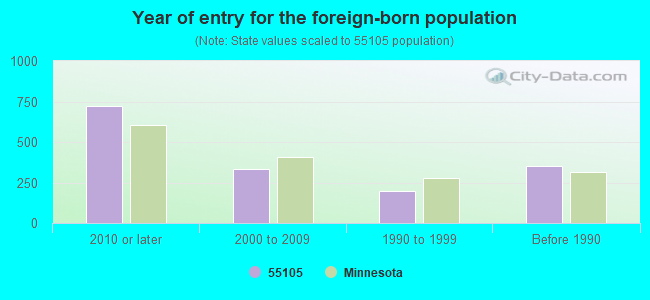
Year of entry for the foreign-born population
7252010 or later
3312000 to 2009
1971990 to 1999
351Before 1990
Major facilities with environmental interests located in this zip code:
EASTSIDE HD REPAIR (993 OMAGAN ST in SAINT PAUL, MN)
STATE MASTER (Minnesota Pollution Control Agency permits and compilance tracking) - RCRAINFO-MND981790439, HAZARDOUS WASTE PROGRAM, RCRIS-MND981790439, (Resource Conservation and Recovery Act (tracking hazardous waste)) Organizations: MARCELLUS JOHN (CONTACT/OWNER)
Alternative names: EASTSIDE H D REPAIR
HAMLINE AUTO BODY INC (650 GRAND AVE in SAINT PAUL, MN)
STATE MASTER (Minnesota Pollution Control Agency permits and compilance tracking) - AIRS-2712300635, AIR PROGRAM, RCRAINFO-MND023036312, CESQG, AFS-2712300635, AIR SYNTHETIC MINOR, RCRIS-MNR000006577, HAZARDOUS WASTE PROGRAM (Resource Conservation and Recovery Act (tracking hazardous waste)) Business SIC classification: TOP, BODY, AND UPHOLSTERY REPAIR SHOPS AND PAINT SHOPS Business NAICS classification: AUTOMOTIVE BODY, PAINT, AND INTERIOR REPAIR AND MAINTENANCE. Organizations: HAMLINE AUTO INC (CONTACT/OWNER)
HAAS COLLISION CRAFT (1400 SAINT CLAIR AVE in SAINT PAUL, MN)
AIR MINOR (AIRS/AFS) STATE MASTER (Minnesota Pollution Control Agency permits and compilance tracking) - AIRS-2712300686, AIR PROGRAM, RCRAINFO-MND093908895, CESQG, AFS-2712300686, AIR SYNTHETIC MINOR, RCRIS-MND093908895, CESQG Conditionally Exempt Small Quantity Generators, less than 100 kg/month of hazardous waste (Resource Conservation and Recovery Act (tracking hazardous waste)) - notification Business SIC classification: TOP, BODY, AND UPHOLSTERY REPAIR SHOPS AND PAINT SHOPS Organizations: LORSUNG PROPERTIES LLC (CONTACT/OWNER)
MITCHELL WILLIAM COLLEGE OF LAW (875 SUMMIT AVE in SAINT PAUL, MN)
STATE MASTER (Minnesota Pollution Control Agency permits and compilance tracking) - RCRAINFO-MND076505437, HAZARDOUS WASTE PROGRAM, RCRIS-MND076505437, (Resource Conservation and Recovery Act (tracking hazardous waste)) Organizations: WILLIAM MITCHELL COLLEGE OF LAW (CONTACT/OWNER)
Alternative names: WILLIAM MITCHELL COLLEGE OF LAW
HOLY SPIRIT PARISH (512 S ALBERT in SAINT PAUL, MN)
STATE MASTER (Minnesota Pollution Control Agency permits and compilance tracking) - RCRAINFO-MNR000078568, CESQG, RCRIS-MNR000078568, (Resource Conservation and Recovery Act (tracking hazardous waste))
HIGHLAND REPAIR SVC (1946 ST CLAIR AVE in SAINT PAUL, MN)
STATE MASTER (Minnesota Pollution Control Agency permits and compilance tracking) - RCRAINFO-MNR000015891, CESQG, RCRIS-MNR000015891, (Resource Conservation and Recovery Act (tracking hazardous waste)) Business SIC classification: TOP, BODY, AND UPHOLSTERY REPAIR SHOPS AND PAINT SHOPS Organizations: ERICKSON DAVID AND KAY (CONTACT/OWNER)
, HIGHLAND REPAIR SERVICE INC (CONTACT/OWNER)
HIGHLAND PARK BP (1191 RANDOLPH AVENUE in SAINT PAUL, MN)
STATE MASTER (Minnesota Pollution Control Agency permits and compilance tracking) - RCRAINFO-MND981775893, CESQG, RCRIS-MND981775893, Conditionally Exempt Small Quantity Generators, less than 100 kg/month of hazardous waste (Resource Conservation and Recovery Act (tracking hazardous waste)) Business SIC classification: GASOLINE SERVICE STATIONS Business NAICS classification: GASOLINE STATIONS WITH CONVENIENCE STORES. Organizations: JOE NISSAN` (CONTACT/OWNER)
Alternative names: HIGHLAND PARK AMOCO
AVON PLACE CONDO ASSN (51 S AVON ST in SAINT PAUL, MN)
STATE MASTER (Minnesota Pollution Control Agency permits and compilance tracking) - RCRAINFO-MNR000013623, CESQG, RCRIS-MNR000013623, (Resource Conservation and Recovery Act (tracking hazardous waste))
BORDERS INC (1390 UNIVERSITY AVE W in ST. PAUL, MN)
STATE MASTER (Minnesota Pollution Control Agency permits and compilance tracking) - RCRIS-MNS000102616, HAZARDOUS WASTE PROGRAM (Resource Conservation and Recovery Act (tracking hazardous waste))
GRAND AVENUE HARDWARE CO INC (1668 1/2 GRAND AVE in ST. PAUL, MN)
STATE MASTER (Minnesota Pollution Control Agency permits and compilance tracking) - RCRIS-MNR000109009, CESQG (Resource Conservation and Recovery Act (tracking hazardous waste)) Business SIC and NAICS classification: HARDWARE STORES Alternative names: ACE RENTAL
FORMER EDINA REALTY BUILDING (1050 GRAND AVE in ST. PAUL, MN)
STATE MASTER (Minnesota Pollution Control Agency permits and compilance tracking) - RCRIS-MNS000106898, HAZARDOUS WASTE PROGRAM (Resource Conservation and Recovery Act (tracking hazardous waste)) Organizations: COMMERCIAL REALISTATE DEVELOPMENT (CONTACT/OWNER)
, OXFORD HILL DEVELOPMENT GROUP LLC (CONTACT/OWNER)
ARNAL EUGENE DR (1154 GRAND AVE in SAINT PAUL, MN)
STATE MASTER (Minnesota Pollution Control Agency permits and compilance tracking) - RCRAINFO-MND110381290, CESQG, RCRIS-MND110381290, Conditionally Exempt Small Quantity Generators, less than 100 kg/month of hazardous waste (Resource Conservation and Recovery Act (tracking hazardous waste)) - notification Organizations: EUGENE ARNAL (CONTACT/OWNER)
, MCGRATH GRAND CHIROPRACTIC PA (CONTACT/OWNER)
Alternative names: EUGENE ARNAL
AJ SCHAAKE COMPANY (919 SAINT CLAIR AVENUE in SAINT PAUL, MN)
STATE MASTER (Minnesota Pollution Control Agency permits and compilance tracking) - RCRAINFO-MN0000486811, CESQG, RCRIS-MN0000486811, (Resource Conservation and Recovery Act (tracking hazardous waste)) Alternative names: SCHAAKE A J CO
Housing units lacking complete plumbing facilities: 0.2% Housing units lacking complete kitchen facilities: 0.4%
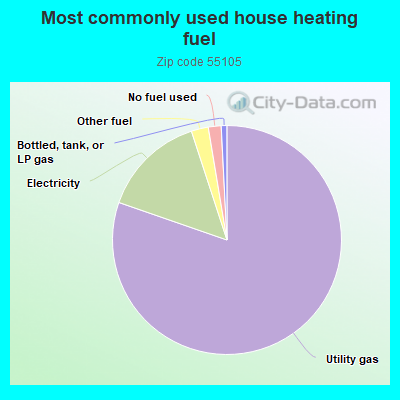
80.0%Utility gas
14.6%Electricity
2.4%Other fuel
1.8%No fuel used
0.8%Bottled, tank, or LP gas
Population in 1990: 26,216. Population change in the 1990s: +1,602 (+6.1%).
Place of birth for U.S.-born residents:
This state: 15,684
Northeast: 1,695
Midwest: 5,650
South: 1,168
West: 1,623
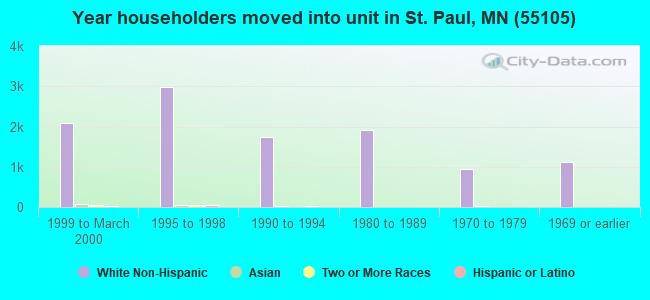
53% of the 55105 zip code residents lived in the same house 5 years ago. Out of people who lived in different houses, 36% lived in this county. Out of people who lived in different counties, 50% lived in Minnesota.
86% of the 55105 zip code residents lived in the same house 1 year ago. Out of people who lived in different houses, 42% moved from this county. Out of people who lived in different houses, 36% moved from different county within same state. Out of people who lived in different houses, 19% moved from different state. Out of people who lived in different houses, 3% moved from abroad.
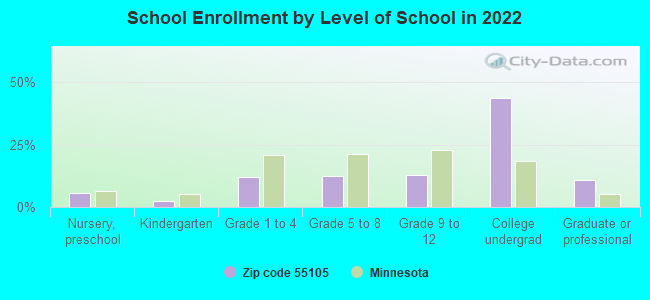
Private vs. public school enrollment:
Students in private schools in grades 1 to 8 (elementary and middle school): 1,069
Here:
49.5%
Minnesota:
12.9%
Students in private schools in grades 9 to 12 (high school): 433
Here:
39.8%
Minnesota:
8.6%
Students in private undergraduate colleges: 3,270
Here:
83.1%
Minnesota:
26.2%
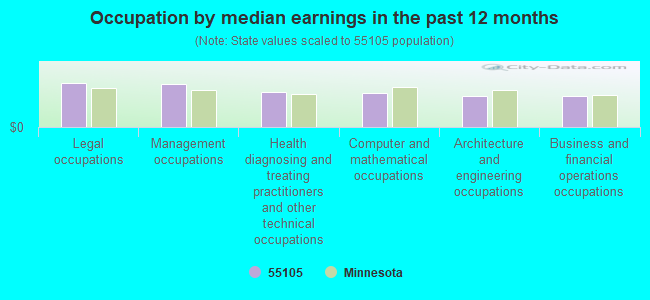
Occupation by median earnings in the past 12 months ($)
123,971Legal occupations
121,045Management occupations
98,199Health diagnosing and treating practitioners and other technical occupations
95,646Computer and mathematical occupations
87,836Architecture and engineering occupations
87,206Business and financial operations occupations
Companies with federal contracts located in this zip code:
NORTHERN VIDEO GRAPHICS INC (1745 WELLESLEY AVE in SAINT PAUL, MN; small business) : $316,300 in 5 contractsfrom 2001 to 2004
Contracts for Antennas, Waveguides, and Related Equipment, ADP Support Equipment, ADPE System Configuration, Miscellaneous Items, and moreby Air Force, Army Signed by year:2000: $0; 2001: $77,050; 2002: $137,750; 2003: $64,000; 2004: $37,500; 2005: $0; 2006: $0.
Biggest contracts:
$137,750 with Air Force for Antennas, Waveguides, and Related Equipment. Taking place in FL. Signed on 2002-05-09. Completion date: 2002-08-31.
$64,000 with Army for ADP Support Equipment. Signed on 2003-09-10. Completion date: 2004-03-01.
$39,650 with Army for ADPE System Configuration. Signed on 2001-03-15. Completion date: 2001-05-01.
$37,500 with Air Force for Miscellaneous Items. Signed on 2004-08-26. Completion date: 2005-02-25.
TELEMEDIA SOLUTIONS INC (1389 GOODRICH in SAINT PAUL, MN; small business) : $217,919 in 2 contractsin 2002
$166,923 with Army for Communications Security Equipment and Components. Taking place in SD. Signed on 2002-09-25. Completion date: 2002-12-30.
$50,996 with Air Force for Radio and Television Communication Equipment, Except Airborne. Signed on 2002-09-06. Completion date: 2002-11-05.
ST THOMAS COLLEGE CREDIT UNION (2115 SUMMIT AVE in SAINT PAUL, MN)
$207,496 with Air Force for Tuition, Registration, and Membership Fees. Signed on 2000-01-11. Completion date: 2000-09-30.
KAM COM TECHNOLOGY INC (1823 WELLESLEY AVE in SAINT PAUL, MN; small business)
$3,450 with Navy for Miscellaneous Electrical and Electronic Components. Taking place in SC. Signed on 2005-01-31. Completion date: 2005-02-04.
David Bressoud ( in Minneapolis, MN; small business) : $0 in 4 contractsfrom 2004 to 2005
$0 with National Institute of Standards and Technology for Other Professional Services. Taking place in MD. Signed on 2005-12-28. Completion date: 2006-12-31.
$0, same as above.Signed on 2004-10-19. Completion date: 2005-12-31.
$0, same as above.Signed on 2004-10-19. Completion date: 2005-12-31.
$0, same as above.Signed on 2004-11-24. Completion date: 2005-12-31.
Top industries in this zip code by the number of employees in 2005:
2002 - 2018 National Fire Incident Reporting System (NFIRS) incidents
Based on the data from the years 2002 - 2018 the average number of fires per year is 66. The highest number of fires - 85 took place in 2012, and the least - 46 in 2002. The data has a growing trend.
When looking into fire subcategories, the most incidents belonged to: Structure Fires (68.7%), and Outside Fires (21.8%).
Fire incident types reported to NFIRS in Zip Code 55105


+$957
-$962
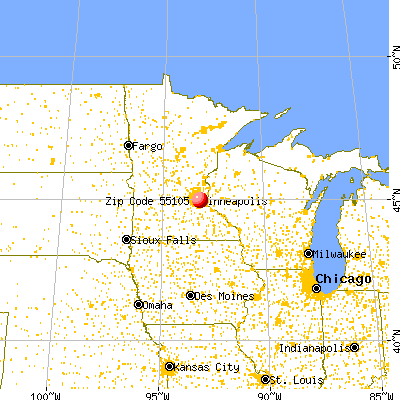
 Nearest zip codes: 55104, 55116, 55114, 55108, 55102, 55150.


 Based on the data from the years 2002 - 2018 the average number of fires per year is 66. The highest number of fires - 85 took place in 2012, and the least - 46 in 2002. The data has a growing trend.
 When looking into fire subcategories, the most incidents belonged to: Structure Fires (68.7%), and Outside Fires (21.8%).