Manhattan and Brooklyn are two iconic boroughs within New York City, each with their unique characteristics, attractions, and lifestyles. Living in either borough provides a unique urban experience with a multitude of opportunities for work, education, and entertainment. Although both places share some similar characteristics given their proximity, they vary regarding cost of living, real-estate, opportunities, and lifestyle. Keep reading this comprehensive comparison to understand these differences better.
Both Manhattan and Brooklyn have areas of high safety and areas where crime rates are higher. Manhattan, being a major tourist hub, sees higher incidences of petty crimes like pickpocketing in crowded tourist areas. Brooklyn, while generally safe, has neighborhoods with higher crime rates, but the borough has seen significant improvements over the years. Gentrification has resulted in safer neighborhoods overall. To stay safe, inhabitants should always be aware of their surroundings.
Cost of Living
Living in Manhattan is generally more expensive than in Brooklyn. The cost of rent, groceries, and dining out are typically higher in Manhattan. Although Brooklyn is becoming more expensive due to gentrification, it still offers more affordable living options when compared to Manhattan, especially in neighborhoods further from the city center.
Income Tax
Both boroughs are subject to the same New York state and city income tax rates. These progressive tax rates range from 4% to 8.82% for the state and from 3.078% to 3.876% for the city, depending on your income level.
Property Tax
Property taxes also apply in both boroughs but expect to pay significantly more in property taxes in Manhattan due to the higher property values. Exact rates can vary but generally, tax rates in Brooklyn are slightly higher.
Sales Tax
In both Manhattan and Brooklyn, the combined city and state sales tax rate is 8.875%. This rate applies to most goods and services, although there are exceptions for certain items like groceries and prescription drugs.
Income
Type
Brooklyn
Manhattan
Estimated median household income
$67,567
$84,435
Estimated per capita income
$39,536
$76,589
Cost of living index (U.S. average is 100)
185.4
185.3
If you make $50,000 in Manhattan, you will have to make $50,027 in Brooklyn to maintain the same standard of living.
Geographical Conditions
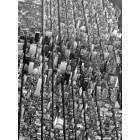
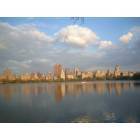
Geographically, Manhattan is an island surrounded by the Hudson, East, and Harlem rivers. It's characterized by its skyline of high-rise buildings. Brooklyn, on the other hand, is located on the western tip of Long Island and features a more varied landscape with beaches, parks, and residential neighborhoods.
Geographical information
Type
Brooklyn
Manhattan
Land area
70.6 sq. miles
23 sq. miles
Population density
35,956 people per sq. mile
70,629 people per sq. mile
Relative area comparison
Brooklyn, NY Manhattan, NY
Education
Manhattan is home to many prestigious universities including New York University and Columbia University. Brooklyn also offers high-quality education, with institutions like Brooklyn College and Pratt Institute. Both boroughs offer a range of high-performing public and private K-12 schools. However, school quality can vary from neighborhood to neighborhood in both boroughs.
Manhattan is a globally recognized financial center, and it's home to Wall Street and many Fortune 500 companies. Brooklyn's economy is more diversified, with a significant presence of small businesses, start-ups, arts and culture, health care, and manufacturing. Job opportunities are abundant in both locations, but the types of jobs can vary.
Biggest Employers
In Manhattan, the biggest employers are in finance, with companies like JP Morgan Chase and Citigroup. The public sector, particularly New York City's government and public hospitals, is also a significant employer. In Brooklyn, healthcare providers like Maimonides Medical Center and the New York City public school system are large employers.
In Brooklyn (Kings County), 82.1% voted for Democrats and 16.9% for Republicans in 2012 Presidential Election. In Manhattan (New York County), 83.9% voted for Democrats and 14.9% for Republicans.
Elections
Type
Democrats
Republicans
Other
Year
Brooklyn
Manhattan
Brooklyn
Manhattan
Brooklyn
Manhattan
2020
76.9%
86.5%
22.2%
12.2%
1.0%
1.2%
2016
79.6%
86.7%
17.5%
9.7%
2.9%
3.6%
2012
82.1%
83.9%
16.9%
14.9%
0.9%
1.2%
2008
79.9%
86.1%
20.1%
13.5%
0.0%
0.3%
2004
75.0%
82.3%
24.3%
16.8%
0.7%
0.9%
2000
81.0%
80.0%
15.7%
14.5%
3.3%
5.5%
1996
80.1%
80.0%
15.1%
13.8%
4.9%
6.3%
Breakdown of population affiliated with a religious congregation
Type
Adherents
Congregations
Religion
Brooklyn
Manhattan
Brooklyn
Manhattan
CATHOLIC CHURCH
24.9%
20.4%
7.5%
12.6%
MUSLIM ESTIMATE
3.8%
2.7%
4.2%
2.4%
AMERICAN BAPTIST CHURCHES IN THE USA
1.9%
1.6%
3.8%
4.7%
SEVENTH DAY ADVENTIST CHURCH
1.0%
0.3%
5.2%
2.4%
EPISCOPAL CHURCH
0.7%
1.7%
2.3%
5.3%
REFORMED CHURCH IN AMERICA
0.1%
0.6%
0.9%
1.2%
PATRIAR PARISHE RUSSIAN ORTHODO CHURCH USA
0.0%
0.4%
0.0%
0.2%
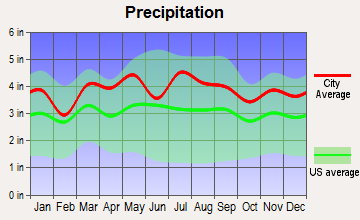
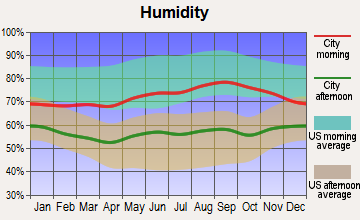
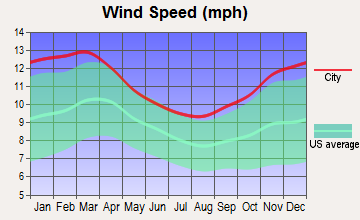
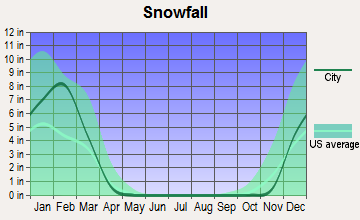
Weather
Brooklyn and Manhattan share the same weather patterns as they are geographically close. Expect cold, snowy winters, hot, humid summers, and mild spring and fall seasons. The weather does not usually vary significantly between the two boroughs. Coastal areas in both places can experience stronger winds and are more prone to flooding during heavy rains or storms.
Weather and climate
Type
Brooklyn
Manhattan
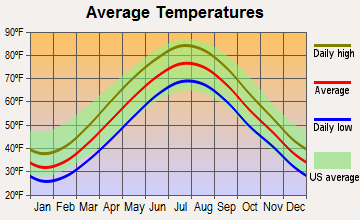
Temperature - Average
55.1°F
54.6°F
Humidity - Average morning or afternoon humidity
68.7%
67.4%
Humidity - Differences between morning and afternoon humidity
26.1%
30%
Humidity - Maximum monthly morning or afternoon humidity
76.8%
77%
Humidity - Minimum monthly morning or afternoon humidity
50.7%
47%
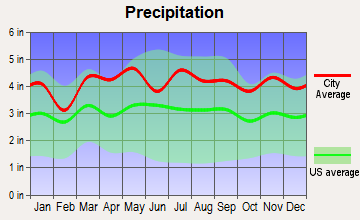
Precipitation - Yearly average
46.5 in
49.6 in
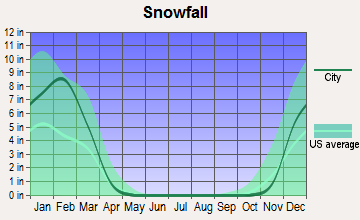
Snowfall - Yearly average
53.4 in
57.4 in
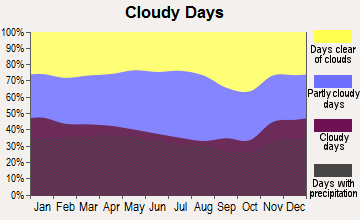
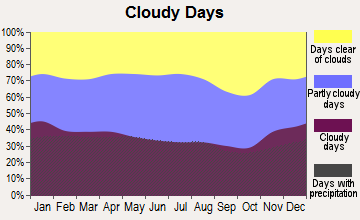
Clouds - Number of days clear of clouds
16.7%
17.8%
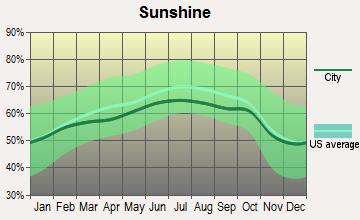
Sunshine amount - Average
60.2%
60.2%
Sunshine amount - Differences during a year
20%
20%
Sunshine amount - Maximum monthly
64%
64%
Sunshine amount - Minimum monthly
44%
44%
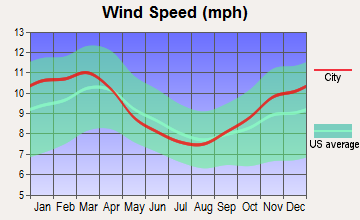
Wind speed - Average
10.6 mph
6.7 mph
Average climate in Brooklyn, New York
Average climate in Manhattan, New York
Air pollution
Type
AQI
CO
NO2
OZONE
PB
PM10
PM25
SO2
Year
Brooklyn
Manhattan
Brooklyn
Manhattan
Brooklyn
Manhattan
Brooklyn
Manhattan
Brooklyn
Manhattan
Brooklyn
Manhattan
Brooklyn
Manhattan
Brooklyn
Manhattan
2018
93
94
0.31
0.29
16.8
17.3
24.2
23.9
N/A
N/A
N/A
N/A
7.0
7.9
0.4
0.5
2017
95
97
0.25
0.16
17.0
17.4
24.5
24.0
N/A
N/A
N/A
N/A
7.1
7.7
0.3
0.4
2016
93
94
0.31
0.28
17.7
18.1
24.8
24.2
N/A
N/A
N/A
N/A
7.2
7.7
0.5
0.6
2015
100
100
0.38
0.36
18.2
18.9
24.1
23.0
N/A
N/A
N/A
N/A
8.0
8.6
0.7
1.0
2014
95
95
0.38
0.40
18.5
19.1
23.5
22.3
N/A
N/A
N/A
N/A
7.8
8.3
0.9
1.1
2013
96
97
0.41
0.43
18.9
19.5
24.4
22.6
N/A
N/A
N/A
N/A
8.5
9.0
1.0
1.1
2012
98
99
0.44
0.46
18.3
18.6
24.4
23.4
N/A
N/A
N/A
N/A
9.2
9.3
1.6
1.7
2011
107
108
0.43
0.46
20.7
20.7
23.6
22.2
N/A
N/A
N/A
N/A
10.3
10.9
2.4
2.7
2010
112
113
0.43
0.45
19.4
19.3
24.7
23.3
N/A
N/A
N/A
N/A
10.0
10.4
2.3
2.7
2009
104
104
0.43
0.51
21.5
21.9
20.7
18.8
N/A
N/A
N/A
N/A
10.2
10.7
3.1
3.8
2008
109
110
0.47
0.49
22.6
23.0
21.3
19.8
0.013
0.013
N/A
N/A
11.8
12.3
4.1
4.6
2007
121
121
0.53
0.56
23.5
24.4
20.8
19.4
0.016
0.016
N/A
N/A
12.4
13.1
4.8
5.5
2006
116
116
0.61
0.64
24.2
24.6
20.7
18.9
0.018
0.018
N/A
N/A
13.0
12.9
5.7
6.5
2005
107
112
0.74
0.77
26.1
26.7
19.6
18.4
N/A
N/A
N/A
N/A
N/A
N/A
7.5
8.2
2004
106
108
0.74
0.77
25.8
26.7
18.5
17.3
0.030
0.030
N/A
N/A
N/A
N/A
7.1
8.0
2003
107
107
0.81
0.83
27.4
27.8
18.4
17.5
0.021
0.024
26.9
26.9
N/A
N/A
7.4
8.2
2002
122
122
0.76
0.78
27.9
27.9
19.9
18.7
0.008
0.008
26.2
25.9
N/A
N/A
6.5
7.3
2001
121
123
0.80
0.79
29.5
29.4
22.3
19.4
0.020
0.020
27.3
25.0
N/A
N/A
7.8
8.7
2000
115
115
0.92
0.90
29.8
30.2
20.3
15.0
0.022
0.022
22.2
22.2
N/A
N/A
7.4
8.4
Natural disasters
Type
Brooklyn
Manhattan
Tornado activity compared to U.S. average
56.4%
59.1%
Earthquake activity compared to U.S. average
30.8%
31.1%
Natural disasters compared to U.S. average
17%
18%
Transportation
Manhattan and Brooklyn are well-served by public transit, including subways and buses, making it easy to commute without a car. The metro system connects the two boroughs 24/7. Commuting times will differ based on your exact locations in either borough, but Brooklyn residents generally have a longer commute if their work is in Manhattan.
Transport
Type
Brooklyn
Manhattan
Amtrak stations nearby
3
3
FAA registered aircraft
149
2
FAA registered aircraft manufacturers and dealers
2
0
Means of transportation to work
Type
Brooklyn
Manhattan
Bicycle
0.5%
0.9%
Bus
10.4%
10.1%
Carpooled
8%
3.4%
Car alone
22.4%
7.6%
Railroad
1.4%
1.1%
Streetcar
0.2%
0.1%
Subway
44.8%
43.6%
Taxicab
0.7%
4.7%
Walked
8.8%
21.9%
Average travel time to work
Type
Brooklyn
Manhattan
Average
44.5 min
30.3 min
Real Estate
Manhattan real estate is among the most expensive in the world. It offers a mix of luxury condos, lofts, and apartments. Brooklyn's real-estate scene is diverse, with options ranging from modern apartments to historical brownstones. Property costs are generally lower in Brooklyn, especially in neighborhoods further from Manhattan.
Neighborhoods
Manhattan's neighborhoods, such as Soho, Tribeca, and Upper East Side, are internationally renowned for their unique attractions. Brooklyn boasts eclectic neighborhoods like Williamsburg, known for its creative scene, or Park Slope, with its beautiful brownstones and family-friendly vibe. Both boroughs offer a mix of quiet residential areas and bustling cityscape.
Houses and residents
Type
Brooklyn
Manhattan
Houses
930,866
798,144
Average household size (people)
2.7
2
Houses occupied
880,727 (94.6%)
738,644 (92.5%)
Houses occupied by owners
238,290 (27.1%)
148,695 (20.1%)
Houses occupied by renters
642,437 (72.9%)
589,949 (79.9%)
Median rent asked for vacant for-rent units
$1,589
$1,690
Median price asked for vacant for-sale houses and condos
$1,621,117
$3,393,315
Estimated median house or condo value
$793,300
$940,900
Median number of rooms in apartments
3.6
3.2
Median number of rooms in houses and condos
5.2
4
Renting percentage
72.3%
77.2%
Housing density (houses/condos per square mile)
13,184
34,757
Household income disparities
48.5%
47.8%
Housing units without a mortgage
29,251 (32.9%)
1,104 (40.3%)
Housing units with both a second mortgage and home equity loan
183 (0.2%)
13 (0.5%)
Housing units with a mortgage
59,793 (67.1%)
1,636 (59.7%)
Housing units with a home equity loan
4,512 (5.1%)
140 (5.1%)
Housing units with a second mortgage
5,098 (5.7%)
140 (5.1%)
Housing units lacking complete kitchen facilities
1.5%
2%
Housing units lacking complete plumbing facilities
1.7%
1.7%
Housing units in structures
Housing units in structures
Brooklyn
Manhattan
One, detached
5.0%
0.3%
One, attached
8.7%
0.5%
Two
18.1%
0.6%
3 or 4
17.1%
2.1%
5 to 9
11.1%
6.3%
10 to 19
6.0%
12.6%
20 to 49
13.6%
24.5%
50 or more
20.3%
53.0%
Mobile homes
0.1%
0.0%
Median real estate property taxes paid for housing units
Self-employed workers in own not incorporated business
45,971
69,517
State government workers
27,527
15,544
Unpaid family workers
2,234
1,861
Industries and Occupations
Manhattan is famous for finance, advertising, and media industries. Meanwhile, Brooklyn has a more diverse economic structure, with thriving arts, entertainment, technology, and chef-led food businesses. In both boroughs, healthcare is a significant sector due to the high concentration of hospitals and healthcare facilities.
Health care services are abundant and high-quality in both boroughs. Manhattan has world-renowned hospitals like the New York-Presbyterian. Brooklyn also has excellent healthcare facilities such as the Brooklyn Hospital Center and Maimonides Medical Center.
Health (county statistics)
Type
Brooklyn
Manhattan
General health status score of residents in this county from 1 (poor) to 5 (excellent)
Manhattan's infrastructure includes a plethora of high-rise buildings and landmarks like Times Square, Central Park, and Broadway. Brooklyn's architecture is more varied and includes brownstones, modern high-rises, and industrial buildings. Infrastructure development continues in both boroughs to accommodate their growing populations.
Infrastructure
Type
Brooklyn
Manhattan
TV stations
29
30
Culture and Food
Both boroughs are rich in culture and renowned for their food scenes. Manhattan is famous for its diverse culinary offerings, high-end dining, and cultural institutions like the Metropolitan Museum of Art. Brooklyn, meanwhile, is well-known for its trendy food scene, craft breweries, and cultural festivals.
Sports Teams
As part of NYC, both boroughs share the city's sports teams. Manhattan houses the iconic Madison Square Garden, home to the Knicks(NBA) and Rangers(NHL). Brooklyn is home to the Barclays Center, hosting the Brooklyn Nets(NBA) and the New York Islanders(NHL).
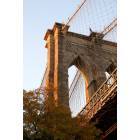

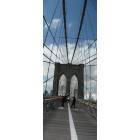

 Brooklyn, NY
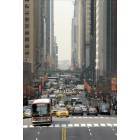
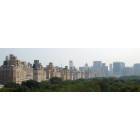
 Manhattan, NY