Both Brooklyn and Queens, vibrant boroughs in New York City, offer unique lifestyles, job opportunities, educations, and cultural experiences. Although they share similarities due to their location in the same metropolitan area, there are definite contrasts between these districts. These contrasts span across crime and safety aspects, cost of living, educational opportunities, economic conditions, infrastructure, industries, employers, real estate markets, neighborhood vibes, transportation systems, taxes, food and culture, sports teams, geographical conditions, and health care facilities. This comprehensive comparison lays out the specifics of each borough, allowing potential residents or visitors to make an informed decision.
Safety is a key concern for both residents and visitors. Both Brooklyn and Queens have areas known for higher crime rates, but also neighborhoods reputed for their safety. In overall crime stats, Queens fares slightly better. However, safety varies greatly from neighborhood to neighborhood in both boroughs.
Cost of Living
Living in Brooklyn is typically considered more expensive than in Queens, with higher housing costs being a significant factor. However, daily expenses like food, health, transportation, and personal care are relatively similar in both boroughs.
Income Tax
Income tax rates also remain consistent across both boroughs as they are part of New York City.
Property Tax
Property taxes do vary between the boroughs. Brooklyn homeowners, because of higher property values, often end up paying more in property taxes compared to those in Queens.
Sales Tax
Both boroughs have the same sales tax rate, under New York City's unified system.
Income
Type
Brooklyn
Queens
Estimated median household income
$67,567
$73,262
Estimated per capita income
$39,536
$34,969
Cost of living index (U.S. average is 100)
185.4
173.2
If you make $50,000 in Queens, you will have to make $53,522 in Brooklyn to maintain the same standard of living.
Geographical Conditions
Brooklyn, being closer to the ocean, has more beaches while Queens, being larger, has more parkland and natural areas.
Geographical information
Type
Brooklyn
Queens
Land area
70.6 sq. miles
109.2 sq. miles
Population density
35,956 people per sq. mile
20,847 people per sq. mile
Relative area comparison
Brooklyn, NY Queens, NY
Education
Brooklyn and Queens offer a wide range of public, charter, and private schools. There is also a variety of higher education institutions, albeit Brooklyn edges Queens out slightly with more universities and colleges.
Both boroughs have diverse economies with job opportunities in fields like healthcare, education, government, and retail. That said, Brooklyn tends to have more tech and startup jobs, while Queens offers more manufacturing positions.
Biggest Employers
The largest employers in Brooklyn are mostly in the healthcare sector, including NYC Health + Hospitals and Maimonides Medical Center. In Queens, JFK International Airport, the Resorts World Casino, and healthcare systems are the significant employers.
In Brooklyn (Kings County), 82.1% voted for Democrats and 16.9% for Republicans in 2012 Presidential Election. In Queens (Queens County), 79.2% voted for Democrats and 20.0% for Republicans.
Elections
Type
Democrats
Republicans
Other
Year
Brooklyn
Queens
Brooklyn
Queens
Brooklyn
Queens
2020
76.9%
72.3%
22.2%
27.0%
1.0%
0.7%
2016
79.6%
75.4%
17.5%
21.8%
2.9%
2.8%
2012
82.1%
79.2%
16.9%
20.0%
0.9%
0.8%
2008
79.9%
75.4%
20.1%
24.3%
0.0%
0.3%
2004
75.0%
71.8%
24.3%
27.5%
0.7%
0.8%
2000
81.0%
75.2%
15.7%
22.0%
3.3%
2.8%
1996
80.1%
72.9%
15.1%
21.1%
4.9%
6.0%
Breakdown of population affiliated with a religious congregation
Type
Adherents
Congregations
Religion
Brooklyn
Queens
Brooklyn
Queens
CATHOLIC CHURCH
24.9%
30.4%
7.5%
7.7%
MUSLIM ESTIMATE
3.8%
3.7%
4.2%
4.4%
AMERICAN BAPTIST CHURCHES IN THE USA
1.9%
0.5%
3.8%
2.5%
SEVENTH DAY ADVENTIST CHURCH
1.0%
0.6%
5.2%
3.4%
EPISCOPAL CHURCH
0.7%
0.4%
2.3%
2.1%
EVANGELICAL LUTHERAN CHURCH IN AMERICA
0.2%
0.3%
2.0%
2.6%
Weather
As they are geographically close, Brooklyn and Queens share a similar climate: a humid subtropical climate with hot summers and cold winters. The weather could be slightly harsher on the coast in areas of both boroughs.
Weather and climate
Type
Brooklyn
Queens
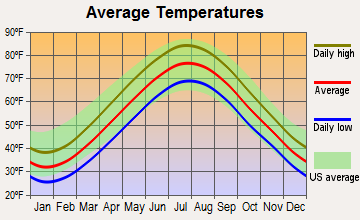
Temperature - Average
55.1°F
54.6°F
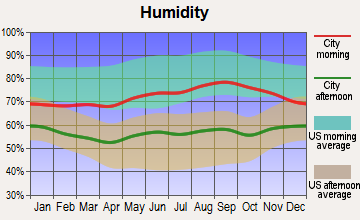
Humidity - Average morning or afternoon humidity
68.7%
68.5%
Humidity - Differences between morning and afternoon humidity
26.1%
25.1%
Humidity - Maximum monthly morning or afternoon humidity
76.8%
76.3%
Humidity - Minimum monthly morning or afternoon humidity
50.7%
51.1%
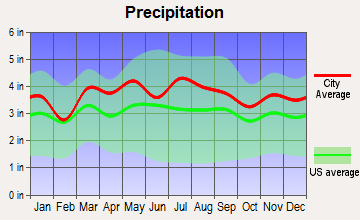
Precipitation - Yearly average
46.5 in
44.5 in
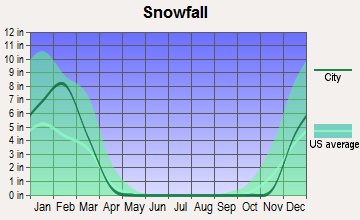
Snowfall - Yearly average
53.4 in
52.7 in
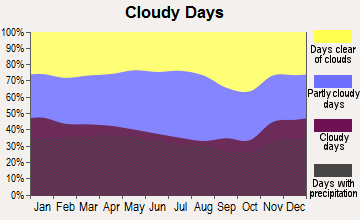
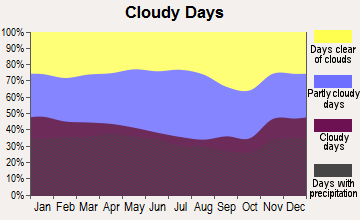
Clouds - Number of days clear of clouds
16.7%
16.3%
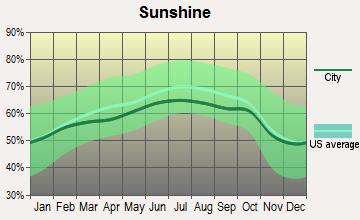
Sunshine amount - Average
60.2%
60.2%
Sunshine amount - Differences during a year
20%
20%
Sunshine amount - Maximum monthly
64%
64%
Sunshine amount - Minimum monthly
44%
44%
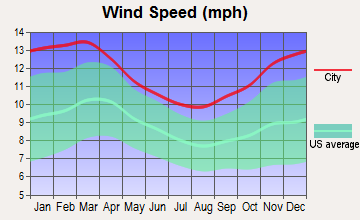
Wind speed - Average
10.6 mph
11.6 mph
Average climate in Brooklyn, New York
Average climate in Queens, New York
Air pollution
Type
AQI
CO
NO2
OZONE
PB
PM10
PM25
SO2
Year
Brooklyn
Queens
Brooklyn
Queens
Brooklyn
Queens
Brooklyn
Queens
Brooklyn
Queens
Brooklyn
Queens
Brooklyn
Queens
Brooklyn
Queens
2018
93
97
0.31
0.26
16.8
14.7
24.2
25.4
N/A
N/A
N/A
N/A
7.0
6.4
0.4
0.4
2017
95
98
0.25
0.23
17.0
15.4
24.5
25.8
N/A
N/A
N/A
N/A
7.1
6.4
0.3
0.5
2016
93
97
0.31
0.24
17.7
16.0
24.8
25.5
N/A
N/A
N/A
N/A
7.2
6.7
0.5
0.6
2015
100
104
0.38
0.26
18.2
17.4
24.1
24.1
N/A
N/A
N/A
N/A
8.0
7.9
0.7
0.8
2014
95
99
0.38
0.25
18.5
17.0
23.5
24.3
N/A
N/A
N/A
N/A
7.8
7.8
0.9
1.1
2013
96
101
0.41
0.23
18.9
17.7
24.4
25.8
N/A
N/A
N/A
N/A
8.5
8.7
1.0
1.2
2012
98
105
0.44
0.26
18.3
17.6
24.4
25.8
N/A
N/A
N/A
N/A
9.2
9.1
1.6
1.8
2011
107
112
0.43
0.27
20.7
20.4
23.6
24.2
N/A
N/A
N/A
N/A
10.3
10.6
2.4
2.7
2010
112
112
0.43
0.35
19.4
19.4
24.7
23.6
N/A
N/A
N/A
N/A
10.0
10.3
2.3
2.9
2009
104
107
0.43
0.24
21.5
21.0
20.7
21.0
N/A
N/A
N/A
N/A
10.2
9.7
3.1
3.4
2008
109
113
0.47
0.44
22.6
22.6
21.3
22.0
0.013
0.013
N/A
N/A
11.8
11.0
4.1
4.1
2007
121
121
0.53
0.46
23.5
22.9
20.8
20.2
0.016
0.016
N/A
N/A
12.4
11.6
4.8
4.9
2006
116
120
0.61
0.46
24.2
23.5
20.7
20.3
0.018
0.018
N/A
N/A
13.0
12.7
5.7
5.3
2005
107
110
0.74
0.54
26.1
25.5
19.6
19.7
N/A
N/A
N/A
N/A
N/A
N/A
7.5
6.7
2004
106
107
0.74
0.55
25.8
25.1
18.5
18.2
0.030
0.030
N/A
N/A
N/A
N/A
7.1
5.8
2003
107
110
0.81
0.63
27.4
26.9
18.4
18.9
0.021
0.022
26.9
26.9
N/A
N/A
7.4
7.0
2002
122
124
0.76
0.58
27.9
27.9
19.9
19.2
0.008
0.008
26.2
25.7
N/A
N/A
6.5
6.5
2001
121
124
0.80
0.60
29.5
28.8
22.3
19.3
0.020
0.020
27.3
24.5
N/A
N/A
7.8
7.8
2000
115
115
0.92
0.67
29.8
28.4
20.3
17.6
0.022
0.022
22.2
22.2
N/A
N/A
7.4
7.3
Natural disasters
Type
Brooklyn
Queens
Tornado activity compared to U.S. average
56.4%
54%
Earthquake activity compared to U.S. average
30.8%
30.6%
Natural disasters compared to U.S. average
17%
19%
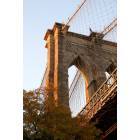
Transportation
Both boroughs have extensive public transportation systems with subway lines, bus routes, and bike lanes. However, Brooklyn has more subway lines, and it is easier to commute to Manhattan from Brooklyn.
Transport
Type
Brooklyn
Queens
Amtrak stations
0
2
Amtrak stations nearby
3
3
FAA registered aircraft
149
4
FAA registered aircraft manufacturers and dealers
2
0
Means of transportation to work
Type
Brooklyn
Queens
Bicycle
0.5%
0.3%
Bus
10.4%
10%
Carpooled
8%
10.2%
Car alone
22.4%
34.3%
Railroad
1.4%
2.2%
Streetcar
0.2%
0.2%
Subway
44.8%
34.3%
Taxicab
0.7%
0.7%
Walked
8.8%
5.7%
Average travel time to work
Type
Brooklyn
Queens
Average
44.5 min
44 min
Real Estate
Real estate is generally more expensive in Brooklyn, with greater prices for both buying and renting. Queens offers a more affordable option for those looking for more space at a lower cost.
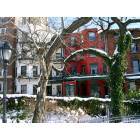
Neighborhoods
Brooklyn offers hip, artistic neighborhoods like Williamsburg, Park Slope, and DUMBO, whereas Queens showcases diverse, family-friendly areas like Jackson Heights, Flushing, and Astoria.
Houses and residents
Type
Brooklyn
Queens
Houses
930,866
817,250
Average household size (people)
2.7
2.8
Houses occupied
880,727 (94.6%)
782,664 (95.8%)
Houses occupied by owners
238,290 (27.1%)
334,894 (42.8%)
Houses occupied by renters
642,437 (72.9%)
447,770 (57.2%)
Median rent asked for vacant for-rent units
$1,589
$1,666
Median price asked for vacant for-sale houses and condos
$1,621,117
$615,765
Estimated median house or condo value
$793,300
$642,000
Median number of rooms in apartments
3.6
3.7
Median number of rooms in houses and condos
5.2
5.4
Renting percentage
72.3%
57%
Housing density (houses/condos per square mile)
13,184
7,481.6
Household income disparities
48.5%
44.9%
Housing units without a mortgage
29,251 (32.9%)
64,617 (34.6%)
Housing units with both a second mortgage and home equity loan
183 (0.2%)
311 (0.2%)
Housing units with a mortgage
59,793 (67.1%)
122,366 (65.4%)
Housing units with a home equity loan
4,512 (5.1%)
9,927 (5.3%)
Housing units with a second mortgage
5,098 (5.7%)
10,707 (5.7%)
Housing units lacking complete kitchen facilities
1.5%
1%
Housing units lacking complete plumbing facilities
1.7%
1.1%
Housing units in structures
Housing units in structures
Brooklyn
Queens
One, detached
5.0%
21.1%
One, attached
8.7%
9.8%
Two
18.1%
19.2%
3 or 4
17.1%
10.5%
5 to 9
11.1%
5.6%
10 to 19
6.0%
3.4%
20 to 49
13.6%
9.4%
50 or more
20.3%
20.9%
Mobile homes
0.1%
0.1%
Median real estate property taxes paid for housing units
Self-employed workers in own not incorporated business
45,971
48,383
State government workers
27,527
21,536
Unpaid family workers
2,234
2,382
Industries and Occupations
Significant industries in Brooklyn include tech, finance, healthcare, and arts and entertainment, while in Queens, aviation, film and television, healthcare, and manufacturing dominate.
Both boroughs offer extensive healthcare services and are home to reputable hospitals. However, Brooklyn, being more densely populated, offers more healthcare facilities.
Health (county statistics)
Type
Brooklyn
Queens
General health status score of residents in this county from 1 (poor) to 5 (excellent)
Brooklyn has slightly more developed infrastructure with more high-rise buildings, co-working spaces, and creative hubs. Queens, however, boasts exceptional parklands and green spaces.
Infrastructure
Type
Brooklyn
Queens
Hospitals
104
1
TV stations
29
30
Schools
School facilities
Type
Brooklyn
Queens
Private elementary/middle schools
151
8
Private high schools
128
1
Public elementary/middle schools
405
6
Public high schools
176
2
Colleges/Universities
48
1
Culture and Food
Brooklyn is widely recognized for its thriving arts scene, hipster vibe, and street art. In terms of food, it's a haven for foodies with diverse culinary offerings. Queens, on the other hand, is known for its extraordinary diversity, offering a global culinary journey.
Sports Teams
As for sports, the Brooklyn Nets (NBA) and the New York Islanders (NHL) call Brooklyn home. Queens is the home of the New York Mets (MLB) and the USTA Billie Jean King National Tennis Center, where the US Open is held.


 Brooklyn, NY
 Queens, NY