


Relative area comparison
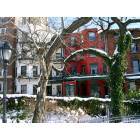
 Brooklyn, NY
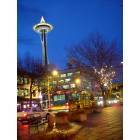
 Seattle, WA
Brooklyn, a borough of New York City, and Seattle, positioned on the west coast, offer contrasting sets of lifestyle experiences. These differences stem from their diverse climate, cost of living, education systems and job markets, among other aspects. While Brooklyn might entice individuals with its vibrant culture and fast-paced lifestyle, Seattle could attract those who prefer a balance between urbanity and nature.
 Brooklyn, NY and
Seattle, WA : 2,406.2 miles
Brooklyn, NY and
Seattle, WA : 2,406.2 miles
Brooklyn's population is larger by 246%. The population of Seattle has grown by 170,545 people (30.3%) during that time.
| Population | ||
| Type | Brooklyn | Seattle |
|---|---|---|
| Population | 2,538,705 | 733,919 |
| Female / male percentage | 53.1% / 46.9%
|
49.4% / 50.6%
|
Brooklyn has seen significant improvements in terms of crime rates over the last few decades, however, some neighborhoods might still have higher crime rates compared to others. In contrast, Seattle, while generally safe, experiences periodic incidents of property crime. Both cities offer active police presence and community initiatives for enhanced safety. It's advisable to research specific neighborhoods before making any relocations or visiting.
While both cities have a higher cost of living compared to the national average, Brooklyn is often considerably more expensive, particularly in terms of housing. Food, transportation, and entertainment costs can also be high. Seattle, though cheaper, still holds a reputation for high living expenses, with housing and taxes being substantial expenditures.
New York state has a progressive income tax system, impacting Brooklyn residents significantly and ranks among the highest in the country. Seattle, and Washington state as a whole, does not levy an income tax.
Brooklyn, as part of New York City, has relatively low property taxes in percentage terms, but can still be high due to real estate values. In contrast, Seattle has higher property tax rates that can lead to significant yearly expenses.
While New York has a state sales tax of 4%, Brooklyn residents pay an additional 4.875% for a total of 8.875%. Seattle has a sales tax of 10.1%, which is significantly higher than the national average.
| Income | ||
| Type | Brooklyn | Seattle |
|---|---|---|
| Estimated median household income | $67,567 | $110,781 |
| Estimated per capita income | $39,536 | $74,733 |
| Cost of living index (U.S. average is 100) | 185.4 | 118.5 |
If you make $50,000 in Seattle, you will have to make $78,228 in Brooklyn to maintain the same standard of living.
Brooklyn, situated on the westernmost point of Long Island, offers stunning views of Manhattan across the East River. Seattle is nestled between the Puget Sound and Lake Washington, with the picturesque backdrop of the Cascade and Olympic Mountains.
| Geographical information | ||
| Type | Brooklyn | Seattle |
|---|---|---|
| Land area | 70.6 sq. miles | 83.9 sq. miles |
| Population density | 35,956 people per sq. mile | 8,750.4 people per sq. mile |
Brooklyn, NY
Seattle, WA
Both Brooklyn and Seattle boast strong educational systems. Brooklyn, integrated into the New York City public school system, provides a multitude of options for K-12 and higher education, including reputed universities like Brooklyn College. Seattle, with its quality school district and higher learning institutions like the University of Washington, emphasizes education and research.
| Education level (25-year-olds and older) | ||
| Type | Brooklyn | Seattle |
|---|---|---|
| Bachelor's degree or higher | 21.8% | 68.3% |
| Graduate or professional degree | 8.8% | 30.5% |
| High school or higher | 68.8% | 95.9% |
Brooklyn’s economy is diverse, with a surge in tech startups, along with robust retail, health care, and entertainment sectors. Seattle boasts a strong job market driven by the tech industry, thanks to companies like Microsoft and Amazon. It's also a hub for healthcare, manufacturing and retail industries.
In Brooklyn, some of the main employers are JPMorgan Chase, New York City Department of Education and Maimonides Medical Center. Seattle houses headquarters of Microsoft and Amazon, which employ a significant part of its workforce.
In Brooklyn (Kings County), 82.1% voted for Democrats and 16.9% for Republicans in 2012 Presidential Election. In Seattle (King County), 69.0% voted for Democrats and 28.5% for Republicans.
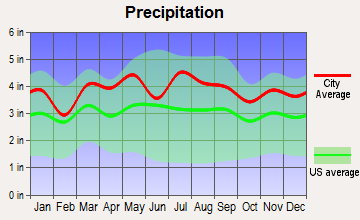
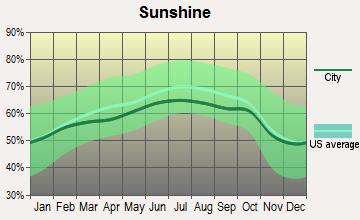
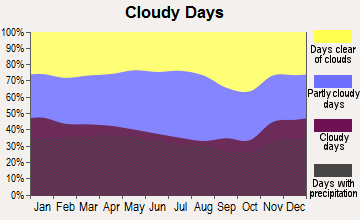
Climate in Brooklyn is characterized by hot, humid summers and chilly winters, sometimes experiencing significant snowfall. Seattle is renowned for its temperate weather, with mild, wet winters and warm, dry summers. Its infamous rainy climate isn't as extreme as many believe, as the city often has overcast weather and drizzles instead of heavy rain showers.
| Weather and climate | ||
| Type | Brooklyn | Seattle |
|---|---|---|
| Temperature - Average | 55.1°F | 52.5°F |
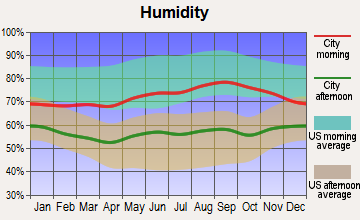
| Humidity - Average morning or afternoon humidity | 68.7% | 78.5% |
| Humidity - Differences between morning and afternoon humidity | 26.1% | 38% |
| Humidity - Maximum monthly morning or afternoon humidity | 76.8% | 86% |
| Humidity - Minimum monthly morning or afternoon humidity | 50.7% | 48% |
| Precipitation - Yearly average | 46.5 in | 36.6 in |
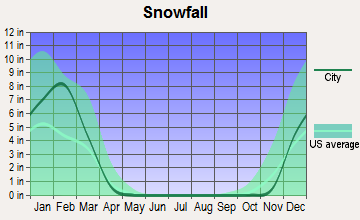
| Snowfall - Yearly average | 53.4 in | 21.4 in |
| Clouds - Number of days clear of clouds | 16.7% | 11.6% |
| Sunshine amount - Average | 60.2% | 49.4% |
| Sunshine amount - Differences during a year | 20% | 44% |
| Sunshine amount - Maximum monthly | 64% | 64% |
| Sunshine amount - Minimum monthly | 44% | 20% |
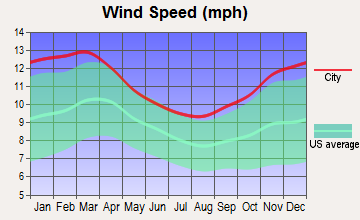
| Wind speed - Average | 10.6 mph | 8.6 mph |
| Natural disasters | ||
| Type | Brooklyn | Seattle |
|---|---|---|
| Tornado activity compared to U.S. average | 56.4% | 5.5% |
| Earthquake activity compared to U.S. average | 30.8% | 1,394.2% |
| Natural disasters compared to U.S. average | 17% | 30% |
Brooklyn has an excellent public transportation system with subways, buses, and even ferries, meaning car ownership isn't a necessity. Seattle's public transit primarily consists of buses, light rail, trains, and ferries, with many people also commuting by bike or on foot.
| Transport | ||
| Type | Brooklyn | Seattle |
|---|---|---|
| Amtrak stations | 0 | 1 |
| Amtrak stations nearby | 3 | 2 |
| FAA registered aircraft | 149 | 1 |
| FAA registered aircraft manufacturers and dealers | 2 | 2 |
| Means of transportation to work | ||
| Type | Brooklyn | Seattle |
|---|---|---|
| Bicycle | 0.5% | 2.1% |
| Bus | 10.4% | 8.9% |
| Carpooled | 8% | 8.7% |
| Car alone | 22.4% | 67.8% |
| Ferryboat | 0% | 0.7% |
| Motorcycle | 0% | 0.3% |
| Railroad | 1.4% | 1.2% |
| Streetcar | 0.2% | 0.3% |
| Subway | 44.8% | 0.6% |
| Taxicab | 0.7% | 0.1% |
| Walked | 8.8% | 8% |
| Average travel time to work | ||
| Type | Brooklyn | Seattle |
|---|---|---|
| Average | 44.5 min | 35 min |
Brooklyn's real estate market is diverse as it is dynamic, with a mix of historic brownstones, modern condos, and high-rises. Prices tend to be high due to demand. Seattle's real estate, though cheaper than Brooklyn, still has a premium due to high demand and limited space, especially in popular neighborhoods.
Brooklyn is famed for its diverse neighborhoods such as Williamsburg, Park Slope, and DUMBO, each with unique cultural flavors and amenities. Seattle's neighborhoods like Capitol Hill, Fremont, and Ballard offer different personalities - from hip urban zones to serene residential areas.
| Houses and residents | ||
| Type | Brooklyn | Seattle |
|---|---|---|
| Houses | 930,866 | 384,799 |
| Average household size (people) | 2.7 | 2.1 |
| Houses occupied | 880,727 (94.6%) | 351,650 (91.4%) |
| Houses occupied by owners | 238,290 (27.1%) | 161,587 (46%) |
| Houses occupied by renters | 642,437 (72.9%) | 190,063 (54%) |
| Median rent asked for vacant for-rent units | $1,589 | $2,780 |
| Median price asked for vacant for-sale houses and condos | $1,621,117 | $860,506 |
| Estimated median house or condo value | $793,300 | $848,100 |
| Median number of rooms in apartments | 3.6 | 3 |
| Median number of rooms in houses and condos | 5.2 | 6.3 |
| Renting percentage | 72.3% | 51.9% |
| Housing density (houses/condos per square mile) | 13,184 | 4,587.9 |
| Household income disparities | 48.5% | 42.2% |
| Housing units without a mortgage | 29,251 (32.9%) | 2,459 (2.1%) |
| Housing units with both a second mortgage and home equity loan | 183 (0.2%) | 12,354 (10.5%) |
| Housing units with a mortgage | 59,793 (67.1%) | 115,481 (97.9%) |
| Housing units with a home equity loan | 4,512 (5.1%) | 240 (0.2%) |
| Housing units with a second mortgage | 5,098 (5.7%) | 13,881 (11.8%) |
| Housing units lacking complete kitchen facilities | 1.5% | 2.2% |
| Housing units lacking complete plumbing facilities | 1.7% | 0.4% |
While Brooklyn thrives in financial services, healthcare, education, and a growing tech scene, Seattle is dominated by technology, healthcare, and manufacturing, with a significant presence of Boeing and bio-tech firms, alongside expanding startups.
Brooklyn hosts several renowned healthcare facilities such as New York-Presbyterian Brooklyn Methodist Hospital. Seattle is marked by worldwide recognized healthcare institutions like Swedish Medical Center and the University of Washington Medical Center.
| Health (county statistics) | ||
| Type | Brooklyn | Seattle |
|---|---|---|
| General health status score of residents in this county from 1 (poor) to 5 (excellent) | 3.4 | 3.7 |
| Average weight of females (lbs) | 161.8 lbs | 160.3 lbs |
| Average weight of males (lbs) | 185.6 lbs | 191.3 lbs |
| Residents visited a dentist within the past year | 67.1% | 77.9% |
| Residents exercised in the past month | 69.9% | 84.1% |
| Residents keep firearms around their homes | 4% | 21.2% |
| Adult residents drank alcohol in the past 30 days | 71.7% | 81.8% |
| Residents smoked 100+ cigarettes in their lives | 39.2% | 41.7% |
Brooklyn presents a dense urban environment, with extensive public transportation networks and historic buildings mixed with modern architecture. Seattle combines urban cityscapes with natural beauty, hosting modern infrastructures alongside parks and bodies of water. Its public transportation, although less extensive than Brooklyn, is efficient and keeps improving.
| Infrastructure | ||
| Type | Brooklyn | Seattle |
|---|---|---|
| Hospitals | 104 | 22 |
| TV stations | 29 | 17 |
| Bank branches located here | 271 | 236 |
| Bank institutions located here | 41 | 37 |
| Main business address for public companies | 9 | 54 |
| Drinking water stations with no reported violations in the past | 12 | 3 |
| Drinking water stations with reported violations in the past | 75 | 20 |
Brooklyn is known for its rich cultural diversity, leading to a vibrant arts scene and myriad of international cuisine. Seattle, while not as diverse, still boasts a strong culture showcasing music, arts, and food, especially its renowned seafood scene.
Brooklyn is home to the NBA's Brooklyn Nets and the NHL's New York Islanders. Seattle has a loyal fan base not just for its NFL's Seahawks and MLB's Mariners, but the newly added NHL team, the Seattle Kraken.