Seattle, Washington
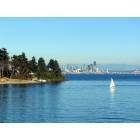
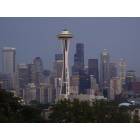
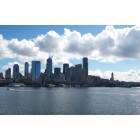
Seattle: Seattle, from Bainbridge Island

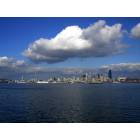
Seattle: Downtown Seattle from Gas Works Park on Lake Union
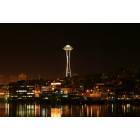
Seattle: Seattle Space Needle from Lake Union
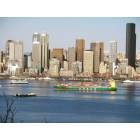
Seattle: Downtown taken from West Seattle
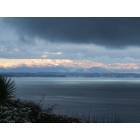
Seattle: The Olympics from Seattle's North Beach area
Seattle: PIC FROM QUEEN ANNE
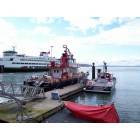
Seattle: waterfront
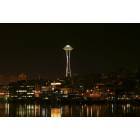
Seattle: Reflection of the Space Needle in lake Union
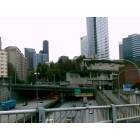
Seattle: Freeway and downtown Seattle
Seattle: Seattle Washington
Seattle: seattle from elliot bay
- see
257
more - add
your
Submit your own pictures of this city and show them to the world
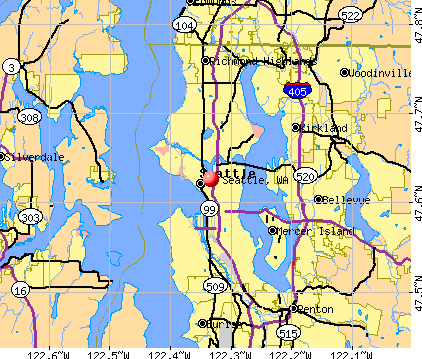
- OSM Map
- General Map
- Google Map
- MSN Map
Population change since 2000: +33.0%
 |
| Males: 380,890 | |
| Females: 368,366 |
| Median resident age: | 35.9 years |
| Washington median age: | 38.4 years |
Zip codes: 98101, 98102, 98103, 98104, 98105, 98106, 98107, 98109, 98112, 98115, 98116, 98117, 98118, 98119, 98121, 98122, 98125, 98126, 98133, 98134, 98136, 98144, 98154, 98164, 98174, 98177, 98195, 98199.
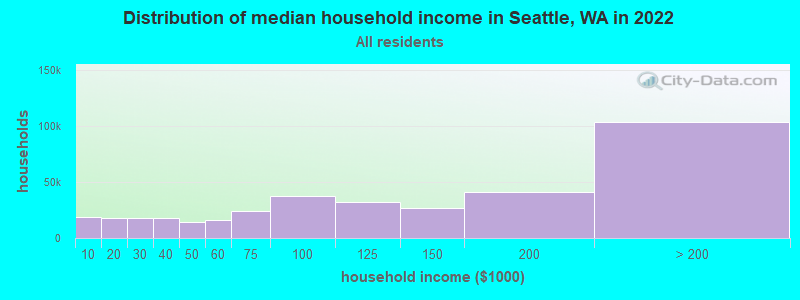
Seattle Zip Code Map| Seattle: | $115,409 |
| WA: | $91,306 |
Estimated per capita income in 2022: $82,716 (it was $30,306 in 2000)
Seattle city income, earnings, and wages data
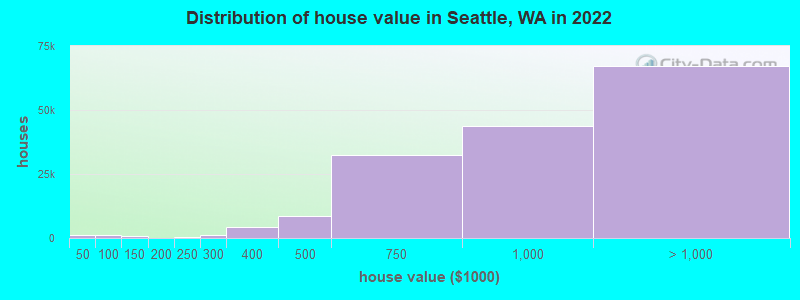
Estimated median house or condo value in 2022: $924,200 (it was $252,100 in 2000)
| Seattle: | $924,200 |
| WA: | $569,500 |
Mean prices in 2022: all housing units: over $1,000,000; detached houses: over $1,000,000; townhouses or other attached units: $827,273; in 2-unit structures: $675,439; in 3-to-4-unit structures: over $1,000,000; in 5-or-more-unit structures: $626,747; mobile homes: $218,940; occupied boats, rvs, vans, etc.: $467,608
Median gross rent in 2022: $1,877.
(7.6% for White Non-Hispanic residents, 22.2% for Black residents, 18.1% for Hispanic or Latino residents, 21.6% for American Indian residents, 5.2% for Native Hawaiian and other Pacific Islander residents, 16.2% for other race residents, 9.9% for two or more races residents)
Detailed information about poverty and poor residents in Seattle, WA


- 444,86459.4%White alone
- 135,25818.1%Asian alone
- 63,0338.4%Hispanic
- 52,8237.0%Two or more races
- 43,6705.8%Black alone
- 5,9940.8%Other race alone
- 2,1300.3%American Indian alone
- 1,4950.2%Native Hawaiian and Other
Pacific Islander alone
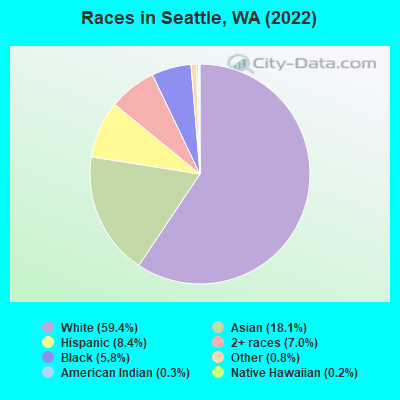
Races in Seattle detailed stats: ancestries, foreign born residents, place of birth
According to our research of Washington and other state lists, there were 480 registered sex offenders living in Seattle, Washington as of April 27, 2024.
The ratio of all residents to sex offenders in Seattle is 1,467 to 1.
The ratio of registered sex offenders to all residents in this city is lower than the state average.
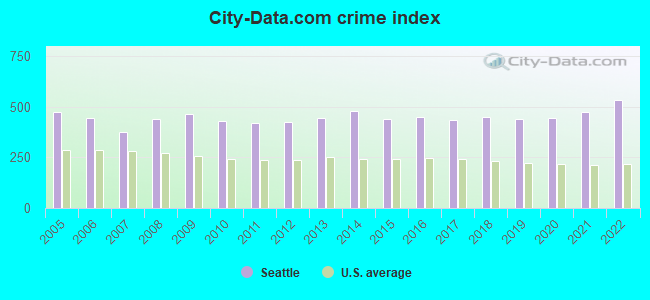
The City-Data.com crime index weighs serious crimes and violent crimes more heavily. Higher means more crime, U.S. average is 246.1. It adjusts for the number of visitors and daily workers commuting into cities.
- means the value is smaller than the state average.- means the value is about the same as the state average.
- means the value is bigger than the state average.
- means the value is much bigger than the state average.
Crime rate in Seattle detailed stats: murders, rapes, robberies, assaults, burglaries, thefts, arson
Full-time law enforcement employees in 2021, including police officers: 1,597 (1,178 officers - 999 male; 179 female).
| Officers per 1,000 residents here: | 1.50 |
| Washington average: | 1.35 |
 Recent articles from our blog. Our writers, many of them Ph.D. graduates or candidates, create easy-to-read articles on a wide variety of topics.


Latest news from Seattle, WA collected exclusively by city-data.com from local newspapers, TV, and radio stations
Ancestries: European (6.3%), German (5.3%), English (5.0%), Irish (4.2%), American (3.0%), Ethiopian (2.3%).
Current Local Time: PST time zone
Incorporated in 1865
Elevation: 350 feet
Land area: 83.9 square miles.
Population density: 8,933 people per square mile (high).
152,822 residents are foreign born (11.3% Asia, 2.6% Europe, 2.5% Latin America, 2.1% Africa).
| This city: | 20.7% |
| Washington: | 14.9% |
Median real estate property taxes paid for housing units with mortgages in 2022: $6,760 (0.7%)
Median real estate property taxes paid for housing units with no mortgage in 2022: $7,059 (0.8%)
Nearest city with pop. 1,000,000+: Los Angeles, CA  (958.8 miles , pop. 3,694,820).
Nearest cities:
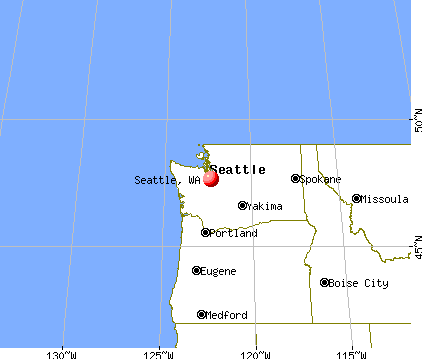
), ), ), )Latitude: 47.63 N, Longitude: 122.33 W
Daytime population change due to commuting: +140,200 (+18.7%)
Workers who live and work in this city: 375,844 (81.9%)
Area code: 206
Property values in Seattle, WA
Detailed articles:
- Seattle: Introduction
- Seattle Basic Facts
- Seattle: Communications
- Seattle: Convention Facilities
- Seattle: Economy
- Seattle: Education and Research
- Seattle: Geography and Climate
- Seattle: Health Care
- Seattle: History
- Seattle: Municipal Government
- Seattle: Population Profile
- Seattle: Recreation
- Seattle: Transportation
Seattle tourist attractions:
- Museum of Flight - Seattle, Washington - An Interactive Air and Space Experience
- Northgate Mall - Seattle, Washington - Shopping Center Located Just North of Downtown Seattle
- Crescent Lake, Olympic National Park - Seattle, Washington - Large and Beautiful Lake with Name to Match its Shape
- Jimi Hendrix Grave, Seattle, Washington: His Birthplace and Final Resting Place
- Key Arena Seattle, Washington
- Six Flags - Seattle, Washington - Wild Waves Amusement Park Previously Owned by Six Flags
- Capitol Hill Neighborhood - Seattle, Washington - Seattle's Alternative Neighborhood and Popular Retail Destination
- Seattle Center Monorail - Seattle, Washington - Convenient and Reasonably Priced Modern Train Travel in the City
- Belltown Neighborhood - Seattle, Washington - Transformed District on the City's Downtown Waterfront
- University Village Mall - Seattle, Washington - Family-Friendly Outdoor Mall with Convenience and Fun
- Waterfall Garden Park - Seattle, Washington - Shady Park with Waterfall to Curb the Noise of the City
- Pacific Place Mall - Seattle, Washington - Seattle's Upscale Shopping Mall Experience with Plenty to Eat
- Wing Luke Asian Museum - Seattle, Washington - Museum Dedicated to the Asian Pacific American Culture
- Theo Chocolate - Seattle, Washington - Chocolate Factory in the heart of the Emerald City
- Original Starbucks - Seattle, Washington - The Birthplace of the Original Starbucks Coffee Shop
- Grand Hyatt - Seattle, Washington - Modern Luxury Hotel with Inspiring Views of the City
- University District - Seattle, Washington - The Most Diverse and Locally Loved Neighborhood in Seattle
- Chinatown International District - Seattle, Washington - A Diverse Neighborhood with the Best Asian Market in the City
- Bank of America Tower - Seattle, Washington - Columbia Center Offers Amazing Observation Deck and Architecture
- Gas Works Park - Seattle, Washington - Industrial Archeology and Design in the form of a Park like Setting
- Ummelina Day Spa - Seattle, Washington - A Unique Journey into Pampering Paradise and Masterful Massage Therapy
- Washington State Convention and Trade Center - Seattle, Washington Seattle's Convention Center in Prime Location
- Smith Tower - Seattle, Washington - The Oldest Skyscraper in the City and Designated Landmark
- The Children's Museum - Seattle, Washington - Kid Pleasing Entertainment with a Wealth of Education
- Snoqualmie Summit Ski Area - Seattle, Washington - Northwest Tradition of Skiing, Snowboarding, and Outdoor Winter Fun
- Museum of History and Industry - Seattle, Washington - Displaying the History of Seattle since the 1800s
- Hotel Monaco - Seattle, Washington - Colorful Boutique Hotel in the Heart of the Emerald City
- Discovery Park - Seattle, Washington - The Largest Park in Greater Seattle
- Westlake Center Mall - Seattle, Washington - Shopping Hub of the Emerald City
- Golden Gardens Park - Seattle, Washington - Park like Setting and Beachfront Location
- Ballard District - Seattle, Washington - Bringing the Heart of Scandinavia to the Northwest
- Seattle Art Museum - Seattle, Washington - Emerald City's Newest Addition to Contemporary Art and Design
- Seattle Center - Seattle, Washington - Cultural Hub and Gathering Place for the People of Seattle
- Pioneer Square - Seattle, Washington - Historic District in the Heart of the City
- Alki Beach - Seattle, Washington - Popular Beach Park Offering Everything Outdoors
- Experience Music Project Museum - Seattle, Washington - Dedicated to the Exploration and Innovation of Popular Music
- Nordic Heritage Museum - Seattle, Washington - The Heart of the Scandinavian Community
- Hotel 1000 - Seattle, Washington - Luxury Seattle Hotel Just Minutes from Waterfront and Pike Place Market
- Green Lake - Seattle, Washington - A Great Place to Fish, but Hold Off on Swimming
- Seattle Public Library Building - Seattle, Washington - An Expansive Library in the Heart of the City
- Fremont Neighborhood - Seattle, Washington - A Unique District Offering Anything Organic and Bohemian
- Elliott Bay Book Company - Seattle, Washington - The Hotspot for Seattle's Literary Scene
- Space Needle - Seattle, Washington - A Bird's Eye View and Rotating Restaurant at 500 Feet
- Hiram M. Chittenden Locks - Seattle, Washington - Providing Links for Boats and Salmon between Saltwater and Freshwater
- Klondike Gold Rush National Historical Park - Seattle, Washington Commemorating the Klondike Gold Rush
- Washington Park Arboretum - Seattle, Washington -An Urban Green Space Along the Shores of Lake Washington
- Pacific Science Center - Seattle, Washington - Engaging Diverse Communities through Interactive Science and Technology
- Washington State Ferries - Seattle, Washington - One of the Largest Fleets in the World
- Alexis Hotel - Seattle, Washington - Luxury Hotel in a Grand Historic Building
- Pike Place Market - Seattle, Washington - Fish Throwing and Fine Food in the Heart of Seattle
- Marriott Waterfront - Seattle, Washington - A Waterfront Hotel with Views of Elliott Bay and the Space Needle
- Pan Pacific - Seattle, Washington -Modern Upscale Hotel with Nearby Shopping at 2200 Westlake
- W Hotel - Seattle, Washington - Pure Luxury Hotel in the Heart of Seattle's Retail and Financial District
- Hotel Vintage Park - a Kimpton Hotel - Seattle, Washington - Luxury Lodging that Celebrates the World of Wine in the Northwest
- Inn at the Market - Seattle, Washington - Fine Hotel located in the Heart of Pike Place Market
- MarQueen Hotel - Seattle, Washington - Boutique Hotel Located on the Tallest Hill in Queen Anne with Views to Kill
- The Paramount Hotel - Seattle, Washington - Downtown Area Hotel in the Best of Locations
- The Westin - Seattle, Washington - Spacious Suites in Prime Downtown Location
- Renaissance Seattle Hotel - Seattle, Washington - Luxury Hotel Conveniently Located Near Airport and Major Freeways
- Four Seasons Hotel - Seattle, Washington - Luxurious Hotel in the Heart of Downtown
- Red Lion Hotel on Fifth Avenue - Seattle, Washington - Luxury Hotel with Executive Suites for VIPs and Families Alike
- Hotel Max - Seattle, Washington - Comfortable Modern Lodging Full of Art and Color in the Heart of Seattle
- Sheraton Seattle Hotel - Seattle, Washington - Convenient Locale in the Heart of the Business and Financial District
- Hotel Andra - Seattle, Washington - Fully Equipped Hotel Ready for Business and Private Parties in the Heart of Seattle
- Mayflower Park Hotel - Seattle, Washington - Queen Anne Style in the Heart of the Emerald City
- Arctic Club Hotel - Seattle, Washington - Comfortable Doubletree Hotel located in the heart of Seattle's Financial District
- Residence Inn Seattle Downtown/Lake Union - Seattle, Washington Conveniently Located Hotel in Downtown Seattle
- SpringHill Suites Seattle Downtown - Perfect Hotel for Business Events and Wedding Receptions
- Silver Cloud Hotel Stadium - Seattle, Washington - Sporting Location and Minutes from Downtown
- Warwick Seattle Hotel - Seattle, Washington - The Most Convenient Location in the City with Shopping, Attractions, and Fine Dining Nearby
- The Sorrento Hotel - Seattle, Washington - Emerald City's Longest Running Boutique Hotel
- Roosevelt Hotel - Seattle, Washington - Hotel Rooms and Suites to Meet Every Type of Traveler
- Homewood Suites Seattle-Downtown - Seattle, Washington - Conveniently Located Hotel in the Heart of Seattle's Downtown Tourist Attractions
- Inn at El Gaucho - Seattle, Washington - Retro Fifties Style Hotel in the Heart of Belltown
- Crowne Plaza Seattle Downtown Area - Seattle, Washington - A Lavish Hotel Located in the Heart of Seattle's Downtown District
- Hampton Inn & Suites Seattle Downtown - Seattle, Washington Conveniently Located Hotel in the Heart of Queen Anne
- Silver Cloud Hotel - Broadway - Seattle, Washington - Conveniently Located Hotel Situated in the Hip Capitol Hill Seattle Neighborhood
- Hotel Deca - Seattle, Washington - Art Deco Hotel in the Heart of University District Seattle
- Comfort Suites Downtown / Seattle Center - Seattle, Washington - Seattle Hotel within Walking Distance to All Major Seattle Tourist Attractions
- Silver Cloud Inn - Lake Union, Seattle, Washington - Seattle Hotel located on the Southern Tip of Lake Union and Just Minutes From Downtown Seattle
- Moore Hotel - Seattle, Washington - Affordable Historic Hotel in the Heart of Seattle's Pike Place Market
- Edgewater Hotel - Seattle, Washington - Luxury Waterfront Hotel with Views of the City and Bay
- Watertown Hotel - Seattle, Washington - Lodging Hub for Cruises and Minutes from Top Tourist Attractions
- Columbia Park - Kennewick, Washington - One of the Largest Parks in the Area Surrounded by the Columbia River
- Radisson Hotel Gateway Seattle - Tacoma Airport - Seattle, Washington The Closest Full Service Hotel to Seattle Tacoma International Airport
- La Quinta Inn & Suites Seattle Downtown - Seattle, Washington - Downtown Hotel within Walking Distance to Most Seattle Area Attractions
- Mediterranean Inn - Seattle, Washington - Newer Seattle Hotel in the Heart of Downtown
- Ramada Inn Downtown Seattle - Seattle, Washington - Conveniently Located Hotel in the Heart of the Downtown Corridor and Pike Place Market
- Doubletree Hotel Seattle Airport - Seattle, Washington - Full Service Hotel that Sits Next to the Seattle International Airport
- Sixth Avenue Inn - Seattle, Washington - Downtown Seattle Hotel that is All about Location and Convenience
- Executive Hotel Pacific - Seattle, Washington - Upgraded Hotel that is Anything but Standard
- Ace Hotel - Seattle, Washington - Smaller Loft Style Hotel in the heart of the Trendy Bell Town Neighborhood
- The Fairmont Olympic Seattle - Seattle, Washington - Ideally Located Luxury Hotel in the Heart of Seattle
- University Inn - Seattle, Washington - Convenient Hotel Lodging near the University of Washington and Seattle's Fine Dining
- Travelodge Seattle by the Space Needle - Seattle, Washington - Great Location in the Heart of the City Surrounded by Outdoor Adventure
- Red Lion Hotel Seattle Airport - Seattle, Washington - Convenient Airport Location Hotel with All the Amenities of Home
- Inn at Queen Anne - Seattle, Washington - A Historic Seattle Hotel with Charm and Urban Amenities
- Hurricane Ridge, Olympic National Park - A Park that Truly Lives Up to Its Name Due to In climate Weather
- Hoh Rain Forest, Olympic National Park - A Temperate Rainforest Full of Lush Scenery and Enchanting Trails
- Shi Shi Beach, Olympic National Park - One of the Most Beautiful Seascapes and Beaches in the Nation, with Trails that Abound
- Rialto Beach, Olympic National Park - A Great Beach Location with Many Camping Restrictions
- Ruby Beach, Olympic National Park - One of the Most Diverse Park's in the Nation Full of Scenery and Fog
- Quinault Rain Forest, Olympic National Park - Seattle, Washington Temperate Rain Forest Located in the Great Northwest
- Olympic National Forest
- Science Fiction Museum and Hall of Fame
- Qwest Field - Seattle, Washington - Home of the NFL's Seattle Seahawks
- Safeco Field in Seattle, Washington
- Seattle Aquarium - Seattle, Washington- small public aquarium
- Seattle-Tacoma International Airport - Seattle WA Seattle Airport Flights
- Woodland Park Zoo - Seattle, Washington - mid-size public zoo on 92 acres
Seattle, Washington accommodation & food services, waste management - Economy and Business Data
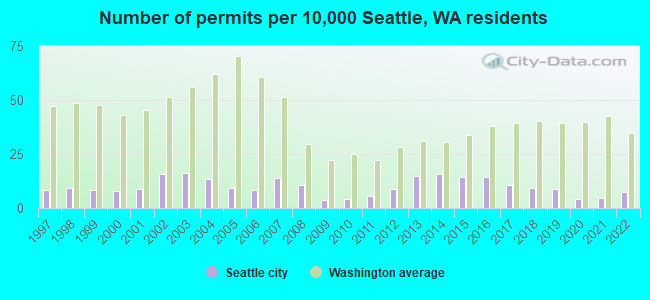
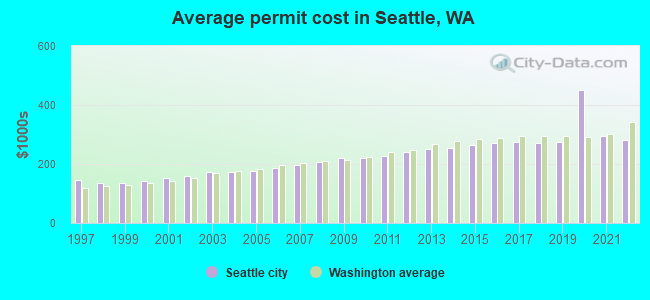
Single-family new house construction building permits:
- 2022: 418 buildings, average cost: $282,700
- 2021: 264 buildings, average cost: $296,300
- 2020: 247 buildings, average cost: $450,800
- 2019: 507 buildings, average cost: $274,500
- 2018: 523 buildings, average cost: $271,000
- 2017: 593 buildings, average cost: $273,900
- 2016: 797 buildings, average cost: $271,900
- 2015: 810 buildings, average cost: $266,400
- 2014: 898 buildings, average cost: $253,100
- 2013: 822 buildings, average cost: $249,800
- 2012: 498 buildings, average cost: $242,200
- 2011: 316 buildings, average cost: $227,200
- 2010: 241 buildings, average cost: $221,000
- 2009: 216 buildings, average cost: $220,700
- 2008: 595 buildings, average cost: $206,700
- 2007: 775 buildings, average cost: $197,800
- 2006: 482 buildings, average cost: $187,800
- 2005: 533 buildings, average cost: $177,100
- 2004: 754 buildings, average cost: $172,100
- 2003: 914 buildings, average cost: $173,100
- 2002: 886 buildings, average cost: $159,100
- 2001: 484 buildings, average cost: $152,800
- 2000: 449 buildings, average cost: $143,800
- 1999: 480 buildings, average cost: $136,900
- 1998: 530 buildings, average cost: $135,200
- 1997: 469 buildings, average cost: $146,300
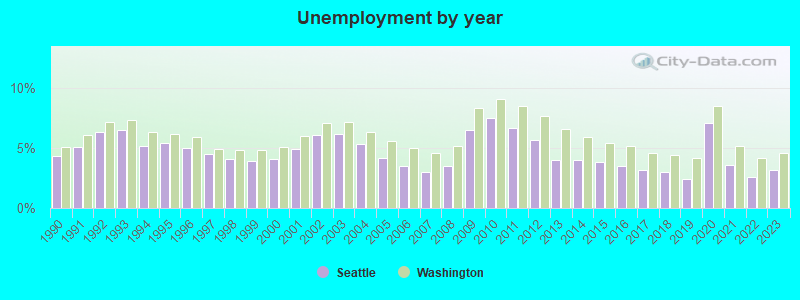
| Here: | 3.2% |
| Washington: | 4.6% |
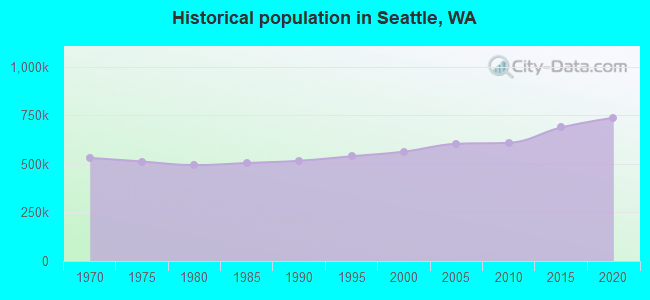
Population change in the 1990s: +47,613 (+9.2%).
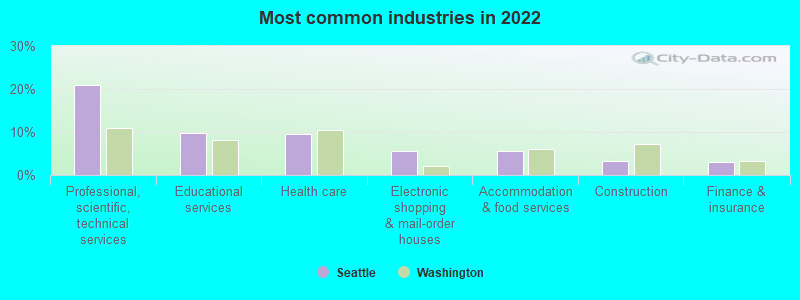
- Professional, scientific, technical services (20.9%)
- Educational services (9.8%)
- Health care (9.6%)
- Electronic shopping & mail-order houses (5.5%)
- Accommodation & food services (5.5%)
- Construction (3.2%)
- Finance & insurance (3.1%)
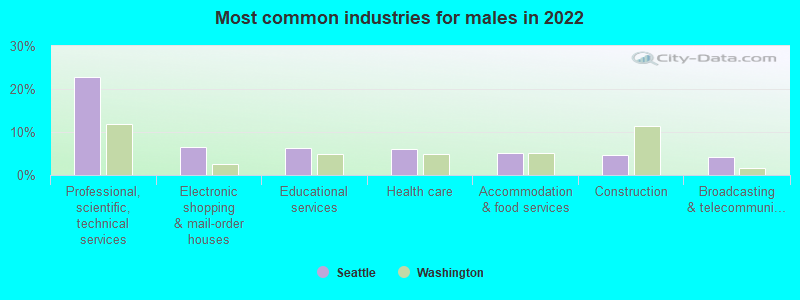
- Professional, scientific, technical services (22.8%)
- Electronic shopping & mail-order houses (6.5%)
- Educational services (6.3%)
- Health care (6.2%)
- Accommodation & food services (5.0%)
- Construction (4.6%)
- Broadcasting & telecommunications (4.2%)
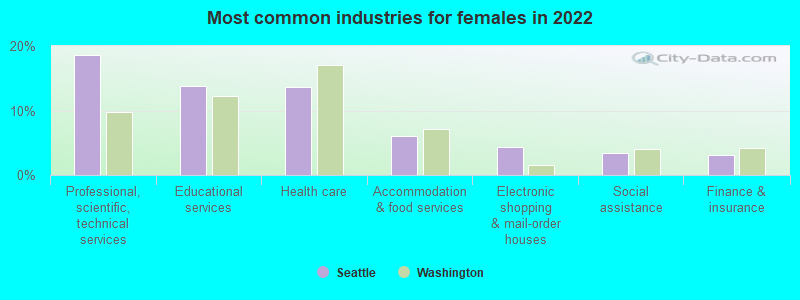
- Professional, scientific, technical services (18.6%)
- Educational services (13.9%)
- Health care (13.6%)
- Accommodation & food services (6.1%)
- Electronic shopping & mail-order houses (4.4%)
- Social assistance (3.4%)
- Finance & insurance (3.0%)
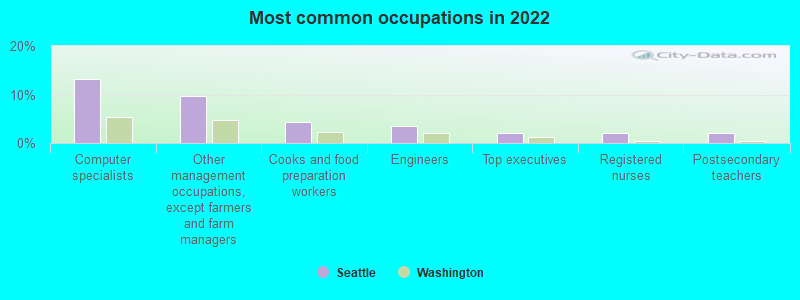
- Computer specialists (13.2%)
- Other management occupations, except farmers and farm managers (9.8%)
- Cooks and food preparation workers (4.3%)
- Engineers (3.4%)
- Top executives (2.0%)
- Registered nurses (2.0%)
- Postsecondary teachers (2.0%)
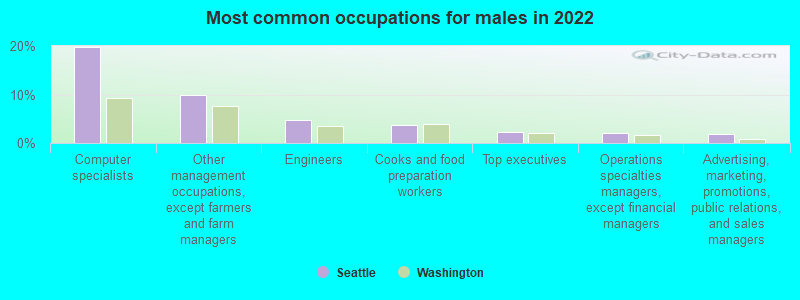
- Computer specialists (19.9%)
- Other management occupations, except farmers and farm managers (9.9%)
- Engineers (4.7%)
- Cooks and food preparation workers (3.8%)
- Top executives (2.2%)
- Operations specialties managers, except financial managers (2.1%)
- Advertising, marketing, promotions, public relations, and sales managers (1.9%)
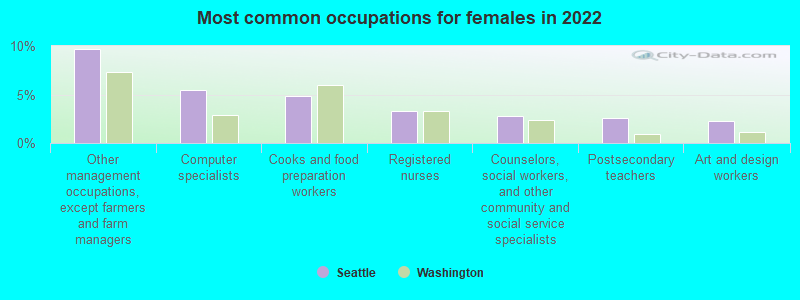
- Other management occupations, except farmers and farm managers (9.7%)
- Computer specialists (5.4%)
- Cooks and food preparation workers (4.8%)
- Registered nurses (3.3%)
- Counselors, social workers, and other community and social service specialists (2.8%)
- Postsecondary teachers (2.5%)
- Art and design workers (2.3%)
Average climate in Seattle, Washington
Based on data reported by over 4,000 weather stations


|
|

(lower is better)
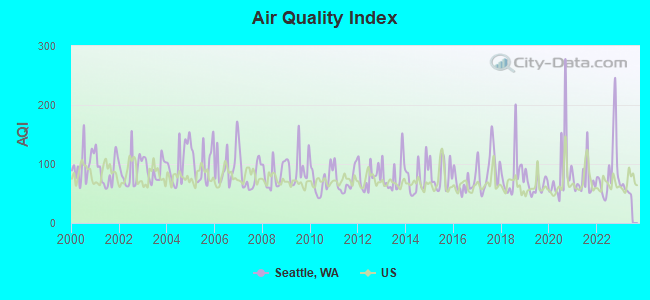
Air Quality Index (AQI) level in 2022 was 90.3. This is worse than average.
| City: | 90.3 |
| U.S.: | 72.6 |
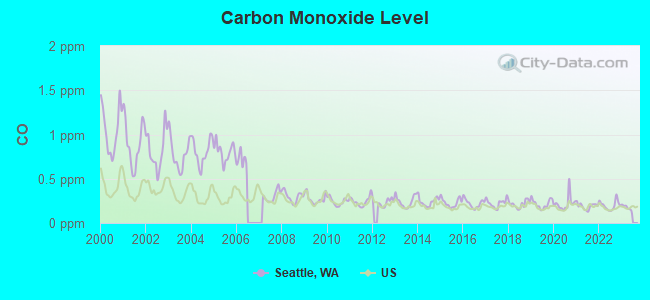
Carbon Monoxide (CO) [ppm] level in 2022 was 0.200. This is better than average. Closest monitor was 0.1 miles away from the city center.
| City: | 0.200 |
| U.S.: | 0.251 |
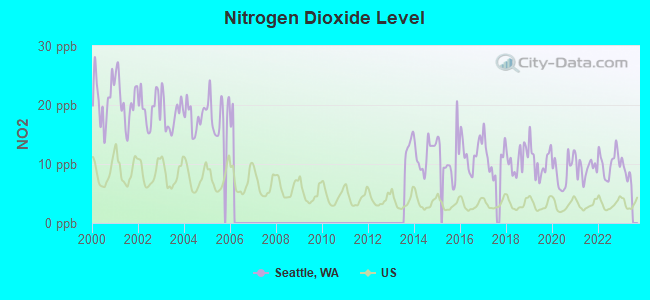
Nitrogen Dioxide (NO2) [ppb] level in 2022 was 10.2. This is significantly worse than average. Closest monitor was 1.6 miles away from the city center.
| City: | 10.2 |
| U.S.: | 5.1 |
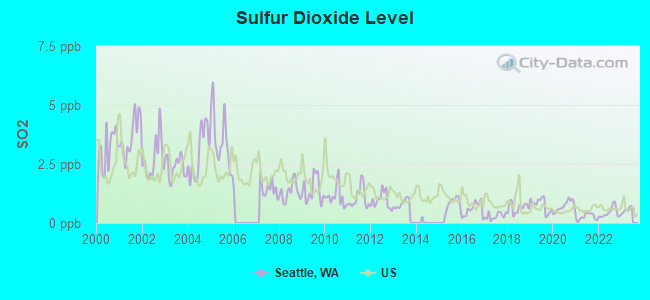
Sulfur Dioxide (SO2) [ppb] level in 2022 was 0.443. This is significantly better than average. Closest monitor was 0.9 miles away from the city center.
| City: | 0.443 |
| U.S.: | 1.515 |
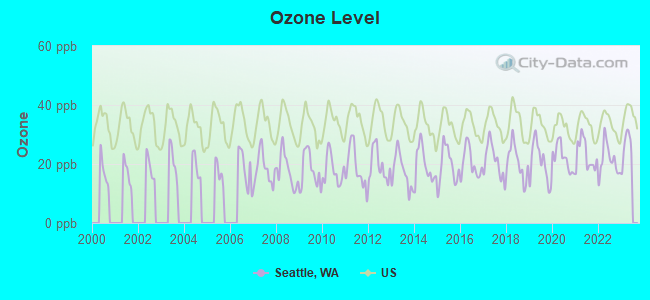
Ozone [ppb] level in 2022 was 21.2. This is significantly better than average. Closest monitor was 4.2 miles away from the city center.
| City: | 21.2 |
| U.S.: | 33.3 |
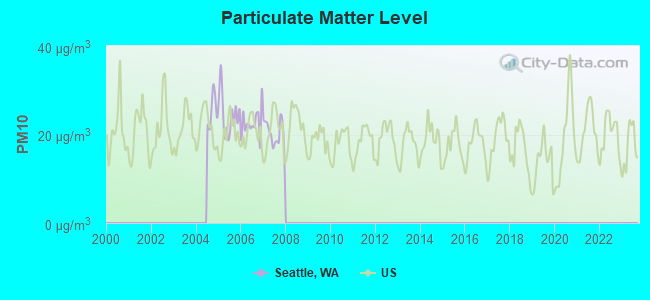
Particulate Matter (PM10) [µg/m3] level in 2007 was 20.3. This is about average. Closest monitor was 1.8 miles away from the city center.
| City: | 20.3 |
| U.S.: | 19.2 |
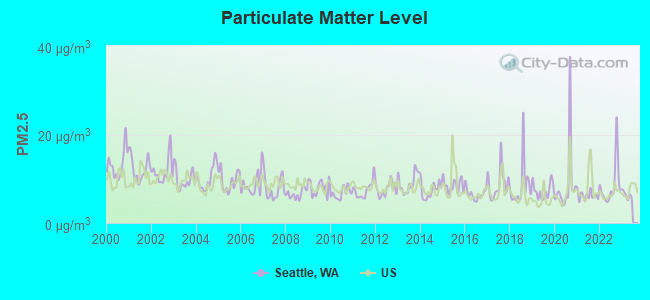
Particulate Matter (PM2.5) [µg/m3] level in 2022 was 8.58. This is about average. Closest monitor was 4.2 miles away from the city center.
| City: | 8.58 |
| U.S.: | 8.11 |
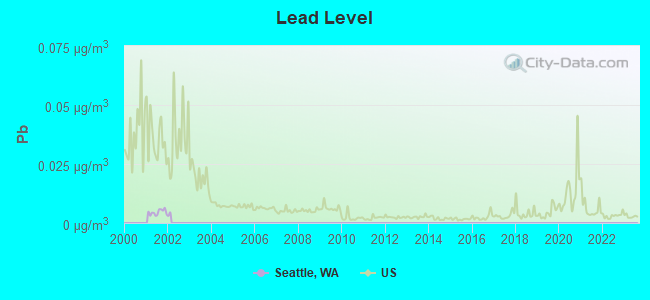
Lead (Pb) [µg/m3] level in 2001 was 0.00457. This is significantly better than average. Closest monitor was 1.6 miles away from the city center.
| City: | 0.00457 |
| U.S.: | 0.00931 |
Earthquake activity:
Seattle-area historical earthquake activity is significantly above Washington state average. It is 1294% greater than the overall U.S. average.On 4/13/1949 at 19:55:42, a magnitude 7.0 (7.0 UK, Class: Major, Intensity: VIII - XII) earthquake occurred 27.2 miles away from Seattle center, causing $80,000,000 total damage
On 2/28/2001 at 18:54:32, a magnitude 6.8 (6.8 MD, Depth: 32.2 mi, Class: Strong, Intensity: VII - IX) earthquake occurred 37.8 miles away from Seattle center
On 2/28/2001 at 18:54:32, a magnitude 6.8 (6.5 MB, 6.6 MS, 6.8 MW) earthquake occurred 38.9 miles away from the city center, causing $2,000,000,000 total damage and $305,000,000 insured losses
On 4/29/1965 at 15:28:43, a magnitude 6.6 (6.6 UK) earthquake occurred 21.4 miles away from the city center, causing $28,000,000 total damage
On 7/3/1999 at 01:43:54, a magnitude 5.8 (5.4 MB, 5.5 MS, 5.8 MW, 5.3 ME, Depth: 25.2 mi, Class: Moderate, Intensity: VI - VII) earthquake occurred 57.6 miles away from the city center
On 5/3/1996 at 04:04:22, a magnitude 5.5 (5.2 MB, 5.3 MD, 5.5 ML, Depth: 2.5 mi) earthquake occurred 30.9 miles away from Seattle center
Magnitude types: body-wave magnitude (MB), duration magnitude (MD), energy magnitude (ME), local magnitude (ML), surface-wave magnitude (MS), moment magnitude (MW)
Natural disasters:
The number of natural disasters in King County (30) is a lot greater than the US average (15).Major Disasters (Presidential) Declared: 27
Emergencies Declared: 1
Causes of natural disasters: Floods: 21, Storms: 16, Mudslides: 11, Landslides: 9, Winter Storms: 7, Earthquakes: 2, Heavy Rains: 2, Winds: 2, Hurricane: 1, Snow: 1, Volcanic Eruption: 1, Other: 1 (Note: some incidents may be assigned to more than one category).

Main business address for: CUTTER & BUCK INC (MEN'S & BOYS' FURNISHINGS, WORK CLOTHING, AND ALLIED GARMENTS), BRIAZZ INC (RETAIL-EATING PLACES), TULLYS COFFEE CORP (RETAIL-EATING PLACES), BLUE NILE INC (RETAIL-JEWELRY STORES), LOUDEYE CORP (SERVICES-COMPUTER PROGRAMMING SERVICES), SHURGARD STORAGE CENTERS INC (REAL ESTATE INVESTMENT TRUSTS), REALNETWORKS INC (SERVICES-COMPUTER PROGRAMMING SERVICES), ONVIA INC (SERVICES-BUSINESS SERVICES, NEC) and 46 other public companies.
Hospitals in Seattle:
- COMMUNITY HOSPICE-SEATTLE (190 QUEEN ANNE AVENUE NORTH)
- GROUP HEALTH COOPERATIVE HOSPI (1600 E JOHN STREET MS CEB-1)
- HOSPICE OF SEATTLE (425 PONTIUS N AVE, #300)
- MEDICAL DENTAL HOSPITAL (509 OLIVE WAY)
- NORTHWEST HOSPITAL (Voluntary non-profit - Other, 1550 NORTH 115TH STREET)
- SEATTLE CANCER CARE ALLIANCE (825 EASTLAKE AVENUE EAST)
- SEATTLE VA MEDICAL CENTER - VA PUGIT SOUND (Government Federal, 1660 S. COLUMBIAN WAY)
- SWEDISH MEDICAL CENTER (Voluntary non-profit - Private, 747 BROADWAY)
- UNIVERSITY OF WASHINGTON MEDICAL CTR (Government - State, 1959 NE PACIFIC ST)
- VISITING NURSE SERVICES OF NW-HOSPICE (400 NORTH 34TH STREET)
- WEST SEATTLE PSYCHIATRIC HOSPITAL (2600 SOUTHWEST HOLDEN)
Airports, heliports and other landing facilities located in Seattle:
- Seattle-Tacoma International Airport (SEA) (Runways: 3, Commercial Ops: 325,425, Air Taxi Ops: 10,813, Local Ops: 4,113, Military Ops: 127)
- Boeing Field/King County International Airport (BFI) (Runways: 2, Commercial Ops: 10,094, Air Taxi Ops: 32,816, Itinerant Ops: 90,233, Local Ops: 45,071, Military Ops: 1,234)
- Heliports: 12
- Kenmore Air Harbor Seaplane Base (W55)
- Seattle Seaplanes Seaplane Base (0W0)
Amtrak station:
SEATTLE (303 S. JACKSON ST.) . Services: ticket office, fully wheelchair accessible, enclosed waiting area, public restrooms, public payphones, vending machines, paid short-term parking, paid long-term parking, call for car rental service, taxi stand, intercity bus service, public transit connection.Biggest Colleges/Universities in Seattle:
- University of Washington-Seattle Campus (Full-time enrollment: 39,445; Location: 1400 NE Campus Parkway; Public; Website: www.washington.edu; Offers Doctor's degree)
- Seattle Central College (Full-time enrollment: 5,825; Location: 1701 Broadway Avenue; Public; Website: www.seattlecentral.edu)
- Seattle University (Full-time enrollment: 5,808; Location: 900 Broadway; Private, not-for-profit; Website: www.seattleu.edu; Offers Doctor's degree)
- Seattle Community College-North Campus (Full-time enrollment: 4,220; Location: 9600 College Way North; Public; Website: www.northseattle.edu)
- Seattle Community College-South Campus (Full-time enrollment: 3,986; Location: 6000 16th Ave SW; Public; Website: southseattle.edu)
- Seattle Pacific University (Full-time enrollment: 3,897; Location: 3307 3rd Ave W; Private, not-for-profit; Website: www.spu.edu; Offers Doctor's degree)
- The Art Institute of Seattle (Full-time enrollment: 1,580; Location: 2323 Elliott Ave; Private, for-profit; Website: www.ais.edu)
- City University of Seattle (Full-time enrollment: 1,401; Location: 521 Wall Street, Suite 100; Private, not-for-profit; Website: www.cityu.edu; Offers Doctor's degree)
- Pima Medical Institute-Seattle (Full-time enrollment: 1,132; Location: 9709 Third Ave NE Suite 400; Private, for-profit; Website: pmi.edu)
- Cornish College of the Arts (Full-time enrollment: 809; Location: 1000 Lenora Street; Private, not-for-profit; Website: www.cornish.edu)
- Antioch University-Seattle (Full-time enrollment: 564; Location: 2326 6th Ave; Private, not-for-profit; Website: www.antiochseattle.edu; Offers Doctor's degree)
- ITT Technical Institute-Seattle (Full-time enrollment: 493; Location: 12720 Gateway Dr Ste 100; Private, for-profit; Website: www.itt-tech.edu)
- Gary Manuel Aveda Institute (Full-time enrollment: 461; Location: 1514 10th Ave; Private, for-profit; Website: www.gmaveda.com/)
- Seattle Vocational Institute (Full-time enrollment: 418; Location: 2120 S Jackson; Public; Website: sviweb.sccd.ctc.edu)
- Divers Institute of Technology (Full-time enrollment: 396; Location: 1341 N. Northlake Way Suite 150; Private, for-profit; Website: www.diversinstitute.edu)
- Cortiva Institute-Seattle (Full-time enrollment: 320; Location: 425 Pontius Ave N Ste 100; Private, for-profit; Website: www.cortiva.com/seattle)
- Everest College-Seattle (Full-time enrollment: 280; Location: 2111 N. Northgate Way, Suite 300; Private, for-profit; Website: www.everest.edu/campus/seattle)
- Argosy University-Seattle (Full-time enrollment: 273; Location: 2601-A Elliott Avenue; Private, for-profit; Website: www.argosy.edu/seattle; Offers Doctor's degree)
- The Seattle School of Theology & Psychology (Full-time enrollment: 221; Location: 2501 Elliott Avenue; Private, not-for-profit; Website: www.theseattleschool.edu; Offers Master's degree)
- Bainbridge Graduate Institute (Full-time enrollment: 111; Location: 220 Second Avenue South Suite 400; Private, not-for-profit; Website: www.bgi.edu; Offers Master's degree)
Biggest public high schools in Seattle:
- UW EARLY ENTRANCE PROGRAM (Location: 3935 15TH AVE, Grades: 11-12)
- SSCC HIGH SCHOOL COMPLETION (Location: 6000 16TH AVE SW, Grades: 9-12)
- PUGET SOUND SKILLS CENTER (Location: 18010 8TH AVE S, Grades: 10-12)
- CHOICE ACADEMY (Location: 18367 8TH AVE S, Grades: 7-12)
- NEW START (Location: 614 SW 120TH ST, Grades: 9-12)
- SATELLITE HIGH SCHOOL (Location: 18367 8TH AVE S, Grades: PK-12)
- HEALTH SCIENCES & HUMAN SERVICES (Location: 830 SW 116TH ST, Grades: 9-12)
- TECHNOLOGY ENGINEERING & COMMUNICATIONS (Location: 830 SW 116TH ST, Grades: 9-12)
- ARTS & ACADEMICS ACADEMY (Location: 830 SW 116TH ST, Grades: 9-12)
- CAREER LINK (Location: 6000 16TH AVE SW, Grades: 9-12)
Biggest private high schools in Seattle:
- BISHOP BLANCHET HIGH SCHOOL (Students: 990, Location: 8200 WALLINGFORD AVE N, Grades: 9-12)
- HOLY NAMES ACADEMY (Students: 680, Location: 728 21ST AVE E, Grades: 9-12, Girls only)
- SEATTLE ACADEMY (Students: 650, Location: 1201 E UNION ST, Grades: 6-12)
- THE BUSH SCHOOL (Students: 571, Location: 3400 E HARRISON ST, Grades: KG-12)
- UNIVERSITY PREP (Students: 510, Location: 8000 25TH AVE NE, Grades: 6-12)
- THE NORTHWEST SCHOOL (Students: 474, Location: 1415 SUMMIT AVE, Grades: 6-12)
- O'DEA HIGH SCHOOL (Students: 419, Location: 802 TERRY AVE, Grades: 9-12, Boys only)
- SEATTLE WALDORF SCHOOL (Students: 344, Location: 2728 NE 100TH ST, Grades: PK-12)
- ACADEMY NW/FAMILY ACADEMY (Students: 280, Location: 632 SW 150TH, Grades: KG-12)
- SHOREWOOD CHRISTIAN SCHOOL (Students: 213, Location: 10300 28TH AVE SW, Grades: PK-12)
Biggest public elementary/middle schools in Seattle:
- FIRST PLACE SCHOLARS CHARTER SCHOOL (Location: 170 20TH, Grades: KG-5, Charter school)
- BEVERLY PARK ELEM AT GLENDALE (Location: 1201 S 104TH ST, Grades: PK-6)
- CASCADE MIDDLE SCHOOL (Location: 11212 10TH AVE SW, Grades: 7-8)
- HILLTOP ELEMENTARY (Location: 12250 24TH AVE S, Grades: PK-6)
- MOUNT VIEW ELEMENTARY (Location: 10811 12TH AVE SW, Grades: PK-6)
- SOUTHERN HEIGHTS ELEMENTARY (Location: 11249 14TH AVE S, Grades: PK-6)
- WHITE CENTER HEIGHTS ELEMENTARY (Location: 11427 3RD AVE S, Grades: PK-6)
- BRYN MAWR ELEMENTARY SCHOOL (Location: 8212 S 118TH ST, Grades: KG-5)
- CAMPBELL HILL ELEMENTARY SCHOOL (Location: 6418 S 124TH ST, Grades: KG-5)
- LAKERIDGE ELEMENTARY SCHOOL (Location: 7400 S 115TH ST, Grades: KG-5)
Biggest private elementary/middle schools in Seattle:
- ST JOSEPH SCHOOL (Students: 613, Location: 700 18TH AVE E, Grades: KG-8)
- ST JOHN SCHOOL (Students: 534, Location: 120 N 79TH ST, Grades: PK-8)
- ASSUMPTION-ST BRIDGET SCHOOL (Students: 518, Location: 6220 32ND AVE NE, Grades: KG-8)
- VILLA ACADEMY (Students: 388, Location: 5001 NE 50TH ST, Grades: PK-8)
- SEATTLE COUNTRY DAY SCHOOL (Students: 334, Location: 2619 4TH AVE N, Grades: KG-8)
- UNIVERSITY CHILD DEVELOPMENT SCHOOL (Students: 318, Location: 5062 9TH AVE NE, Grades: PK-5)
- OUR LADY OF FATIMA SCHOOL (Students: 287, Location: 3301 W DRAVUS ST, Grades: KG-8)
- OUR LADY OF THE LAKE SCHOOL (Students: 260, Location: 3520 NE 89TH ST, Grades: PK-8)
- ST ANNE SCHOOL (Students: 260, Location: 101 W LEE ST, Grades: PK-8)
- WESTSIDE SCHOOL (Students: 252, Location: 7740 34TH AVE SW, Grades: PK-6)
Library in Seattle:
User-submitted facts and corrections:
- Biggest Private High schools in Seattle: Blanchet High School (Students: 1050; Location: 8200 Wallingford AVE N; Grades 09-12 added by Kate
- The Seattle Public Library has moved back to it\'s permanent location at 1000 Fourth Ave. The address on Pike was temporary while the new library was being built.
- The Seattle Public Library has moved back to it's permanent location at 1000 Fourth Ave. The address on Pike was temporary while the new library was being built.
- KING and KONG televsion stations in Seattle, WA are both owned by BELO Broadcasting headquartered in Dallas, TX.
Points of interest:
Notable locations in Seattle: Alaska Marine Highway Terminal (A), Schwabachers Dock (B), Pioneer Square (C), Pike Place Market (D), Seattle Center (E), Broadmoor Golf Club (F), Jackson Park Golf Course (G), Jefferson Park Golf Course (H), Salmon Bay Fishermens Terminal (I), Sand Point Country Club (J), Red Square (K), University of Washington Golf Driving Range (L), University of Washington Oceanography Dock (M), Climbing Rock (N), Gate 3 (O), Gate 4 (P), Gate 6 (Q), Gate 7 (R), Gate 8 (S), King Street Station (T). Display/hide their locations on the map
Shopping Centers: University Village Shopping Center (1), Greenwood Shopping Center (2), Northgate Shopping Center (3), Lake City Shopping Center (4), Northgate Shopping Center (5), Oak Tree Village Shopping Center (6), Empire Shopping Center (7), Westwood Village Shopping Center (8). Display/hide their locations on the map
Main business address in Seattle include: CUTTER & BUCK INC (A), BRIAZZ INC (B), TULLYS COFFEE CORP (C), BLUE NILE INC (D), LOUDEYE CORP (E), SHURGARD STORAGE CENTERS INC (F), REALNETWORKS INC (G), ONVIA INC (H). Display/hide their locations on the map
Churches in Seattle include: Saint Lukes Lutheran Church (A), Mount Olive Lutheran Church (B), Saint Margarets Church (C), Saint Marks Episcopal Cathedral (D), Mount Zion Baptist Church (E), Saint Marks Lutheran Church (F), New Born Pentecostal Temple (G), New Covenant Christian Center (H), New Dimension Christian Center (I). Display/hide their locations on the map
Cemeteries: Forest Lawn Cemetery (1), Grand Army of the Republic Cemetery (2), Lake View Cemetery (3), Mount Pleasant Cemetery (4), Fort Lawton Military Cemetery (5), Washelli Cemetery (6), Calvary Cemetery (7). Display/hide their locations on the map
Lakes and reservoirs: Green Lake (A), Bitter Lake (B), Lake Union (C), Haller Lake (D), Volunteer Park Reservoir (E), West Seattle Reservoir (F), Lincoln Reservoir (G), Southwest Myrtle Street Reservoir (H). Display/hide their locations on the map
Streams, rivers, and creeks: Mohlendorph Creek (A), Ravenna Creek (B), University Slough (C), Thornton Creek (D), Venema Creek (E), Scheuerman Creek (F). Display/hide their locations on the map
Parks in Seattle include: Washington Park Arboretum (1), Colman Park (2), Columbia Park (3), Woodland Park (4), Windermere Park (5), Dearborn Park (6), Denny Park (7), Matthews Beach Park (8), Frink Park (9). Display/hide their locations on the map
Beaches: Pritchett Island Beach (A), Brighton Beach (B), Alki Beach (C), Mount Baker Beach (D), Matthews Beach (E). Display/hide their locations on the map
Tourist attractions: Laser Fantasy International (Museums; 200 2nd Ave N) (1), Last Resort Fire Department (Museums; 1433 Northwest 51st Street) (2), Boeing and Eames IMAX Theatres (Museums; Pacific Science Centre) (3), Center for Wooden Boats (Museums; 1010 Valley Street) (4), History House (Museums; 790 North 34th Street) (5), Art Museum Charles & Emma Frye (704 Terry Avenue) (6), Birthplace of Seattle Log House Museum (3003 61st Avenue Southwest) (7), Seattle Metropolitan Police Museum (Cultural Attractions- Events- & Facilities; 317 3rd Avenue South) (8), Seattle City - Parks & Recreation Department- Woodland Park Zoo- School Field T (Cultural Attractions- Events- & Facilities; 600 5th Avenue South) (9). Display/hide their approximate locations on the map
Hotels: A-1 Motel (4450 Green Lake Way North) (1), Arlington Suites (1st & Madison) (2), Marriott Sea-Tac Airport (3201 South 176th Street) (3), Best Western Pioneer Square (77 Yesler Way) (4), Comfort Suites (601 Roy Street) (5), Emerald Inn (8512 Aurora Avenue North) (6), First Hill Apartments (400 10th Avenue) (7), Camlin Hotel (1619 9th Avenue) (8), Best Western Executive Inn (200 Taylor North) (9). Display/hide their approximate locations on the map
Courts: United States Government - Executive Office For Immigration Review- Immigration C (1000 2nd Avenue) (1), United States Government - Courts- Bankruptcy Court- Clerk's Office Informa (700 Stewart Street) (2), United States Government - Federal Bureau Of Investigation- Emergency Nu (1111 3rd) (3), King County - King County Superior Court- Superior Court- King County Superior Court Informa (Cancelled) (4), Collegian Court Llc (1225 South Weller Street) (5), King County - Prosecuting Attorney- Criminal Division- Juvenile Sec (Youth Sevice Centre) (6), King County - Assistant Presiding Judge- Probation- King County District Court- Court Techno (516 3rd Avenue Rm W-1034) (7), Mercer Court (527 12th Avenue East) (8), Andover Court Associates (4000 Martin Luther King J Apt B201) (9). Display/hide their approximate locations on the map
Birthplace of: Duff McKagan - Rock musician, Bill Gates - (born 1955), computer software maker and billionaire, William P. Yarborough - General, Thomas F. Hamilton - Founder of the Hamilton Standard Company, Greg Valentine - Professional wrestler, Don Coryell - Football player and coach, Samuel L. Stanley - Physician, Adam West - Actor, Jerry Lewis (California politician) - Politician, Roger Revelle - Political scientist.
Drinking water stations with addresses in Seattle and their reported violations in the past:
TRIDENT SEAFOODS CORP. AKUTAN (Serves AK, Population served: 1,150, Surface water):Past health violations:ALASKA AIRLINES BETHEL (Serves AK, Population served: 457, Groundwater):Past monitoring violations:
- Treatment Technique (SWTR and GWR) - In MAY-2014
- Treatment Technique (SWTR and GWR) - In JUN-2013. Follow-up actions: St Compliance achieved (JUL-31-2013)
- Treatment Technique (SWTR and GWR) - In JAN-2013. Follow-up actions: St Compliance achieved (FEB-28-2013)
- Treatment Technique (SWTR and GWR) - In DEC-2012. Follow-up actions: St Compliance achieved (FEB-28-2013)
- Treatment Technique (SWTR and GWR) - In NOV-2011. Follow-up actions: St Compliance achieved (DEC-31-2011)
- Monitoring of Treatment (SWTR-Filter) - In FEB-2014
- Monitoring and Reporting (DBP) - Between JAN-2014 and MAR-2014, Contaminant: Chlorine
- Monitoring and Reporting (DBP) - Between NOV-2013 and JAN-2014, Contaminant: TTHM
- Monitoring and Reporting (DBP) - Between NOV-2013 and JAN-2014, Contaminant: Total Haloacetic Acids (HAA5)
- Monitoring of Treatment (SWTR-Filter) - In MAY-2013. Follow-up actions: St Compliance achieved (JUN-18-2013)
- 5 routine major monitoring violations
- 25 regular monitoring violations
- 21 other older monitoring violations
Past monitoring violations:RED SALMON CANNERY (Serves AK, Population served: 450, Surface water):
- 4 routine major monitoring violations
Past health violations:EXCURSION INLET CANNERY (Serves AK, Population served: 402, Surface water):Past monitoring violations:
- Treatment Technique (SWTR and GWR) - In MAY-2005
- Monitoring, Turbidity (Enhanced SWTR) - In JUL-2012, Contaminant: IESWTR. Follow-up actions: St Compliance achieved (MAY-31-2013)
- Monitoring of Treatment (SWTR-Filter) - In JUL-2012. Follow-up actions: St Compliance achieved (MAY-31-2013)
- Monitoring of Treatment (SWTR-Filter) - In JUN-2012. Follow-up actions: St Compliance achieved (MAY-31-2013)
- Monitoring of Treatment (SWTR-Filter) - In JUN-2012. Follow-up actions: St Compliance achieved (MAY-31-2013)
- Monitoring of Treatment (SWTR-Filter) - In MAY-2012. Follow-up actions: St Compliance achieved (MAY-31-2013)
- 2 routine major monitoring violations
- One regular monitoring violation
- 20 other older monitoring violations
Past monitoring violations:TRIDENT SEAFOODS INC. NAKNEK (Serves AK, Population served: 400, Groundwater):
- Monitoring, Turbidity (Enhanced SWTR) - In SEP-2013, Contaminant: IESWTR
- Monitoring of Treatment (SWTR-Filter) - In SEP-2013
- Monitoring of Treatment (SWTR-Filter) - In SEP-2012. Follow-up actions: St Compliance achieved (SEP-19-2013)
- Monitoring, Turbidity (Enhanced SWTR) - In SEP-2012, Contaminant: IESWTR. Follow-up actions: St Compliance achieved (SEP-19-2013)
- Monitoring of Treatment (SWTR-Filter) - In AUG-2012. Follow-up actions: St Compliance achieved (SEP-19-2013)
- 5 routine major monitoring violations
- 3 regular monitoring violations
- 30 other older monitoring violations
Past monitoring violations:TRIDENT SEAFOODS INC. SAND PT (Serves AK, Population served: 400, Surface water):
- 6 routine major monitoring violations
- 2 regular monitoring violations
Past health violations:ICICLE SEAFOODS DILLINGHAM (Serves AK, Population served: 220, Groundwater):Past monitoring violations:
- Treatment Technique (SWTR and GWR) - In JUN-2014
- Treatment Technique (SWTR and GWR) - In JAN-2014
- Treatment Technique (SWTR and GWR) - In JUL-2013. Follow-up actions: St Compliance achieved (AUG-31-2013)
- Treatment Technique (SWTR and GWR) - In MAY-2013. Follow-up actions: St Compliance achieved (AUG-31-2013)
- Treatment Technique (SWTR and GWR) - In OCT-2012. Follow-up actions: St Compliance achieved (NOV-30-2012)
- Treatment Technique (SWTR and GWR) - In SEP-2012. Follow-up actions: St Compliance achieved (NOV-30-2012)
- 2 other older health violations
- Monthly Turbidity Exceed (Enhanced SWTR) - In JUN-2014, Contaminant: IESWTR
- Monitoring of Treatment (SWTR-Filter) - In MAY-2014
- Monthly Turbidity Exceed (Enhanced SWTR) - In MAY-2014, Contaminant: IESWTR
- Monthly Turbidity Exceed (Enhanced SWTR) - In JAN-2014, Contaminant: IESWTR
- Monitoring of Treatment (SWTR-Filter) - In AUG-2013. Follow-up actions: St Compliance achieved (SEP-02-2013)
- 3 routine major monitoring violations
- 22 regular monitoring violations
- 14 other older monitoring violations
Past health violations:LYNDEN B.S.-GSA, BELLINGHAM PMT (Population served: 200, Groundwater):Past monitoring violations:
- MCL, Monthly (TCR) - Between JUL-2010 and SEP-2010, Contaminant: Coliform
- 3 routine major monitoring violations
- One regular monitoring violation
Past monitoring violations:
- 2 routine major monitoring violations
- One regular monitoring violation
Drinking water stations with addresses in Seattle that have no violations reported:
- USPS CRATERS OF THE MOON NATIONAL PARK (Address: 909 1ST AVE , Serves ID, Population served: 616, Primary Water Source Type: Groundwater)
- ALPINE MOBILE MANOR (Population served: 60, Primary Water Source Type: Groundwater)
- CASCADE CREST WATER SYSTEM (Population served: 50, Primary Water Source Type: Groundwater)
| This city: | 2.1 people |
| Washington: | 2.5 people |
| This city: | 42.9% |
| Whole state: | 64.4% |
| This city: | 9.8% |
| Whole state: | 7.7% |
Likely homosexual households (counted as self-reported same-sex unmarried-partner households)
- Lesbian couples: 1.0% of all households
- Gay men: 1.3% of all households
People in group quarters in Seattle in 2010:
- 11,804 people in college/university student housing
- 2,904 people in other noninstitutional facilities
- 2,588 people in nursing facilities/skilled-nursing facilities
- 2,550 people in emergency and transitional shelters (with sleeping facilities) for people experiencing homelessness
- 1,541 people in local jails and other municipal confinement facilities
- 1,387 people in group homes intended for adults
- 637 people in residential treatment centers for adults
- 450 people in correctional residential facilities
- 362 people in military ships
- 307 people in maritime/merchant vessels
- 90 people in correctional facilities intended for juveniles
- 70 people in workers' group living quarters and job corps centers
- 65 people in in-patient hospice facilities
- 58 people in group homes for juveniles (non-correctional)
- 57 people in residential treatment centers for juveniles (non-correctional)
- 53 people in mental (psychiatric) hospitals and psychiatric units in other hospitals
- 2 people in hospitals with patients who have no usual home elsewhere
People in group quarters in Seattle in 2000:
- 10,642 people in college dormitories (includes college quarters off campus)
- 5,024 people in other noninstitutional group quarters
- 3,124 people in local jails and other confinement facilities (including police lockups)
- 2,951 people in nursing homes
- 2,084 people in other group homes
- 478 people in homes or halfway houses for drug/alcohol abuse
- 460 people in homes for the mentally ill
- 310 people in crews of maritime vessels
- 258 people in other nonhousehold living situations
- 225 people in military ships
- 167 people in hospitals/wards and hospices for chronically ill
- 167 people in other hospitals or wards for chronically ill
- 154 people in short-term care, detention or diagnostic centers for delinquent children
- 135 people in other types of correctional institutions
- 112 people in homes for the physically handicapped
- 88 people in religious group quarters
- 84 people in homes for the mentally retarded
- 68 people in unknown juvenile institutions
- 61 people in wards in general hospitals for patients who have no usual home elsewhere
- 52 people in federal prisons and detention centers
- 51 people in halfway houses
- 32 people in state prisons
- 27 people in mental (psychiatric) hospitals or wards
- 23 people in job corps and vocational training facilities
- 21 people in residential treatment centers for emotionally disturbed children
- 17 people in orthopedic wards and institutions for the physically handicapped
- 4 people in military barracks, etc.
- 3 people in military transient quarters for temporary residents
Arenas or stadiums:
- Husky Stadium. Capacity: 72,500. Washington Huskies football.
- Qwest Field. Capacity: 67,000. Seattle Seahawks, Seattle Sounders.
- Safeco Field. Capacity: 47,116. Seattle Mariners.
- KeyArena. Seattle SuperSonics (NBA), Seattle Storm (WNBA).
- Bank of America Arena at Hec Edmundson Pavilion. University of Washington.
Banks with most branches in Seattle (2011 data):
- Bank of America, National Association: 40 branches. Info updated 2009/11/18: Bank assets: $1,451,969.3 mil, Deposits: $1,077,176.8 mil, headquarters in Charlotte, NC, positive income, 5782 total offices, Holding Company: Bank Of America Corporation
- JPMorgan Chase Bank, National Association: 35 branches. Info updated 2011/11/10: Bank assets: $1,811,678.0 mil, Deposits: $1,190,738.0 mil, headquarters in Columbus, OH, positive income, International Specialization, 5577 total offices, Holding Company: Jpmorgan Chase & Co.
- KeyBank National Association: 29 branches. Info updated 2008/03/03: Bank assets: $86,198.8 mil, Deposits: $64,214.8 mil, headquarters in Cleveland, OH, positive income, Commercial Lending Specialization, 1067 total offices, Holding Company: Keycorp
- U.S. Bank National Association: 28 branches. Info updated 2012/01/30: Bank assets: $330,470.8 mil, Deposits: $236,091.5 mil, headquarters in Cincinnati, OH, positive income, 3121 total offices, Holding Company: U.S. Bancorp
- Wells Fargo Bank, National Association: 27 branches. Info updated 2011/04/05: Bank assets: $1,161,490.0 mil, Deposits: $905,653.0 mil, headquarters in Sioux Falls, SD, positive income, 6395 total offices, Holding Company: Wells Fargo & Company
- Washington Federal: 16 branches. Info updated 2011/12/19: Bank assets: $13,653.0 mil, Deposits: $8,905.8 mil, local headquarters, positive income, Mortgage Lending Specialization, 174 total offices
- Umpqua Bank: 11 branches. Info updated 2011/09/02: Bank assets: $11,556.7 mil, Deposits: $9,325.3 mil, headquarters in Roseburg, OR, positive income, Commercial Lending Specialization, 193 total offices, Holding Company: Umpqua Holdings Corporation
- Sterling Savings Bank: Burien Branch, Private Banking- Seattle Branch, Downtown Seattle Branch, Northgate Branch, Ballard Branch, Seattle Corporate Banking Center. Info updated 2012/03/21: Bank assets: $9,207.8 mil, Deposits: $6,454.1 mil, headquarters in Spokane, WA, positive income, Commercial Lending Specialization, 192 total offices, Holding Company: Sterling Financial Corporation
- Union Bank, National Association: Seattle - Lake City Branch, Seattle - Ballard Branch, Seattle - Fremont Branch, Northstar Express, Seattle - 5th And University. Info updated 2011/09/01: Bank assets: $88,967.5 mil, Deposits: $65,286.4 mil, headquarters in San Francisco, CA, positive income, Commercial Lending Specialization, 403 total offices, Holding Company: Mitsubishi Ufj Financial Group, Inc.
- 28 other banks with 39 local branches
For population 15 years and over in Seattle:
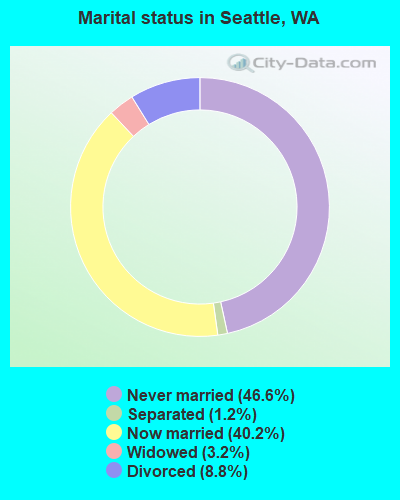
- Never married: 46.6%
- Now married: 40.2%
- Separated: 1.2%
- Widowed: 3.2%
- Divorced: 8.8%
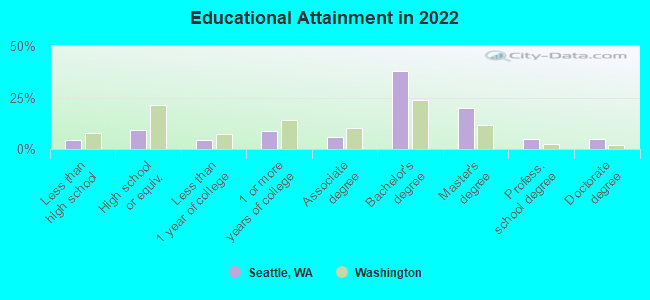
For population 25 years and over in Seattle:
- High school or higher: 95.5%
- Bachelor's degree or higher: 67.3%
- Graduate or professional degree: 29.6%
- Unemployed: 2.8%
- Mean travel time to work (commute): 16.5 minutes
| Here: | 10.5 |
| Washington average: | 11.6 |


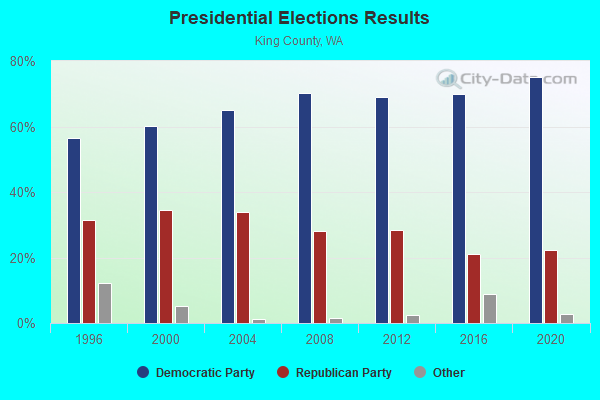
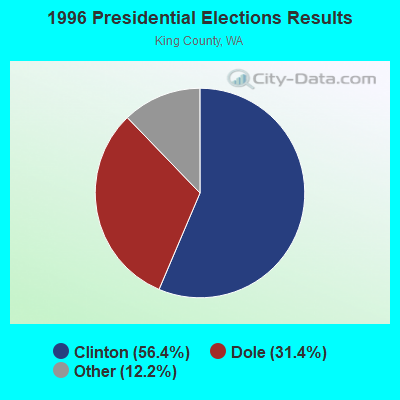
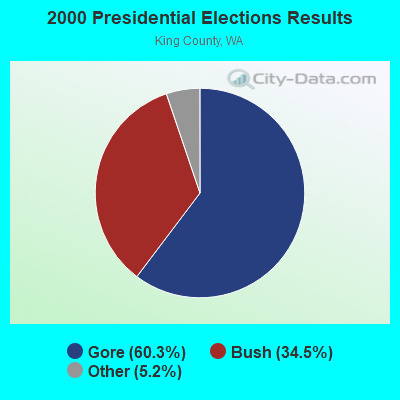
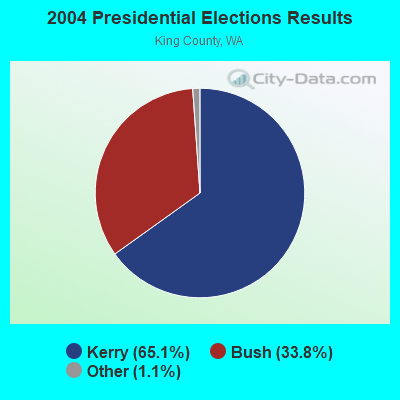
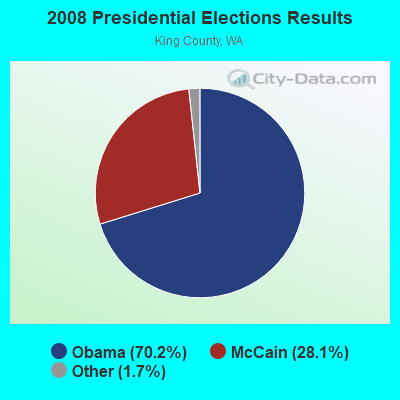
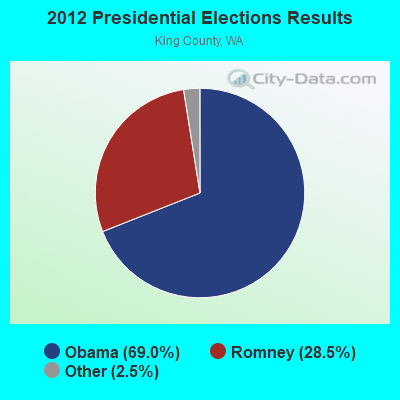
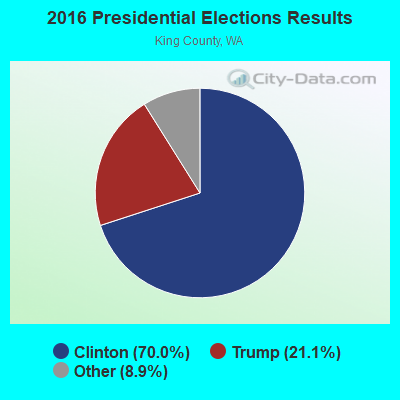
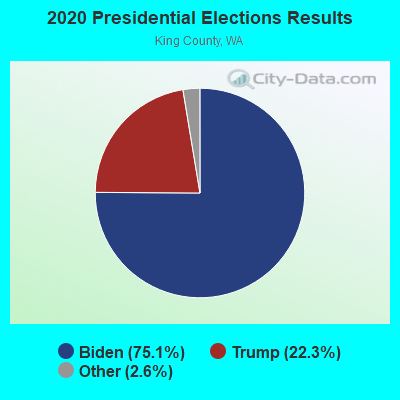
Graphs represent county-level data. Detailed 2008 Election Results
Neighborhoods in Seattle:
(Seattle, Washington Neighborhood Map)- Adams neighborhood
- Alki neighborhood
- Allentown neighborhood
- Arbor Heights neighborhood
- Atlantic neighborhood
- Ballard neighborhood
- Belltown (Denny Triangle) neighborhood
- Bitter Lake neighborhood
- Briarcliff neighborhood
- Brighton neighborhood
- Broadview neighborhood
- Broadway neighborhood
- Bryant neighborhood
- Bryn Mawr neighborhood
- CBD neighborhood
- Capitol Hill neighborhood
- Cascade neighborhood
- Cedar Park neighborhood
- Central Area neighborhood
- Chinatown neighborhood
- Columbia City neighborhood
- Crown Hill neighborhood
- Delridge neighborhood
- Downtown neighborhood
- Dunlap neighborhood
- Duwamish neighborhood
- East Queen Anne neighborhood
- Eastlake neighborhood
- Fairmount Park neighborhood
- Fauntleroy neighborhood
- First Hill neighborhood
- Foster neighborhood
- Fremont neighborhood
- Gatewood neighborhood
- Genesee neighborhood
- Georgetown neighborhood
- Green Lake neighborhood
- Greenwood neighborhood
- Haller Lake neighborhood
- Harbor Island neighborhood
- Harrison (Denny Blane) neighborhood
- High Point neighborhood
- Highland Park neighborhood
- Holly Park (Beacon Hill) neighborhood
- Industrial District neighborhood
- Interbay neighborhood
- Lake City neighborhood
- Lakeridge neighborhood
- Laurelhurst (Sandpoint) neighborhood
- Lawton Park neighborhood
- Leschi neighborhood
- Lower Queen Anne neighborhood
- Loyal Heights neighborhood
- Madison Park neighborhood
- Madrona neighborhood
- Magnolia neighborhood
- Mann neighborhood
- Maple Leaf neighborhood
- Matthews Beach neighborhood
- Meadowbrook neighborhood
- Mid Beacon Hill neighborhood
- Minor neighborhood
- Montlake neighborhood
- Mount Baker neighborhood
- North Admiral neighborhood
- North Beach (Blue Ridge) neighborhood
- North Beacon Hill neighborhood
- North College Park neighborhood
- North Delridge neighborhood
- North Queen Anne neighborhood
- Northgate neighborhood
- Olympic Hills neighborhood
- Orillia neighborhood
- Phinney Ridge neighborhood
- Pike Place neighborhood
- Pinehurst neighborhood
- Portage Bay neighborhood
- Queen Anne neighborhood
- Rainier Valley neighborhood
- Ranier Beach neighborhood
- Ranier View neighborhood
- Ravenna neighborhood
- Riverton neighborhood
- Riverview neighborhood
- Roosevelt neighborhood
- Roxhill neighborhood
- Sand Point neighborhood
- Seaview neighborhood
- Seward Park neighborhood
- Skyway (Ranier Beach) neighborhood
- SoDo neighborhood
- South Beacon Hill neighborhood
- South Delridge neighborhood
- South Lake Union neighborhood
- South Park neighborhood
- Southeast Magnolia neighborhood
- Stevens neighborhood
- Sunset Hill neighborhood
- University District (U District) neighborhood
- Victory Heights neighborhood
- View Ridge neighborhood
- Wallingford neighborhood
- Wedgwood neighborhood
- West Queen Anne neighborhood
- West Seattle neighborhood
- West Woodland neighborhood
- Westlake neighborhood
- Whittier Heights neighborhood
- Windermere neighborhood
- Woodland Park neighborhood
- Yesler Terrace neighborhood
Religion statistics for Seattle, WA (based on King County data)
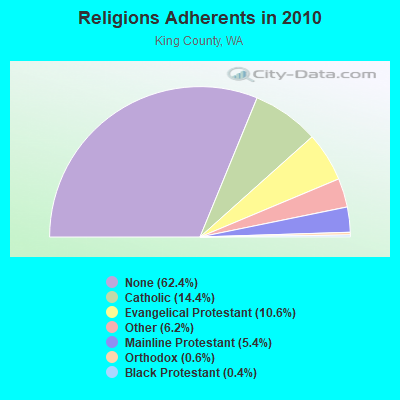
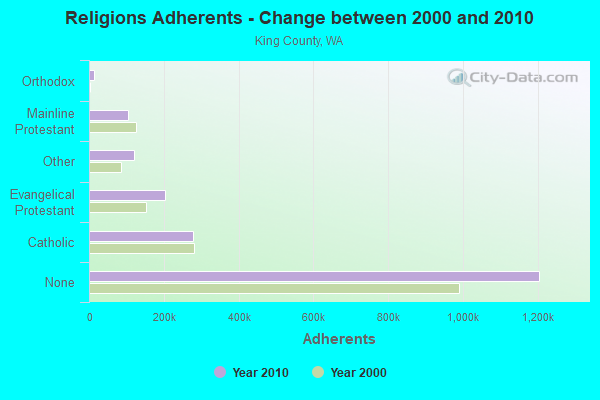
| Religion | Adherents | Congregations |
|---|---|---|
| Catholic | 278,340 | 71 |
| Evangelical Protestant | 204,523 | 711 |
| Other | 119,713 | 329 |
| Mainline Protestant | 104,806 | 304 |
| Orthodox | 12,257 | 20 |
| Black Protestant | 7,030 | 24 |
| None | 1,204,580 | - |
Food Environment Statistics:
| This county: | 2.37 / 10,000 pop. |
| Washington: | 2.06 / 10,000 pop. |
| King County: | 0.16 / 10,000 pop. |
| Washington: | 0.19 / 10,000 pop. |
| King County: | 1.19 / 10,000 pop. |
| Washington: | 1.18 / 10,000 pop. |
| This county: | 2.16 / 10,000 pop. |
| State: | 2.67 / 10,000 pop. |
| Here: | 10.95 / 10,000 pop. |
| Washington: | 8.26 / 10,000 pop. |
| This county: | 6.7% |
| State: | 7.7% |
| King County: | 20.5% |
| Washington: | 25.7% |
| King County: | 14.6% |
| Washington: | 13.9% |
Health and Nutrition:
| Seattle: | 54.1% |
| Washington: | 49.9% |
| This city: | 53.9% |
| State: | 47.2% |
| Here: | 27.6 |
| Washington: | 28.4 |
| Seattle: | 17.8% |
| State: | 20.9% |
| Here: | 10.4% |
| Washington: | 10.5% |
| This city: | 6.9 |
| Washington: | 6.8 |
| This city: | 30.1% |
| State: | 32.8% |
| Seattle: | 61.6% |
| State: | 56.8% |
| This city: | 82.6% |
| State: | 79.4% |
More about Health and Nutrition of Seattle, WA Residents
| Local government employment and payroll (March 2022) | |||||
| Function | Full-time employees | Monthly full-time payroll | Average yearly full-time wage | Part-time employees | Monthly part-time payroll |
|---|---|---|---|---|---|
| Electric Power | 1,571 | $21,328,942 | $162,920 | 107 | $546,120 |
| Financial Administration | 1,196 | $12,880,627 | $129,237 | 87 | $617,551 |
| Firefighters | 1,036 | $13,128,676 | $152,070 | 47 | $98,432 |
| Police Protection - Officers | 993 | $11,864,926 | $143,383 | 0 | $0 |
| Parks and Recreation | 927 | $6,195,421 | $80,200 | 721 | $2,077,424 |
| Streets and Highways | 842 | $7,353,284 | $104,797 | 169 | $863,430 |
| Water Supply | 782 | $8,275,288 | $126,987 | 112 | $677,151 |
| Other and Unallocable | 599 | $5,915,314 | $118,504 | 38 | $212,642 |
| Welfare | 498 | $4,075,611 | $98,207 | 56 | $280,391 |
| Police - Other | 495 | $5,235,024 | $126,910 | 11 | $65,299 |
| Other Government Administration | 365 | $3,662,331 | $120,405 | 54 | $249,307 |
| Judicial and Legal | 345 | $3,255,175 | $113,223 | 32 | $134,005 |
| Local Libraries | 339 | $2,941,843 | $104,136 | 307 | $1,506,267 |
| Sewerage | 303 | $3,208,363 | $127,064 | 45 | $262,532 |
| Solid Waste Management | 187 | $1,993,546 | $127,928 | 25 | $163,131 |
| Fire - Other | 97 | $1,254,110 | $155,148 | 10 | $41,864 |
| Housing and Community Development (Local) | 88 | $805,686 | $109,866 | 16 | $44,936 |
| Correction | 32 | $282,254 | $105,845 | 6 | $27,783 |
| Totals for Government | 10,695 | $113,656,420 | $127,525 | 1,843 | $7,868,265 |
Seattle government finances - Expenditure in 2021 (per resident):
- Construction - Regular Highways: $270,279,000 ($360.73)
Electric Utilities: $236,700,000 ($315.91)
Sewerage: $134,569,000 ($179.60)
Water Utilities: $67,420,000 ($89.98)
Parks and Recreation: $61,583,000 ($82.19)
General - Other: $51,359,000 ($68.55)
Libraries: $9,986,000 ($13.33)
Housing and Community Development: $9,788,000 ($13.06)
Police Protection: $4,103,000 ($5.48)
Solid Waste Management: $1,439,000 ($1.92)
Local Fire Protection: $998,000 ($1.33)
Health - Other: $30,000 ($0.04)
Central Staff Services: $12,000 ($0.02)
- Current Operations - Electric Utilities: $730,500,000 ($974.97)
Police Protection: $264,968,000 ($353.64)
Parks and Recreation: $248,392,000 ($331.52)
General - Other: $233,417,000 ($311.53)
Local Fire Protection: $219,629,000 ($293.13)
Regular Highways: $217,611,000 ($290.44)
Solid Waste Management: $152,726,000 ($203.84)
Public Welfare - Other: $117,486,000 ($156.80)
Sewerage: $116,657,000 ($155.70)
Water Utilities: $112,855,000 ($150.62)
Housing and Community Development: $110,866,000 ($147.97)
Central Staff Services: $95,152,000 ($127.00)
Elementary and Secondary Education: $86,076,000 ($114.88)
Libraries: $71,371,000 ($95.26)
Judicial and Legal Services: $58,708,000 ($78.36)
Protective Inspection and Regulation - Other: $48,953,000 ($65.34)
Public Welfare, Vendor Payments for Other Purposes: $47,611,000 ($63.54)
Natural Resources - Other: $29,640,000 ($39.56)
Health - Other: $15,131,000 ($20.19)
Financial Administration: $12,516,000 ($16.70)
Parking Facilities: $6,868,000 ($9.17)
- Electric Utilities - Interest on Debt: $111,000,000 ($148.15)
- General - Interest on Debt: $88,572,000 ($118.21)
- Intergovernmental to Local - Other - Sewerage: $167,490,000 ($223.54)
Other - Correctional Institutions: $7,851,000 ($10.48)
Other - Judicial and Legal Services: $6,883,000 ($9.19)
Other - Central Staff Services: $2,484,000 ($3.32)
- Other Capital Outlay - Electric Utilities: $78,900,000 ($105.30)
Sewerage: $14,029,000 ($18.72)
Water Utilities: $7,911,000 ($10.56)
Parks and Recreation: $6,844,000 ($9.13)
Local Fire Protection: $4,344,000 ($5.80)
Regular Highways: $3,099,000 ($4.14)
Housing and Community Development: $2,463,000 ($3.29)
Police Protection: $327,000 ($0.44)
Libraries: $262,000 ($0.35)
General - Other: $246,000 ($0.33)
Judicial and Legal Services: $97,000 ($0.13)
Natural Resources - Other: $16,000 ($0.02)
Central Staff Services: $9,000 ($0.01)
Health - Other: $7,000 ($0.01)
- Total Salaries and Wages: $17,294,000 ($23.08)
- Water Utilities - Interest on Debt: $36,479,000 ($48.69)
Seattle government finances - Revenue in 2021 (per resident):
- Charges - Sewerage: $460,295,000 ($614.34)
Solid Waste Management: $224,067,000 ($299.05)
Regular Highways: $148,390,000 ($198.05)
Other: $79,184,000 ($105.68)
Parks and Recreation: $38,614,000 ($51.54)
Parking Facilities: $21,655,000 ($28.90)
Housing and Community Development: $18,054,000 ($24.10)
- Federal Intergovernmental - Other: $114,445,000 ($152.74)
Highways: $38,672,000 ($51.61)
Public Welfare: $29,355,000 ($39.18)
Housing and Community Development: $15,665,000 ($20.91)
Water Utilities: $1,937,000 ($2.59)
Sewerage: $1,632,000 ($2.18)
- Local Intergovernmental - Public Welfare: $6,345,000 ($8.47)
Other: $4,013,000 ($5.36)
Housing and Community Development: $1,473,000 ($1.97)
Highways: $1,206,000 ($1.61)
- Miscellaneous - General Revenue - Other: $84,234,000 ($112.42)
Interest Earnings: $69,685,000 ($93.01)
Special Assessments: $22,165,000 ($29.58)
Fines and Forfeits: $21,854,000 ($29.17)
Sale of Property: $18,354,000 ($24.50)
Donations From Private Sources: $17,928,000 ($23.93)
Rents: $7,149,000 ($9.54)
- Revenue - Electric Utilities: $1,018,800,000 ($1359.75)
Water Utilities: $278,578,000 ($371.81)
- State Intergovernmental - Public Welfare: $60,998,000 ($81.41)
Electric Utilities: $52,800,000 ($70.47)
Highways: $48,180,000 ($64.30)
Sewerage: $21,686,000 ($28.94)
Other: $19,337,000 ($25.81)
General Local Government Support: $10,936,000 ($14.60)
Water Utilities: $5,139,000 ($6.86)
Housing and Community Development: $1,691,000 ($2.26)
- Tax - Property: $732,657,000 ($977.85)
Other Selective Sales: $291,580,000 ($389.16)
General Sales and Gross Receipts: $287,486,000 ($383.70)
Other License: $139,865,000 ($186.67)
Documentary and Stock Transfer: $76,646,000 ($102.30)
Motor Vehicle License: $67,040,000 ($89.48)
Public Utilities Sales: $45,340,000 ($60.51)
Occupation and Business License - Other: $24,342,000 ($32.49)
Amusements Sales: $1,741,000 ($2.32)
Other: $274,000 ($0.37)
Seattle government finances - Debt in 2021 (per resident):
- Long Term Debt - Beginning Outstanding - Unspecified Public Purpose: $5,538,379,000 ($7391.84)
Outstanding Unspecified Public Purpose: $5,428,484,000 ($7245.17)
Retired Unspecified Public Purpose: $438,176,000 ($584.81)
Issue, Unspecified Public Purpose: $328,281,000 ($438.14)
Seattle government finances - Cash and Securities in 2021 (per resident):
- Bond Funds - Cash and Securities: $190,337,000 ($254.03)
- Other Funds - Cash and Securities: $2,215,294,000 ($2956.66)
- Sinking Funds - Cash and Securities: $239,753,000 ($319.99)
6.69% of this county's 2021 resident taxpayers lived in other counties in 2020 ($106,002 average adjusted gross income)
| Here: | 6.69% |
| Washington average: | 7.53% |
0.02% of residents moved from foreign countries ($181 average AGI)
King County: 0.02% Washington average: 0.05%
Top counties from which taxpayers relocated into this county between 2020 and 2021:
| from Snohomish County, WA | |
| from Pierce County, WA | |
| from Los Angeles County, CA |
7.71% of this county's 2020 resident taxpayers moved to other counties in 2021 ($123,052 average adjusted gross income)
| Here: | 7.71% |
| Washington average: | 7.40% |
0.01% of residents moved to foreign countries ($183 average AGI)
King County: 0.01% Washington average: 0.04%
Top counties to which taxpayers relocated from this county between 2020 and 2021:
| to Snohomish County, WA | |
| to Pierce County, WA | |
| to Maricopa County, AZ |
| Businesses in Seattle, WA | ||||
| Name | Count | Name | Count | |
|---|---|---|---|---|
| 24 Hour Fitness | 6 | KFC | 9 | |
| 7-Eleven | 38 | Kmart | 1 | |
| ALDO | 2 | Kroger | 22 | |
| AMF Bowling | 1 | LA Fitness | 2 | |
| AT&T | 15 | La Quinta | 2 | |
| Abercrombie & Fitch | 2 | Lane Bryant | 1 | |
| Abercrombie Kids | 1 | Lane Furniture | 5 | |
| Ace Hardware | 6 | LensCrafters | 2 | |
| Aeropostale | 1 | Levi Strauss & Co. | 1 | |
| Aerosoles | 1 | Little Caesars Pizza | 4 | |
| Albertsons | 4 | Lowe's | 2 | |
| American Eagle Outfitters | 4 | Macy's | 2 | |
| Ann Taylor | 3 | Marriott | 8 | |
| Apple Store | 1 | Marshalls | 1 | |
| Applebee's | 1 | MasterBrand Cabinets | 20 | |
| Arby's | 3 | Mazda | 1 | |
| Audi | 1 | McDonald's | 19 | |
| AutoZone | 2 | Men's Wearhouse | 2 | |
| Avenue | 1 | Motel 6 | 3 | |
| BMW | 1 | Motherhood Maternity | 4 | |
| Banana Republic | 3 | New Balance | 21 | |
| Barnes & Noble | 3 | Nike | 46 | |
| Baskin-Robbins | 13 | Nordstrom | 4 | |
| Bath & Body Works | 2 | Office Depot | 4 | |
| Bebe | 1 | OfficeMax | 1 | |
| Bed Bath & Beyond | 3 | Old Navy | 1 | |
| Ben & Jerry's | 1 | Outback Steakhouse | 2 | |
| Best Western | 4 | Pac Sun | 1 | |
| Blockbuster | 10 | Panda Express | 3 | |
| Brooks Brothers | 1 | Panera Bread | 2 | |
| Brookstone | 2 | Papa John's Pizza | 3 | |
| Budget Car Rental | 4 | Payless | 4 | |
| Burger King | 7 | Penske | 2 | |
| Cache | 1 | PetSmart | 1 | |
| Chevrolet | 3 | Pier 1 Imports | 2 | |
| Chico's | 3 | Pizza Hut | 9 | |
| Chipotle | 3 | Pottery Barn | 1 | |
| Cinnabon | 1 | Pottery Barn Kids | 1 | |
| Circle K | 2 | Qdoba Mexican Grill | 5 | |
| Clarion | 1 | Quality | 2 | |
| Clarks | 2 | Quiznos | 9 | |
| Cold Stone Creamery | 1 | RadioShack | 13 | |
| Comfort Inn | 1 | Red Robin | 2 | |
| Comfort Suites | 1 | Red Roof Inn | 1 | |
| Costco | 2 | Rite Aid | 10 | |
| Crate & Barrel | 1 | Rodeway Inn | 1 | |
| Curves | 7 | SAS Shoes | 1 | |
| DHL | 16 | Safeway | 19 | |
| Dairy Queen | 2 | Sam's Club | 1 | |
| Days Inn | 3 | Sears | 4 | |
| Dennys | 3 | Sephora | 4 | |
| Discount Tire | 2 | Sheraton | 1 | |
| Domino's Pizza | 6 | Skechers USA | 1 | |
| DressBarn | 1 | Soma Intimates | 1 | |
| Econo Lodge | 1 | Spencer Gifts | 1 | |
| Eddie Bauer | 3 | Sprint Nextel | 7 | |
| Express | 3 | Staples | 3 | |
| Extended Stay America | 1 | Starbucks | 99 | |
| FedEx | 132 | Subaru | 1 | |
| Finish Line | 2 | Subway | 40 | |
| Firestone Complete Auto Care | 6 | Super 8 | 1 | |
| Foot Locker | 1 | T-Mobile | 24 | |
| Ford | 2 | T.J.Maxx | 1 | |
| Forever 21 | 2 | Taco Bell | 9 | |
| GNC | 10 | Target | 2 | |
| GameStop | 4 | The Cheesecake Factory | 1 | |
| Gap | 3 | The Limited | 1 | |
| Gymboree | 3 | The Room Place | 1 | |
| H&M | 2 | Torrid | 1 | |
| H&R Block | 22 | Toyota | 2 | |
| Haworth | 1 | Toys"R"Us | 1 | |
| Hilton | 11 | Trader Joe's | 4 | |
| Holiday Inn | 6 | Travelodge | 5 | |
| Hollister Co. | 2 | True Value | 6 | |
| Home Depot | 4 | U-Haul | 19 | |
| Honda | 1 | UPS | 124 | |
| Hyatt | 1 | Urban Outfitters | 3 | |
| IHOP | 2 | Vans | 14 | |
| J.Crew | 3 | Verizon Wireless | 5 | |
| JCPenney | 2 | Victoria's Secret | 5 | |
| Jack In The Box | 9 | Volkswagen | 2 | |
| Jamba Juice | 3 | Vons | 19 | |
| Jimmy John's | 11 | Walgreens | 14 | |
| JoS. A. Bank | 1 | Wendy's | 5 | |
| Johnny Rockets | 2 | Westin | 1 | |
| Jones New York | 9 | Wet Seal | 2 | |
| Journeys | 2 | Whole Foods Market | 3 | |
| Juicy Couture | 1 | YMCA | 7 | |
| Justice | 1 | |||
Strongest AM radio stations in Seattle:
- KIXI (880 AM; 50 kW; MERCER ISLAND/SEATTL, WA; Owner: BELLEVUE RADIO, INC.)
- KKOL (1300 AM; 50 kW; SEATTLE, WA; Owner: INSPIRATION MEDIA, INC.)
- KOMO (1000 AM; 50 kW; SEATTLE, WA; Owner: FISHER BROADCASTING - SEATTLE RADIO, L.L.C.)
- KGNW (820 AM; 50 kW; BURIEN-SEATTLE, WA; Owner: INSPIRATION MEDIA, INC.)
- KIRO (710 AM; 50 kW; SEATTLE, WA; Owner: ENTERCOM SEATTLE LICENSE, LLC)
- KTTH (770 AM; 50 kW; SEATTLE, WA; Owner: ENTERCOM SEATTLE LICENSE, LLC)
- KBLE (1050 AM; 5 kW; SEATTLE, WA; Owner: SACRED HEART RADIO, INC.)
- KKDZ (1250 AM; 5 kW; SEATTLE, WA; Owner: WMAL, INC.)
- KYCW (1090 AM; 50 kW; SEATTLE, WA; Owner: INFINITY RADIO SUBSIDIARY OPERATIONS INC.)
- KKNW (1150 AM; 10 kW; SEATTLE, WA; Owner: ORCA RADIO, INC.)
- KRKO (1380 AM; 50 kW; EVERETT, WA; Owner: S-R BROADCASTING, CO.)
- KLFE (1590 AM; 10 kW; SEATTLE, WA; Owner: INSPIRATION MEDIA, INC.)
- KCIS (630 AM; 5 kW; EDMONDS, WA; Owner: CRISTA MINISTRIES)
Strongest FM radio stations in Seattle:
- KQBZ (100.7 FM; SEATTLE, WA; Owner: ENTERCOM SEATTLE LICENSE, LLC)
- KRWM (106.9 FM; BREMERTON, WA; Owner: SEASCAPE RADIO, INC.)
- KUOW (94.9 FM; SEATTLE, WA; Owner: THE UNIVERSITY OF WASHINGTON)
- KEXP-FM (90.3 FM; SEATTLE, WA; Owner: UNIVERSITY OF WASHINGTON BOARD OF REGENTS)
- K277AE (103.3 FM; SEATTLE, WA; Owner: ENTERCOM SEATTLE LICENSE, LLC)
- KISW (99.9 FM; SEATTLE, WA; Owner: ENTERCOM SEATTLE LICENSE, LLC)
- KMTT (103.7 FM; TACOMA, WA; Owner: ENTERCOM SEATTLE LICENSE, LLC)
- KNDD (107.7 FM; SEATTLE, WA; Owner: ENTERCOM SEATTLE LICENSE, LLC)
- KYPT (96.5 FM; SEATTLE, WA; Owner: INFINITY RADIO SUBSIDIARY OPERATIONS INC.)
- KBSG-FM (97.3 FM; TACOMA, WA; Owner: ENTERCOM SEATTLE LICENSE, LLC)
- KCMS (105.3 FM; EDMONDS, WA; Owner: CRISTA MINISTRIES, INC.)
- KJR-FM (95.7 FM; SEATTLE, WA; Owner: ACKERLEY MEDIA GROUP, INC.)
- KUBE (93.3 FM; SEATTLE, WA; Owner: ACKERLEY MEDIA GROUP, INC.)
- KBKS (106.1 FM; TACOMA, WA; Owner: INFINITY RADIO SUBSIDIARY OPERATIONS INC.)
- KING-FM (98.1 FM; SEATTLE, WA; Owner: CLASSIC RADIO, INC.)
- KLSY-FM (92.5 FM; BELLEVUE, WA; Owner: BELLEVUE RADIO INC.)
- KPLU-FM (88.5 FM; TACOMA, WA; Owner: PACIFIC LUTHERAN UNIVERSITY, INC.)
- KWJZ (98.9 FM; SEATTLE, WA; Owner: ORCA RADIO, INC.)
- KZOK-FM (102.5 FM; SEATTLE, WA; Owner: INFINITY RADIO SUBSIDIARY OPERATIONS INC.)
- KMPS-FM (94.1 FM; SEATTLE, WA; Owner: INFINITY RADIO SUBSIDIARY OPERATIONS INC.)
TV broadcast stations around Seattle:
- KING-TV (Channel 5; SEATTLE, WA; Owner: KING BROADCASTING COMPANY)
- KOMO-TV (Channel 4; SEATTLE, WA; Owner: FISHER BROADCASTING - SEATTLE TV, L.L.C.)
- KSTW (Channel 11; TACOMA, WA; Owner: UPN TELEVISION STATIONS INC.)
- K57HB (Channel 57; EUREKA, CA; Owner: MS COMMUNICATIONS, LLC)
- KIRO-TV (Channel 7; SEATTLE, WA; Owner: KIRO-TV HOLDINGS, INC.)
- KONG-TV (Channel 16; EVERETT, WA; Owner: KONG-TV, INC.)
- KTWB-TV (Channel 22; SEATTLE, WA; Owner: TRIBUNE TELEVISION HOLDINGS, INC.)
- K58DP (Channel 58; SEATTLE, WA; Owner: WORD OF GOD FELLOWSHIP, INC.)
- KCTS-TV (Channel 9; SEATTLE, WA; Owner: KCTS TELEVISION)
- K68DL (Channel 68; SEATTLE, WA; Owner: THREE ANGELS BROADCASTING NETWORK)
- KHCV (Channel 45; SEATTLE, WA; Owner: NORTH PACIFIC INTERNATIONAL TELEVISION, INC.)
- KWPX (Channel 33; BELLEVUE, WA; Owner: PAXSON COMMUNICATIONS LICENSE COMPANY, LLC)
- KCPQ (Channel 13; TACOMA, WA; Owner: TRIBUNE TELEVISION NORTHWEST, INC.)
- KWDK (Channel 56; TACOMA, WA; Owner: PUGET SOUND EDUCATIONAL TV, INC.)
- KWOG (Channel 51; BELLEVUE, WA; Owner: AFRICAN-AMERICAN BROADCASTING CO.OF BELLEVUE, INC.)
- KBTC-TV (Channel 28; TACOMA, WA; Owner: BATES TECHNICAL COLLEGE)
- K02EO (Channel 2; SEATTLE, WA; Owner: KIRO-TV HOLDINGS, INC.)
Medal of Honor Recipients
Medal of Honor Recipients born in Seattle: James Elms Swett, Robert Edward Galer.
- National Bridge Inventory (NBI) Statistics
- 413Number of bridges
- 21,407ft / 6,525mTotal length
- $5,414,432,000Total costs
- 16,995,808Total average daily traffic
- 1,082,900Total average daily truck traffic
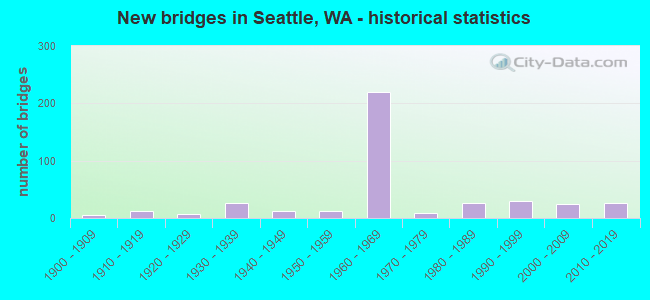
- New bridges - historical statistics
- 61900-1909
- 121910-1919
- 71920-1929
- 261930-1939
- 121940-1949
- 131950-1959
- 2191960-1969
- 91970-1979
- 271980-1989
- 291990-1999
- 252000-2009
- 272010-2019
- 12020-2022
FCC Registered Antenna Towers: 2,273 (See the full list of FCC Registered Antenna Towers)
FCC Registered Commercial Land Mobile Towers: 38 (See the full list of FCC Registered Commercial Land Mobile Towers in Seattle, WA)
FCC Registered Private Land Mobile Towers: 52 (See the full list of FCC Registered Private Land Mobile Towers)
FCC Registered Broadcast Land Mobile Towers: 703 (See the full list of FCC Registered Broadcast Land Mobile Towers)
FCC Registered Microwave Towers: 794 (See the full list of FCC Registered Microwave Towers in this town)
FCC Registered Paging Towers: 66 (See the full list of FCC Registered Paging Towers)
FCC Registered Maritime Coast & Aviation Ground Towers: 209 (See the full list of FCC Registered Maritime Coast & Aviation Ground Towers)
FCC Registered Amateur Radio Licenses: 6,141 (See the full list of FCC Registered Amateur Radio Licenses in Seattle)
FAA Registered Aircraft Manufacturers and Dealers: 2 (See the full list of FAA Registered Manufacturers and Dealers in Seattle)
FAA Registered Aircraft: 1,302 (See the full list of FAA Registered Aircraft)
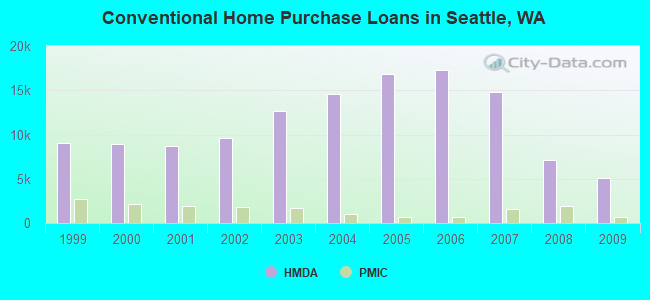
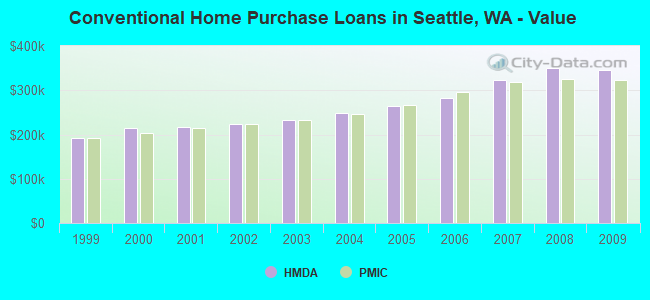
| Home Mortgage Disclosure Act Aggregated Statistics For Year 2009 (Based on 124 full and 1 partial tracts) | ||||||||||||||
| A) FHA, FSA/RHS & VA Home Purchase Loans | B) Conventional Home Purchase Loans | C) Refinancings | D) Home Improvement Loans | E) Loans on Dwellings For 5+ Families | F) Non-occupant Loans on < 5 Family Dwellings (A B C & D) | G) Loans On Manufactured Home Dwelling (A B C & D) | ||||||||
|---|---|---|---|---|---|---|---|---|---|---|---|---|---|---|
| Number | Average Value | Number | Average Value | Number | Average Value | Number | Average Value | Number | Average Value | Number | Average Value | Number | Average Value | |
| LOANS ORIGINATED | 2,297 | $332,498 | 5,074 | $345,851 | 22,167 | $307,443 | 631 | $202,808 | 148 | $2,026,439 | 2,048 | $285,839 | 7 | $269,479 |
| APPLICATIONS APPROVED, NOT ACCEPTED | 119 | $317,071 | 508 | $368,016 | 2,207 | $314,727 | 90 | $111,821 | 2 | $732,500 | 258 | $302,719 | 1 | $69,000 |
| APPLICATIONS DENIED | 210 | $313,078 | 748 | $365,406 | 5,159 | $347,260 | 293 | $174,060 | 32 | $1,253,312 | 696 | $293,726 | 5 | $117,400 |
| APPLICATIONS WITHDRAWN | 247 | $311,299 | 609 | $371,256 | 3,727 | $322,504 | 144 | $184,180 | 16 | $1,425,500 | 458 | $286,354 | 3 | $149,430 |
| FILES CLOSED FOR INCOMPLETENESS | 35 | $328,060 | 98 | $393,367 | 869 | $327,378 | 61 | $233,674 | 3 | $728,000 | 93 | $239,548 | 0 | $0 |
Detailed mortgage data for all 125 tracts in Seattle, WA
| Private Mortgage Insurance Companies Aggregated Statistics For Year 2009 (Based on 121 full and 1 partial tracts) | ||||||
| A) Conventional Home Purchase Loans | B) Refinancings | C) Non-occupant Loans on < 5 Family Dwellings (A & B) | ||||
|---|---|---|---|---|---|---|
| Number | Average Value | Number | Average Value | Number | Average Value | |
| LOANS ORIGINATED | 664 | $324,175 | 398 | $333,822 | 8 | $283,250 |
| APPLICATIONS APPROVED, NOT ACCEPTED | 171 | $322,159 | 150 | $334,196 | 10 | $284,035 |
| APPLICATIONS DENIED | 138 | $309,081 | 119 | $327,168 | 8 | $185,250 |
| APPLICATIONS WITHDRAWN | 67 | $331,866 | 45 | $339,711 | 2 | $150,000 |
| FILES CLOSED FOR INCOMPLETENESS | 16 | $327,695 | 8 | $349,750 | 4 | $321,500 |
2003 - 2018 National Fire Incident Reporting System (NFIRS) incidents
- Fire incident types reported to NFIRS in Seattle, WA
- 13,33249.6%Outside Fires
- 7,94629.6%Structure Fires
- 4,32216.1%Mobile Property/Vehicle Fires
- 1,2884.8%Other
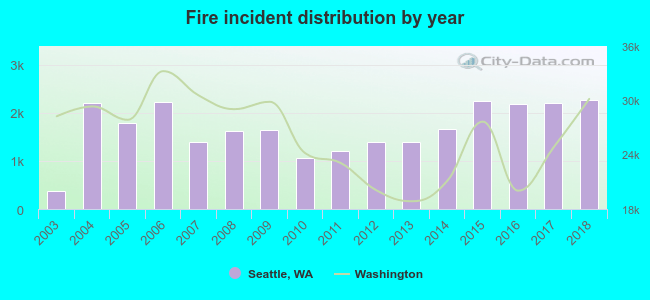 Based on the data from the years 2003 - 2018 the average number of fire incidents per year is 1679. The highest number of fire incidents - 2,262 took place in 2018, and the least - 373 in 2003. The data has a rising trend.
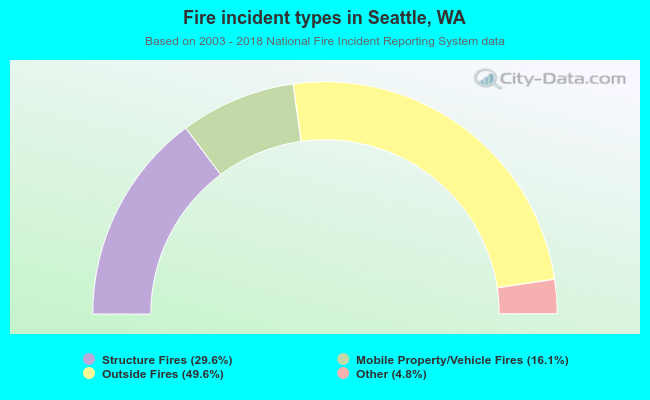 When looking into fire subcategories, the most reports belonged to: Outside Fires (49.6%), and Structure Fires (29.6%).
Fire-safe hotels and motels in Seattle, Washington:
- Crowne Plaza Seattle, 1113 6TH Ave, Seattle, Washington 98101 , Phone: (206) 464-1980, Fax: (206) 340-1617
- Best Western Airport Executel, 20717 Pacific Hwy S, Seattle, Washington 98198 , Phone: (206) 878-3300, Fax: (206) 824-9000
- The Roosevelt Hotel, 1531 7TH Ave, Seattle, Washington 98101 , Phone: (206) 621-1200, Fax: (206) 233-0335
- The Fairmont Olympic Hotel, 411 University St, Seattle, Washington 98101 , Phone: (206) 621-1700, Fax: (206) 623-2271
- Airport Plaza Hotel, 18601 Pacific Hwy S, Seattle, Washington 98188 , Phone: (206) 433-0400
- Hilton Seattle Airport & Conference Center, 17620 Pacific Hwy S, Seattle, Washington 98188 , Phone: (206) 244-4800, Fax: (206) 248-4495
- Residence Inn Seattle Downtown Lake Union, 800 Fairview Ave N, Seattle, Washington 98109 , Phone: (206) 624-6000, Fax: (206) 223-8160
- Alexis Hotel & Restaurant, 1007 First Ave, Seattle, Washington 98104 , Phone: (206) 624-4844, Fax: (206) 621-9009
- 89 other hotels and motels
| Most common first names in Seattle, WA among deceased individuals | ||
| Name | Count | Lived (average) |
|---|---|---|
| John | 5,753 | 75.0 years |
| William | 4,555 | 74.7 years |
| Mary | 4,196 | 80.6 years |
| Robert | 3,879 | 71.1 years |
| James | 3,411 | 71.8 years |
| George | 2,987 | 76.5 years |
| Charles | 2,719 | 74.8 years |
| Helen | 2,521 | 81.3 years |
| Margaret | 2,444 | 80.6 years |
| Dorothy | 2,073 | 79.2 years |
| Most common last names in Seattle, WA among deceased individuals | ||
| Last name | Count | Lived (average) |
|---|---|---|
| Johnson | 2,582 | 77.1 years |
| Smith | 2,074 | 76.6 years |
| Anderson | 1,716 | 77.5 years |
| Brown | 1,093 | 75.6 years |
| Nelson | 1,051 | 78.2 years |
| Miller | 1,031 | 76.3 years |
| Williams | 1,022 | 74.5 years |
| Jones | 1,013 | 74.3 years |
| Peterson | 840 | 79.2 years |
| Wilson | 782 | 76.8 years |
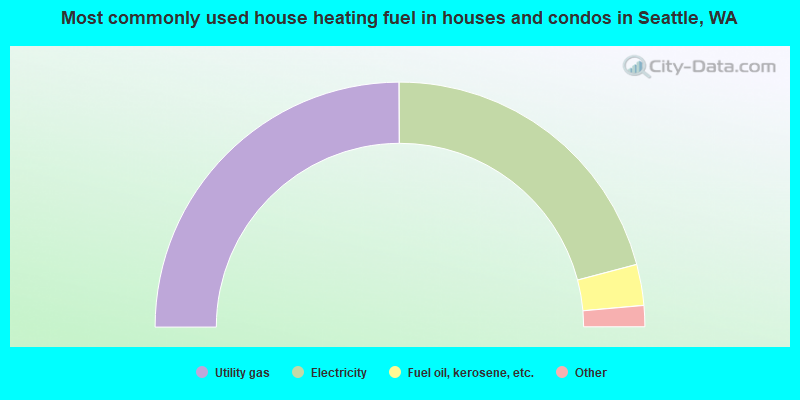
- 49.9%Utility gas
- 41.9%Electricity
- 5.4%Fuel oil, kerosene, etc.
- 1.3%Bottled, tank, or LP gas
- 0.6%Solar energy
- 0.5%Other fuel
- 0.2%No fuel used
- 0.2%Wood
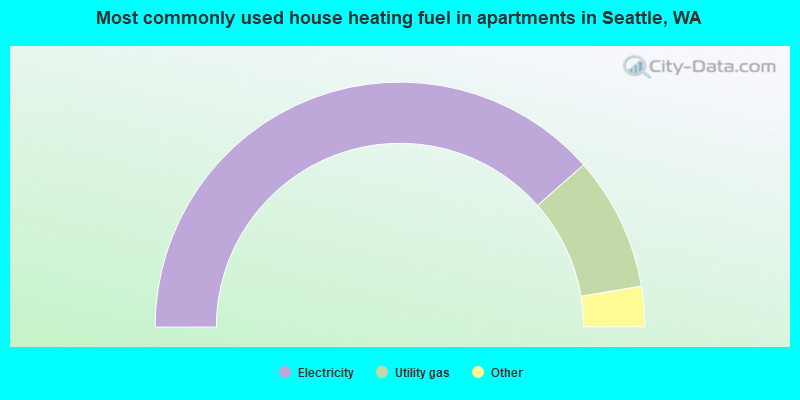
- 77.0%Electricity
- 17.7%Utility gas
- 2.6%No fuel used
- 1.1%Bottled, tank, or LP gas
- 0.9%Fuel oil, kerosene, etc.
- 0.6%Other fuel
Seattle compared to Washington state average:
- Median house value above state average.
- Unemployed percentage significantly below state average.
- Black race population percentage above state average.
- Foreign-born population percentage above state average.
- Number of rooms per house below state average.
- Number of college students above state average.
- Percentage of population with a bachelor's degree or higher significantly above state average.
Seattle, WA compared to other similar cities:
Seattle on our top lists:
- #4 on the list of "Top 101 cities with the largest percentage of likely homosexual households (counted as self-reported same-sex unmarried-partner households) (population 50,000+)"
- #4 on the list of "Top 101 cities with the most people taking a bus, a trolley bus, a streetcar, or a trolley car to work (population 5,000+)"
- #5 on the list of "Top 101 cities with the lowest maximum monthly sunshine amount (population 50,000+)"
- #5 on the list of "Top 101 cities with the lowest minimum monthly sunshine amount (population 50,000+)"
- #5 on the list of "Top 101 cities with the lowest average sunshine amount (population 50,000+)"
- #6 on the list of "Top 101 cities with the largest percentage of likely lesbian couples (counted as self-reported female-female unmarried-partner households) (population 50,000+)"
- #8 on the list of "Top 101 cities with the largest percentage of likely gay men couples (counted as self-reported male-male unmarried-partner households) (population 50,000+)"
- #12 on the list of "Top 101 cities with the lowest percentage of family households, population 100,000+"
- #13 on the list of "Top 101 cities with the most mentions on city-data.com forum"
- #16 on the list of "Top 101 cities with the highest average humidity (population 50,000+)"
- #18 on the list of "Top 101 cities with the lowest average wind speeds (population 50,000+)"
- #19 on the list of "Top 101 cities with the highest maximum monthly morning or afternoon humidity (population 50,000+)"
- #22 on the list of "Top 101 larger cities with the highest increase in household income from 2000 (population 50,000+)"
- #23 on the list of "Top 101 cities with largest percentage of females in occupations: arts, design, entertainment, sports, and media occupations (population 50,000+)"
- #25 on the list of "Top 100 biggest cities"
- #25 on the list of "Top 101 cities with the largest percentage of people in crews of maritime vessels (population 1,000+)"
- #26 on the list of "Top 101 biggest cities in 2013"
- #28 on the list of "Top 101 cities with largest percentage of males in occupations: computer and mathematical occupations (population 50,000+)"
- #32 on the list of "Top 101 cities with the largest percentage of high school students in private schools (3,000+ students)"
- #33 on the list of "Top 101 cities with largest percentage of males in occupations: arts, design, entertainment, sports, and media occupations (population 50,000+)"
- #1 (98174) on the list of "Top 101 zip codes with the largest percentage of French Canadian first ancestries"
- #17 (98101) on the list of "Top 101 zip codes with the most finance and insurance companies in 2005"
- #23 (98101) on the list of "Top 101 zip codes with the most medium-big companies in 2005 (at least 100 employees)"
- #26 (98109) on the list of "Top 101 zip codes with the most Internet business establishments in 2005"
- #29 (98104) on the list of "Top 101 zip codes with the most offices of lawyers in 2005"
- #33 (98102) on the list of "Top 101 zip codes with the smallest percentage of taxpayers using paid preparers for 2012 taxes (pop 5,000+)"
- #38 (98103) on the list of "Top 101 zip codes with the most full service restaurants in 2005"
- #60 (98133) on the list of "Top 101 zip codes with the most casinos in 2005"
- #61 (98104) on the list of "Top 101 zip codes with the highest 2012 average net capital gain/loss (pop 5,000+)"
- #77 (98103) on the list of "Top 101 zip codes with the most alcohol drinking places in 2005"
- #5 on the list of "Top 101 counties with the most Mainline Protestant congregations"
- #8 on the list of "Top 101 counties with the lowest Ozone (1-hour) air pollution readings in 2012 (ppm)"
- #9 on the list of "Top 101 counties with the most Other congregations"
- #11 on the list of "Top 101 counties with the most Mainline Protestant adherents"
- #11 on the list of "Top 101 counties with the highest percentage of residents that exercised in the past month"
State forum archive:
- Washington Pages: 2 3 4 5 6 7 8 9 10 11 12 13 14 15 16 17 18 19 20 21 22 23 24 25 26 27 28 29 30 31 32 33 34 35 36 37 38 39
- Seattle area Pages: 2 3 4 5 6 7 8 9 10 11 12 13 14 15 16 17 18 19 20 21 22 23 24 25 26 27 28 29 30 31 32 33 34 35 36 37 38 39 40 41 42 43 44 45 46 47 48 49 50 51 52 53 54 55 56 57 58 59 60 61 62 63 64 65 66 67 68 69 70 71 72 73 74 75 76 77 78 79 80 81
- Spokane area Pages: 2 3 4 5 6 7 8
- Tri-Cities Pages: 2 3 4 5
- Vancouver area Pages: 2 3 4 5 6 7 8 9

|
|
Total of 29092 patent applications in 2008-2024.


