Pierce County, Washington (WA)
County owner-occupied free and clear houses and condos in 2010: 40,418
County owner-occupied houses and condos in 2000: 165,623
Renter-occupied apartments: 110,838 (it was 95,177 in 2000)
| % of renters here: | 36% |
| State: | 36% |
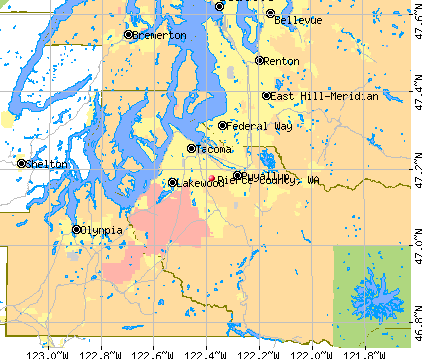
Land area: 1679 sq. mi.
Water area: 127.6 sq. mi.
Population density: 552 people per square mile (high).
Industries providing employment: Educational, health and social services (22.2%), Retail trade (12.6%), Professional, scientific, management, administrative, and waste management services (10.5%).
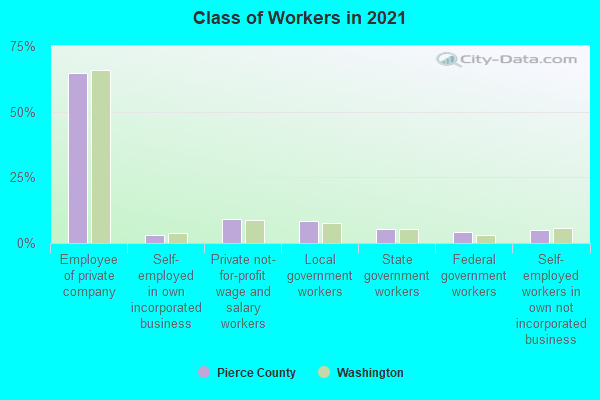
Type of workers:
- Private wage or salary: 74%
- Government: 22%
- Self-employed, not incorporated: 4%
- Unpaid family work: 0%
- OSM Map
- General Map
- Google Map
- MSN Map

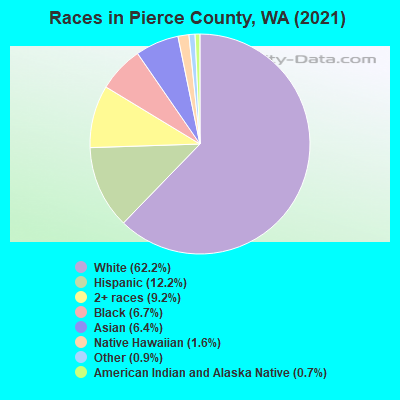
- 569,85161.4%White Non-Hispanic Alone
- 116,54512.6%Hispanic or Latino
- 88,6949.6%Two or more races
- 62,6226.8%Black Non-Hispanic Alone
- 61,1136.6%Asian alone
- 15,3121.7%Native Hawaiian and Other
Pacific Islander alone - 7,3360.8%American Indian and Alaska Native alone
- 5,9070.6%Some other race alone
| Median resident age: | 37.0 years |
| Washington median age: | 38.4 years |
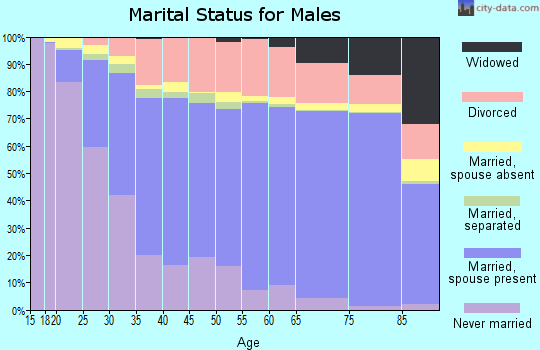
| Males: 466,724 | |
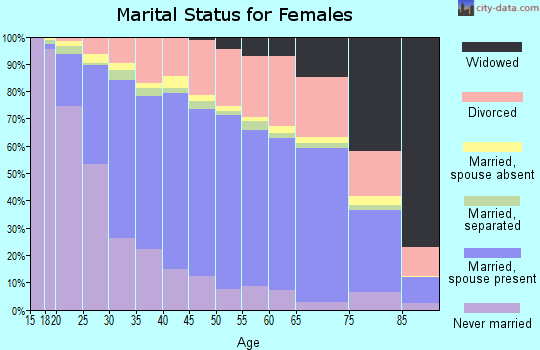
| Females: 460,656 |

 | Possible Move to Washington State (38 replies) |
| New airport near Tumwater? (47 replies) |
| Finally an opportunity...Eastern Washington Independence (52 replies) |
| Which is more accurate, if you love Seattle you’d love Anchorage or you’d love San Francisco? (26 replies) |
| $30 Car Tabs Struck Down (60 replies) |
| Finally accepted my fate ..... moving to the Seattle area soon for work (74 replies) |
| Pierce County: | 2.0 people |
| Washington: | 3 people |
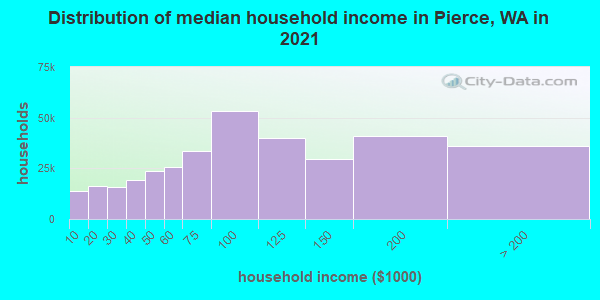
Estimated median household income in 2022: $93,420 ($45,204 in 1999)
| This county: | $93,420 |
| Washington: | $91,306 |
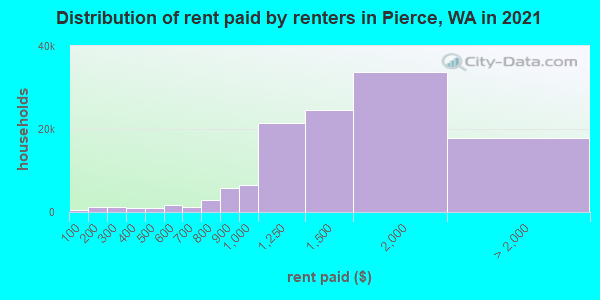
Median contract rent in 2022 for apartments: $1,561 (lower quartile is $1,174, upper quartile is $1,938)
| This county: | $1561 |
| State: | $1495 |
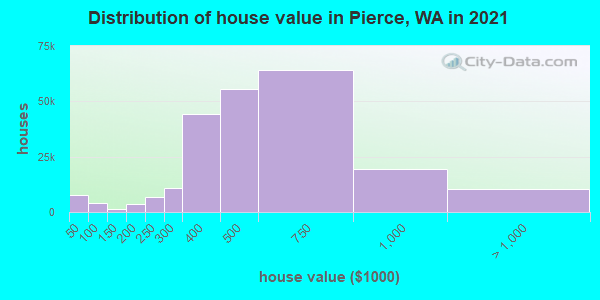
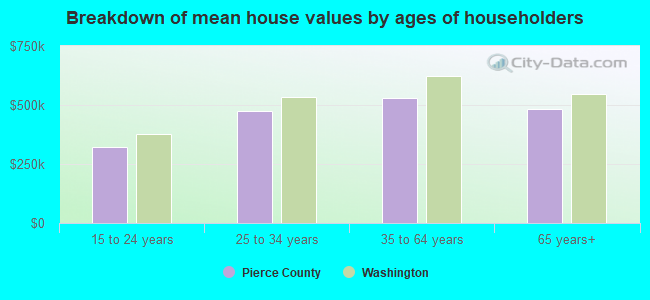
Estimated median house or condo value in 2022: $538,500 (it was $144,400 in 2000)
| Pierce: | $538,500 |
| Washington: | $569,500 |
Mean price in 2022:
Median monthly housing costs for homes and condos with a mortgage: $2,208Detached houses: $606,667
Here: $606,667 State: $734,307 Townhouses or other attached units: $534,248
Here: $534,248 State: $657,697 In 2-unit structures: $606,121
Here: $606,121 State: $534,634 In 3-to-4-unit structures: $262,548
Here: $262,548 State: $510,239 In 5-or-more-unit structures: $407,089
Here: $407,089 State: $503,183 Mobile homes: $200,236
Here: $200,236 State: $218,362 Occupied boats, RVs, vans, etc.: $40,477
Here: $40,477 State: $159,523
Median monthly housing costs for units without a mortgage: $783
Institutionalized population: 8,874
Crime in 2021 (reported by the sheriff's office or county police, not the county total):
- Murders: 18
- Rapes: 114
- Robberies: 175
- Assaults: 994
- Burglaries: 1866
- Thefts: 4731
- Auto thefts: 1744
Crime in 2020 (reported by the sheriff's office or county police, not the county total):
- Murders: 12
- Rapes: 87
- Robberies: 164
- Assaults: 833
- Burglaries: 1618
- Thefts: 4330
- Auto thefts: 1145
Health of residents in Pierce County based on CDC Behavioral Risk Factor Surveillance System Survey Questionnaires from 2003 to 2012:
General health status score of residents in this county from 1 (poor) to 5 (excellent) is 3.5. This is about average.79.0% of residents exercised in the past month. This is about average.
48.0% of residents smoked 100+ cigarettes in their lives. This is about average.
78.1% of adult residents drank alcohol in the past 30 days. This is about average.
71.8% of residents visited a dentist within the past year. This is about average.
Average weight of males is 199 pounds. This is more than average.
Average weight of females is 168 pounds. This is more than average.
31.3% of residents keep firearms around their homes. This is more than average.
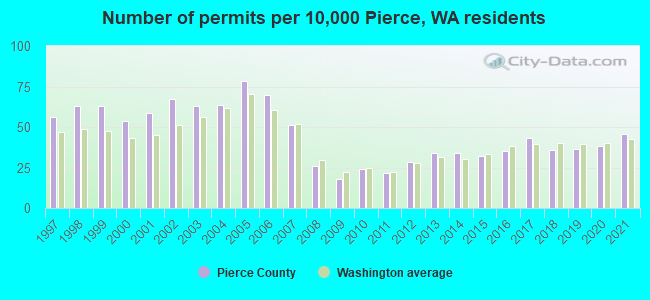
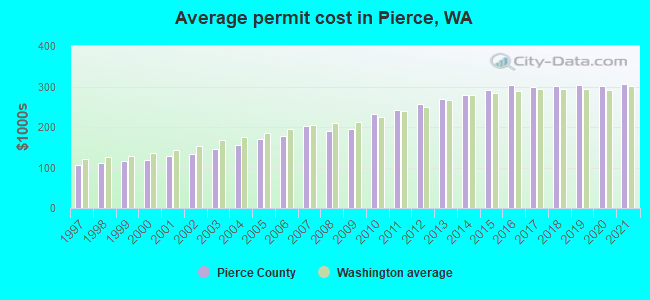
Single-family new house construction building permits:
- 2022: 2322 buildings, average cost: $315,600
- 2021: 3207 buildings, average cost: $305,700
- 2020: 2664 buildings, average cost: $299,900
- 2019: 2551 buildings, average cost: $302,800
- 2018: 2491 buildings, average cost: $301,600
- 2017: 3014 buildings, average cost: $298,900
- 2016: 2469 buildings, average cost: $303,400
- 2015: 2253 buildings, average cost: $291,900
- 2014: 2371 buildings, average cost: $279,900
- 2013: 2369 buildings, average cost: $268,500
- 2012: 2009 buildings, average cost: $256,300
- 2011: 1494 buildings, average cost: $241,600
- 2010: 1708 buildings, average cost: $233,300
- 2009: 1243 buildings, average cost: $195,900
- 2008: 1805 buildings, average cost: $189,800
- 2007: 3571 buildings, average cost: $203,100
- 2006: 4884 buildings, average cost: $178,500
- 2005: 5515 buildings, average cost: $170,600
- 2004: 4466 buildings, average cost: $154,500
- 2003: 4400 buildings, average cost: $146,200
- 2002: 4721 buildings, average cost: $133,300
- 2001: 4107 buildings, average cost: $128,600
- 2000: 3753 buildings, average cost: $118,000
- 1999: 4401 buildings, average cost: $114,700
- 1998: 4419 buildings, average cost: $109,700
- 1997: 3931 buildings, average cost: $106,100
Median real estate property taxes paid for housing units with mortgages in 2022: $4,451 (0.8%)
Median real estate property taxes paid for housing units with no mortgage in 2022: $4,620 (0.9%)
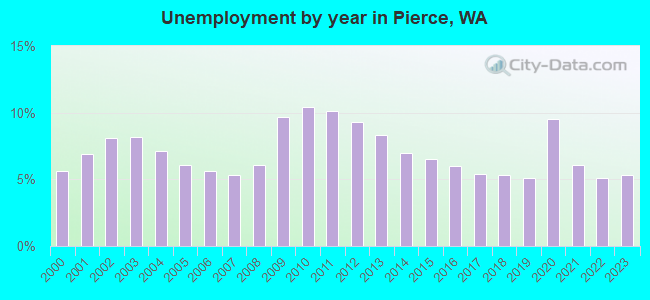
| Pierce County: | 8.9% |
| Washington: | 10.0% |
Median age of residents in 2022: 37.0 years old
(Males: 36.0 years old, Females: 38.1 years old)
(Median age for: White residents: 41.5 years old, Black residents: 36.2 years old, American Indian residents: 26.7 years old, Asian residents: 40.5 years old, Hispanic or Latino residents: 25.5 years old, Other race residents: 31.1 years old)
Area name: Tacoma, WA HUD Metro FMR Area
Fair market rent in 2006 for a 1-bedroom apartment in Pierce County is $621 a month.
Fair market rent for a 2-bedroom apartment is $774 a month.
Fair market rent for a 3-bedroom apartment is $1128 a month.
Cities in this county include: Tacoma, Lakewood, Graham-Thrift, Gig Harbor Peninsula, Puyallup, South Hill, University Place, Parkland, Spanaway, Fort Lewis.
2023 air pollution in Pierce County:
Ozone (1-hour): 0.040 ppm (standard limit: 0.12 ppm). Near U.S. average.
Particulate Matter (PM2.5) Annual: 5.7 µg/m3(standard limit: 15.0 µg/m3). Near U.S. average.
Neighboring counties: Alger County, Michigan  , Douglas County
  , Fergus County, Montana , Thurston County
  , Richland County, Montana , Wibaux County, Montana .
| Here: | 5.5% |
| Washington: | 4.6% |
Current college students: 37,999
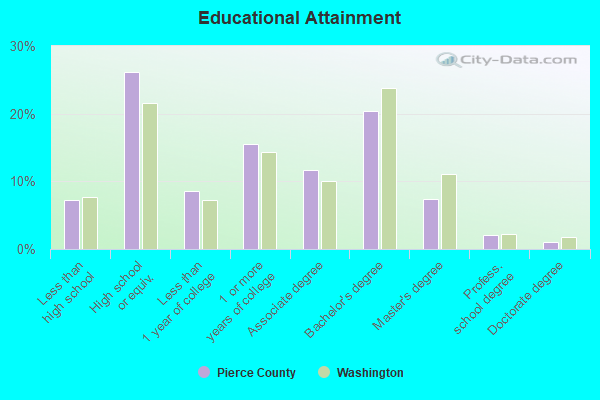
People 25 years of age or older with a high school degree or higher: 92.5%
People 25 years of age or older with a bachelor's degree or higher: 30.4%
Number of foreign born residents: 103,061 (55.1% naturalized citizens)
| Pierce County: | 11.1% |
| Whole state: | 15.3% |
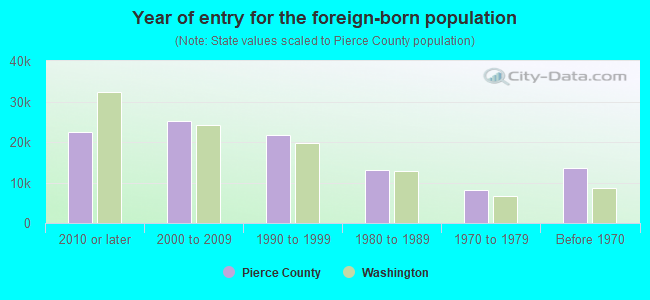
- Year of entry for the foreign-born population
- 32,5622010 or later
- 24,0702000 to 2009
- 20,5231990 to 1999
- 13,2041980 to 1989
- 8,1931970 to 1979
- 13,487Before 1970
Mean travel time to work (commute): minutes
Percentage of county residents living and working in this county: 99.6%
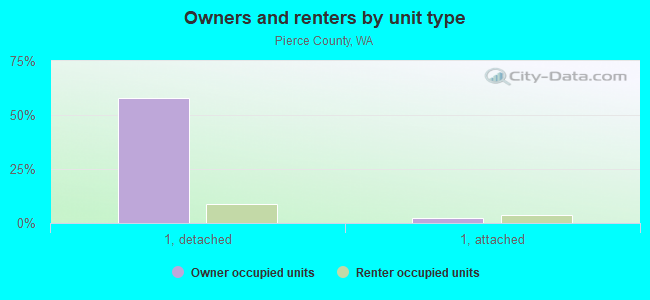
Housing units in structures:
- One, detached: 237,990
- One, attached: 20,924
- Two: 8,839
- 3 or 4: 16,203
- 5 to 9: 19,267
- 10 to 19: 20,544
- 20 to 49: 13,422
- 50 or more: 16,838
- Mobile homes: 16,580
- Boats, RVs, vans, etc.: 542
Housing units in Pierce County with a mortgage: 157,514 (15,122 second mortgage, 658 home equity loan, 12,464 both second mortgage and home equity loan)
Houses without a mortgage: 2,989
| Here: | 98.7% with mortgage |
| State: | 98.0% with mortgage |
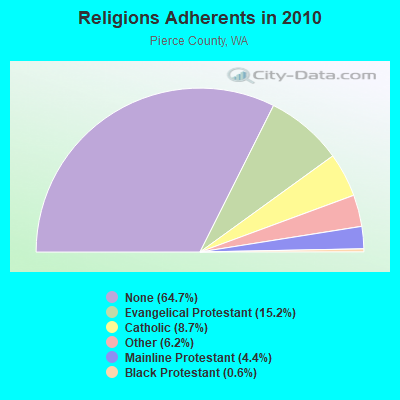
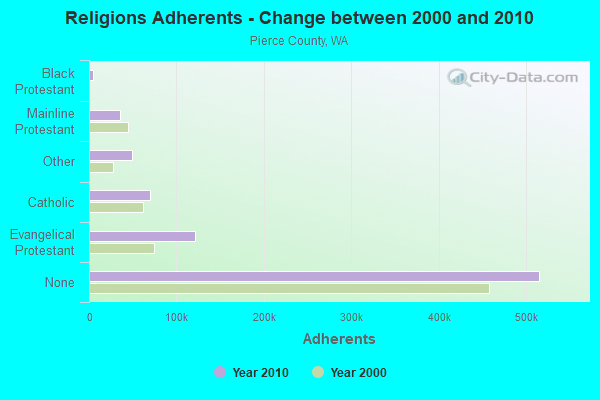
Religion statistics for Pierce County
| Religion | Adherents | Congregations |
|---|---|---|
| Evangelical Protestant | 121,041 | 365 |
| Catholic | 69,558 | 26 |
| Other | 49,446 | 109 |
| Mainline Protestant | 34,906 | 123 |
| Black Protestant | 4,817 | 17 |
| Orthodox | 605 | 4 |
| None | 514,852 | - |
Source: Clifford Grammich, Kirk Hadaway, Richard Houseal, Dale E.Jones, Alexei Krindatch, Richie Stanley and Richard H.Taylor. 2012. 2010 U.S.Religion Census: Religious Congregations & Membership Study. Association of Statisticians of American Religious Bodies. Jones, Dale E., et al. 2002. Congregations and Membership in the United States 2000. Nashville, TN: Glenmary Research Center.
Food Environment Statistics:
| Pierce County: | 1.71 / 10,000 pop. |
| State: | 2.06 / 10,000 pop. |
| Here: | 0.17 / 10,000 pop. |
| Washington: | 0.19 / 10,000 pop. |
| This county: | 1.36 / 10,000 pop. |
| Washington: | 1.18 / 10,000 pop. |
| Pierce County: | 1.97 / 10,000 pop. |
| Washington: | 2.67 / 10,000 pop. |
| This county: | 6.61 / 10,000 pop. |
| State: | 8.26 / 10,000 pop. |
| Pierce County: | 8.4% |
| Washington: | 7.7% |
| Pierce County: | 29.3% |
| State: | 25.7% |
| Here: | 14.1% |
| State: | 13.9% |
Agriculture in Pierce County:
Average size of farms: 39 acresAverage value of agricultural products sold per farm: $63,887
Average value of crops sold per acre for harvested cropland: $2490.61
The value of nursery, greenhouse, floriculture, and sod as a percentage of the total market value of agricultural products sold: 22.32%
The value of livestock, poultry, and their products as a percentage of the total market value of agricultural products sold: 62.87%
Average total farm production expenses per farm: $50,440
Harvested cropland as a percentage of land in farms: 24.53%
Irrigated harvested cropland as a percentage of land in farms: 34.04%
Average market value of all machinery and equipment per farm: $34,726
The percentage of farms operated by a family or individual: 90.71%
Average age of principal farm operators: 56 years
Average number of cattle and calves per 100 acres of all land in farms: 24.62
Milk cows as a percentage of all cattle and calves: 30.33%
Vegetables: 3,386 harvested acres
Land in orchards: 136 acres
Earthquake activity:
Pierce County-area historical earthquake activity is significantly above Washington state average. It is 1391% greater than the overall U.S. average.On 4/13/1949 at 19:55:42, a magnitude 7.0 (7.0 UK, Class: Major, Intensity: VIII - XII) earthquake occurred 7.7 miles away from Pierce County center, causing $80,000,000 total damage
On 2/28/2001 at 18:54:32, a magnitude 6.8 (6.5 MB, 6.6 MS, 6.8 MW, Class: Strong, Intensity: VII - IX) earthquake occurred 10.8 miles away from the county center, causing $2,000,000,000 total damage and $305,000,000 insured losses
On 2/28/2001 at 18:54:32, a magnitude 6.8 (6.8 MD, Depth: 32.2 mi) earthquake occurred 16.2 miles away from the county center
On 4/29/1965 at 15:28:43, a magnitude 6.6 (6.6 UK) earthquake occurred 10.3 miles away from the county center, causing $28,000,000 total damage
On 7/3/1999 at 01:43:54, a magnitude 5.8 (5.4 MB, 5.5 MS, 5.8 MW, 5.3 ME, Depth: 25.2 mi, Class: Moderate, Intensity: VI - VII) earthquake occurred 40.8 miles away from Pierce County center
On 1/31/1922 at 13:17:28, a magnitude 7.6 (7.6 UK) earthquake occurred 474.5 miles away from the county center
Magnitude types: body-wave magnitude (MB), duration magnitude (MD), energy magnitude (ME), surface-wave magnitude (MS), moment magnitude (MW)
Most recent natural disasters:
- Washington Covid-19 Pandemic, Incident Period: January 20, 2020, Major Disaster (Presidential) Declared DR-4481-WA: March 22, 2020, FEMA Id: 4481, Natural disaster type: Other
- Washington Severe Winter Storm, Flooding, Landslides, and Mudslides, Incident Period: January 14, 2012 to January 23, 2012, Major Disaster (Presidential) Declared DR-4056: March 05, 2012, FEMA Id: 4056, Natural disaster type: Winter Storm, Mudslide, Landslide, Flood
- Washington Severe Winter Storm, Landslides, Mudslides, and Flooding, Incident Period: January 06, 2009 to January 16, 2009, Major Disaster (Presidential) Declared DR-1817: January 30, 2009, FEMA Id: 1817, Natural disaster type: Winter Storm, Mudslide, Landslide, Flood
- Washington Severe Winter Storm, Landslides, and Mudslides, Incident Period: December 14, 2006 to December 15, 2006, Major Disaster (Presidential) Declared DR-1682: February 14, 2007, FEMA Id: 1682, Natural disaster type: Winter Storm, Mudslide, Landslide
- Washington Severe Storms, Flooding, Landslides, and Mudslides, Incident Period: November 02, 2006 to November 11, 2006, Major Disaster (Presidential) Declared DR-1671: December 12, 2006, FEMA Id: 1671, Natural disaster type: Storm, Mudslide, Landslide, Flood
- Washington Hurricane Katrina Evacuation, Incident Period: August 29, 2005 to October 01, 2005, Emergency Declared EM-3227: September 07, 2005, FEMA Id: 3227, Natural disaster type: Hurricane
- Washington Severe Storms and Flooding, Incident Period: October 15, 2003 to October 23, 2003, Major Disaster (Presidential) Declared DR-1499: November 07, 2003, FEMA Id: 1499, Natural disaster type: Storm, Flood
- Washington Earthquake, Incident Period: February 28, 2001 to March 16, 2001, Major Disaster (Presidential) Declared DR-1361: March 01, 2001, FEMA Id: 1361, Natural disaster type: Earthquake
- Washington Severe Winter Storms/Flooding, Incident Period: December 26, 1996 to February 10, 1997, Major Disaster (Presidential) Declared DR-1159: January 17, 1997, FEMA Id: 1159, Natural disaster type: Winter Storm, Flood
- Washington Severe Storms/Flooding, Incident Period: January 26, 1996 to February 23, 1996, Major Disaster (Presidential) Declared DR-1100: February 09, 1996, FEMA Id: 1100, Natural disaster type: Storm, Flood
- 11 other natural disasters have been reported since 1953.
The number of natural disasters in Pierce County (21) is greater than the US average (15).
Major Disasters (Presidential) Declared: 20
Emergencies Declared: 1
Causes of natural disasters: Floods: 13, Storms: 10, Mudslides: 5, Landslides: 4, Winter Storms: 4, Earthquakes: 2, Heavy Rains: 2, Winds: 2, Hurricane: 1, Volcanic Eruption: 1, Other: 1 (Note: some incidents may be assigned to more than one category).
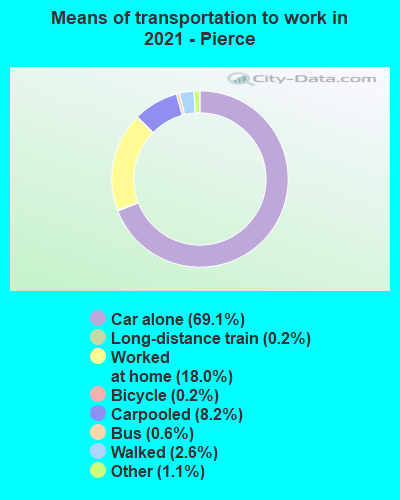
Means of transportation to work:
- Drove a car alone: 282,393 (68.9%)
- Carpooled: 36,629 (8.9%)
- Bus: 3,930 (1.0%)
- Long-distance train or commuter rail: 473 (0.1%)
- Light rail, streetcar or trolley: 86 (0.0%)
- Taxicab, motorcycle, or other means: 3,369 (0.8%)
- Bicycle: 2,013 (0.5%)
- Walked: 12,315 (3.0%)
- Worked at home: 68,558 (16.7%)
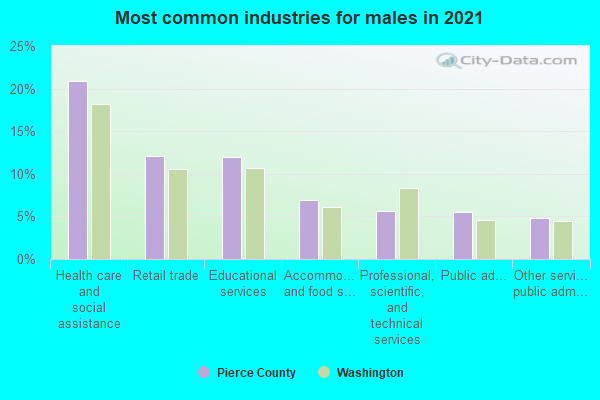
- Health care and social assistance (21%)
- Educational services (12%)
- Retail trade (11%)
- Accommodation and food services (6%)
- Professional, scientific, and technical services (6%)
- Public administration (5%)
- Other services, except public administration (5%)
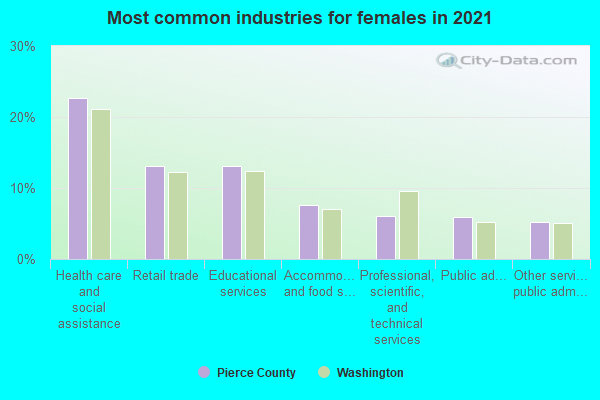
- Health care and social assistance (23%)
- Educational services (13%)
- Retail trade (12%)
- Accommodation and food services (7%)
- Professional, scientific, and technical services (6%)
- Public administration (6%)
- Other services, except public administration (5%)
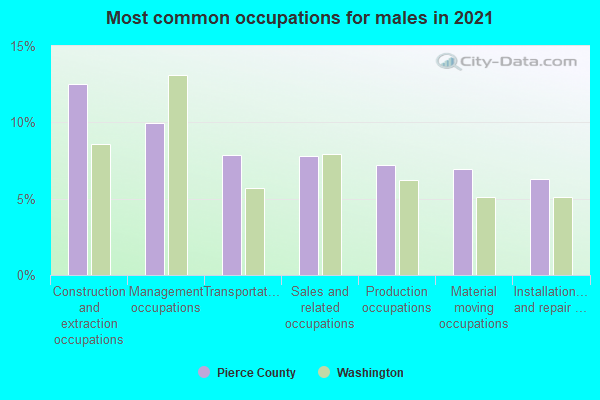
- Management occupations (13%)
- Construction and extraction occupations (11%)
- Sales and related occupations (8%)
- Transportation occupations (8%)
- Material moving occupations (7%)
- Production occupations (6%)
- Office and administrative support occupations (6%)
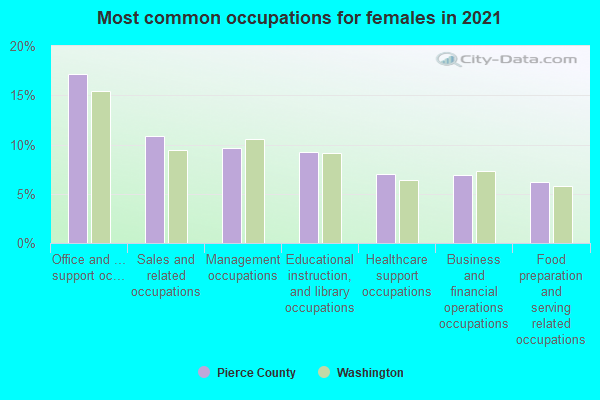
- Office and administrative support occupations (17%)
- Management occupations (10%)
- Sales and related occupations (10%)
- Educational instruction, and library occupations (8%)
- Health diagnosing and treating practitioners and other technical occupations (8%)
- Healthcare support occupations (6%)
- Business and financial operations occupations (6%)
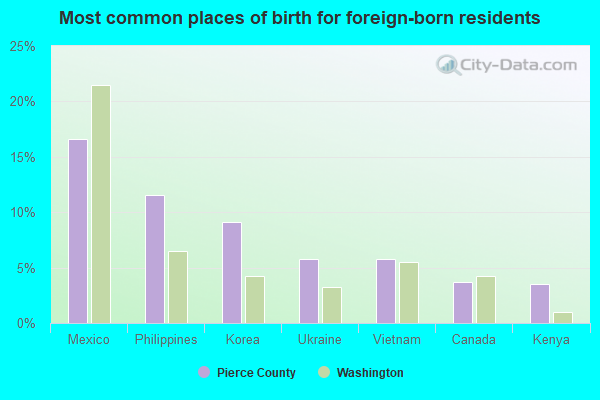
- Mexico (17%)
- Philippines (11%)
- Korea (10%)
- Ukraine (6%)
- Vietnam (5%)
- Canada (3%)
- Kenya (3%)
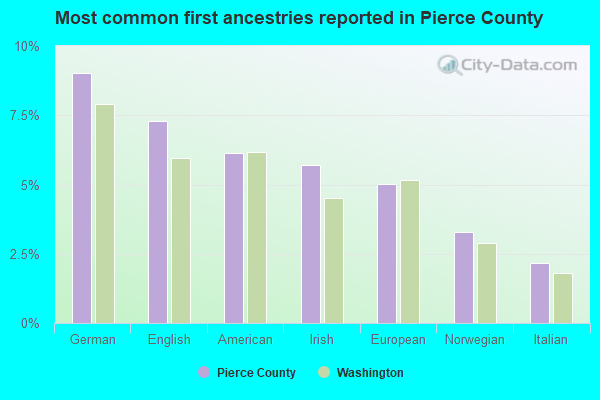
- German (9%)
- English (7%)
- American (7%)
- European (5%)
- Irish (5%)
- Norwegian (3%)
- Italian (2%)
People in group quarters in Pierce County, Washington in 2010:
- 3,294 people in military barracks and dormitories (nondisciplinary)
- 2,656 people in nursing facilities/skilled-nursing facilities
- 2,622 people in state prisons
- 2,459 people in college/university student housing
- 1,270 people in group homes intended for adults
- 1,266 people in local jails and other municipal confinement facilities
- 1,239 people in federal detention centers
- 813 people in other noninstitutional facilities
- 795 people in mental (psychiatric) hospitals and psychiatric units in other hospitals
- 681 people in emergency and transitional shelters (with sleeping facilities) for people experiencing homelessness
- 320 people in workers' group living quarters and job corps centers
- 195 people in residential treatment centers for adults
- 155 people in correctional residential facilities
- 70 people in correctional facilities intended for juveniles
- 46 people in hospitals with patients who have no usual home elsewhere
- 39 people in maritime/merchant vessels
- 12 people in residential treatment centers for juveniles (non-correctional)
- 7 people in group homes for juveniles (non-correctional)
- 6 people in in-patient hospice facilities
People in group quarters in Pierce County, Washington in 2000:
- 6,613 people in military barracks, etc.
- 3,211 people in state prisons
- 2,760 people in college dormitories (includes college quarters off campus)
- 2,602 people in nursing homes
- 1,808 people in other noninstitutional group quarters
- 1,247 people in local jails and other confinement facilities (including police lockups)
- 756 people in other group homes
- 535 people in crews of maritime vessels
- 505 people in homes for the mentally retarded
- 263 people in homes for the mentally ill
- 178 people in short-term care, detention or diagnostic centers for delinquent children
- 176 people in mental (psychiatric) hospitals or wards
- 146 people in halfway houses
- 145 people in hospitals/wards and hospices for chronically ill
- 118 people in wards in general hospitals for patients who have no usual home elsewhere
- 115 people in military disciplinary barracks
- 115 people in homes or halfway houses for drug/alcohol abuse
- 77 people in military hospitals or wards for chronically ill
- 61 people in religious group quarters
- 47 people in other hospitals or wards for chronically ill
- 39 people in other nonhousehold living situations
- 30 people in other types of correctional institutions
- 22 people in other workers' dormitories
- 21 people in hospices or homes for chronically ill
- 16 people in hospitals or wards for drug/alcohol abuse
- 15 people in institutions for the deaf
- 14 people in orthopedic wards and institutions for the physically handicapped
- 10 people in military transient quarters for temporary residents
- 10 people in homes for the physically handicapped
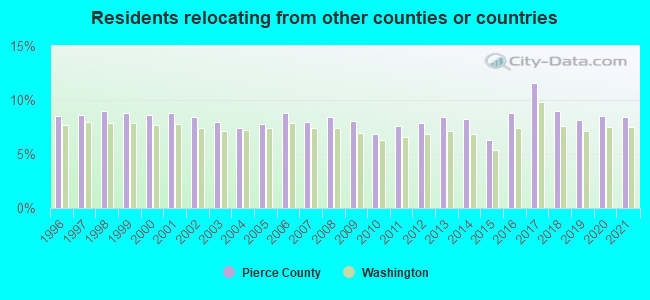
8.45% of this county's 2021 resident taxpayers lived in other counties in 2020 ($69,857 average adjusted gross income)
| Here: | 8.45% |
| Washington average: | 7.53% |
0.15% of residents moved from foreign countries ($1,028 average AGI)
Pierce County: 0.15% Washington average: 0.05%
4.69% relocated from other counties in Washington ($41,677 average AGI)
3.61% relocated from other states ($27,152 average AGI)
Pierce County: 3.61% Washington average: 3.85%
Top counties from which taxpayers relocated into this county between 2020 and 2021:
| from King County, WA | |
| from Thurston County, WA | |
| from Kitsap County, WA | |
| from Snohomish County, WA | |
| from Los Angeles County, CA | |
| from Honolulu County, HI | |
| from Maricopa County, AZ |
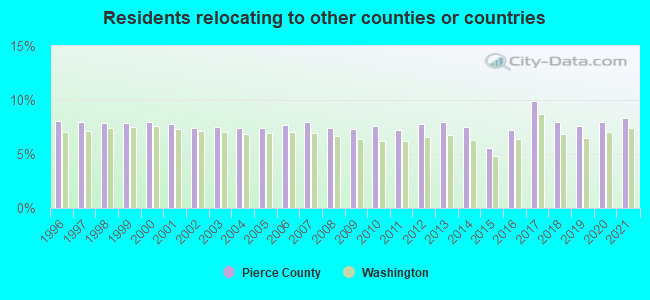
8.36% of this county's 2020 resident taxpayers moved to other counties in 2021 ($66,301 average adjusted gross income)
| Here: | 8.36% |
| Washington average: | 7.40% |
0.12% of residents moved to foreign countries ($853 average AGI)
Pierce County: 0.12% Washington average: 0.04%
3.95% relocated to other counties in Washington ($30,036 average AGI)
4.30% relocated to other states ($35,411 average AGI)
Pierce County: 4.30% Washington average: 3.73%
Top counties to which taxpayers relocated from this county between 2020 and 2021:
| to King County, WA | |
| to Thurston County, WA | |
| to Kitsap County, WA | |
| to Maricopa County, AZ | |
| to Snohomish County, WA | |
| to Spokane County, WA | |
| to Mason County, WA |
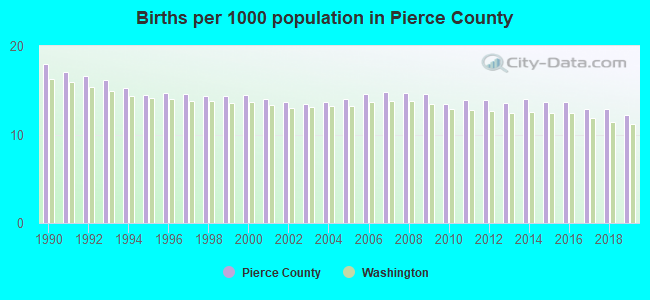
Births per 1000 population from 1990 to 1999: 15.6
Births per 1000 population from 2000 to 2009: 14.2
Births per 1000 population from 2010 to 2022: 11.2
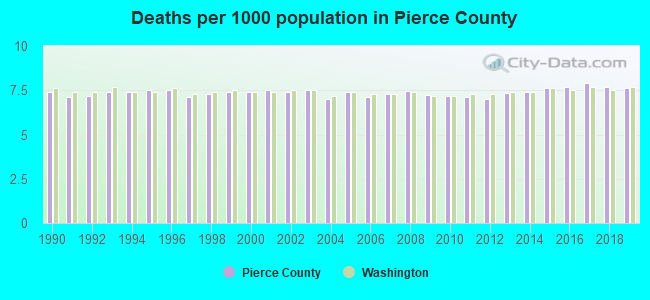
Deaths per 1000 population from 1990 to 1999: 7.3
Deaths per 1000 population from 2000 to 2009: 7.3
Deaths per 1000 population from 2010 to 2020: 7.5
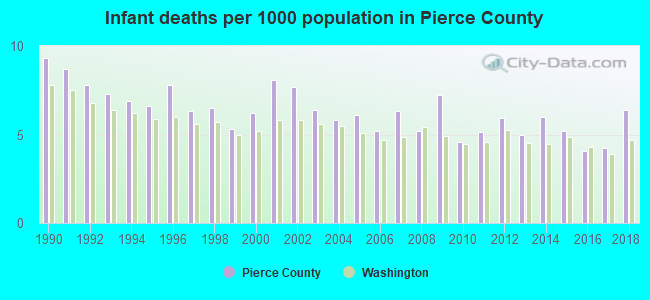
Infant deaths per 1000 live births from 1990 to 1999: 7.3
Infant deaths per 1000 live births from 2000 to 2009: 6.4
Infant deaths per 1000 live births from 2010 to 2021: 5.1
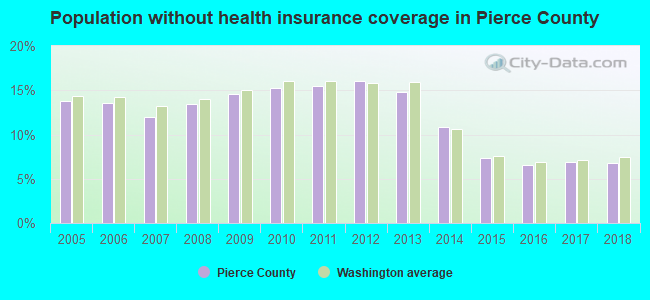
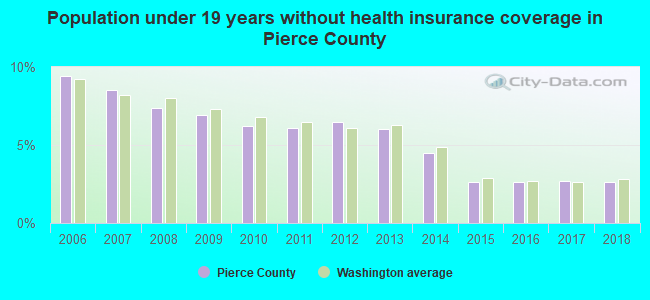
Persons under 19 years old without health insurance coverage in 2018: 2.6%
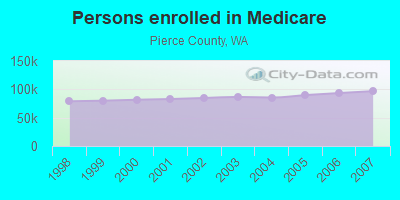
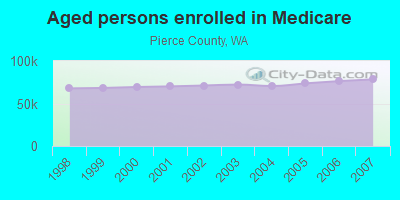
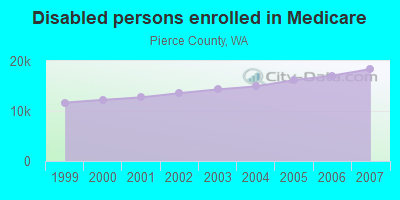
Persons enrolled in hospital insurance and/or supplemental medical insurance (Medicare) in July 1, 2007: 96,822 (78,391 aged, 18,431 disabled)
Children under 18 without health insurance coverage in 2007: 15,745 (8%)
Most common underlying causes of death in Pierce County, Washington in 1999 - 2019:
- Atherosclerotic heart disease (8,274)
- Bronchus or lung, unspecified - Malignant neoplasms (7,930)
- Alzheimer disease, unspecified (5,787)
- Chronic obstructive pulmonary disease, unspecified (5,499)
- Acute myocardial infarction, unspecified (4,756)
- Atherosclerotic cardiovascular disease, so described (3,796)
- Stroke, not specified as haemorrhage or infarction (3,225)
- Breast, unspecified - Malignant neoplasms (1,970)
- Chronic ischaemic heart disease, unspecified (1,838)
- Pancreas, unspecified - Malignant neoplasms (1,763)
Population without health insurance coverage in 2000: 13%
Children under 18 without health insurance coverage in 2000: 10%
Short term general hospital admissions per 100,000 population in 2004: 8,735
Short term general hospital beds per 100,000 population in 2004: 158
Emergency room visits per 100,000 population in 2004: 26,713
General practice office based MDs per 100,000 population in 2005: 1,319
Medical specialist MDs per 100,000 population in 2005: 707
Dentists per 100,000 population in 1998: 5
Total births per 100,000 population, July 2005 - July 2006 : 43
Total deaths per 100,000 population, July 2005 - July 2006: 95
Limited-service eating places per 100,000 population in 2005 : 8
Fitness & recreation sports centers per 100,000 population in 2005: 6,960
EPA green book nonattainment status in 2004-2006: 1
Homicides per 1,000,000 population from 2000 to 2006: 47.1. This is more than state average.
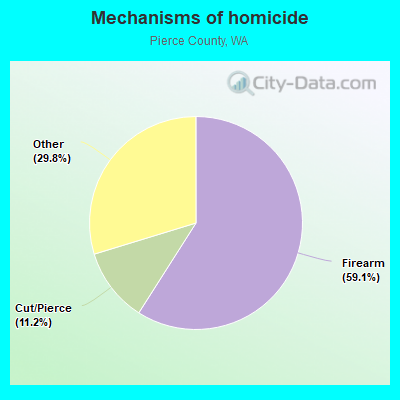
- Firearm - 27.8
- Cut/Pierce - 5.3
- Other - 14.0
Suicides per 1,000,000 population from 2000 to 2006: 126.9. This is less than state average.
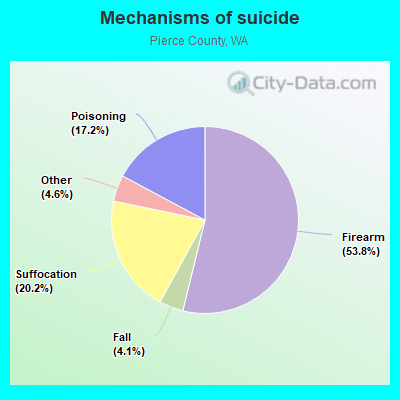
- Firearm - 68.3
- Suffocation - 25.7
- Poisoning - 21.8
- Fall - 5.3
- Other - 5.8
Household type by relationship:
Households: 927,380- Male householders: 171,107 (36,856 living alone), Female householders: 180,545 (48,125 living alone)
172,206 spouses (169,472 opposite-sex spouses), 33,928 unmarried partners, (32,374 opposite-sex unmarried partners), 257,132 children (235,791 natural, 7,389 adopted, 13,952 stepchildren), 14,320 grandchildren, 9,638 brothers or sisters, 14,329 parents, 1,267 foster children, 14,736 other relatives, 35,903 non-relatives
- In group quarters: 22,269
Size of family households: 101,784 2-persons, 54,288 3-persons, 46,344 4-persons, 21,449 5-persons, 7,630 6-persons, 6,101 7-or-more-persons.
Size of nonfamily households: 84,981 1-person, 24,006 2-persons, 3,401 3-persons, 988 4-persons, 153 5-persons, 527 7-or-more-persons.
132,730 married couples with children.
58,169 single-parent households (20,492 men, 37,677 women).
83.9% of residents of Pierce speak English at home.
6.0% of residents speak Spanish at home (69% speak English very well, 16% speak English well, 12% speak English not well, 3% don't speak English at all).
3.5% of residents speak other Indo-European language at home (59% speak English very well, 26% speak English well, 12% speak English not well, 3% don't speak English at all).
5.4% of residents speak Asian or Pacific Island language at home (55% speak English very well, 27% speak English well, 17% speak English not well, 1% don't speak English at all).
1.2% of residents speak other language at home (65% speak English very well, 31% speak English well, 4% speak English not well).
In fiscal year 2004:
Federal Government expenditure: $5,375,525,000 ($7,211 per capita)
Department of Defense expenditure: $2,099,557,000
Federal direct payments to individuals for retirement and disability: $1,980,484,000
Federal other direct payments to individuals: $580,037,000
Federal direct payments not to individuals: $10,778,000
Federal grants: $836,969,000
Federal procurement contracts: $514,703,000 ($419,688,000 Department of Defense)
Federal salaries and wages: $1,452,554,000 ($1,272,347,000 Department of Defense)
Federal Government direct loans: $1,703,000
Federal guaranteed/insured loans: $980,975,000
Federal Government insurance: $315,457,000
Population change from April 1, 2000 to July 1, 2005:
Births: 52,820| Here: | 70 per 1000 residents |
| State: | 66 per 1000 residents |
Deaths: 28,597
| Here: | 38 per 1000 residents |
| State: | 38 per 1000 residents |
Net international migration: +10,006
| Here: | +13 per 1000 residents |
| State: | +21 per 1000 residents |
Net internal migration: +19,524
| Here: | +26 per 1000 residents |
| State: | +13 per 1000 residents |
Total withdrawal of fresh water for public supply: 119.74 millions of gallons per day (45% from ground, 55% from surface)
| Here: | 6.4 |
| State: | 6.5 |
| Here: | 4.1 |
| State: | 3.9 |
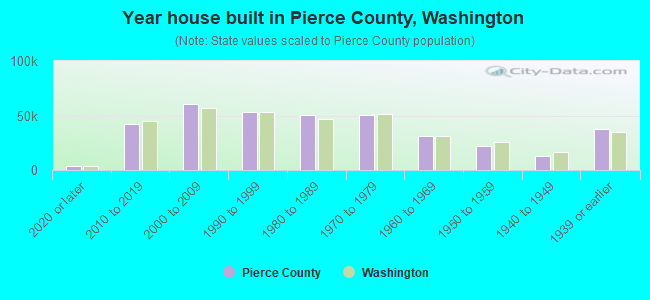
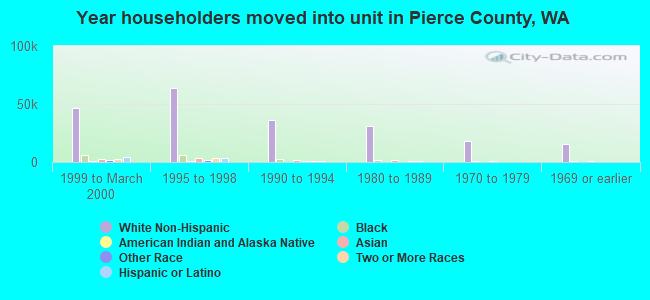
- Year house built in Pierce County, Washington
- 8,3812020 or later
- 38,0522010 to 2019
- 59,8342000 to 2009
- 55,7161990 to 1999
- 49,2261980 to 1989
- 53,5151970 to 1979
- 33,2301960 to 1969
- 22,1941950 to 1959
- 12,7291940 to 1949
- 38,2721939 or earlier
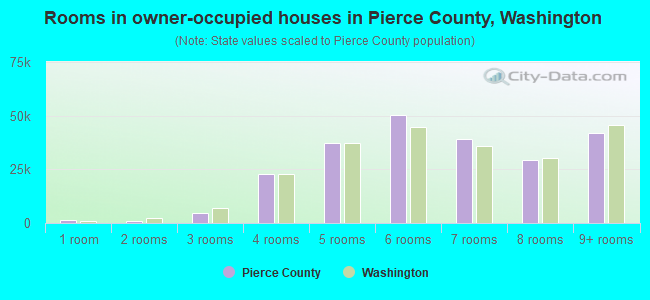
- Rooms in owner-occupied houses in Pierce County, Washington
- 1,5541 room
- 1,1112 rooms
- 5,7233 rooms
- 18,8404 rooms
- 36,9005 rooms
- 51,2986 rooms
- 36,5457 rooms
- 30,5248 rooms
- 42,4259+ rooms
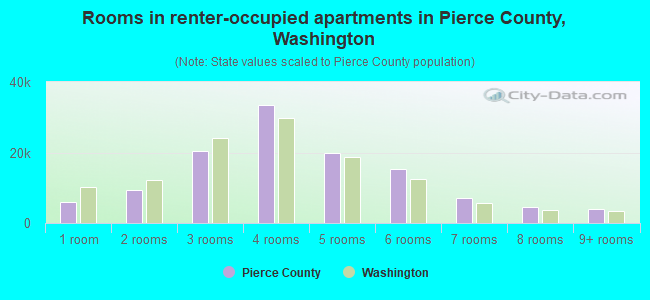
- Rooms in renter-occupied apartments in Pierce County, Washington
- 5,7461 room
- 10,4452 rooms
- 25,3893 rooms
- 35,8474 rooms
- 21,2365 rooms
- 12,5136 rooms
- 6,1647 rooms
- 4,4438 rooms
- 4,9499+ rooms
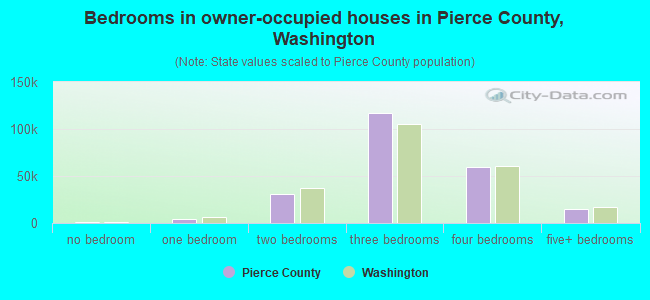
- Bedrooms in owner-occupied houses in Pierce County, Washington
- 2,005no bedroom
- 3,9891 bedroom
- 31,8002 bedrooms
- 110,5963 bedrooms
- 60,9024 bedrooms
- 15,6285+ bedrooms
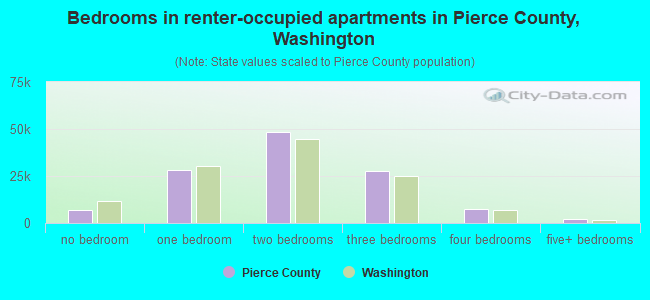
- Bedrooms in renter-occupied apartments in Pierce County, Washington
- 6,511no bedroom
- 29,5661 bedroom
- 53,2772 bedrooms
- 27,6393 bedrooms
- 6,1584 bedrooms
- 3,5815+ bedrooms
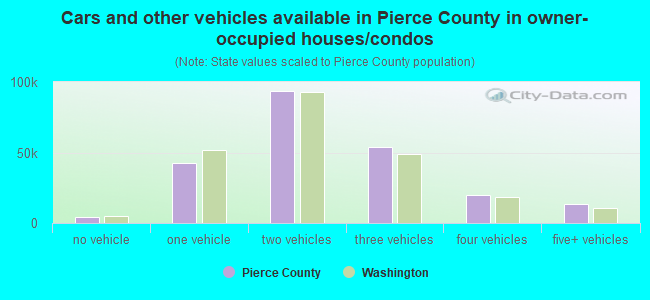
- Cars and other vehicles available in Pierce County in owner-occupied houses/condos
- 5,256no vehicle
- 46,5221 vehicle
- 88,6142 vehicles
- 52,6333 vehicles
- 20,4174 vehicles
- 11,4785+ vehicles
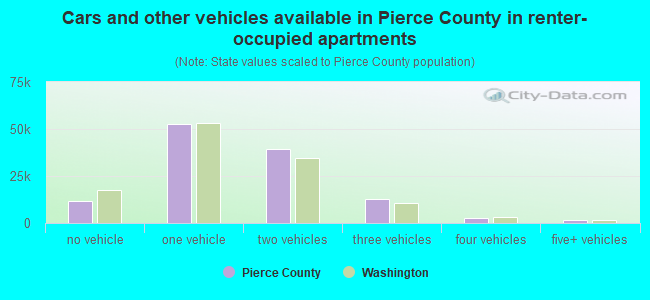
- Cars and other vehicles available in Pierce County in renter-occupied apartments
- 14,387no vehicle
- 51,4951 vehicle
- 46,6802 vehicles
- 9,4363 vehicles
- 3,0554 vehicles
- 1,6795+ vehicles
84.4% of Pierce County residents lived in the same house 1 years ago.
Out of people who lived in different houses, 36% lived in this county.
Out of people who lived in different counties, 51% lived in Washington.
| Pierce County: | 84.4% |
| State average: | 85.2% |
Place of birth for U.S.-born residents:
- This state: 465,164
- Other state: 330,349
- Northeast: 34,110
- Midwest: 66,162
- South: 79,585
- West: 150,492
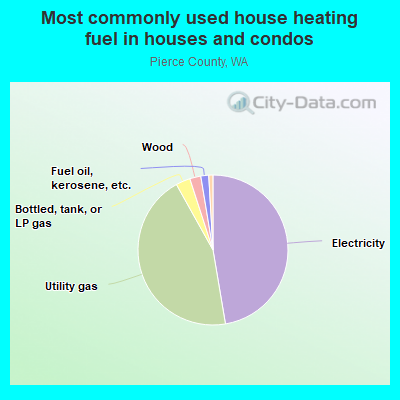
- 50.3%Electricity
- 42.4%Utility gas
- 2.9%Bottled, tank, or LP gas
- 2.8%Wood
- 1.0%Fuel oil, kerosene, etc.
- 0.4%No fuel used
- 0.1%Solar energy
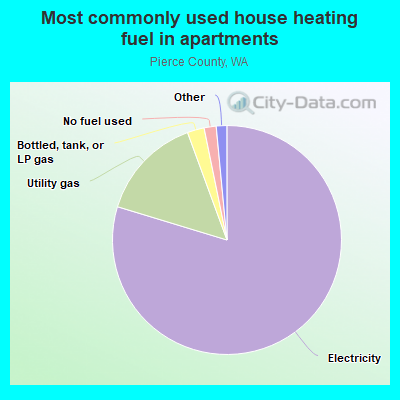
- 77.8%Electricity
- 18.7%Utility gas
- 1.1%No fuel used
- 0.9%Bottled, tank, or LP gas
- 0.8%Wood
- 0.3%Other fuel
- 0.3%Fuel oil, kerosene, etc.
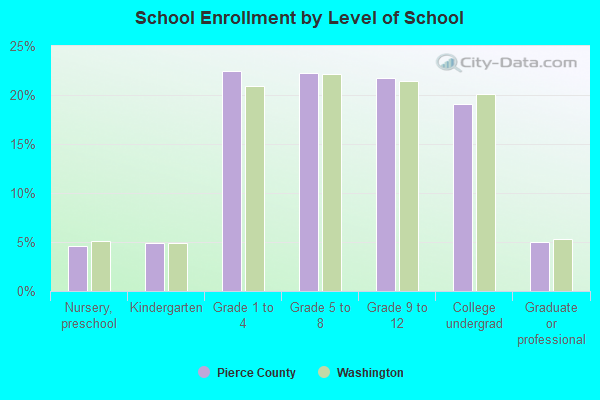
Private vs. public school enrollment:
| Here: | 9.9% |
| Washington: | 12.4% |
| Here: | 10.8% |
| Washington: | 9.2% |
| Here: | 23.1% |
| Washington: | 16.5% |
Pierce County government finances - Expenditure in 2020:
- Bond Funds - Cash and Securities: $105,537,000
Cash and Securities: $26,221,000
- Charges - Sewerage: $94,568,000
Sewerage: $82,050,000
Other: $77,481,000
Other: $72,984,000
Parks and Recreation: $8,874,000
Parks and Recreation: $8,522,000
Solid Waste Management: $6,352,000
Solid Waste Management: $5,046,000
Toll Highways: $3,910,000
Toll Highways: $2,768,000
Natural Resources - Other: $2,615,000
Air Transportation: $1,366,000
Air Transportation: $1,247,000
Natural Resources - Other: $204,000
- Construction - Sewerage: $36,047,000
Regular Highways: $22,607,000
Regular Highways: $20,633,000
Police Protection: $13,753,000
Natural Resources - Other: $11,787,000
Natural Resources - Other: $10,544,000
Central Staff Services: $8,084,000
Central Staff Services: $5,071,000
Parks and Recreation: $4,913,000
Sewerage: $4,665,000
Parks and Recreation: $3,478,000
General - Other: $2,807,000
General - Other: $1,524,000
Correctional Institutions: $487,000
Police Protection: $345,000
Air Transportation: $280,000
Air Transportation: $78,000
Correctional Institutions: $66,000
General Public Buildings: $1,000
- Current Operations - Police Protection: $116,439,000
Police Protection: $101,301,000
Judicial and Legal Services: $87,947,000
Judicial and Legal Services: $71,331,000
General - Other: $68,713,000
Regular Highways: $62,540,000
Health - Other: $62,016,000
Correctional Institutions: $58,349,000
Regular Highways: $57,266,000
Correctional Institutions: $50,180,000
Health - Other: $49,843,000
General - Other: $45,631,000
Sewerage: $45,472,000
Sewerage: $45,412,000
Housing and Community Development: $22,435,000
Financial Administration: $21,990,000
Public Welfare - Other: $21,582,000
Parks and Recreation: $20,942,000
Parks and Recreation: $20,110,000
Corrections - Other: $19,156,000
Public Welfare - Other: $18,030,000
Central Staff Services: $17,730,000
Housing and Community Development: $16,999,000
Corrections - Other: $16,753,000
Central Staff Services: $16,213,000
Financial Administration: $14,403,000
Natural Resources - Other: $11,224,000
Natural Resources - Other: $10,054,000
Toll Highways: $6,671,000
Solid Waste Management: $6,296,000
Solid Waste Management: $4,089,000
Toll Highways: $3,929,000
Air Transportation: $2,262,000
Local Fire Protection: $2,213,000
Protective Inspection and Regulation - Other: $1,939,000
Local Fire Protection: $1,847,000
Air Transportation: $1,223,000
Miscellaneous Commercial Activities - Other: $1,109,000
Miscellaneous Commercial Activities - Other: $1,014,000
General Public Buildings: $178,000
Water Utilities: $90,000
Protective Inspection and Regulation - Other: $59,000
- Federal Intergovernmental - Housing and Community Development: $10,107,000
Housing and Community Development: $7,972,000
Other: $6,017,000
Other: $3,338,000
Health and Hospitals: $1,004,000
General Local Government Support: $982,000
Health and Hospitals: $978,000
Highways: $930,000
General Local Government Support: $863,000
Natural Resources: $333,000
Natural Resources: $206,000
- General - Interest on Debt: $18,108,000
Interest on Debt: $15,646,000
- Intergovernmental to Local - Other - Police Protection: $5,817,000
Other - General - Other: $1,151,000
Other - General - Other: $1,028,000
- Local Intergovernmental - Other: $65,068,000
Other: $41,228,000
Health and Hospitals: $5,141,000
Health and Hospitals: $5,042,000
Housing and Community Development: $748,000
Public Welfare: $743,000
- Long Term Debt - Beginning Outstanding - Unspecified Public Purpose: $422,996,000
Outstanding Unspecified Public Purpose: $413,369,000
Outstanding Unspecified Public Purpose: $403,989,000
Beginning Outstanding - Unspecified Public Purpose: $382,869,000
Issue, Unspecified Public Purpose: $50,902,000
Retired Unspecified Public Purpose: $20,725,000
Retired Unspecified Public Purpose: $20,402,000
Issue, Unspecified Public Purpose: $1,718,000
- Miscellaneous - Interest Earnings: $17,474,000
Special Assessments: $9,236,000
Special Assessments: $9,070,000
General Revenue - Other: $6,151,000
Interest Earnings: $5,371,000
Fines and Forfeits: $3,863,000
Rents: $3,825,000
Fines and Forfeits: $3,497,000
Donations From Private Sources: $3,416,000
General Revenue - Other: $3,145,000
Rents: $2,940,000
Donations From Private Sources: $2,540,000
Sale of Property: $1,207,000
Sale of Property: $-590,000
- Other Capital Outlay - General - Other: $1,701,000
Regular Highways: $987,000
Police Protection: $848,000
Police Protection: $586,000
General - Other: $448,000
Health - Other: $409,000
Financial Administration: $362,000
Correctional Institutions: $231,000
Natural Resources - Other: $193,000
Financial Administration: $133,000
Regular Highways: $104,000
Parks and Recreation: $96,000
Natural Resources - Other: $53,000
Parks and Recreation: $19,000
Judicial and Legal Services: $16,000
Correctional Institutions: $13,000
Judicial and Legal Services: $7,000
- Other Funds - Cash and Securities: $476,353,000
Cash and Securities: $357,718,000
- Sinking Funds - Cash and Securities: $18,980,000
Cash and Securities: $18,684,000
- State Intergovernmental - Health and Hospitals: $47,557,000
Health and Hospitals: $43,163,000
Other: $32,262,000
Other: $29,271,000
Highways: $18,888,000
Highways: $14,108,000
Public Welfare: $6,954,000
Public Welfare: $4,880,000
General Local Government Support: $2,684,000
General Local Government Support: $2,433,000
Housing and Community Development: $2,369,000
Housing and Community Development: $1,510,000
- Tax - Property: $217,439,000
Property: $206,746,000
General Sales and Gross Receipts: $119,488,000
General Sales and Gross Receipts: $98,467,000
Other License: $26,740,000
Documentary and Stock Transfer: $20,722,000
Other License: $19,667,000
Documentary and Stock Transfer: $18,962,000
Public Utilities Sales: $14,259,000
Public Utilities Sales: $14,145,000
Motor Vehicle License: $4,636,000
Motor Vehicle License: $4,224,000
Other Selective Sales: $3,633,000
Other Selective Sales: $3,077,000
Severance: $673,000
Severance: $464,000
Amusements Sales: $317,000
Amusements Sales: $265,000
Occupation and Business License - Other: $141,000
Occupation and Business License - Other: $99,000
- Total Salaries and Wages: $304,784,000
: $286,116,000
Pierce County government finances - Revenue in 2020:
- Bond Funds - Cash and Securities: $105,537,000
Cash and Securities: $26,221,000
- Charges - Sewerage: $94,568,000
Sewerage: $82,050,000
Other: $77,481,000
Other: $72,984,000
Parks and Recreation: $8,874,000
Parks and Recreation: $8,522,000
Solid Waste Management: $6,352,000
Solid Waste Management: $5,046,000
Toll Highways: $3,910,000
Toll Highways: $2,768,000
Natural Resources - Other: $2,615,000
Air Transportation: $1,366,000
Air Transportation: $1,247,000
Natural Resources - Other: $204,000
- Construction - Sewerage: $36,047,000
Regular Highways: $22,607,000
Regular Highways: $20,633,000
Police Protection: $13,753,000
Natural Resources - Other: $11,787,000
Natural Resources - Other: $10,544,000
Central Staff Services: $8,084,000
Central Staff Services: $5,071,000
Parks and Recreation: $4,913,000
Sewerage: $4,665,000
Parks and Recreation: $3,478,000
General - Other: $2,807,000
General - Other: $1,524,000
Correctional Institutions: $487,000
Police Protection: $345,000
Air Transportation: $280,000
Air Transportation: $78,000
Correctional Institutions: $66,000
General Public Buildings: $1,000
- Current Operations - Police Protection: $116,439,000
Police Protection: $101,301,000
Judicial and Legal Services: $87,947,000
Judicial and Legal Services: $71,331,000
General - Other: $68,713,000
Regular Highways: $62,540,000
Health - Other: $62,016,000
Correctional Institutions: $58,349,000
Regular Highways: $57,266,000
Correctional Institutions: $50,180,000
Health - Other: $49,843,000
General - Other: $45,631,000
Sewerage: $45,472,000
Sewerage: $45,412,000
Housing and Community Development: $22,435,000
Financial Administration: $21,990,000
Public Welfare - Other: $21,582,000
Parks and Recreation: $20,942,000
Parks and Recreation: $20,110,000
Corrections - Other: $19,156,000
Public Welfare - Other: $18,030,000
Central Staff Services: $17,730,000
Housing and Community Development: $16,999,000
Corrections - Other: $16,753,000
Central Staff Services: $16,213,000
Financial Administration: $14,403,000
Natural Resources - Other: $11,224,000
Natural Resources - Other: $10,054,000
Toll Highways: $6,671,000
Solid Waste Management: $6,296,000
Solid Waste Management: $4,089,000
Toll Highways: $3,929,000
Air Transportation: $2,262,000
Local Fire Protection: $2,213,000
Protective Inspection and Regulation - Other: $1,939,000
Local Fire Protection: $1,847,000
Air Transportation: $1,223,000
Miscellaneous Commercial Activities - Other: $1,109,000
Miscellaneous Commercial Activities - Other: $1,014,000
General Public Buildings: $178,000
Water Utilities: $90,000
Protective Inspection and Regulation - Other: $59,000
- Federal Intergovernmental - Housing and Community Development: $10,107,000
Housing and Community Development: $7,972,000
Other: $6,017,000
Other: $3,338,000
Health and Hospitals: $1,004,000
General Local Government Support: $982,000
Health and Hospitals: $978,000
Highways: $930,000
General Local Government Support: $863,000
Natural Resources: $333,000
Natural Resources: $206,000
- General - Interest on Debt: $18,108,000
Interest on Debt: $15,646,000
- Intergovernmental to Local - Other - Police Protection: $5,817,000
Other - General - Other: $1,151,000
Other - General - Other: $1,028,000
- Local Intergovernmental - Other: $65,068,000
Other: $41,228,000
Health and Hospitals: $5,141,000
Health and Hospitals: $5,042,000
Housing and Community Development: $748,000
Public Welfare: $743,000
- Long Term Debt - Beginning Outstanding - Unspecified Public Purpose: $422,996,000
Outstanding Unspecified Public Purpose: $413,369,000
Outstanding Unspecified Public Purpose: $403,989,000
Beginning Outstanding - Unspecified Public Purpose: $382,869,000
Issue, Unspecified Public Purpose: $50,902,000
Retired Unspecified Public Purpose: $20,725,000
Retired Unspecified Public Purpose: $20,402,000
Issue, Unspecified Public Purpose: $1,718,000
- Miscellaneous - Interest Earnings: $17,474,000
Special Assessments: $9,236,000
Special Assessments: $9,070,000
General Revenue - Other: $6,151,000
Interest Earnings: $5,371,000
Fines and Forfeits: $3,863,000
Rents: $3,825,000
Fines and Forfeits: $3,497,000
Donations From Private Sources: $3,416,000
General Revenue - Other: $3,145,000
Rents: $2,940,000
Donations From Private Sources: $2,540,000
Sale of Property: $1,207,000
Sale of Property: $-590,000
- Other Capital Outlay - General - Other: $1,701,000
Regular Highways: $987,000
Police Protection: $848,000
Police Protection: $586,000
General - Other: $448,000
Health - Other: $409,000
Financial Administration: $362,000
Correctional Institutions: $231,000
Natural Resources - Other: $193,000
Financial Administration: $133,000
Regular Highways: $104,000
Parks and Recreation: $96,000
Natural Resources - Other: $53,000
Parks and Recreation: $19,000
Judicial and Legal Services: $16,000
Correctional Institutions: $13,000
Judicial and Legal Services: $7,000
- Other Funds - Cash and Securities: $476,353,000
Cash and Securities: $357,718,000
- Sinking Funds - Cash and Securities: $18,980,000
Cash and Securities: $18,684,000
- State Intergovernmental - Health and Hospitals: $47,557,000
Health and Hospitals: $43,163,000
Other: $32,262,000
Other: $29,271,000
Highways: $18,888,000
Highways: $14,108,000
Public Welfare: $6,954,000
Public Welfare: $4,880,000
General Local Government Support: $2,684,000
General Local Government Support: $2,433,000
Housing and Community Development: $2,369,000
Housing and Community Development: $1,510,000
- Tax - Property: $217,439,000
Property: $206,746,000
General Sales and Gross Receipts: $119,488,000
General Sales and Gross Receipts: $98,467,000
Other License: $26,740,000
Documentary and Stock Transfer: $20,722,000
Other License: $19,667,000
Documentary and Stock Transfer: $18,962,000
Public Utilities Sales: $14,259,000
Public Utilities Sales: $14,145,000
Motor Vehicle License: $4,636,000
Motor Vehicle License: $4,224,000
Other Selective Sales: $3,633,000
Other Selective Sales: $3,077,000
Severance: $673,000
Severance: $464,000
Amusements Sales: $317,000
Amusements Sales: $265,000
Occupation and Business License - Other: $141,000
Occupation and Business License - Other: $99,000
- Total Salaries and Wages: $304,784,000
: $286,116,000
Pierce County government finances - Debt in 2020:
- Bond Funds - Cash and Securities: $105,537,000
Cash and Securities: $26,221,000
- Charges - Sewerage: $94,568,000
Sewerage: $82,050,000
Other: $77,481,000
Other: $72,984,000
Parks and Recreation: $8,874,000
Parks and Recreation: $8,522,000
Solid Waste Management: $6,352,000
Solid Waste Management: $5,046,000
Toll Highways: $3,910,000
Toll Highways: $2,768,000
Natural Resources - Other: $2,615,000
Air Transportation: $1,366,000
Air Transportation: $1,247,000
Natural Resources - Other: $204,000
- Construction - Sewerage: $36,047,000
Regular Highways: $22,607,000
Regular Highways: $20,633,000
Police Protection: $13,753,000
Natural Resources - Other: $11,787,000
Natural Resources - Other: $10,544,000
Central Staff Services: $8,084,000
Central Staff Services: $5,071,000
Parks and Recreation: $4,913,000
Sewerage: $4,665,000
Parks and Recreation: $3,478,000
General - Other: $2,807,000
General - Other: $1,524,000
Correctional Institutions: $487,000
Police Protection: $345,000
Air Transportation: $280,000
Air Transportation: $78,000
Correctional Institutions: $66,000
General Public Buildings: $1,000
- Current Operations - Police Protection: $116,439,000
Police Protection: $101,301,000
Judicial and Legal Services: $87,947,000
Judicial and Legal Services: $71,331,000
General - Other: $68,713,000
Regular Highways: $62,540,000
Health - Other: $62,016,000
Correctional Institutions: $58,349,000
Regular Highways: $57,266,000
Correctional Institutions: $50,180,000
Health - Other: $49,843,000
General - Other: $45,631,000
Sewerage: $45,472,000
Sewerage: $45,412,000
Housing and Community Development: $22,435,000
Financial Administration: $21,990,000
Public Welfare - Other: $21,582,000
Parks and Recreation: $20,942,000
Parks and Recreation: $20,110,000
Corrections - Other: $19,156,000
Public Welfare - Other: $18,030,000
Central Staff Services: $17,730,000
Housing and Community Development: $16,999,000
Corrections - Other: $16,753,000
Central Staff Services: $16,213,000
Financial Administration: $14,403,000
Natural Resources - Other: $11,224,000
Natural Resources - Other: $10,054,000
Toll Highways: $6,671,000
Solid Waste Management: $6,296,000
Solid Waste Management: $4,089,000
Toll Highways: $3,929,000
Air Transportation: $2,262,000
Local Fire Protection: $2,213,000
Protective Inspection and Regulation - Other: $1,939,000
Local Fire Protection: $1,847,000
Air Transportation: $1,223,000
Miscellaneous Commercial Activities - Other: $1,109,000
Miscellaneous Commercial Activities - Other: $1,014,000
General Public Buildings: $178,000
Water Utilities: $90,000
Protective Inspection and Regulation - Other: $59,000
- Federal Intergovernmental - Housing and Community Development: $10,107,000
Housing and Community Development: $7,972,000
Other: $6,017,000
Other: $3,338,000
Health and Hospitals: $1,004,000
General Local Government Support: $982,000
Health and Hospitals: $978,000
Highways: $930,000
General Local Government Support: $863,000
Natural Resources: $333,000
Natural Resources: $206,000
- General - Interest on Debt: $18,108,000
Interest on Debt: $15,646,000
- Intergovernmental to Local - Other - Police Protection: $5,817,000
Other - General - Other: $1,151,000
Other - General - Other: $1,028,000
- Local Intergovernmental - Other: $65,068,000
Other: $41,228,000
Health and Hospitals: $5,141,000
Health and Hospitals: $5,042,000
Housing and Community Development: $748,000
Public Welfare: $743,000
- Long Term Debt - Beginning Outstanding - Unspecified Public Purpose: $422,996,000
Outstanding Unspecified Public Purpose: $413,369,000
Outstanding Unspecified Public Purpose: $403,989,000
Beginning Outstanding - Unspecified Public Purpose: $382,869,000
Issue, Unspecified Public Purpose: $50,902,000
Retired Unspecified Public Purpose: $20,725,000
Retired Unspecified Public Purpose: $20,402,000
Issue, Unspecified Public Purpose: $1,718,000
- Miscellaneous - Interest Earnings: $17,474,000
Special Assessments: $9,236,000
Special Assessments: $9,070,000
General Revenue - Other: $6,151,000
Interest Earnings: $5,371,000
Fines and Forfeits: $3,863,000
Rents: $3,825,000
Fines and Forfeits: $3,497,000
Donations From Private Sources: $3,416,000
General Revenue - Other: $3,145,000
Rents: $2,940,000
Donations From Private Sources: $2,540,000
Sale of Property: $1,207,000
Sale of Property: $-590,000
- Other Capital Outlay - General - Other: $1,701,000
Regular Highways: $987,000
Police Protection: $848,000
Police Protection: $586,000
General - Other: $448,000
Health - Other: $409,000
Financial Administration: $362,000
Correctional Institutions: $231,000
Natural Resources - Other: $193,000
Financial Administration: $133,000
Regular Highways: $104,000
Parks and Recreation: $96,000
Natural Resources - Other: $53,000
Parks and Recreation: $19,000
Judicial and Legal Services: $16,000
Correctional Institutions: $13,000
Judicial and Legal Services: $7,000
- Other Funds - Cash and Securities: $476,353,000
Cash and Securities: $357,718,000
- Sinking Funds - Cash and Securities: $18,980,000
Cash and Securities: $18,684,000
- State Intergovernmental - Health and Hospitals: $47,557,000
Health and Hospitals: $43,163,000
Other: $32,262,000
Other: $29,271,000
Highways: $18,888,000
Highways: $14,108,000
Public Welfare: $6,954,000
Public Welfare: $4,880,000
General Local Government Support: $2,684,000
General Local Government Support: $2,433,000
Housing and Community Development: $2,369,000
Housing and Community Development: $1,510,000
- Tax - Property: $217,439,000
Property: $206,746,000
General Sales and Gross Receipts: $119,488,000
General Sales and Gross Receipts: $98,467,000
Other License: $26,740,000
Documentary and Stock Transfer: $20,722,000
Other License: $19,667,000
Documentary and Stock Transfer: $18,962,000
Public Utilities Sales: $14,259,000
Public Utilities Sales: $14,145,000
Motor Vehicle License: $4,636,000
Motor Vehicle License: $4,224,000
Other Selective Sales: $3,633,000
Other Selective Sales: $3,077,000
Severance: $673,000
Severance: $464,000
Amusements Sales: $317,000
Amusements Sales: $265,000
Occupation and Business License - Other: $141,000
Occupation and Business License - Other: $99,000
- Total Salaries and Wages: $304,784,000
: $286,116,000
Pierce County government finances - Cash and Securities in 2020:
- Bond Funds - Cash and Securities: $105,537,000
Cash and Securities: $26,221,000
- Charges - Sewerage: $94,568,000
Sewerage: $82,050,000
Other: $77,481,000
Other: $72,984,000
Parks and Recreation: $8,874,000
Parks and Recreation: $8,522,000
Solid Waste Management: $6,352,000
Solid Waste Management: $5,046,000
Toll Highways: $3,910,000
Toll Highways: $2,768,000
Natural Resources - Other: $2,615,000
Air Transportation: $1,366,000
Air Transportation: $1,247,000
Natural Resources - Other: $204,000
- Construction - Sewerage: $36,047,000
Regular Highways: $22,607,000
Regular Highways: $20,633,000
Police Protection: $13,753,000
Natural Resources - Other: $11,787,000
Natural Resources - Other: $10,544,000
Central Staff Services: $8,084,000
Central Staff Services: $5,071,000
Parks and Recreation: $4,913,000
Sewerage: $4,665,000
Parks and Recreation: $3,478,000
General - Other: $2,807,000
General - Other: $1,524,000
Correctional Institutions: $487,000
Police Protection: $345,000
Air Transportation: $280,000
Air Transportation: $78,000
Correctional Institutions: $66,000
General Public Buildings: $1,000
- Current Operations - Police Protection: $116,439,000
Police Protection: $101,301,000
Judicial and Legal Services: $87,947,000
Judicial and Legal Services: $71,331,000
General - Other: $68,713,000
Regular Highways: $62,540,000
Health - Other: $62,016,000
Correctional Institutions: $58,349,000
Regular Highways: $57,266,000
Correctional Institutions: $50,180,000
Health - Other: $49,843,000
General - Other: $45,631,000
Sewerage: $45,472,000
Sewerage: $45,412,000
Housing and Community Development: $22,435,000
Financial Administration: $21,990,000
Public Welfare - Other: $21,582,000
Parks and Recreation: $20,942,000
Parks and Recreation: $20,110,000
Corrections - Other: $19,156,000
Public Welfare - Other: $18,030,000
Central Staff Services: $17,730,000
Housing and Community Development: $16,999,000
Corrections - Other: $16,753,000
Central Staff Services: $16,213,000
Financial Administration: $14,403,000
Natural Resources - Other: $11,224,000
Natural Resources - Other: $10,054,000
Toll Highways: $6,671,000
Solid Waste Management: $6,296,000
Solid Waste Management: $4,089,000
Toll Highways: $3,929,000
Air Transportation: $2,262,000
Local Fire Protection: $2,213,000
Protective Inspection and Regulation - Other: $1,939,000
Local Fire Protection: $1,847,000
Air Transportation: $1,223,000
Miscellaneous Commercial Activities - Other: $1,109,000
Miscellaneous Commercial Activities - Other: $1,014,000
General Public Buildings: $178,000
Water Utilities: $90,000
Protective Inspection and Regulation - Other: $59,000
- Federal Intergovernmental - Housing and Community Development: $10,107,000
Housing and Community Development: $7,972,000
Other: $6,017,000
Other: $3,338,000
Health and Hospitals: $1,004,000
General Local Government Support: $982,000
Health and Hospitals: $978,000
Highways: $930,000
General Local Government Support: $863,000
Natural Resources: $333,000
Natural Resources: $206,000
- General - Interest on Debt: $18,108,000
Interest on Debt: $15,646,000
- Intergovernmental to Local - Other - Police Protection: $5,817,000
Other - General - Other: $1,151,000
Other - General - Other: $1,028,000
- Local Intergovernmental - Other: $65,068,000
Other: $41,228,000
Health and Hospitals: $5,141,000
Health and Hospitals: $5,042,000
Housing and Community Development: $748,000
Public Welfare: $743,000
- Long Term Debt - Beginning Outstanding - Unspecified Public Purpose: $422,996,000
Outstanding Unspecified Public Purpose: $413,369,000
Outstanding Unspecified Public Purpose: $403,989,000
Beginning Outstanding - Unspecified Public Purpose: $382,869,000
Issue, Unspecified Public Purpose: $50,902,000
Retired Unspecified Public Purpose: $20,725,000
Retired Unspecified Public Purpose: $20,402,000
Issue, Unspecified Public Purpose: $1,718,000
- Miscellaneous - Interest Earnings: $17,474,000
Special Assessments: $9,236,000
Special Assessments: $9,070,000
General Revenue - Other: $6,151,000
Interest Earnings: $5,371,000
Fines and Forfeits: $3,863,000
Rents: $3,825,000
Fines and Forfeits: $3,497,000
Donations From Private Sources: $3,416,000
General Revenue - Other: $3,145,000
Rents: $2,940,000
Donations From Private Sources: $2,540,000
Sale of Property: $1,207,000
Sale of Property: $-590,000
- Other Capital Outlay - General - Other: $1,701,000
Regular Highways: $987,000
Police Protection: $848,000
Police Protection: $586,000
General - Other: $448,000
Health - Other: $409,000
Financial Administration: $362,000
Correctional Institutions: $231,000
Natural Resources - Other: $193,000
Financial Administration: $133,000
Regular Highways: $104,000
Parks and Recreation: $96,000
Natural Resources - Other: $53,000
Parks and Recreation: $19,000
Judicial and Legal Services: $16,000
Correctional Institutions: $13,000
Judicial and Legal Services: $7,000
- Other Funds - Cash and Securities: $476,353,000
Cash and Securities: $357,718,000
- Sinking Funds - Cash and Securities: $18,980,000
Cash and Securities: $18,684,000
- State Intergovernmental - Health and Hospitals: $47,557,000
Health and Hospitals: $43,163,000
Other: $32,262,000
Other: $29,271,000
Highways: $18,888,000
Highways: $14,108,000
Public Welfare: $6,954,000
Public Welfare: $4,880,000
General Local Government Support: $2,684,000
General Local Government Support: $2,433,000
Housing and Community Development: $2,369,000
Housing and Community Development: $1,510,000
- Tax - Property: $217,439,000
Property: $206,746,000
General Sales and Gross Receipts: $119,488,000
General Sales and Gross Receipts: $98,467,000
Other License: $26,740,000
Documentary and Stock Transfer: $20,722,000
Other License: $19,667,000
Documentary and Stock Transfer: $18,962,000
Public Utilities Sales: $14,259,000
Public Utilities Sales: $14,145,000
Motor Vehicle License: $4,636,000
Motor Vehicle License: $4,224,000
Other Selective Sales: $3,633,000
Other Selective Sales: $3,077,000
Severance: $673,000
Severance: $464,000
Amusements Sales: $317,000
Amusements Sales: $265,000
Occupation and Business License - Other: $141,000
Occupation and Business License - Other: $99,000
- Total Salaries and Wages: $304,784,000
: $286,116,000
Supplemental Security Income (SSI) in 2006:
- Total number of recipients: 15,869
- Number of aged recipients: 1,494
- Number of blind and disabled recipients: 14,375
- Number of recipients under 18: 2,147
- Number of recipients between 18 and 64: 10,554
- Number of recipients older than 64: 3,168
- Number of recipients also receiving OASDI: 4,093
- Amount of payments (thousands of dollars): 7,911
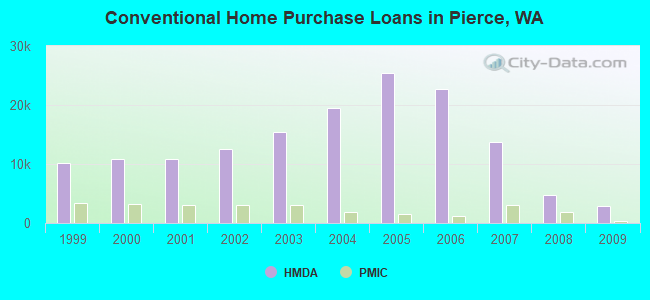
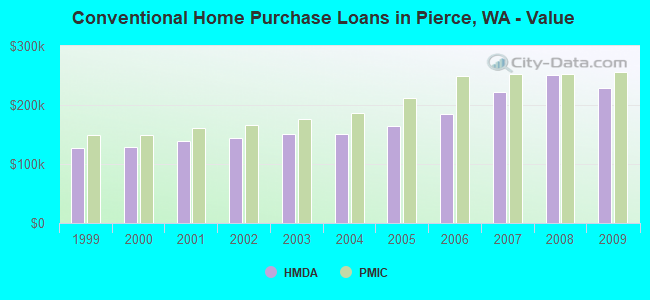
| Home Mortgage Disclosure Act Aggregated Statistics For Year 2009 (Based on 157 full tracts) | ||||||||||||||
| A) FHA, FSA/RHS & VA Home Purchase Loans | B) Conventional Home Purchase Loans | C) Refinancings | D) Home Improvement Loans | E) Loans on Dwellings For 5+ Families | F) Non-occupant Loans on < 5 Family Dwellings (A B C & D) | G) Loans On Manufactured Home Dwelling (A B C & D) | ||||||||
|---|---|---|---|---|---|---|---|---|---|---|---|---|---|---|
| Number | Average Value | Number | Average Value | Number | Average Value | Number | Average Value | Number | Average Value | Number | Average Value | Number | Average Value | |
| LOANS ORIGINATED | 5,132 | $229,136 | 2,808 | $229,517 | 23,120 | $228,922 | 871 | $135,126 | 76 | $1,981,671 | 1,544 | $188,825 | 883 | $164,773 |
| APPLICATIONS APPROVED, NOT ACCEPTED | 337 | $219,599 | 332 | $220,988 | 2,703 | $240,793 | 155 | $76,955 | 2 | $542,500 | 219 | $180,142 | 139 | $134,151 |
| APPLICATIONS DENIED | 784 | $220,084 | 696 | $228,487 | 7,983 | $245,833 | 544 | $100,129 | 17 | $1,289,000 | 692 | $184,442 | 507 | $140,051 |
| APPLICATIONS WITHDRAWN | 689 | $217,284 | 406 | $236,362 | 5,511 | $242,597 | 197 | $168,122 | 6 | $367,833 | 380 | $197,600 | 230 | $161,287 |
| FILES CLOSED FOR INCOMPLETENESS | 89 | $211,629 | 94 | $235,287 | 1,306 | $240,968 | 76 | $150,184 | 1 | $435,000 | 87 | $192,483 | 47 | $148,830 |
| Private Mortgage Insurance Companies Aggregated Statistics For Year 2009 (Based on 153 full tracts) | ||||||||
| A) Conventional Home Purchase Loans | B) Refinancings | C) Non-occupant Loans on < 5 Family Dwellings (A & B) | D) Loans On Manufactured Home Dwelling (A & B) | |||||
|---|---|---|---|---|---|---|---|---|
| Number | Average Value | Number | Average Value | Number | Average Value | Number | Average Value | |
| LOANS ORIGINATED | 336 | $255,354 | 499 | $255,517 | 6 | $199,667 | 2 | $167,000 |
| APPLICATIONS APPROVED, NOT ACCEPTED | 170 | $269,312 | 272 | $271,456 | 13 | $265,462 | 2 | $136,500 |
| APPLICATIONS DENIED | 74 | $239,932 | 160 | $267,125 | 4 | $269,750 | 1 | $160,000 |
| APPLICATIONS WITHDRAWN | 37 | $252,973 | 63 | $267,508 | 0 | $0 | 0 | $0 |
| FILES CLOSED FOR INCOMPLETENESS | 7 | $287,000 | 16 | $281,438 | 4 | $168,750 | 0 | $0 |
| Most common first names in Pierce County, WA among deceased individuals | ||
| Name | Count | Lived (average) |
|---|---|---|
| John | 3,389 | 74.3 years |
| William | 2,747 | 73.9 years |
| Robert | 2,640 | 71.0 years |
| Mary | 2,384 | 79.2 years |
| James | 2,290 | 70.8 years |
| George | 1,811 | 75.8 years |
| Charles | 1,755 | 73.7 years |
| Helen | 1,486 | 80.4 years |
| Margaret | 1,308 | 80.4 years |
| Dorothy | 1,299 | 78.4 years |
| Most common last names in Pierce County, WA among deceased individuals | ||
| Last name | Count | Lived (average) |
|---|---|---|
| Johnson | 1,693 | 76.6 years |
| Smith | 1,342 | 74.2 years |
| Anderson | 1,018 | 76.9 years |
| Miller | 703 | 74.5 years |
| Brown | 672 | 74.7 years |
| Jones | 655 | 73.3 years |
| Nelson | 631 | 77.2 years |
| Williams | 607 | 72.8 years |
| Peterson | 481 | 77.9 years |
| Wilson | 467 | 75.3 years |
| Businesses in Pierce County, WA | ||||
| Name | Count | Name | Count | |
|---|---|---|---|---|
| 24 Hour Fitness | 1 | Kincaid | 1 | |
| 7-Eleven | 28 | Kmart | 5 | |
| ALDO | 1 | Kroger | 23 | |
| AT&T | 19 | LA Fitness | 4 | |
| Abercrombie & Fitch | 1 | La Quinta | 2 | |
| Abercrombie Kids | 1 | La-Z-Boy | 1 | |
| Ace Hardware | 10 | Lane Bryant | 1 | |
| Aeropostale | 2 | Lane Furniture | 6 | |
| Albertsons | 9 | LensCrafters | 2 | |
| American Eagle Outfitters | 2 | Little Caesars Pizza | 10 | |
| Ann Taylor | 1 | Lowe's | 5 | |
| Apple Store | 1 | Macy's | 3 | |
| Applebee's | 5 | Marriott | 1 | |
| Arby's | 7 | Marshalls | 2 | |
| Audi | 1 | MasterBrand Cabinets | 30 | |
| AutoZone | 9 | Mazda | 2 | |
| Avenue | 2 | McDonald's | 32 | |
| BMW | 1 | Men's Wearhouse | 2 | |
| Bally Total Fitness | 2 | Motel 6 | 2 | |
| Barnes & Noble | 1 | Motherhood Maternity | 4 | |
| Baskin-Robbins | 14 | New Balance | 14 | |
| Bath & Body Works | 3 | Nike | 23 | |
| Baymont Inn | 1 | Nissan | 3 | |
| Bed Bath & Beyond | 2 | Nordstrom | 1 | |
| Ben & Jerry's | 1 | Office Depot | 5 | |
| Best Western | 4 | OfficeMax | 3 | |
| Blockbuster | 10 | Old Country Buffet | 2 | |
| Budget Car Rental | 2 | Old Navy | 3 | |
| Burger King | 17 | Olive Garden | 2 | |
| Carl\s Jr. | 2 | Outback | 2 | |
| Casual Male XL | 1 | Outback Steakhouse | 2 | |
| Catherines | 2 | Pac Sun | 2 | |
| Chevrolet | 5 | Panda Express | 4 | |
| Chico's | 1 | Panera Bread | 3 | |
| Chuck E. Cheese's | 1 | Papa John's Pizza | 7 | |
| Church's Chicken | 1 | Payless | 11 | |
| Cinnabon | 3 | Penske | 8 | |
| Circle K | 4 | PetSmart | 4 | |
| Cold Stone Creamery | 3 | Pier 1 Imports | 4 | |
| Coldwater Creek | 2 | Pizza Hut | 14 | |
| Comfort Inn | 1 | Popeyes | 5 | |
| Costco | 4 | Qdoba Mexican Grill | 2 | |
| Crossland Economy Studios | 2 | Quiznos | 9 | |
| Curves | 9 | RadioShack | 12 | |
| DHL | 3 | Red Lobster | 1 | |
| Dairy Queen | 13 | Red Robin | 3 | |
| Days Inn | 1 | Rite Aid | 15 | |
| Dennys | 7 | Rodeway Inn | 2 | |
| Discount Tire | 4 | Rue21 | 1 | |
| Domino's Pizza | 12 | Ryder Rental & Truck Leasing | 1 | |
| DressBarn | 1 | SAS Shoes | 1 | |
| Dressbarn | 1 | SONIC Drive-In | 3 | |
| Econo Lodge | 1 | Safeway | 17 | |
| Eddie Bauer | 1 | Sears | 7 | |
| Express | 1 | Sephora | 2 | |
| Extended Stay America | 2 | Soma Intimates | 1 | |
| Famous Footwear | 6 | Spencer Gifts | 2 | |
| Fashion Bug | 2 | Sprint Nextel | 11 | |
| FedEx | 58 | Staples | 1 | |
| Finish Line | 1 | Starbucks | 68 | |
| Firestone Complete Auto Care | 8 | Subaru | 2 | |
| Foot Locker | 2 | Subway | 66 | |
| Ford | 4 | T-Mobile | 29 | |
| Forever 21 | 1 | T.J.Maxx | 1 | |
| GNC | 15 | Taco Bell | 16 | |
| GameStop | 12 | Target | 6 | |
| Gap | 1 | The Limited | 1 | |
| Goodwill | 4 | The Room Place | 1 | |
| Gymboree | 2 | Torrid | 1 | |
| H&M | 1 | Toyota | 3 | |
| H&R Block | 39 | Toys"R"Us | 3 | |
| Hilton | 1 | Trader Joe's | 1 | |
| Holiday Inn | 4 | Travelodge | 1 | |
| Hollister Co. | 2 | True Value | 3 | |
| Home Depot | 6 | U-Haul | 31 | |
| Honda | 3 | UPS | 77 | |
| Hot Topic | 2 | Vans | 7 | |
| Howard Johnson | 3 | Verizon Wireless | 7 | |
| IHOP | 3 | Victoria's Secret | 2 | |
| J. Jill | 1 | Volkswagen | 2 | |
| JCPenney | 2 | Vons | 20 | |
| Jack In The Box | 20 | Walgreens | 16 | |
| Jamba Juice | 3 | Walmart | 5 | |
| Jones New York | 15 | Wendy's | 8 | |
| Journeys | 2 | Wet Seal | 2 | |
| Justice | 3 | YMCA | 8 | |
| KFC | 15 | |||
Pierce County on our top lists:
- #28 on the list of "Top 101 counties with the highest average weight of females"
- #41 on the list of "Top 101 counties with the largest increase in the number of births per 1000 residents 2000-2006 to 2007-2013 (pop 50,000+)"
- #41 on the list of "Top 101 counties with the highest ground withdrawal of fresh water for public supply"
- #41 on the list of "Top 101 counties with the highest ground withdrawal of fresh water for public supply (pop. 50,000+)"
- #48 on the list of "Top 101 counties with the highest percentage of residents relocating from foreign countries between 2010 and 2011 (pop. 50,000+)"
- #50 on the list of "Top 101 counties with the most Evangelical Protestant congregations"
- #51 on the list of "Top 101 counties with the most Evangelical Protestant congregations (pop. 50,000+)"
- #51 on the list of "Top 101 counties with the most Other adherents"
- #51 on the list of "Top 101 counties with the most Other adherents (pop. 50,000+)"
- #52 on the list of "Top 101 counties with the most Other congregations (pop. 50,000+)"
- #53 on the list of "Top 101 counties with the most Other congregations"
- #56 on the list of "Top 101 counties with the most Evangelical Protestant adherents"
- #56 on the list of "Top 101 counties with the most Evangelical Protestant adherents (pop. 50,000+)"
- #64 on the list of "Top 101 counties with the highest percentage of residents relocating to foreign countries in 2011 (pop. 50,000+)"
- #69 on the list of "Top 101 counties with the highest total withdrawal of fresh water for public supply (pop. 50,000+)"
- #70 on the list of "Top 101 counties with the highest total withdrawal of fresh water for public supply"
- #72 on the list of "Top 101 counties with the highest percentage of residents that exercised in the past month"
- #72 on the list of "Top 101 counties with the highest percentage of residents relocating from foreign countries between 2010 and 2011"
- #78 on the list of "Top 101 counties with the most Mainline Protestant congregations"
- #79 on the list of "Top 101 counties with the most Mainline Protestant congregations (pop. 50,000+)"