Kitsap County, Washington (WA)
County owner-occupied free and clear houses and condos in 2010: 16,450
County owner-occupied houses and condos in 2000: 58,252
Renter-occupied apartments: 30,795 (it was 28,164 in 2000)
| % of renters here: | 33% |
| State: | 36% |
Land area: 396 sq. mi.
Water area: 170.0 sq. mi.
Population density: 701 people per square mile (high).
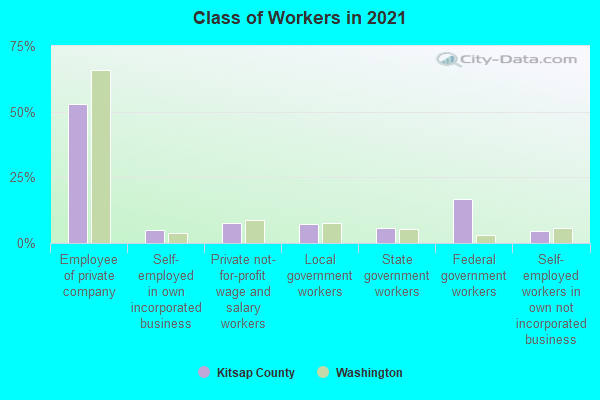
Industries providing employment: Educational, health and social services (18.6%), Professional, scientific, management, administrative, and waste management services (14.6%), Retail trade (12.6%), Manufacturing (12.1%).
Type of workers:
- Private wage or salary: 60%
- Government: 33%
- Self-employed, not incorporated: 6%
- Unpaid family work: 0%
- OSM Map
- General Map
- Google Map
- MSN Map

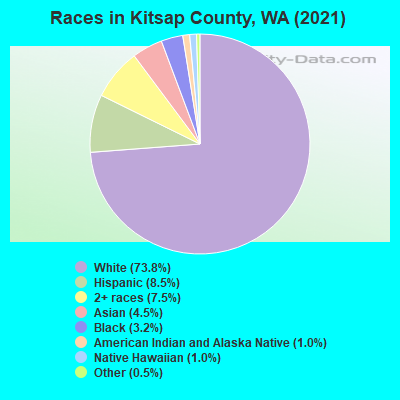
- 202,84173.1%White Non-Hispanic Alone
- 25,1589.1%Hispanic or Latino
- 23,3708.4%Two or more races
- 13,8565.0%Asian alone
- 6,6242.4%Black Non-Hispanic Alone
- 2,1700.8%Native Hawaiian and Other
Pacific Islander alone - 1,9750.7%American Indian and Alaska Native alone
- 1,6790.6%Some other race alone
| Median resident age: | 40.5 years |
| Washington median age: | 38.4 years |
| Males: 143,650 | |
| Females: 134,023 |

 | Vaccine Mandates - your opinion (1053 replies) |
| Will people in Seattle ever let go of masks? (215 replies) |
| Lakebay, WA and Surrounding Area (37 replies) |
| Thoughts on crime in western WA (Kitsap/Mason/(north)Pierce) (35 replies) |
| Moving to Bremerton (42 replies) |
| when is spring house selling season on Kitsap peninsula? (5 replies) |
| Kitsap County: | 2.0 people |
| Washington: | 3 people |
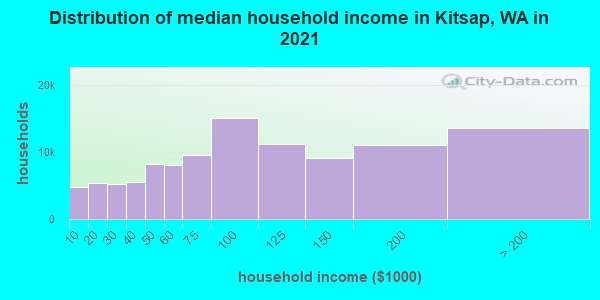
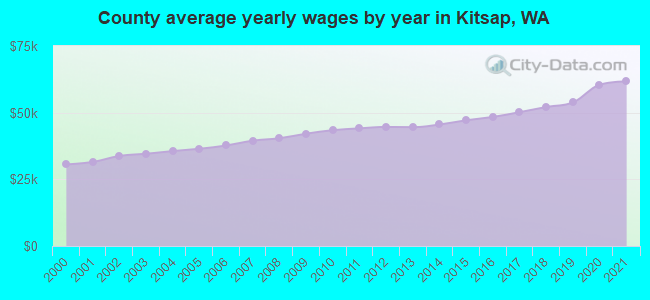
Estimated median household income in 2022: $94,775 ($46,840 in 1999)
| This county: | $94,775 |
| Washington: | $91,306 |
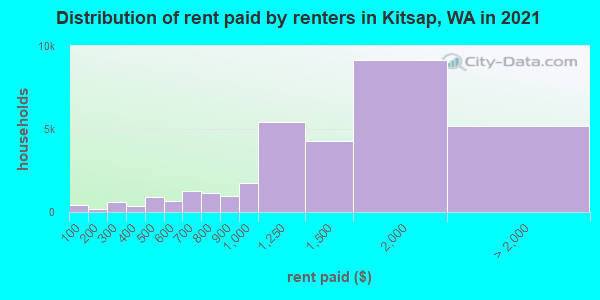
Median contract rent in 2022 for apartments: $1,549 (lower quartile is $1,103, upper quartile is $1,981)
| This county: | $1549 |
| State: | $1495 |
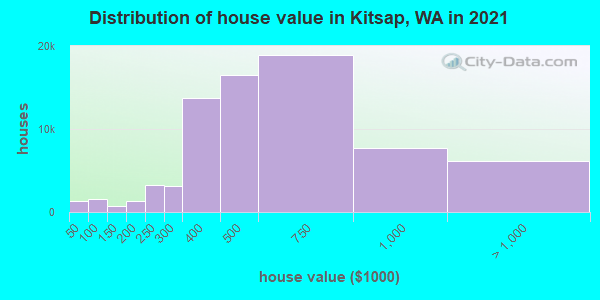
Estimated median house or condo value in 2022: $538,400 (it was $145,200 in 2000)
| Kitsap: | $538,400 |
| Washington: | $569,500 |
Mean price in 2022:
Median monthly housing costs for homes and condos with a mortgage: $2,082Detached houses: $689,246
Here: $689,246 State: $734,307 Townhouses or other attached units: $490,921
Here: $490,921 State: $657,697 In 2-unit structures: $615,215
Here: $615,215 State: $534,634 In 3-to-4-unit structures: $532,551
Here: $532,551 State: $510,239 In 5-or-more-unit structures: $413,149
Here: $413,149 State: $503,183 Mobile homes: $252,413
Here: $252,413 State: $218,362 Occupied boats, RVs, vans, etc.: $80,405
Here: $80,405 State: $159,523
Median monthly housing costs for units without a mortgage: $666
Institutionalized population: 1,859
Crime in 2021 (reported by the sheriff's office or county police, not the county total):
- Murders: 4
- Rapes: 84
- Robberies: 38
- Assaults: 333
- Burglaries: 603
- Thefts: 1888
- Auto thefts: 388
Crime in 2020 (reported by the sheriff's office or county police, not the county total):
- Murders: 4
- Rapes: 99
- Robberies: 23
- Assaults: 230
- Burglaries: 477
- Thefts: 1731
- Auto thefts: 240
Health of residents in Kitsap County based on CDC Behavioral Risk Factor Surveillance System Survey Questionnaires from 2003 to 2012:
General health status score of residents in this county from 1 (poor) to 5 (excellent) is 3.6. This is about average.81.3% of residents exercised in the past month. This is more than average.
50.0% of residents smoked 100+ cigarettes in their lives. This is about average.
81.5% of adult residents drank alcohol in the past 30 days. This is more than average.
72.1% of residents visited a dentist within the past year. This is about average.
Average weight of males is 198 pounds. This is about average.
Average weight of females is 168 pounds. This is more than average.
33.5% of residents keep firearms around their homes. This is more than average.
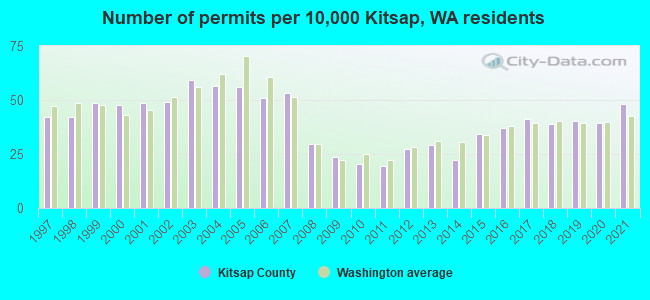
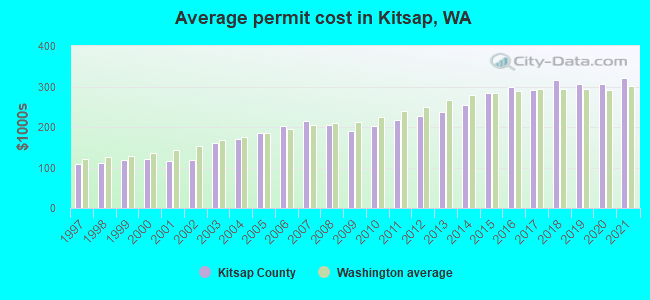
Single-family new house construction building permits:
- 2022: 1041 buildings, average cost: $344,300
- 2021: 1112 buildings, average cost: $320,100
- 2020: 909 buildings, average cost: $306,800
- 2019: 931 buildings, average cost: $306,600
- 2018: 903 buildings, average cost: $317,000
- 2017: 952 buildings, average cost: $292,100
- 2016: 862 buildings, average cost: $298,200
- 2015: 796 buildings, average cost: $283,200
- 2014: 519 buildings, average cost: $253,600
- 2013: 674 buildings, average cost: $236,300
- 2012: 634 buildings, average cost: $227,000
- 2011: 451 buildings, average cost: $216,800
- 2010: 468 buildings, average cost: $203,200
- 2009: 552 buildings, average cost: $191,200
- 2008: 682 buildings, average cost: $205,600
- 2007: 1239 buildings, average cost: $213,800
- 2006: 1184 buildings, average cost: $202,500
- 2005: 1300 buildings, average cost: $186,100
- 2004: 1308 buildings, average cost: $171,400
- 2003: 1376 buildings, average cost: $159,500
- 2002: 1135 buildings, average cost: $117,600
- 2001: 1126 buildings, average cost: $116,200
- 2000: 1105 buildings, average cost: $121,000
- 1999: 1128 buildings, average cost: $117,800
- 1998: 976 buildings, average cost: $110,500
- 1997: 975 buildings, average cost: $107,600
Median real estate property taxes paid for housing units with mortgages in 2022: $3,847 (0.7%)
Median real estate property taxes paid for housing units with no mortgage in 2022: $4,028 (0.7%)
| Kitsap County: | 9.9% |
| Washington: | 10.0% |
Median age of residents in 2022: 40.5 years old
(Males: 38.7 years old, Females: 42.3 years old)
(Median age for: White residents: 44.1 years old, Black residents: 39.4 years old, American Indian residents: 37.8 years old, Asian residents: 47.6 years old, Hispanic or Latino residents: 27.1 years old, Other race residents: 27.4 years old)
Area name: Bremerton-Silverdale, WA MSA
Fair market rent in 2006 for a 1-bedroom apartment in Kitsap County is $623 a month.
Fair market rent for a 2-bedroom apartment is $767 a month.
Fair market rent for a 3-bedroom apartment is $1098 a month.
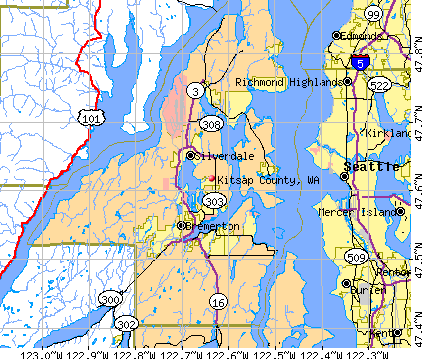
Cities in this county include: Bremerton, Bainbridge Island, Silverdale, Port Orchard, Bangor Trident Base, Parkwood, Poulsbo, Bangor Base, East Port Orchard, Manchester.
2023 air pollution in Kitsap County:
Particulate Matter (PM2.5) Annual: 4.4 µg/m3(standard limit: 15.0 µg/m3). Below U.S. average.
Neighboring counties: McHenry County, North Dakota  , San Juan County
  , Mineral County, Montana , Walsh County, North Dakota , Ontonagon County, Michigan .
| Here: | 4.7% |
| Washington: | 4.6% |
Current college students: 11,528
People 25 years of age or older with a high school degree or higher: 94.4%
People 25 years of age or older with a bachelor's degree or higher: 36.2%
Number of foreign born residents: 20,852 (53.7% naturalized citizens)
| Kitsap County: | 7.5% |
| Whole state: | 15.3% |
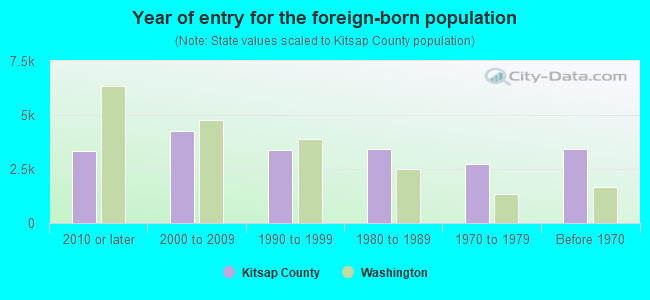
- Year of entry for the foreign-born population
- 4,6372010 or later
- 3,9542000 to 2009
- 3,3991990 to 1999
- 3,4321980 to 1989
- 2,7181970 to 1979
- 3,432Before 1970
Mean travel time to work (commute): minutes
Percentage of county residents living and working in this county: 99.8%
Housing units in structures:
- One, detached: 83,373
- One, attached: 5,016
- Two: 1,811
- 3 or 4: 3,992
- 5 to 9: 3,320
- 10 to 19: 5,868
- 20 to 49: 2,847
- 50 or more: 3,543
- Mobile homes: 7,110
- Boats, RVs, vans, etc.: 140
Housing units in Kitsap County with a mortgage: 52,508 (5,524 second mortgage, 608 home equity loan, 3,785 both second mortgage and home equity loan)
Houses without a mortgage: 1,354
| Here: | 98.1% with mortgage |
| State: | 98.0% with mortgage |
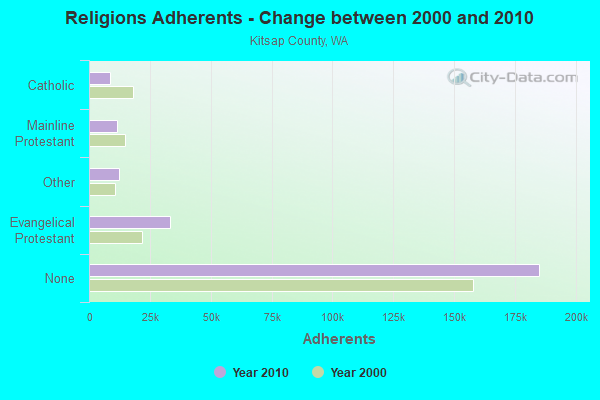
Religion statistics for Kitsap County
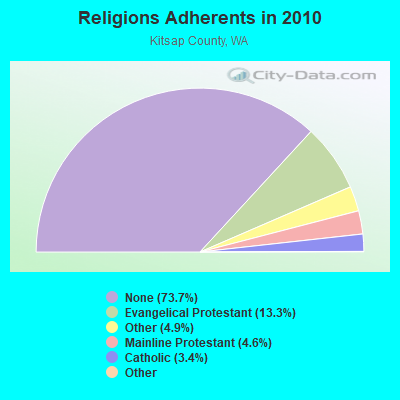
| Religion | Adherents | Congregations |
|---|---|---|
| Evangelical Protestant | 33,373 | 118 |
| Other | 12,378 | 42 |
| Mainline Protestant | 11,484 | 39 |
| Catholic | 8,572 | 5 |
| Orthodox | 140 | 2 |
| Black Protestant | 84 | 1 |
| None | 185,102 | - |
Source: Clifford Grammich, Kirk Hadaway, Richard Houseal, Dale E.Jones, Alexei Krindatch, Richie Stanley and Richard H.Taylor. 2012. 2010 U.S.Religion Census: Religious Congregations & Membership Study. Association of Statisticians of American Religious Bodies. Jones, Dale E., et al. 2002. Congregations and Membership in the United States 2000. Nashville, TN: Glenmary Research Center.
Food Environment Statistics:
| Kitsap County: | 1.81 / 10,000 pop. |
| State: | 2.06 / 10,000 pop. |
| Here: | 0.13 / 10,000 pop. |
| Washington: | 0.19 / 10,000 pop. |
| This county: | 1.39 / 10,000 pop. |
| Washington: | 1.18 / 10,000 pop. |
| Kitsap County: | 2.23 / 10,000 pop. |
| Washington: | 2.67 / 10,000 pop. |
| This county: | 7.26 / 10,000 pop. |
| State: | 8.26 / 10,000 pop. |
| Kitsap County: | 7.9% |
| Washington: | 7.7% |
| Kitsap County: | 27.6% |
| State: | 25.7% |
| Here: | 11.4% |
| State: | 13.9% |
Agriculture in Kitsap County:
Average size of farms: 27 acresAverage value of agricultural products sold per farm: $52,322
Average value of crops sold per acre for harvested cropland: $3247.80
The value of livestock, poultry, and their products as a percentage of the total market value of agricultural products sold: 56.62%
Average total farm production expenses per farm: $54,011
Harvested cropland as a percentage of land in farms: 25.49%
Irrigated harvested cropland as a percentage of land in farms: 9.29%
Average market value of all machinery and equipment per farm: $41,280
The percentage of farms operated by a family or individual: 89.44%
Average age of principal farm operators: 54 years
Average number of cattle and calves per 100 acres of all land in farms: 8.08
Vegetables: 72 harvested acres
Land in orchards: 57 acres
Earthquake activity:
Kitsap County-area historical earthquake activity is significantly above Washington state average. It is 1277% greater than the overall U.S. average.On 4/13/1949 at 19:55:42, a magnitude 7.0 (7.0 UK, Class: Major, Intensity: VIII - XII) earthquake occurred 26.2 miles away from Kitsap County center, causing $80,000,000 total damage
On 2/28/2001 at 18:54:32, a magnitude 6.8 (6.8 MD, Depth: 32.2 mi, Class: Strong, Intensity: VII - IX) earthquake occurred 32.6 miles away from the county center
On 2/28/2001 at 18:54:32, a magnitude 6.8 (6.5 MB, 6.6 MS, 6.8 MW) earthquake occurred 36.5 miles away from the county center, causing $2,000,000,000 total damage and $305,000,000 insured losses
On 4/29/1965 at 15:28:43, a magnitude 6.6 (6.6 UK) earthquake occurred 25.1 miles away from the county center, causing $28,000,000 total damage
On 7/3/1999 at 01:43:54, a magnitude 5.8 (5.4 MB, 5.5 MS, 5.8 MW, 5.3 ME, Depth: 25.2 mi, Class: Moderate, Intensity: VI - VII) earthquake occurred 47.5 miles away from Kitsap County center
On 5/3/1996 at 04:04:22, a magnitude 5.5 (5.2 MB, 5.3 MD, 5.5 ML, Depth: 2.5 mi) earthquake occurred 44.2 miles away from the county center
Magnitude types: body-wave magnitude (MB), duration magnitude (MD), energy magnitude (ME), local magnitude (ML), surface-wave magnitude (MS), moment magnitude (MW)
Most recent natural disasters:
- Washington Covid-19 Pandemic, Incident Period: January 20, 2020, Major Disaster (Presidential) Declared DR-4481-WA: March 22, 2020, FEMA Id: 4481, Natural disaster type: Other
- Washington Severe Storms, Flooding, Landslides, and Mudslides, Incident Period: December 01, 2007 to December 17, 2007, Major Disaster (Presidential) Declared DR-1734: December 08, 2007, FEMA Id: 1734, Natural disaster type: Storm, Mudslide, Landslide, Flood
- Washington Severe Storms, Flooding, Tidal Surge, Landslides, and Mudslides, Incident Period: January 27, 2006 to February 04, 2006, Major Disaster (Presidential) Declared DR-1641: May 17, 2006, FEMA Id: 1641, Natural disaster type: Storm, Mudslide, Landslide, Flood
- Washington Hurricane Katrina Evacuation, Incident Period: August 29, 2005 to October 01, 2005, Emergency Declared EM-3227: September 07, 2005, FEMA Id: 3227, Natural disaster type: Hurricane
- Washington Severe Storms and Flooding, Incident Period: October 15, 2003 to October 23, 2003, Major Disaster (Presidential) Declared DR-1499: November 07, 2003, FEMA Id: 1499, Natural disaster type: Storm, Flood
- Washington Earthquake, Incident Period: February 28, 2001 to March 16, 2001, Major Disaster (Presidential) Declared DR-1361: March 01, 2001, FEMA Id: 1361, Natural disaster type: Earthquake
- Washington Severe Storms/Flooding/Landslides/Mudslides, Incident Period: March 18, 1997 to March 28, 1997, Major Disaster (Presidential) Declared DR-1172: April 02, 1997, FEMA Id: 1172, Natural disaster type: Storm, Mudslide, Landslide, Flood
- Washington Severe Winter Storms/Flooding, Incident Period: December 26, 1996 to February 10, 1997, Major Disaster (Presidential) Declared DR-1159: January 17, 1997, FEMA Id: 1159, Natural disaster type: Winter Storm, Flood
- Washington Severe Storms/Flooding, Incident Period: January 26, 1996 to February 23, 1996, Major Disaster (Presidential) Declared DR-1100: February 09, 1996, FEMA Id: 1100, Natural disaster type: Storm, Flood
- Washington High Tides, Severe Storm, Incident Period: December 20, 1990 to December 31, 1990, Major Disaster (Presidential) Declared DR-896: March 08, 1991, FEMA Id: 896, Natural disaster type: Storm
- 5 other natural disasters have been reported since 1953.
The number of natural disasters in Kitsap County (15) is near the US average (15).
Major Disasters (Presidential) Declared: 14
Emergencies Declared: 1
Causes of natural disasters: Floods: 9, Storms: 9, Mudslides: 4, Landslides: 3, Earthquakes: 2, Hurricane: 1, Snow: 1, Volcanic Eruption: 1, Winter Storm: 1, Other: 1 (Note: some incidents may be assigned to more than one category).
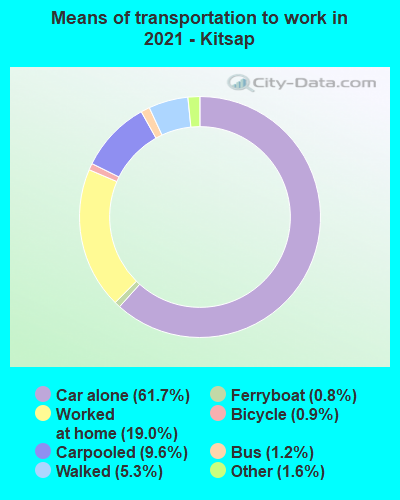
Means of transportation to work:
- Drove a car alone: 83,208 (65.4%)
- Carpooled: 15,139 (11.9%)
- Bus: 966 (0.8%)
- Ferryboat: 321 (0.3%)
- Taxicab, motorcycle, or other means: 2,075 (1.6%)
- Bicycle: 640 (0.5%)
- Walked: 6,771 (5.3%)
- Worked at home: 18,196 (14.3%)
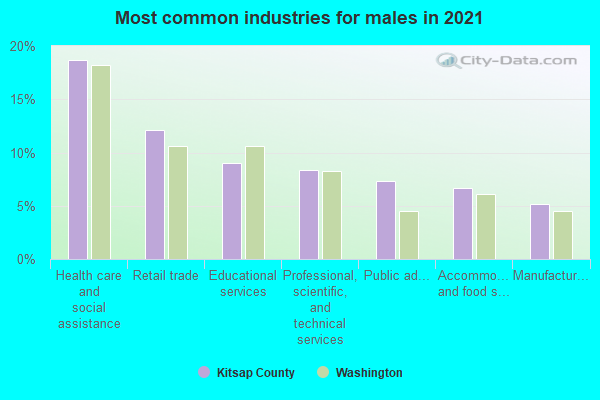
- Health care and social assistance (18%)
- Retail trade (11%)
- Educational services (8%)
- Professional, scientific, and technical services (7%)
- Public administration (6%)
- Accommodation and food services (5%)
- Manufacturing (5%)
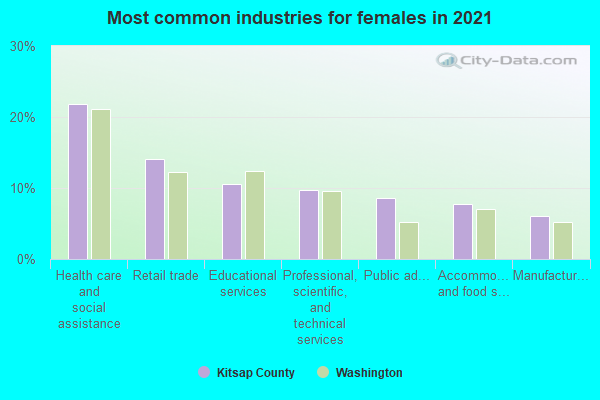
- Health care and social assistance (22%)
- Retail trade (13%)
- Educational services (9%)
- Professional, scientific, and technical services (8%)
- Public administration (7%)
- Accommodation and food services (7%)
- Manufacturing (6%)
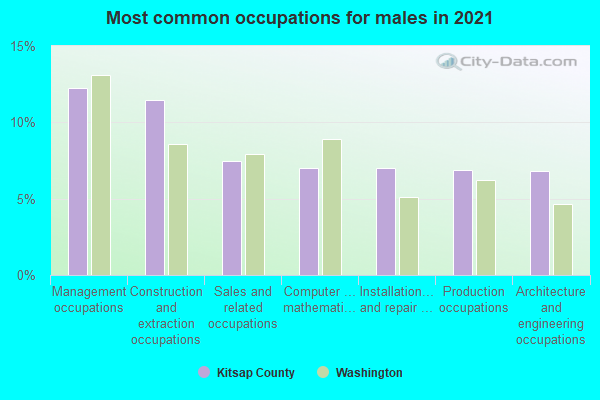
- Management occupations (13%)
- Construction and extraction occupations (11%)
- Computer and mathematical occupations (8%)
- Sales and related occupations (8%)
- Architecture and engineering occupations (7%)
- Business and financial operations occupations (6%)
- Installation, maintenance, and repair occupations (6%)
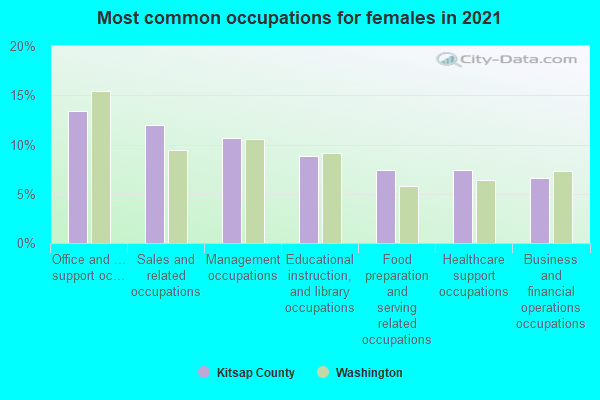
- Office and administrative support occupations (14%)
- Sales and related occupations (10%)
- Management occupations (9%)
- Business and financial operations occupations (8%)
- Educational instruction, and library occupations (7%)
- Health diagnosing and treating practitioners and other technical occupations (7%)
- Food preparation and serving related occupations (7%)
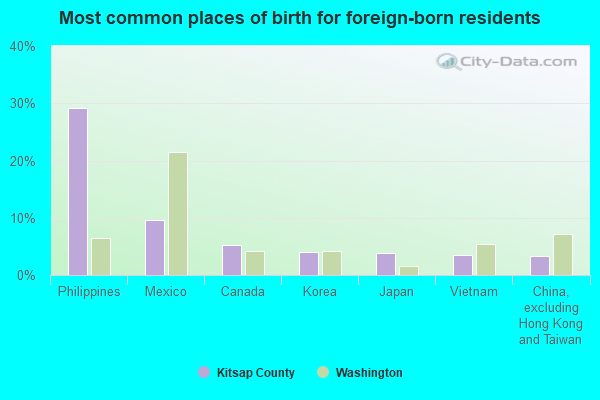
- Philippines (27%)
- Mexico (12%)
- Japan (4%)
- Canada (4%)
- Guatemala (4%)
- Vietnam (3%)
- Korea (3%)
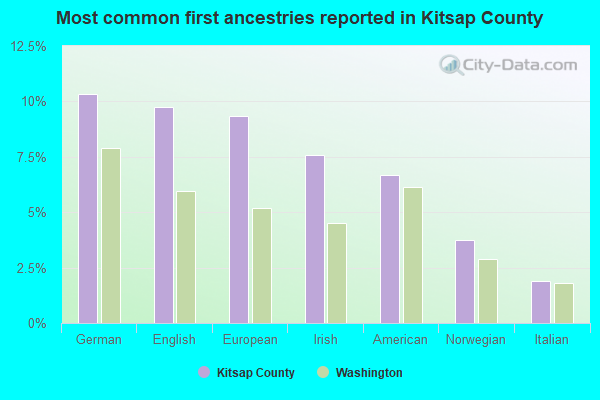
- European (11%)
- German (10%)
- English (10%)
- American (8%)
- Irish (7%)
- Norwegian (4%)
- Italian (2%)
People in group quarters in Kitsap County, Washington in 2010:
- 3,237 people in military ships
- 2,350 people in military barracks and dormitories (nondisciplinary)
- 1,319 people in nursing facilities/skilled-nursing facilities
- 657 people in other noninstitutional facilities
- 354 people in local jails and other municipal confinement facilities
- 287 people in group homes intended for adults
- 133 people in residential treatment centers for adults
- 130 people in emergency and transitional shelters (with sleeping facilities) for people experiencing homelessness
- 78 people in military treatment facilities with assigned patients
- 56 people in correctional residential facilities
- 39 people in correctional facilities intended for juveniles
- 38 people in workers' group living quarters and job corps centers
- 26 people in college/university student housing
- 13 people in mental (psychiatric) hospitals and psychiatric units in other hospitals
- 5 people in maritime/merchant vessels
People in group quarters in Kitsap County, Washington in 2000:
- 2,218 people in military ships
- 1,851 people in military disciplinary barracks
- 1,337 people in nursing homes
- 612 people in military barracks, etc.
- 541 people in local jails and other confinement facilities (including police lockups)
- 280 people in other noninstitutional group quarters
- 102 people in homes or halfway houses for drug/alcohol abuse
- 60 people in other nonhousehold living situations
- 53 people in schools, hospitals, or wards for the intellectually disabled
- 53 people in military transient quarters for temporary residents
- 49 people in short-term care, detention or diagnostic centers for delinquent children
- 32 people in homes for the mentally retarded
- 15 people in other group homes
- 13 people in homes for the mentally ill
- 5 people in homes for the physically handicapped
- 2 people in hospitals/wards and hospices for chronically ill
- 2 people in hospices or homes for chronically ill
- 2 people in religious group quarters
8.72% of this county's 2021 resident taxpayers lived in other counties in 2020 ($89,569 average adjusted gross income)
| Here: | 8.72% |
| Washington average: | 7.53% |
0.23% of residents moved from foreign countries ($1,775 average AGI)
Kitsap County: 0.23% Washington average: 0.05%
3.84% relocated from other counties in Washington ($43,140 average AGI)
4.65% relocated from other states ($44,653 average AGI)
Kitsap County: 4.65% Washington average: 3.85%
Top counties from which taxpayers relocated into this county between 2020 and 2021:
| from King County, WA | |
| from Pierce County, WA | |
| from San Diego County, CA | |
| from Snohomish County, WA | |
| from Mason County, WA | |
| from Honolulu County, HI | |
| from Los Angeles County, CA |
8.34% of this county's 2020 resident taxpayers moved to other counties in 2021 ($88,661 average adjusted gross income)
| Here: | 8.34% |
| Washington average: | 7.40% |
0.15% of residents moved to foreign countries ($1,281 average AGI)
Kitsap County: 0.15% Washington average: 0.04%
3.39% relocated to other counties in Washington ($29,274 average AGI)
4.80% relocated to other states ($58,106 average AGI)
Kitsap County: 4.80% Washington average: 3.73%
Top counties to which taxpayers relocated from this county between 2020 and 2021:
| to Pierce County, WA | |
| to King County, WA | |
| to San Diego County, CA | |
| to Mason County, WA | |
| to Snohomish County, WA | |
| to Jefferson County, WA | |
| to Maricopa County, AZ |
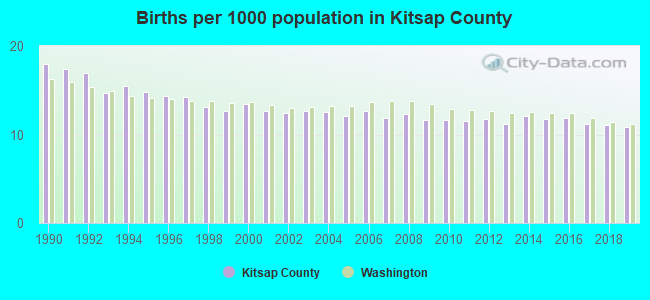
Births per 1000 population from 1990 to 1999: 15.2
Births per 1000 population from 2000 to 2009: 12.4
Births per 1000 population from 2010 to 2022: 9.6
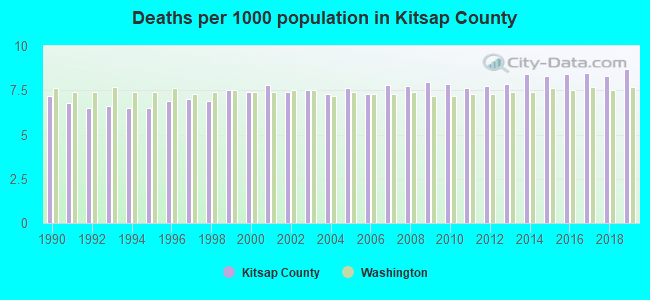
Deaths per 1000 population from 1990 to 1999: 6.8
Deaths per 1000 population from 2000 to 2009: 7.6
Deaths per 1000 population from 2010 to 2020: 8.2
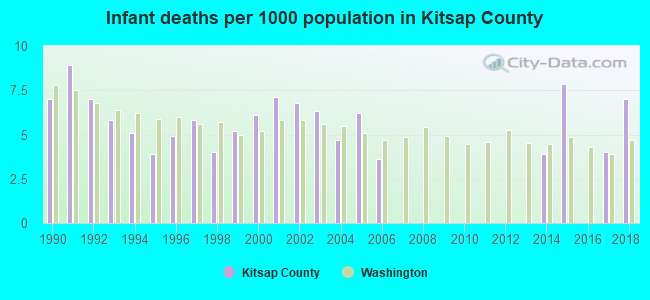
Infant deaths per 1000 live births from 1990 to 1999: 5.8
Infant deaths per 1000 live births from 2000 to 2009: 4.1
Infant deaths per 1000 live births from 2010 to 2021: 2.9
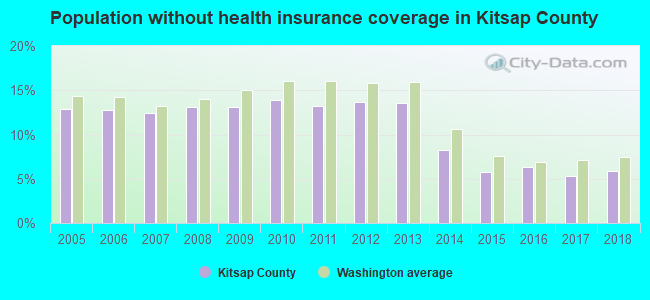
Persons under 19 years old without health insurance coverage in 2018: 2.7%
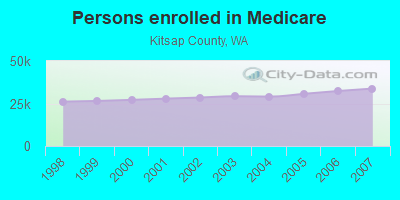
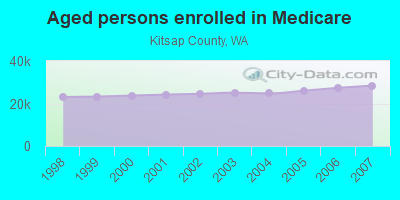
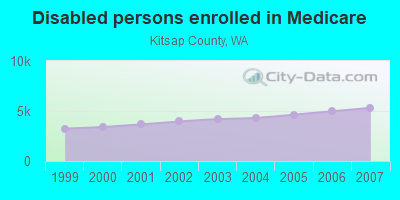
Persons enrolled in hospital insurance and/or supplemental medical insurance (Medicare) in July 1, 2007: 33,781 (28,467 aged, 5,314 disabled)
Children under 18 without health insurance coverage in 2007: 4,271 (7%)
Most common underlying causes of death in Kitsap County, Washington in 1999 - 2019:
- Alzheimer disease, unspecified (2,926)
- Bronchus or lung, unspecified - Malignant neoplasms (2,495)
- Acute myocardial infarction, unspecified (2,264)
- Atherosclerotic heart disease (2,045)
- Chronic obstructive pulmonary disease, unspecified (1,661)
- Stroke, not specified as haemorrhage or infarction (1,124)
- Atherosclerotic cardiovascular disease, so described (790)
- Breast, unspecified - Malignant neoplasms (667)
- Pancreas, unspecified - Malignant neoplasms (653)
- Colon, unspecified - Malignant neoplasms (576)
Population without health insurance coverage in 2000: 12%
Children under 18 without health insurance coverage in 2000: 9%
Short term general hospital admissions per 100,000 population in 2004: 7,113
Short term general hospital beds per 100,000 population in 2004: 128
Emergency room visits per 100,000 population in 2004: 32,489
General practice office based MDs per 100,000 population in 2005: 1,262
Medical specialist MDs per 100,000 population in 2005: 747
Dentists per 100,000 population in 1998: 3
Total births per 100,000 population, July 2005 - July 2006 : 42
Total deaths per 100,000 population, July 2005 - July 2006: 93
Limited-service eating places per 100,000 population in 2005 : 12
EPA green book nonattainment status in 2004-2006: 1
Homicides per 1,000,000 population from 2000 to 2006: 21.2. This is less than state average.
Suicides per 1,000,000 population from 2000 to 2006: 122.1. This is less than state average.
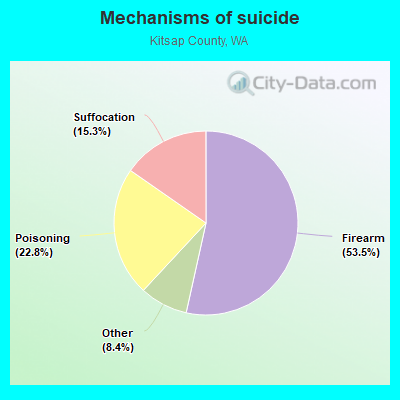
- Firearm - 65.3
- Poisoning - 27.8
- Suffocation - 18.7
- Other - 10.3
Household type by relationship:
Households: 277,673- Male householders: 56,517 (12,950 living alone), Female householders: 52,728 (12,893 living alone)
59,144 spouses (58,582 opposite-sex spouses), 8,178 unmarried partners, (7,156 opposite-sex unmarried partners), 69,675 children (65,040 natural, 1,101 adopted, 3,534 stepchildren), 3,924 grandchildren, 2,353 brothers or sisters, 4,193 parents, 53 foster children, 3,561 other relatives, 10,020 non-relatives
- In group quarters: 7,327
Size of family households: 33,028 2-persons, 19,673 3-persons, 12,364 4-persons, 6,896 5-persons, 2,321 6-persons, 1,682 7-or-more-persons.
Size of nonfamily households: 25,843 1-person, 5,687 2-persons, 1,045 3-persons, 613 4-persons, 52 5-persons, 41 6-persons.
34,811 married couples with children.
14,631 single-parent households (4,855 men, 9,776 women).
91.0% of residents of Kitsap speak English at home.
3.2% of residents speak Spanish at home (67% speak English very well, 19% speak English well, 8% speak English not well, 6% don't speak English at all).
1.3% of residents speak other Indo-European language at home (88% speak English very well, 8% speak English well, 4% speak English not well).
3.7% of residents speak Asian or Pacific Island language at home (65% speak English very well, 28% speak English well, 6% speak English not well, 1% don't speak English at all).
0.4% of residents speak other language at home (68% speak English very well, 14% speak English well, 13% speak English not well, 4% don't speak English at all).
In fiscal year 2004:
Federal Government expenditure: $2,917,450,000 ($12,200 per capita)
Department of Defense expenditure: $1,690,507,000
Federal direct payments to individuals for retirement and disability: $813,580,000
Federal other direct payments to individuals: $182,269,000
Federal direct payments not to individuals: $7,228,000
Federal grants: $293,687,000
Federal procurement contracts: $542,338,000 ($476,656,000 Department of Defense)
Federal salaries and wages: $1,078,347,000 ($1,046,652,000 Department of Defense)
Federal Government direct loans: $1,614,000
Federal guaranteed/insured loans: $297,357,000
Federal Government insurance: $100,504,000
Population change from April 1, 2000 to July 1, 2005:
Births: 15,549| Here: | 65 per 1000 residents |
| State: | 66 per 1000 residents |
Deaths: 9,403
| Here: | 39 per 1000 residents |
| State: | 38 per 1000 residents |
Net international migration: +1,278
| Here: | +5 per 1000 residents |
| State: | +21 per 1000 residents |
Net internal migration: +1,651
| Here: | +7 per 1000 residents |
| State: | +13 per 1000 residents |
Total withdrawal of fresh water for public supply: 23.48 millions of gallons per day (75% from ground, 25% from surface)
| Here: | 6.5 |
| State: | 6.5 |
| Here: | 4.4 |
| State: | 3.9 |
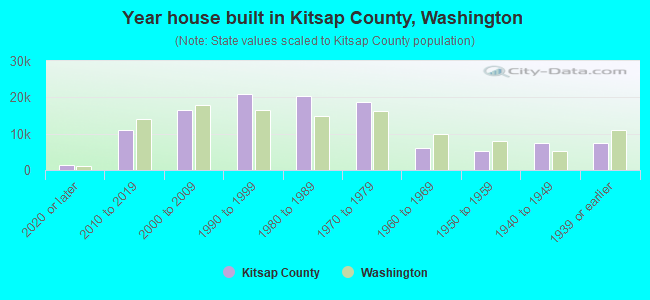
- Year house built in Kitsap County, Washington
- 1,8702020 or later
- 10,8362010 to 2019
- 17,2282000 to 2009
- 22,8321990 to 1999
- 18,0081980 to 1989
- 18,4201970 to 1979
- 7,3461960 to 1969
- 4,4501950 to 1959
- 5,5921940 to 1949
- 10,4381939 or earlier
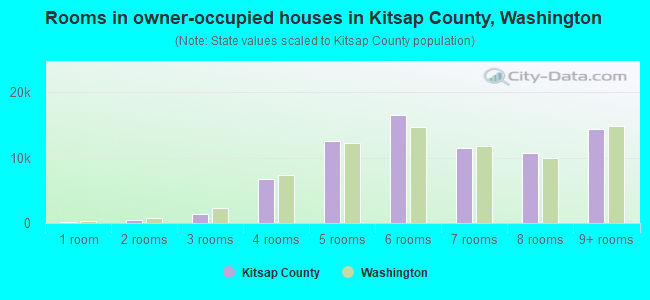
- Rooms in owner-occupied houses in Kitsap County, Washington
- 3241 room
- 4352 rooms
- 2,0333 rooms
- 7,3244 rooms
- 11,3705 rooms
- 16,4316 rooms
- 12,4137 rooms
- 9,9338 rooms
- 16,3079+ rooms
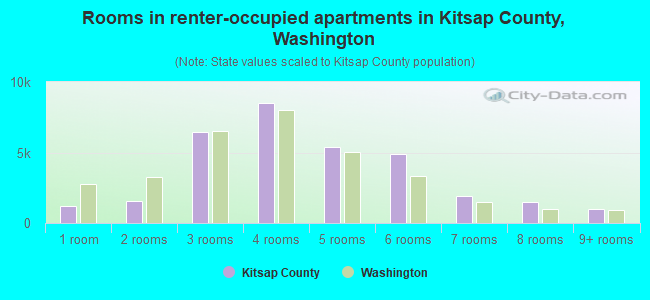
- Rooms in renter-occupied apartments in Kitsap County, Washington
- 1,0931 room
- 1,3092 rooms
- 4,3923 rooms
- 10,7074 rooms
- 6,8835 rooms
- 3,9846 rooms
- 1,8317 rooms
- 7958 rooms
- 1,6819+ rooms
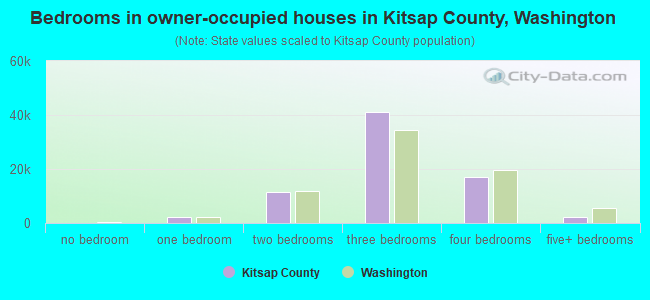
- Bedrooms in owner-occupied houses in Kitsap County, Washington
- 324no bedroom
- 1,8591 bedroom
- 13,2652 bedrooms
- 40,3433 bedrooms
- 17,5494 bedrooms
- 3,2305+ bedrooms
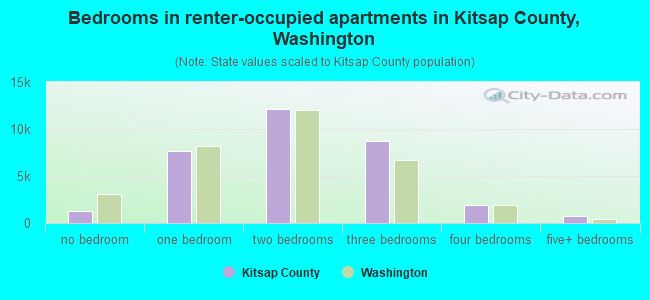
- Bedrooms in renter-occupied apartments in Kitsap County, Washington
- 1,136no bedroom
- 5,6761 bedroom
- 13,6182 bedrooms
- 9,6313 bedrooms
- 1,7494 bedrooms
- 8655+ bedrooms
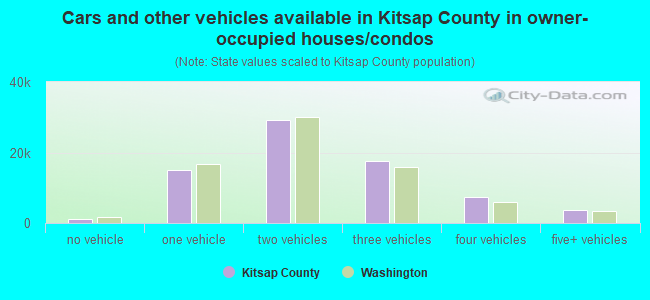
- Cars and other vehicles available in Kitsap County in owner-occupied houses/condos
- 1,150no vehicle
- 16,6321 vehicle
- 30,2652 vehicles
- 18,1123 vehicles
- 6,5734 vehicles
- 3,8385+ vehicles
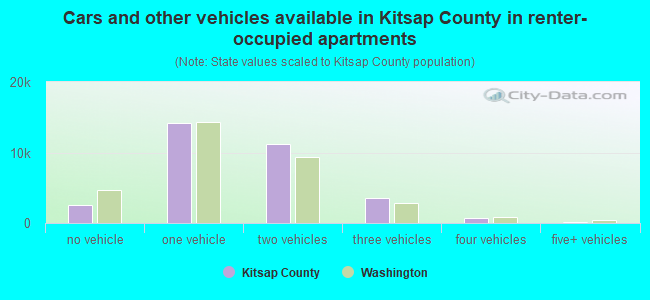
- Cars and other vehicles available in Kitsap County in renter-occupied apartments
- 3,771no vehicle
- 13,3891 vehicle
- 10,7182 vehicles
- 3,2773 vehicles
- 1,4104 vehicles
- 1105+ vehicles
82.7% of Kitsap County residents lived in the same house 1 years ago.
Out of people who lived in different houses, 36% lived in this county.
Out of people who lived in different counties, 30% lived in Washington.
| Kitsap County: | 82.7% |
| State average: | 85.2% |
Place of birth for U.S.-born residents:
- This state: 121,714
- Other state: 128,723
- Northeast: 16,542
- Midwest: 26,854
- South: 27,462
- West: 57,865
- 54.7%Electricity
- 29.1%Utility gas
- 7.6%Bottled, tank, or LP gas
- 4.0%Wood
- 3.8%Fuel oil, kerosene, etc.
- 0.4%Other fuel
- 0.3%No fuel used
- 73.7%Electricity
- 17.8%Utility gas
- 2.6%Bottled, tank, or LP gas
- 2.3%Wood
- 2.1%Fuel oil, kerosene, etc.
- 0.9%No fuel used
- 0.5%Other fuel
Private vs. public school enrollment:
| Here: | 15.3% |
| Washington: | 12.4% |
| Here: | 14.7% |
| Washington: | 9.2% |
| Here: | 17.4% |
| Washington: | 16.5% |
Kitsap County government finances - Expenditure in 2018:
- Charges - Sewerage: $34,408,000
Sewerage: $31,712,000
Other: $23,044,000
Solid Waste Management: $18,755,000
Other: $17,998,000
Solid Waste Management: $17,175,000
Regular Highways: $1,307,000
Regular Highways: $1,113,000
Parks and Recreation: $829,000
Parks and Recreation: $424,000
Natural Resources - Other: $162,000
Natural Resources - Other: $83,000
- Construction - Regular Highways: $9,672,000
Regular Highways: $7,701,000
Parks and Recreation: $4,555,000
Sewerage: $3,685,000
Parks and Recreation: $974,000
General - Other: $770,000
Financial Administration: $204,000
Financial Administration: $185,000
General - Other: $76,000
Correctional Institutions: $1,000
- Current Operations - Health - Other: $83,998,000
Health - Other: $68,859,000
Regular Highways: $28,765,000
Police Protection: $27,281,000
Regular Highways: $25,297,000
Judicial and Legal Services: $25,288,000
Correctional Institutions: $24,563,000
Police Protection: $22,882,000
Correctional Institutions: $21,259,000
Sewerage: $20,207,000
Judicial and Legal Services: $19,210,000
General - Other: $19,098,000
Solid Waste Management: $18,731,000
Solid Waste Management: $16,576,000
General - Other: $16,231,000
Financial Administration: $14,910,000
Sewerage: $12,177,000
Financial Administration: $11,162,000
Central Staff Services: $7,311,000
Housing and Community Development: $6,930,000
Housing and Community Development: $6,030,000
Central Staff Services: $5,935,000
Parks and Recreation: $4,888,000
Parks and Recreation: $4,295,000
Natural Resources - Other: $3,019,000
General Public Buildings: $2,659,000
Natural Resources - Other: $2,567,000
General Public Buildings: $2,248,000
Public Welfare - Other: $111,000
Public Welfare - Other: $106,000
Libraries: $92,000
Libraries: $92,000
- Federal Intergovernmental - Housing and Community Development: $1,595,000
Housing and Community Development: $1,091,000
Other: $199,000
Other: $87,000
Natural Resources: $58,000
Health and Hospitals: $21,000
- General - Interest on Debt: $5,744,000
Interest on Debt: $5,431,000
- Intergovernmental to Local - Other - Health - Other: $3,603,000
Other - General - Other: $1,644,000
Other - Police Protection: $682,000
Other - Correctional Institutions: $623,000
Other - Sewerage: $569,000
Other - Solid Waste Management: $530,000
Other - Natural Resources - Other: $262,000
Other - Financial Administration: $81,000
Other - Judicial and Legal Services: $6,000
- Local Intergovernmental - Other: $12,582,000
Other: $11,236,000
Health and Hospitals: $2,100,000
Health and Hospitals: $1,961,000
- Long Term Debt - Beginning Outstanding - Unspecified Public Purpose: $162,161,000
Outstanding Unspecified Public Purpose: $149,765,000
Beginning Outstanding - Unspecified Public Purpose: $128,403,000
Outstanding Unspecified Public Purpose: $117,408,000
Retired Unspecified Public Purpose: $49,054,000
Issue, Unspecified Public Purpose: $38,059,000
Retired Unspecified Public Purpose: $12,523,000
Issue, Unspecified Public Purpose: $127,000
- Miscellaneous - Interest Earnings: $7,093,000
General Revenue - Other: $5,181,000
Donations From Private Sources: $3,435,000
General Revenue - Other: $2,446,000
Fines and Forfeits: $2,393,000
Fines and Forfeits: $2,129,000
Rents: $1,950,000
Rents: $1,766,000
Special Assessments: $839,000
Sale of Property: $600,000
Donations From Private Sources: $439,000
Sale of Property: $305,000
Special Assessments: $147,000
Interest Earnings: $0
- Other Capital Outlay - Sewerage: $15,572,000
Regular Highways: $4,402,000
Sewerage: $3,437,000
Natural Resources - Other: $2,067,000
Regular Highways: $1,774,000
Solid Waste Management: $1,076,000
Parks and Recreation: $1,028,000
Parks and Recreation: $901,000
Judicial and Legal Services: $478,000
Natural Resources - Other: $383,000
Police Protection: $303,000
Police Protection: $283,000
Financial Administration: $226,000
General - Other: $222,000
General - Other: $123,000
Central Staff Services: $111,000
Correctional Institutions: $102,000
Health - Other: $99,000
Solid Waste Management: $49,000
Central Staff Services: $45,000
Correctional Institutions: $44,000
Financial Administration: $42,000
Corrections - Other: $1,000
- Other Funds - Cash and Securities: $246,113,000
Cash and Securities: $2,837,000
- Sinking Funds - Cash and Securities: $4,827,000
- State Intergovernmental - Public Welfare: $53,009,000
Public Welfare: $44,776,000
Health and Hospitals: $19,406,000
Health and Hospitals: $19,200,000
Other: $17,752,000
Other: $11,379,000
Highways: $8,734,000
Highways: $8,621,000
General Local Government Support: $1,127,000
General Local Government Support: $1,061,000
- Tax - Property: $64,504,000
Property: $61,657,000
General Sales and Gross Receipts: $49,526,000
General Sales and Gross Receipts: $43,288,000
Documentary and Stock Transfer: $8,570,000
Documentary and Stock Transfer: $7,591,000
Other License: $6,814,000
Other License: $5,949,000
Public Utilities Sales: $4,494,000
Public Utilities Sales: $2,041,000
Motor Vehicle License: $1,788,000
Motor Vehicle License: $1,445,000
Other Selective Sales: $852,000
Other Selective Sales: $749,000
Amusements Sales: $392,000
Amusements Sales: $382,000
Severance: $175,000
Severance: $115,000
Occupation and Business License - Other: $18,000
Occupation and Business License - Other: $3,000
- Total Salaries and Wages: $94,423,000
: $87,452,000
Kitsap County government finances - Revenue in 2018:
- Charges - Sewerage: $34,408,000
Sewerage: $31,712,000
Other: $23,044,000
Solid Waste Management: $18,755,000
Other: $17,998,000
Solid Waste Management: $17,175,000
Regular Highways: $1,307,000
Regular Highways: $1,113,000
Parks and Recreation: $829,000
Parks and Recreation: $424,000
Natural Resources - Other: $162,000
Natural Resources - Other: $83,000
- Construction - Regular Highways: $9,672,000
Regular Highways: $7,701,000
Parks and Recreation: $4,555,000
Sewerage: $3,685,000
Parks and Recreation: $974,000
General - Other: $770,000
Financial Administration: $204,000
Financial Administration: $185,000
General - Other: $76,000
Correctional Institutions: $1,000
- Current Operations - Health - Other: $83,998,000
Health - Other: $68,859,000
Regular Highways: $28,765,000
Police Protection: $27,281,000
Regular Highways: $25,297,000
Judicial and Legal Services: $25,288,000
Correctional Institutions: $24,563,000
Police Protection: $22,882,000
Correctional Institutions: $21,259,000
Sewerage: $20,207,000
Judicial and Legal Services: $19,210,000
General - Other: $19,098,000
Solid Waste Management: $18,731,000
Solid Waste Management: $16,576,000
General - Other: $16,231,000
Financial Administration: $14,910,000
Sewerage: $12,177,000
Financial Administration: $11,162,000
Central Staff Services: $7,311,000
Housing and Community Development: $6,930,000
Housing and Community Development: $6,030,000
Central Staff Services: $5,935,000
Parks and Recreation: $4,888,000
Parks and Recreation: $4,295,000
Natural Resources - Other: $3,019,000
General Public Buildings: $2,659,000
Natural Resources - Other: $2,567,000
General Public Buildings: $2,248,000
Public Welfare - Other: $111,000
Public Welfare - Other: $106,000
Libraries: $92,000
Libraries: $92,000
- Federal Intergovernmental - Housing and Community Development: $1,595,000
Housing and Community Development: $1,091,000
Other: $199,000
Other: $87,000
Natural Resources: $58,000
Health and Hospitals: $21,000
- General - Interest on Debt: $5,744,000
Interest on Debt: $5,431,000
- Intergovernmental to Local - Other - Health - Other: $3,603,000
Other - General - Other: $1,644,000
Other - Police Protection: $682,000
Other - Correctional Institutions: $623,000
Other - Sewerage: $569,000
Other - Solid Waste Management: $530,000
Other - Natural Resources - Other: $262,000
Other - Financial Administration: $81,000
Other - Judicial and Legal Services: $6,000
- Local Intergovernmental - Other: $12,582,000
Other: $11,236,000
Health and Hospitals: $2,100,000
Health and Hospitals: $1,961,000
- Long Term Debt - Beginning Outstanding - Unspecified Public Purpose: $162,161,000
Outstanding Unspecified Public Purpose: $149,765,000
Beginning Outstanding - Unspecified Public Purpose: $128,403,000
Outstanding Unspecified Public Purpose: $117,408,000
Retired Unspecified Public Purpose: $49,054,000
Issue, Unspecified Public Purpose: $38,059,000
Retired Unspecified Public Purpose: $12,523,000
Issue, Unspecified Public Purpose: $127,000
- Miscellaneous - Interest Earnings: $7,093,000
General Revenue - Other: $5,181,000
Donations From Private Sources: $3,435,000
General Revenue - Other: $2,446,000
Fines and Forfeits: $2,393,000
Fines and Forfeits: $2,129,000
Rents: $1,950,000
Rents: $1,766,000
Special Assessments: $839,000
Sale of Property: $600,000
Donations From Private Sources: $439,000
Sale of Property: $305,000
Special Assessments: $147,000
Interest Earnings: $0
- Other Capital Outlay - Sewerage: $15,572,000
Regular Highways: $4,402,000
Sewerage: $3,437,000
Natural Resources - Other: $2,067,000
Regular Highways: $1,774,000
Solid Waste Management: $1,076,000
Parks and Recreation: $1,028,000
Parks and Recreation: $901,000
Judicial and Legal Services: $478,000
Natural Resources - Other: $383,000
Police Protection: $303,000
Police Protection: $283,000
Financial Administration: $226,000
General - Other: $222,000
General - Other: $123,000
Central Staff Services: $111,000
Correctional Institutions: $102,000
Health - Other: $99,000
Solid Waste Management: $49,000
Central Staff Services: $45,000
Correctional Institutions: $44,000
Financial Administration: $42,000
Corrections - Other: $1,000
- Other Funds - Cash and Securities: $246,113,000
Cash and Securities: $2,837,000
- Sinking Funds - Cash and Securities: $4,827,000
- State Intergovernmental - Public Welfare: $53,009,000
Public Welfare: $44,776,000
Health and Hospitals: $19,406,000
Health and Hospitals: $19,200,000
Other: $17,752,000
Other: $11,379,000
Highways: $8,734,000
Highways: $8,621,000
General Local Government Support: $1,127,000
General Local Government Support: $1,061,000
- Tax - Property: $64,504,000
Property: $61,657,000
General Sales and Gross Receipts: $49,526,000
General Sales and Gross Receipts: $43,288,000
Documentary and Stock Transfer: $8,570,000
Documentary and Stock Transfer: $7,591,000
Other License: $6,814,000
Other License: $5,949,000
Public Utilities Sales: $4,494,000
Public Utilities Sales: $2,041,000
Motor Vehicle License: $1,788,000
Motor Vehicle License: $1,445,000
Other Selective Sales: $852,000
Other Selective Sales: $749,000
Amusements Sales: $392,000
Amusements Sales: $382,000
Severance: $175,000
Severance: $115,000
Occupation and Business License - Other: $18,000
Occupation and Business License - Other: $3,000
- Total Salaries and Wages: $94,423,000
: $87,452,000
Kitsap County government finances - Debt in 2018:
- Charges - Sewerage: $34,408,000
Sewerage: $31,712,000
Other: $23,044,000
Solid Waste Management: $18,755,000
Other: $17,998,000
Solid Waste Management: $17,175,000
Regular Highways: $1,307,000
Regular Highways: $1,113,000
Parks and Recreation: $829,000
Parks and Recreation: $424,000
Natural Resources - Other: $162,000
Natural Resources - Other: $83,000
- Construction - Regular Highways: $9,672,000
Regular Highways: $7,701,000
Parks and Recreation: $4,555,000
Sewerage: $3,685,000
Parks and Recreation: $974,000
General - Other: $770,000
Financial Administration: $204,000
Financial Administration: $185,000
General - Other: $76,000
Correctional Institutions: $1,000
- Current Operations - Health - Other: $83,998,000
Health - Other: $68,859,000
Regular Highways: $28,765,000
Police Protection: $27,281,000
Regular Highways: $25,297,000
Judicial and Legal Services: $25,288,000
Correctional Institutions: $24,563,000
Police Protection: $22,882,000
Correctional Institutions: $21,259,000
Sewerage: $20,207,000
Judicial and Legal Services: $19,210,000
General - Other: $19,098,000
Solid Waste Management: $18,731,000
Solid Waste Management: $16,576,000
General - Other: $16,231,000
Financial Administration: $14,910,000
Sewerage: $12,177,000
Financial Administration: $11,162,000
Central Staff Services: $7,311,000
Housing and Community Development: $6,930,000
Housing and Community Development: $6,030,000
Central Staff Services: $5,935,000
Parks and Recreation: $4,888,000
Parks and Recreation: $4,295,000
Natural Resources - Other: $3,019,000
General Public Buildings: $2,659,000
Natural Resources - Other: $2,567,000
General Public Buildings: $2,248,000
Public Welfare - Other: $111,000
Public Welfare - Other: $106,000
Libraries: $92,000
Libraries: $92,000
- Federal Intergovernmental - Housing and Community Development: $1,595,000
Housing and Community Development: $1,091,000
Other: $199,000
Other: $87,000
Natural Resources: $58,000
Health and Hospitals: $21,000
- General - Interest on Debt: $5,744,000
Interest on Debt: $5,431,000
- Intergovernmental to Local - Other - Health - Other: $3,603,000
Other - General - Other: $1,644,000
Other - Police Protection: $682,000
Other - Correctional Institutions: $623,000
Other - Sewerage: $569,000
Other - Solid Waste Management: $530,000
Other - Natural Resources - Other: $262,000
Other - Financial Administration: $81,000
Other - Judicial and Legal Services: $6,000
- Local Intergovernmental - Other: $12,582,000
Other: $11,236,000
Health and Hospitals: $2,100,000
Health and Hospitals: $1,961,000
- Long Term Debt - Beginning Outstanding - Unspecified Public Purpose: $162,161,000
Outstanding Unspecified Public Purpose: $149,765,000
Beginning Outstanding - Unspecified Public Purpose: $128,403,000
Outstanding Unspecified Public Purpose: $117,408,000
Retired Unspecified Public Purpose: $49,054,000
Issue, Unspecified Public Purpose: $38,059,000
Retired Unspecified Public Purpose: $12,523,000
Issue, Unspecified Public Purpose: $127,000
- Miscellaneous - Interest Earnings: $7,093,000
General Revenue - Other: $5,181,000
Donations From Private Sources: $3,435,000
General Revenue - Other: $2,446,000
Fines and Forfeits: $2,393,000
Fines and Forfeits: $2,129,000
Rents: $1,950,000
Rents: $1,766,000
Special Assessments: $839,000
Sale of Property: $600,000
Donations From Private Sources: $439,000
Sale of Property: $305,000
Special Assessments: $147,000
Interest Earnings: $0
- Other Capital Outlay - Sewerage: $15,572,000
Regular Highways: $4,402,000
Sewerage: $3,437,000
Natural Resources - Other: $2,067,000
Regular Highways: $1,774,000
Solid Waste Management: $1,076,000
Parks and Recreation: $1,028,000
Parks and Recreation: $901,000
Judicial and Legal Services: $478,000
Natural Resources - Other: $383,000
Police Protection: $303,000
Police Protection: $283,000
Financial Administration: $226,000
General - Other: $222,000
General - Other: $123,000
Central Staff Services: $111,000
Correctional Institutions: $102,000
Health - Other: $99,000
Solid Waste Management: $49,000
Central Staff Services: $45,000
Correctional Institutions: $44,000
Financial Administration: $42,000
Corrections - Other: $1,000
- Other Funds - Cash and Securities: $246,113,000
Cash and Securities: $2,837,000
- Sinking Funds - Cash and Securities: $4,827,000
- State Intergovernmental - Public Welfare: $53,009,000
Public Welfare: $44,776,000
Health and Hospitals: $19,406,000
Health and Hospitals: $19,200,000
Other: $17,752,000
Other: $11,379,000
Highways: $8,734,000
Highways: $8,621,000
General Local Government Support: $1,127,000
General Local Government Support: $1,061,000
- Tax - Property: $64,504,000
Property: $61,657,000
General Sales and Gross Receipts: $49,526,000
General Sales and Gross Receipts: $43,288,000
Documentary and Stock Transfer: $8,570,000
Documentary and Stock Transfer: $7,591,000
Other License: $6,814,000
Other License: $5,949,000
Public Utilities Sales: $4,494,000
Public Utilities Sales: $2,041,000
Motor Vehicle License: $1,788,000
Motor Vehicle License: $1,445,000
Other Selective Sales: $852,000
Other Selective Sales: $749,000
Amusements Sales: $392,000
Amusements Sales: $382,000
Severance: $175,000
Severance: $115,000
Occupation and Business License - Other: $18,000
Occupation and Business License - Other: $3,000
- Total Salaries and Wages: $94,423,000
: $87,452,000
Kitsap County government finances - Cash and Securities in 2018:
- Charges - Sewerage: $34,408,000
Sewerage: $31,712,000
Other: $23,044,000
Solid Waste Management: $18,755,000
Other: $17,998,000
Solid Waste Management: $17,175,000
Regular Highways: $1,307,000
Regular Highways: $1,113,000
Parks and Recreation: $829,000
Parks and Recreation: $424,000
Natural Resources - Other: $162,000
Natural Resources - Other: $83,000
- Construction - Regular Highways: $9,672,000
Regular Highways: $7,701,000
Parks and Recreation: $4,555,000
Sewerage: $3,685,000
Parks and Recreation: $974,000
General - Other: $770,000
Financial Administration: $204,000
Financial Administration: $185,000
General - Other: $76,000
Correctional Institutions: $1,000
- Current Operations - Health - Other: $83,998,000
Health - Other: $68,859,000
Regular Highways: $28,765,000
Police Protection: $27,281,000
Regular Highways: $25,297,000
Judicial and Legal Services: $25,288,000
Correctional Institutions: $24,563,000
Police Protection: $22,882,000
Correctional Institutions: $21,259,000
Sewerage: $20,207,000
Judicial and Legal Services: $19,210,000
General - Other: $19,098,000
Solid Waste Management: $18,731,000
Solid Waste Management: $16,576,000
General - Other: $16,231,000
Financial Administration: $14,910,000
Sewerage: $12,177,000
Financial Administration: $11,162,000
Central Staff Services: $7,311,000
Housing and Community Development: $6,930,000
Housing and Community Development: $6,030,000
Central Staff Services: $5,935,000
Parks and Recreation: $4,888,000
Parks and Recreation: $4,295,000
Natural Resources - Other: $3,019,000
General Public Buildings: $2,659,000
Natural Resources - Other: $2,567,000
General Public Buildings: $2,248,000
Public Welfare - Other: $111,000
Public Welfare - Other: $106,000
Libraries: $92,000
Libraries: $92,000
- Federal Intergovernmental - Housing and Community Development: $1,595,000
Housing and Community Development: $1,091,000
Other: $199,000
Other: $87,000
Natural Resources: $58,000
Health and Hospitals: $21,000
- General - Interest on Debt: $5,744,000
Interest on Debt: $5,431,000
- Intergovernmental to Local - Other - Health - Other: $3,603,000
Other - General - Other: $1,644,000
Other - Police Protection: $682,000
Other - Correctional Institutions: $623,000
Other - Sewerage: $569,000
Other - Solid Waste Management: $530,000
Other - Natural Resources - Other: $262,000
Other - Financial Administration: $81,000
Other - Judicial and Legal Services: $6,000
- Local Intergovernmental - Other: $12,582,000
Other: $11,236,000
Health and Hospitals: $2,100,000
Health and Hospitals: $1,961,000
- Long Term Debt - Beginning Outstanding - Unspecified Public Purpose: $162,161,000
Outstanding Unspecified Public Purpose: $149,765,000
Beginning Outstanding - Unspecified Public Purpose: $128,403,000
Outstanding Unspecified Public Purpose: $117,408,000
Retired Unspecified Public Purpose: $49,054,000
Issue, Unspecified Public Purpose: $38,059,000
Retired Unspecified Public Purpose: $12,523,000
Issue, Unspecified Public Purpose: $127,000
- Miscellaneous - Interest Earnings: $7,093,000
General Revenue - Other: $5,181,000
Donations From Private Sources: $3,435,000
General Revenue - Other: $2,446,000
Fines and Forfeits: $2,393,000
Fines and Forfeits: $2,129,000
Rents: $1,950,000
Rents: $1,766,000
Special Assessments: $839,000
Sale of Property: $600,000
Donations From Private Sources: $439,000
Sale of Property: $305,000
Special Assessments: $147,000
Interest Earnings: $0
- Other Capital Outlay - Sewerage: $15,572,000
Regular Highways: $4,402,000
Sewerage: $3,437,000
Natural Resources - Other: $2,067,000
Regular Highways: $1,774,000
Solid Waste Management: $1,076,000
Parks and Recreation: $1,028,000
Parks and Recreation: $901,000
Judicial and Legal Services: $478,000
Natural Resources - Other: $383,000
Police Protection: $303,000
Police Protection: $283,000
Financial Administration: $226,000
General - Other: $222,000
General - Other: $123,000
Central Staff Services: $111,000
Correctional Institutions: $102,000
Health - Other: $99,000
Solid Waste Management: $49,000
Central Staff Services: $45,000
Correctional Institutions: $44,000
Financial Administration: $42,000
Corrections - Other: $1,000
- Other Funds - Cash and Securities: $246,113,000
Cash and Securities: $2,837,000
- Sinking Funds - Cash and Securities: $4,827,000
- State Intergovernmental - Public Welfare: $53,009,000
Public Welfare: $44,776,000
Health and Hospitals: $19,406,000
Health and Hospitals: $19,200,000
Other: $17,752,000
Other: $11,379,000
Highways: $8,734,000
Highways: $8,621,000
General Local Government Support: $1,127,000
General Local Government Support: $1,061,000
- Tax - Property: $64,504,000
Property: $61,657,000
General Sales and Gross Receipts: $49,526,000
General Sales and Gross Receipts: $43,288,000
Documentary and Stock Transfer: $8,570,000
Documentary and Stock Transfer: $7,591,000
Other License: $6,814,000
Other License: $5,949,000
Public Utilities Sales: $4,494,000
Public Utilities Sales: $2,041,000
Motor Vehicle License: $1,788,000
Motor Vehicle License: $1,445,000
Other Selective Sales: $852,000
Other Selective Sales: $749,000
Amusements Sales: $392,000
Amusements Sales: $382,000
Severance: $175,000
Severance: $115,000
Occupation and Business License - Other: $18,000
Occupation and Business License - Other: $3,000
- Total Salaries and Wages: $94,423,000
: $87,452,000
Supplemental Security Income (SSI) in 2006:
- Total number of recipients: 4,163
- Number of aged recipients: 308
- Number of blind and disabled recipients: 3,855
- Number of recipients under 18: 509
- Number of recipients between 18 and 64: 3,095
- Number of recipients older than 64: 559
- Number of recipients also receiving OASDI: 1,177
- Amount of payments (thousands of dollars): 2,271
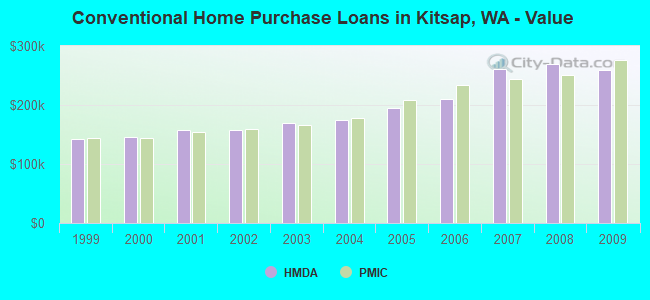
| Home Mortgage Disclosure Act Aggregated Statistics For Year 2009 (Based on 50 full tracts) | ||||||||||||||
| A) FHA, FSA/RHS & VA Home Purchase Loans | B) Conventional Home Purchase Loans | C) Refinancings | D) Home Improvement Loans | E) Loans on Dwellings For 5+ Families | F) Non-occupant Loans on < 5 Family Dwellings (A B C & D) | G) Loans On Manufactured Home Dwelling (A B C & D) | ||||||||
|---|---|---|---|---|---|---|---|---|---|---|---|---|---|---|
| Number | Average Value | Number | Average Value | Number | Average Value | Number | Average Value | Number | Average Value | Number | Average Value | Number | Average Value | |
| LOANS ORIGINATED | 1,494 | $236,047 | 1,102 | $259,768 | 8,466 | $234,218 | 404 | $114,723 | 5 | $1,510,000 | 585 | $214,966 | 544 | $165,743 |
| APPLICATIONS APPROVED, NOT ACCEPTED | 86 | $234,512 | 106 | $250,708 | 667 | $249,336 | 59 | $83,729 | 1 | $13,908,000 | 54 | $205,704 | 48 | $143,167 |
| APPLICATIONS DENIED | 152 | $217,908 | 191 | $244,634 | 2,359 | $254,941 | 215 | $112,777 | 3 | $631,667 | 222 | $199,468 | 203 | $145,936 |
| APPLICATIONS WITHDRAWN | 149 | $229,289 | 176 | $273,006 | 1,686 | $244,746 | 68 | $137,809 | 2 | $277,500 | 137 | $205,876 | 94 | $158,702 |
| FILES CLOSED FOR INCOMPLETENESS | 19 | $214,000 | 31 | $250,129 | 422 | $239,898 | 32 | $139,281 | 0 | $0 | 33 | $233,182 | 21 | $145,333 |
| Private Mortgage Insurance Companies Aggregated Statistics For Year 2009 (Based on 48 full tracts) | ||||||||
| A) Conventional Home Purchase Loans | B) Refinancings | C) Non-occupant Loans on < 5 Family Dwellings (A & B) | D) Loans On Manufactured Home Dwelling (A & B) | |||||
|---|---|---|---|---|---|---|---|---|
| Number | Average Value | Number | Average Value | Number | Average Value | Number | Average Value | |
| LOANS ORIGINATED | 117 | $276,769 | 123 | $274,821 | 2 | $211,000 | 0 | $0 |
| APPLICATIONS APPROVED, NOT ACCEPTED | 55 | $278,036 | 67 | $278,179 | 6 | $246,500 | 2 | $280,000 |
| APPLICATIONS DENIED | 28 | $301,143 | 45 | $271,822 | 1 | $240,000 | 0 | $0 |
| APPLICATIONS WITHDRAWN | 13 | $281,462 | 10 | $337,600 | 0 | $0 | 1 | $225,000 |
| FILES CLOSED FOR INCOMPLETENESS | 1 | $237,000 | 3 | $284,333 | 0 | $0 | 0 | $0 |
| Most common first names in Kitsap County, WA among deceased individuals | ||
| Name | Count | Lived (average) |
|---|---|---|
| John | 869 | 75.2 years |
| William | 721 | 75.5 years |
| Robert | 710 | 71.4 years |
| Mary | 661 | 78.4 years |
| James | 606 | 72.4 years |
| George | 453 | 76.6 years |
| Charles | 429 | 75.1 years |
| Helen | 371 | 80.9 years |
| Margaret | 355 | 79.6 years |
| Dorothy | 351 | 78.2 years |
| Most common last names in Kitsap County, WA among deceased individuals | ||
| Last name | Count | Lived (average) |
|---|---|---|
| Johnson | 375 | 77.7 years |
| Smith | 319 | 77.0 years |
| Anderson | 226 | 77.4 years |
| Jones | 196 | 74.6 years |
| Brown | 169 | 75.3 years |
| Miller | 151 | 75.3 years |
| Nelson | 151 | 78.3 years |
| Peterson | 138 | 78.9 years |
| Davis | 138 | 75.7 years |
| Williams | 131 | 75.3 years |
| Businesses in Kitsap County, WA | ||||
| Name | Count | Name | Count | |
|---|---|---|---|---|
| 7-Eleven | 4 | Little Caesars Pizza | 2 | |
| AT&T | 2 | Lowe's | 3 | |
| Ace Hardware | 3 | Macy's | 2 | |
| Aeropostale | 1 | Marriott | 1 | |
| Albertsons | 6 | MasterBrand Cabinets | 6 | |
| American Eagle Outfitters | 1 | Mazda | 1 | |
| Applebee's | 1 | McDonald's | 12 | |
| Arby's | 2 | Men's Wearhouse | 1 | |
| Ashley Furniture | 1 | Motherhood Maternity | 2 | |
| AutoZone | 3 | New Balance | 6 | |
| Barnes & Noble | 1 | Nike | 28 | |
| Baskin-Robbins | 2 | Nissan | 1 | |
| Bath & Body Works | 1 | Office Depot | 2 | |
| Best Western | 1 | OfficeMax | 1 | |
| Big O Tires | 1 | Old Navy | 1 | |
| Blockbuster | 3 | Olive Garden | 1 | |
| Budget Car Rental | 1 | Outback | 1 | |
| Burger King | 7 | Outback Steakhouse | 1 | |
| Catherines | 1 | Pac Sun | 1 | |
| Chevrolet | 2 | Papa John's Pizza | 3 | |
| Chuck E. Cheese's | 1 | Payless | 3 | |
| Cinnabon | 1 | Penske | 2 | |
| Cold Stone Creamery | 2 | PetSmart | 1 | |
| Comfort Inn | 1 | Pier 1 Imports | 1 | |
| Costco | 1 | Pizza Hut | 4 | |
| Curves | 5 | Quality | 1 | |
| DHL | 2 | Quiznos | 4 | |
| Dairy Queen | 5 | RadioShack | 4 | |
| Days Inn | 1 | Red Lobster | 1 | |
| Dennys | 1 | Red Robin | 1 | |
| Discount Tire | 1 | Rite Aid | 7 | |
| Domino's Pizza | 3 | Rue21 | 1 | |
| Eddie Bauer | 1 | SAS Shoes | 2 | |
| Famous Footwear | 1 | Safeway | 3 | |
| Fashion Bug | 1 | Sears | 2 | |
| FedEx | 32 | Sephora | 1 | |
| Firestone Complete Auto Care | 2 | Spencer Gifts | 1 | |
| Ford | 2 | Sprint Nextel | 4 | |
| Forever 21 | 1 | Staples | 2 | |
| GNC | 7 | Starbucks | 17 | |
| GameStop | 3 | Subaru | 1 | |
| Gap | 1 | Subway | 20 | |
| Gymboree | 1 | Super 8 | 1 | |
| H&R Block | 7 | T-Mobile | 7 | |
| Hilton | 1 | T.J.Maxx | 1 | |
| Holiday Inn | 1 | Taco Bell | 6 | |
| Hollister Co. | 1 | Target | 1 | |
| Home Depot | 2 | The Room Place | 2 | |
| Honda | 1 | Toyota | 1 | |
| Hot Topic | 1 | Toys"R"Us | 2 | |
| IHOP | 1 | Trader Joe's | 1 | |
| JCPenney | 1 | True Value | 2 | |
| Jack In The Box | 3 | U-Haul | 9 | |
| Jamba Juice | 1 | UPS | 31 | |
| Jones New York | 2 | Vans | 3 | |
| Journeys | 1 | Verizon Wireless | 4 | |
| KFC | 4 | Victoria's Secret | 1 | |
| Kincaid | 1 | Volkswagen | 1 | |
| Kohl's | 1 | Vons | 5 | |
| Kroger | 7 | Walgreens | 3 | |
| La-Z-Boy | 1 | Walmart | 3 | |
| Lane Bryant | 1 | Wendy's | 2 | |
| Lane Furniture | 3 | YMCA | 3 | |
| LensCrafters | 1 | |||
Kitsap County on our top lists:
- #16 on the list of "Top 101 counties with the highest percentage of residents relocating from foreign countries between 2010 and 2011 (pop. 50,000+)"
- #17 on the list of "Top 101 counties with the lowest Particulate Matter (PM2.5) Annual air pollution readings in 2012 (µg/m3)"
- #26 on the list of "Top 101 counties with the highest percentage of residents relocating from foreign countries between 2010 and 2011"
- #36 on the list of "Top 101 counties with the highest average weight of females"
- #38 on the list of "Top 101 counties with the highest percentage of residents relocating to foreign countries in 2011 (pop. 50,000+)"
- #42 on the list of "Top 101 counties with the highest percentage of residents that exercised in the past month"
- #57 on the list of "Top 101 counties with the highest percentage of residents relocating to foreign countries in 2011"
- #75 on the list of "Top 101 counties with the highest percentage of residents that keep firearms around their homes"
- #77 on the list of "Top 101 counties with the highest percentage of residents that smoked 100+ cigarettes in their lives"