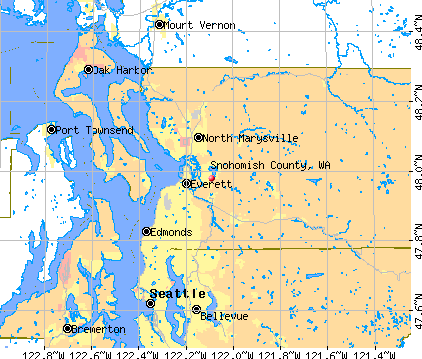
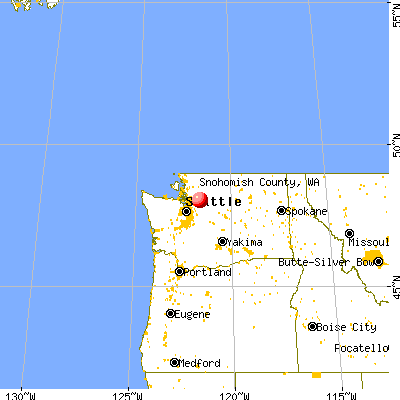
Snohomish County, Washington (WA)
County owner-occupied free and clear houses and condos in 2010: 33,999
County owner-occupied houses and condos in 2000: 152,324
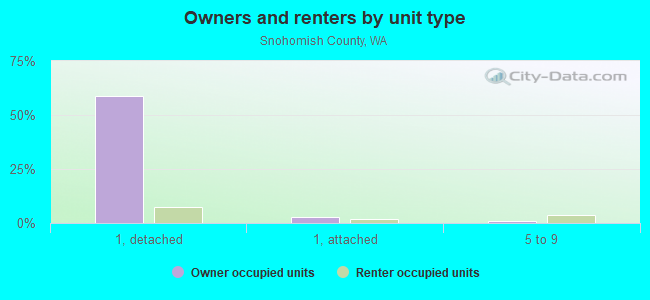
Renter-occupied apartments: 88,566 (it was 72,528 in 2000)
| % of renters here: | 32% |
| State: | 36% |
Land area: 2089 sq. mi.
Water area: 107.3 sq. mi.
Population density: 402 people per square mile (high).
Industries providing employment: Educational, health and social services (18.7%), Professional, scientific, management, administrative, and waste management services (15.0%), Manufacturing (13.1%), Retail trade (12.0%).
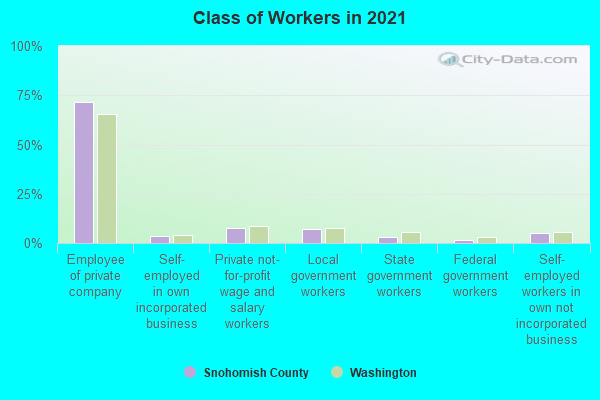
Type of workers:
- Private wage or salary: 81%
- Government: 13%
- Self-employed, not incorporated: 5%
- Unpaid family work: 0%
- OSM Map
- General Map
- Google Map
- MSN Map

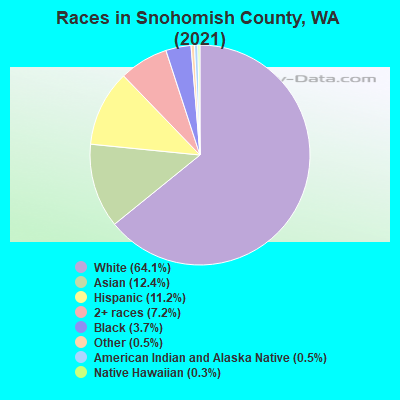
- 526,53962.7%White Non-Hispanic Alone
- 110,45613.1%Asian alone
- 97,66911.6%Hispanic or Latino
- 60,2147.2%Two or more races
- 29,6673.5%Black Non-Hispanic Alone
- 5,4500.6%Native Hawaiian and Other
Pacific Islander alone - 5,2950.6%American Indian and Alaska Native alone
- 4,7890.6%Some other race alone
| Median resident age: | 38.8 years |
| Washington median age: | 38.4 years |
| Males: 424,312 | |
| Females: 415,767 |


| Snohomish County: | 2.0 people |
| Washington: | 3 people |
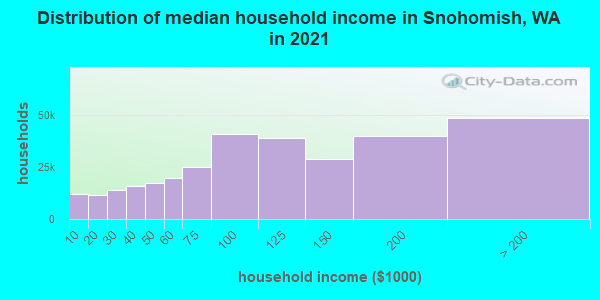
Estimated median household income in 2022: $101,532 ($53,060 in 1999)
| This county: | $101,532 |
| Washington: | $91,306 |
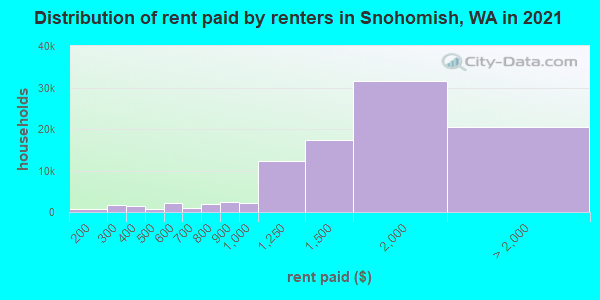
Median contract rent in 2022 for apartments: $1,713 (lower quartile is $1,361, upper quartile is $2,066)
| This county: | $1713 |
| State: | $1495 |
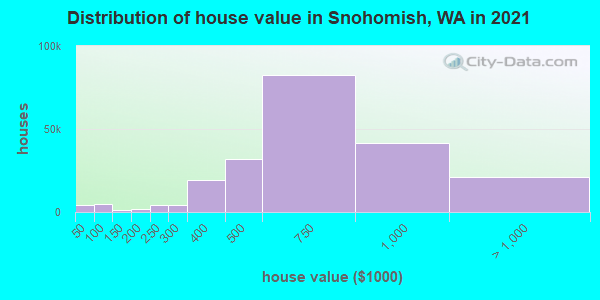
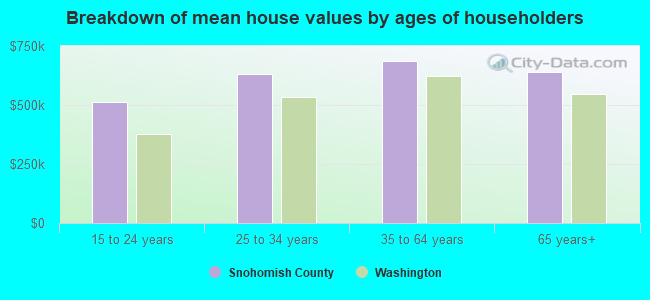
Estimated median house or condo value in 2022: $713,200 (it was $188,600 in 2000)
| Snohomish: | $713,200 |
| Washington: | $569,500 |
Mean price in 2022:
Median monthly housing costs for homes and condos with a mortgage: $2,469Detached houses: $825,949
Here: $825,949 State: $734,307 Townhouses or other attached units: $643,803
Here: $643,803 State: $657,697 In 2-unit structures: $530,516
Here: $530,516 State: $534,634 In 3-to-4-unit structures: $479,562
Here: $479,562 State: $510,239 In 5-or-more-unit structures: $400,308
Here: $400,308 State: $503,183 Mobile homes: $303,974
Here: $303,974 State: $218,362 Occupied boats, RVs, vans, etc.: $101,172
Here: $101,172 State: $159,523
Median monthly housing costs for units without a mortgage: $807
Institutionalized population: 5,769
Crime in 2021 (reported by the sheriff's office or county police, not the county total):
- Murders: 2
- Rapes: 51
- Robberies: 63
- Assaults: 366
- Burglaries: 838
- Thefts: 2634
- Auto thefts: 653
Crime in 2020 (reported by the sheriff's office or county police, not the county total):
- Murders: 1
- Rapes: 64
- Robberies: 84
- Assaults: 355
- Burglaries: 792
- Thefts: 2764
- Auto thefts: 783
Health of residents in Snohomish County based on CDC Behavioral Risk Factor Surveillance System Survey Questionnaires from 2003 to 2012:
General health status score of residents in this county from 1 (poor) to 5 (excellent) is 3.5. This is about average.80.9% of residents exercised in the past month. This is more than average.
46.6% of residents smoked 100+ cigarettes in their lives. This is about average.
79.1% of adult residents drank alcohol in the past 30 days. This is about average.
72.2% of residents visited a dentist within the past year. This is about average.
Average weight of males is 198 pounds. This is about average.
Average weight of females is 166 pounds. This is more than average.
30.1% of residents keep firearms around their homes. This is about average.
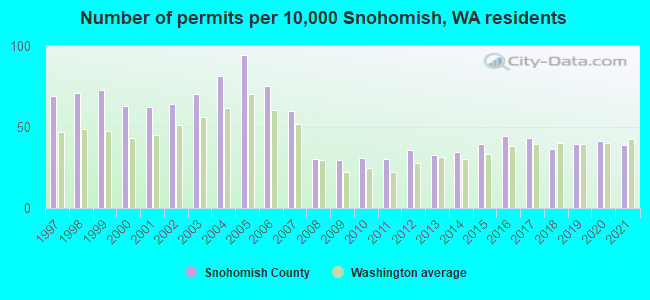
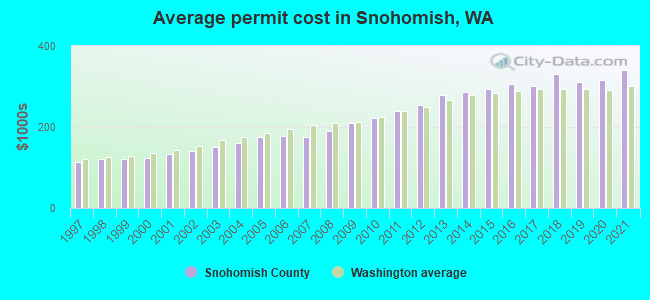
Single-family new house construction building permits:
- 2022: 1906 buildings, average cost: $370,400
- 2021: 2370 buildings, average cost: $339,900
- 2020: 2508 buildings, average cost: $315,800
- 2019: 2409 buildings, average cost: $310,000
- 2018: 2201 buildings, average cost: $329,900
- 2017: 2627 buildings, average cost: $301,900
- 2016: 2702 buildings, average cost: $305,500
- 2015: 2383 buildings, average cost: $295,000
- 2014: 2079 buildings, average cost: $286,200
- 2013: 1985 buildings, average cost: $278,700
- 2012: 2174 buildings, average cost: $254,200
- 2011: 1819 buildings, average cost: $240,400
- 2010: 1853 buildings, average cost: $222,800
- 2009: 1790 buildings, average cost: $211,100
- 2008: 1840 buildings, average cost: $189,500
- 2007: 3618 buildings, average cost: $175,000
- 2006: 4557 buildings, average cost: $177,100
- 2005: 5719 buildings, average cost: $175,200
- 2004: 4921 buildings, average cost: $160,800
- 2003: 4249 buildings, average cost: $150,400
- 2002: 3902 buildings, average cost: $140,200
- 2001: 3787 buildings, average cost: $132,900
- 2000: 3821 buildings, average cost: $123,900
- 1999: 4397 buildings, average cost: $119,800
- 1998: 4313 buildings, average cost: $121,100
- 1997: 4172 buildings, average cost: $113,600
Median real estate property taxes paid for housing units with mortgages in 2022: $5,177 (0.7%)
Median real estate property taxes paid for housing units with no mortgage in 2022: $4,905 (0.7%)
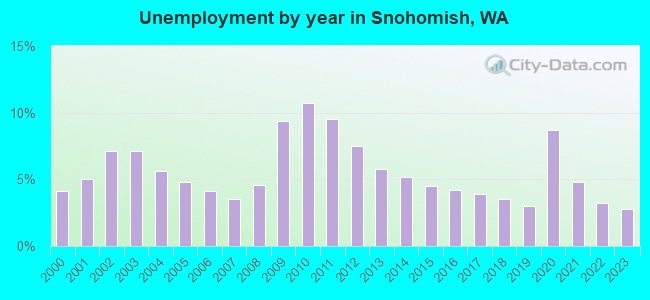
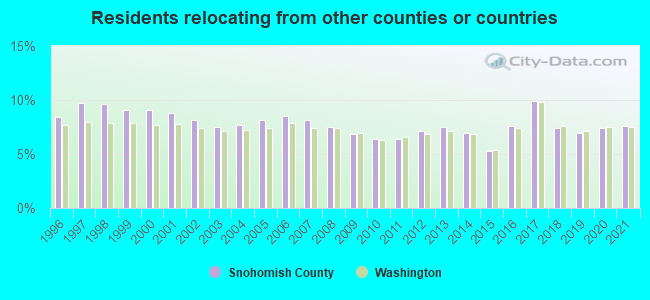
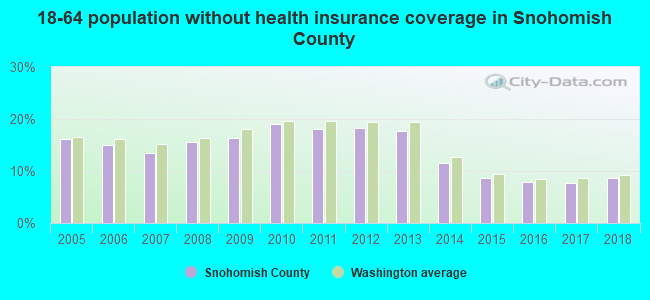
| Snohomish County: | 8.6% |
| Washington: | 10.0% |
Median age of residents in 2022: 38.8 years old
(Males: 38.3 years old, Females: 39.4 years old)
(Median age for: White residents: 43.2 years old, Black residents: 34.1 years old, American Indian residents: 31.7 years old, Asian residents: 37.8 years old, Hispanic or Latino residents: 26.1 years old, Other race residents: 29.8 years old)
Area name: Seattle-Bellevue, WA HUD Metro FMR Area
Fair market rent in 2006 for a 1-bedroom apartment in Snohomish County is $698 a month.
Fair market rent for a 2-bedroom apartment is $840 a month.
Fair market rent for a 3-bedroom apartment is $1187 a month.
Cities in this county include: Everett, Edmonds, Seattle Hill-Silver Firs, Lynnwood, North Creek, Marysville, Paine Field-Lake Stickney, Picnic Point-North Lynnwood, North Marysville, Silver Firs.
2023 air pollution in Snohomish County:
Particulate Matter (PM2.5) Annual: 3.8 µg/m3(standard limit: 15.0 µg/m3). Below U.S. average.
Neighboring counties: Benewah County, Idaho  , King County
  , Prairie County, Montana , Keweenaw County, Michigan , Walsh County, North Dakota , Pennington County, Minnesota .
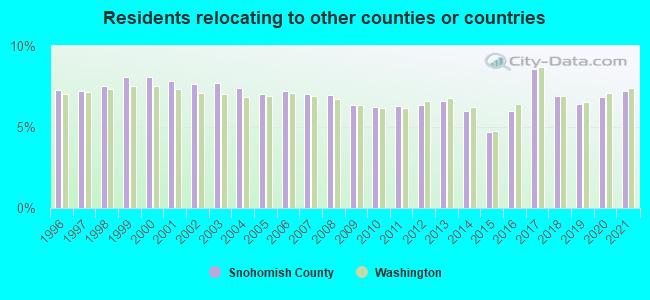
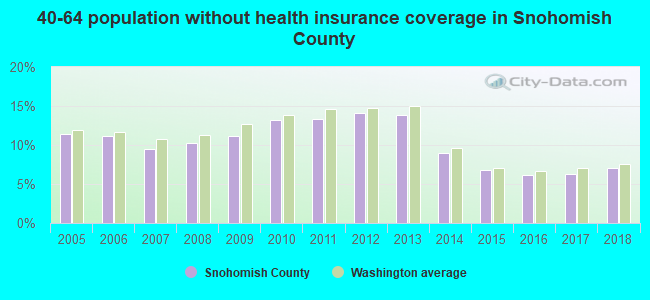
| Here: | 3.6% |
| Washington: | 4.6% |
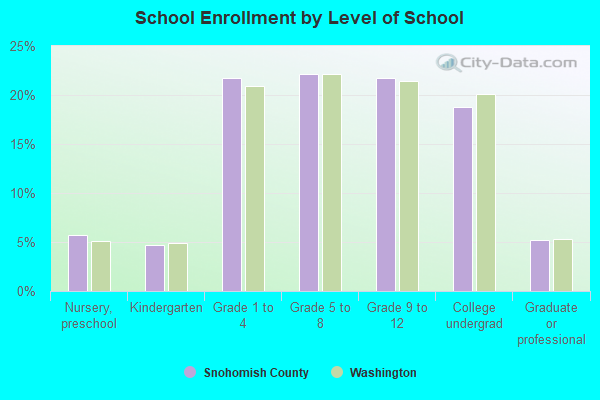
Current college students: 29,961
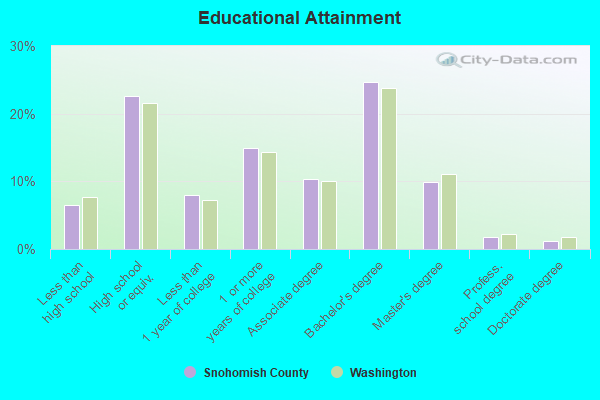
People 25 years of age or older with a high school degree or higher: 92.6%
People 25 years of age or older with a bachelor's degree or higher: 38.5%
Number of foreign born residents: 153,834 (50.4% naturalized citizens)
| Snohomish County: | 18.3% |
| Whole state: | 15.3% |
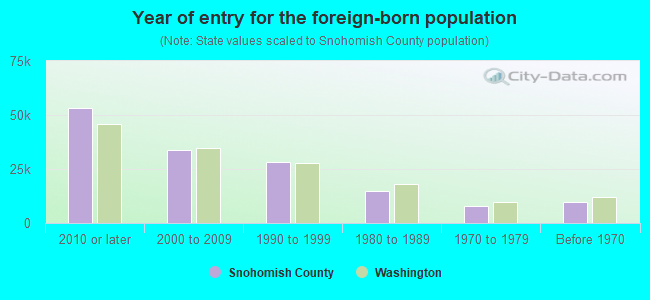
- Year of entry for the foreign-born population
- 56,4882010 or later
- 41,8062000 to 2009
- 27,0871990 to 1999
- 14,9951980 to 1989
- 8,0981970 to 1979
- 9,885Before 1970
Mean travel time to work (commute): minutes
Percentage of county residents living and working in this county: 99.6%
Housing units in structures:
- One, detached: 214,664
- One, attached: 17,045
- Two: 6,205
- 3 or 4: 10,102
- 5 to 9: 16,368
- 10 to 19: 20,206
- 20 to 49: 14,486
- 50 or more: 19,648
- Mobile homes: 14,004
- Boats, RVs, vans, etc.: 1,091
Housing units in Snohomish County with a mortgage: 153,503 (16,144 second mortgage, 876 home equity loan, 12,943 both second mortgage and home equity loan)
Houses without a mortgage: 2,283
| Here: | 98.7% with mortgage |
| State: | 98.0% with mortgage |
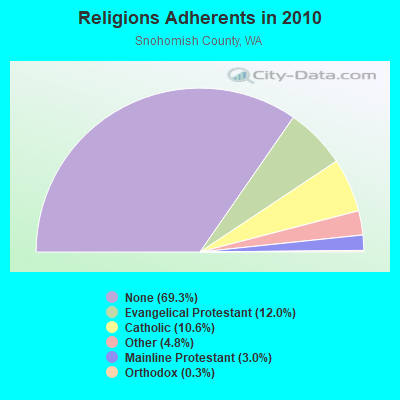
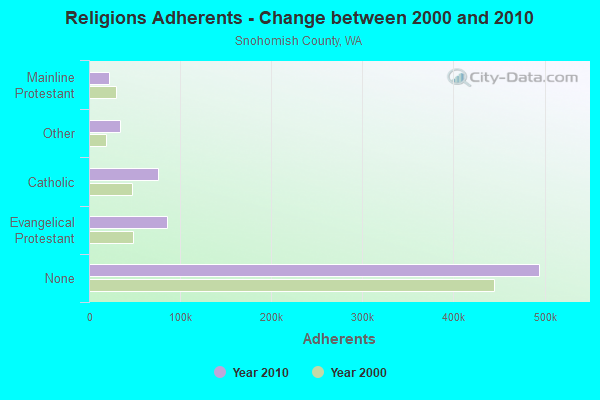
Religion statistics for Snohomish County
| Religion | Adherents | Congregations |
|---|---|---|
| Evangelical Protestant | 85,354 | 327 |
| Catholic | 75,393 | 16 |
| Other | 34,270 | 90 |
| Mainline Protestant | 21,642 | 71 |
| Orthodox | 1,943 | 6 |
| Black Protestant | 406 | 4 |
| None | 494,327 | - |
Source: Clifford Grammich, Kirk Hadaway, Richard Houseal, Dale E.Jones, Alexei Krindatch, Richie Stanley and Richard H.Taylor. 2012. 2010 U.S.Religion Census: Religious Congregations & Membership Study. Association of Statisticians of American Religious Bodies. Jones, Dale E., et al. 2002. Congregations and Membership in the United States 2000. Nashville, TN: Glenmary Research Center.
Food Environment Statistics:
| Snohomish County: | 1.79 / 10,000 pop. |
| State: | 2.06 / 10,000 pop. |
| Here: | 0.18 / 10,000 pop. |
| Washington: | 0.19 / 10,000 pop. |
| This county: | 1.42 / 10,000 pop. |
| Washington: | 1.18 / 10,000 pop. |
| Snohomish County: | 2.55 / 10,000 pop. |
| Washington: | 2.67 / 10,000 pop. |
| This county: | 6.95 / 10,000 pop. |
| State: | 8.26 / 10,000 pop. |
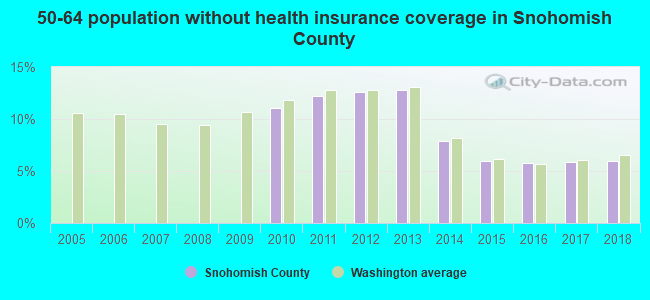
| Snohomish County: | 7.5% |
| Washington: | 7.7% |
| Snohomish County: | 27.4% |
| State: | 25.7% |
| Here: | 14.3% |
| State: | 13.9% |
Agriculture in Snohomish County:
Average size of farms: 44 acresAverage value of agricultural products sold per farm: $80,653
Average value of crops sold per acre for harvested cropland: $2308.45
The value of nursery, greenhouse, floriculture, and sod as a percentage of the total market value of agricultural products sold: 40.15%
The value of livestock, poultry, and their products as a percentage of the total market value of agricultural products sold: 54.34%
Average total farm production expenses per farm: $73,841
Harvested cropland as a percentage of land in farms: 36.59%
Irrigated harvested cropland as a percentage of land in farms: 20.96%
Average market value of all machinery and equipment per farm: $35,633
The percentage of farms operated by a family or individual: 89.90%
Average age of principal farm operators: 55 years
Average number of cattle and calves per 100 acres of all land in farms: 46.88
Milk cows as a percentage of all cattle and calves: 48.51%
All wheat for grain: 420 harvested acres
Vegetables: 2,307 harvested acres
Land in orchards: 251 acres
Earthquake activity:
Snohomish County-area historical earthquake activity is significantly above Washington state average. It is 1214% greater than the overall U.S. average.On 4/13/1949 at 19:55:42, a magnitude 7.0 (7.0 UK, Class: Major, Intensity: VIII - XII) earthquake occurred 53.7 miles away from Snohomish County center, causing $80,000,000 total damage
On 2/28/2001 at 18:54:32, a magnitude 6.8 (6.8 MD, Depth: 32.2 mi, Class: Strong, Intensity: VII - IX) earthquake occurred 64.4 miles away from the county center
On 2/28/2001 at 18:54:32, a magnitude 6.8 (6.5 MB, 6.6 MS, 6.8 MW) earthquake occurred 65.4 miles away from the county center, causing $2,000,000,000 total damage and $305,000,000 insured losses
On 4/29/1965 at 15:28:43, a magnitude 6.6 (6.6 UK) earthquake occurred 47.0 miles away from the county center, causing $28,000,000 total damage
On 7/3/1999 at 01:43:54, a magnitude 5.8 (5.4 MB, 5.5 MS, 5.8 MW, 5.3 ME, Depth: 25.2 mi, Class: Moderate, Intensity: VI - VII) earthquake occurred 82.8 miles away from Snohomish County center
On 5/3/1996 at 04:04:22, a magnitude 5.5 (5.2 MB, 5.3 MD, 5.5 ML, Depth: 2.5 mi) earthquake occurred 18.9 miles away from the county center
Magnitude types: body-wave magnitude (MB), duration magnitude (MD), energy magnitude (ME), local magnitude (ML), surface-wave magnitude (MS), moment magnitude (MW)
Most recent natural disasters:
- Washington Covid-19 Pandemic, Incident Period: January 20, 2020, Major Disaster (Presidential) Declared DR-4481-WA: March 22, 2020, FEMA Id: 4481, Natural disaster type: Other
- Washington Severe Storms, Flooding, Landslides, And Mudslides, Incident Period: January 20, 2020 - February 10, 2020, FEMA Id: 4539, Natural disaster type: Storm, Mudslide, Landslide, Flood
- Washington Severe Winter Storms, Straight-line Winds, Flooding, Landslides, Mudslides, Tornado, Incident Period: December 10, 2018 - December 24, 2018, FEMA Id: 4418, Natural disaster type: Winter Storm, Tornado, Mudslide, Landslide, Flood, Wind
- Washington Severe Storms, Straight-line Winds, Flooding, Landslides, and Mudslides, Incident Period: November 12, 2015 to November 21, 2015, Major Disaster (Presidential) Declared DR-4249: January 15, 2016, FEMA Id: 4249, Natural disaster type: Storm, Mudslide, Landslide, Flood, Wind
- Washington Severe Windstorm, Incident Period: August 29, 2015, Major Disaster (Presidential) Declared DR-4242: October 15, 2015, FEMA Id: 4242, Natural disaster type: Storm, Wind
- Washington Flooding and Mudslides, Incident Period: March 22, 2014 to April 29, 2014, Emergency Declared EM-3370: March 24, 2014, FEMA Id: 3370, Natural disaster type: Mudslide, Flood
- Washington Flooding and Mudslides, Incident Period: March 22, 2014 to April 29, 2014, Major Disaster (Presidential) Declared DR-4168: April 02, 2014, FEMA Id: 4168, Natural disaster type: Mudslide, Flood
- Washington Severe Winter Storm, Flooding, Landslides, and Mudslides, Incident Period: January 14, 2012 to January 23, 2012, Major Disaster (Presidential) Declared DR-4056: March 05, 2012, FEMA Id: 4056, Natural disaster type: Winter Storm, Mudslide, Landslide, Flood
- Washington Severe Winter Storm, Landslides, Mudslides, and Flooding, Incident Period: January 06, 2009 to January 16, 2009, Major Disaster (Presidential) Declared DR-1817: January 30, 2009, FEMA Id: 1817, Natural disaster type: Winter Storm, Mudslide, Landslide, Flood
- Washington Severe Winter Storm and Record and Near Record Snow, Incident Period: December 12, 2008 to January 05, 2009, Major Disaster (Presidential) Declared DR-1825: March 02, 2009, FEMA Id: 1825, Natural disaster type: Winter Storm, Snow
- 21 other natural disasters have been reported since 1953.
The number of natural disasters in Snohomish County (31) is a lot greater than the US average (15).
Major Disasters (Presidential) Declared: 27
Emergencies Declared: 2
Causes of natural disasters: Floods: 21, Storms: 17, Mudslides: 14, Landslides: 10, Winter Storms: 6, Winds: 5, Earthquakes: 2, Heavy Rain: 1, Hurricane: 1, Snow: 1, Tornado: 1, Volcanic Eruption: 1, Other: 1 (Note: some incidents may be assigned to more than one category).
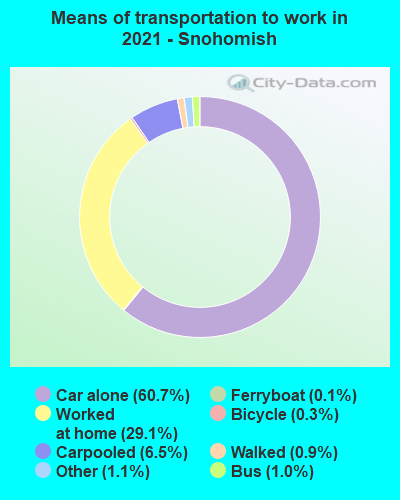
Means of transportation to work:
- Drove a car alone: 208,344 (59.6%)
- Carpooled: 29,173 (8.3%)
- Bus: 5,741 (1.6%)
- Long-distance train or commuter rail: 65 (0.0%)
- Light rail, streetcar or trolley: 151 (0.0%)
- Ferryboat: 914 (0.3%)
- Taxicab, motorcycle, or other means: 3,709 (1.1%)
- Bicycle: 669 (0.2%)
- Walked: 7,978 (2.3%)
- Worked at home: 93,045 (26.6%)
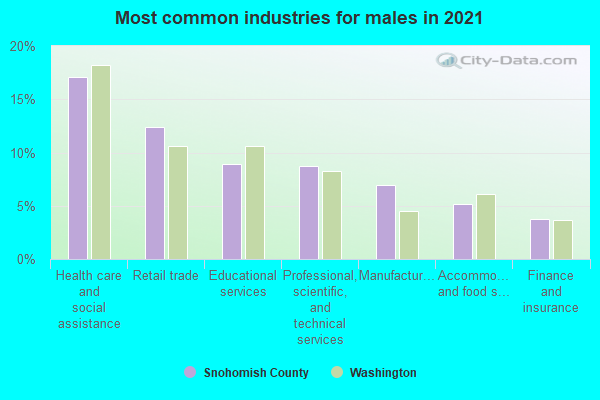
- Health care and social assistance (17%)
- Retail trade (9%)
- Professional, scientific, and technical services (8%)
- Educational services (8%)
- Manufacturing (6%)
- Accommodation and food services (5%)
- Other services, except public administration (4%)
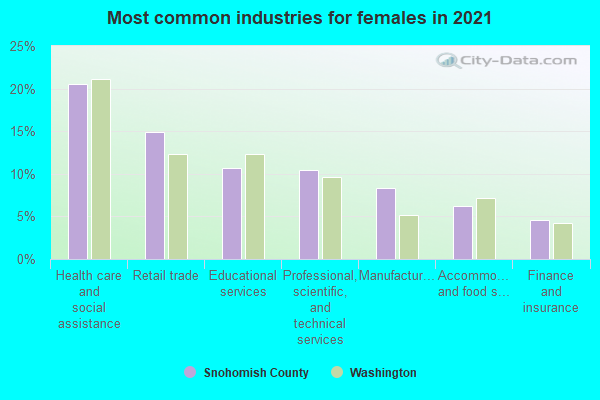
- Health care and social assistance (21%)
- Retail trade (12%)
- Professional, scientific, and technical services (10%)
- Educational services (10%)
- Manufacturing (8%)
- Accommodation and food services (7%)
- Other services, except public administration (5%)
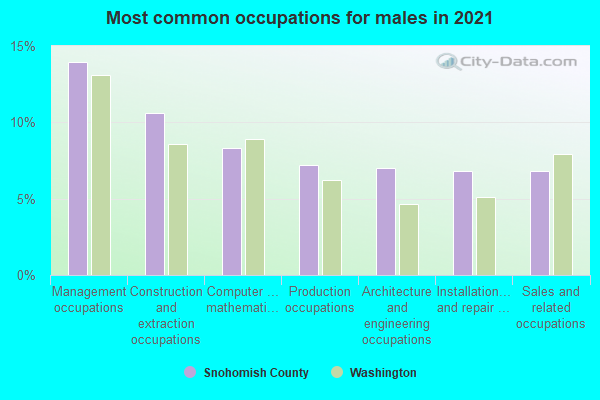
- Management occupations (13%)
- Construction and extraction occupations (11%)
- Computer and mathematical occupations (9%)
- Sales and related occupations (9%)
- Architecture and engineering occupations (6%)
- Production occupations (6%)
- Installation, maintenance, and repair occupations (5%)
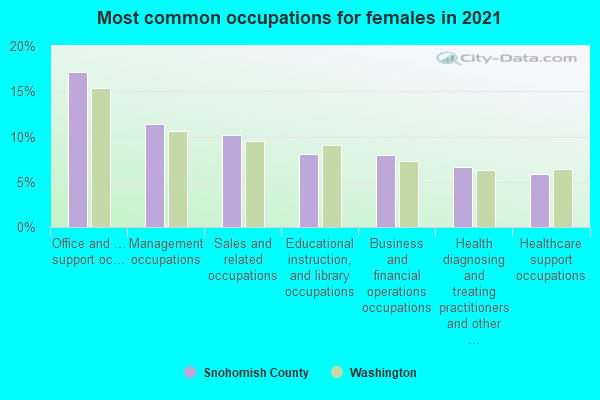
- Office and administrative support occupations (16%)
- Management occupations (13%)
- Sales and related occupations (9%)
- Educational instruction, and library occupations (8%)
- Business and financial operations occupations (8%)
- Health diagnosing and treating practitioners and other technical occupations (6%)
- Food preparation and serving related occupations (5%)
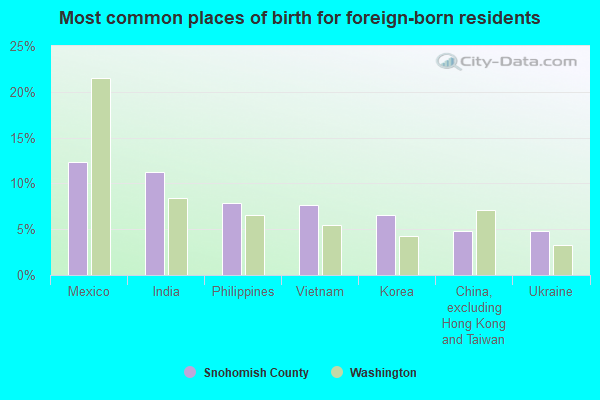
- Mexico (13%)
- India (12%)
- Philippines (7%)
- Vietnam (7%)
- Korea (7%)
- China, excluding Hong Kong and Taiwan (5%)
- Ukraine (4%)
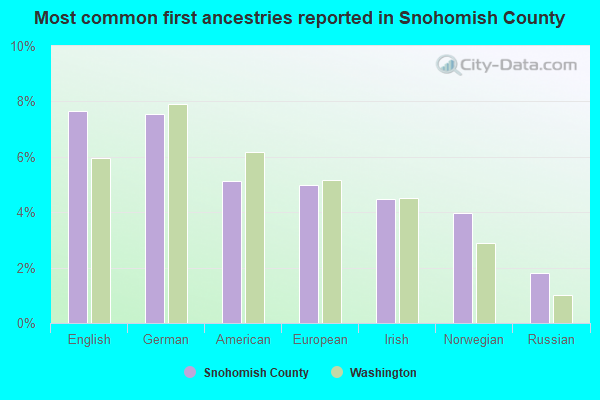
- English (7%)
- German (7%)
- American (6%)
- European (5%)
- Norwegian (4%)
- Irish (4%)
- Ukrainian (2%)
People in group quarters in Snohomish County, Washington in 2010:
- 2,463 people in state prisons
- 1,904 people in nursing facilities/skilled-nursing facilities
- 1,242 people in local jails and other municipal confinement facilities
- 1,100 people in group homes intended for adults
- 757 people in military barracks and dormitories (nondisciplinary)
- 709 people in other noninstitutional facilities
- 683 people in military ships
- 569 people in workers' group living quarters and job corps centers
- 407 people in emergency and transitional shelters (with sleeping facilities) for people experiencing homelessness
- 259 people in college/university student housing
- 144 people in residential treatment centers for adults
- 50 people in correctional facilities intended for juveniles
- 43 people in hospitals with patients who have no usual home elsewhere
- 30 people in mental (psychiatric) hospitals and psychiatric units in other hospitals
- 16 people in group homes for juveniles (non-correctional)
- 11 people in in-patient hospice facilities
- 5 people in correctional residential facilities
- 5 people in residential treatment centers for juveniles (non-correctional)
People in group quarters in Snohomish County, Washington in 2000:
- 2,505 people in other noninstitutional group quarters
- 2,036 people in military ships
- 1,792 people in state prisons
- 879 people in nursing homes
- 683 people in local jails and other confinement facilities (including police lockups)
- 303 people in other group homes
- 257 people in homes or halfway houses for drug/alcohol abuse
- 114 people in homes for the mentally ill
- 98 people in military barracks, etc.
- 91 people in homes for the mentally retarded
- 86 people in short-term care, detention or diagnostic centers for delinquent children
- 86 people in other nonhousehold living situations
- 70 people in college dormitories (includes college quarters off campus)
- 45 people in unknown juvenile institutions
- 30 people in military transient quarters for temporary residents
- 25 people in homes for the physically handicapped
- 12 people in religious group quarters
7.60% of this county's 2021 resident taxpayers lived in other counties in 2020 ($97,930 average adjusted gross income)
| Here: | 7.60% |
| Washington average: | 7.53% |
0.04% of residents moved from foreign countries ($285 average AGI)
Snohomish County: 0.04% Washington average: 0.05%
5.19% relocated from other counties in Washington ($69,633 average AGI)
2.37% relocated from other states ($28,012 average AGI)
Snohomish County: 2.37% Washington average: 3.85%
Top counties from which taxpayers relocated into this county between 2020 and 2021:
| from King County, WA | |
| from Pierce County, WA | |
| from Skagit County, WA | |
| from Island County, WA | |
| from Whatcom County, WA | |
| from Los Angeles County, CA | |
| from Maricopa County, AZ |
7.20% of this county's 2020 resident taxpayers moved to other counties in 2021 ($85,049 average adjusted gross income)
| Here: | 7.20% |
| Washington average: | 7.40% |
0.02% of residents moved to foreign countries ($153 average AGI)
Snohomish County: 0.02% Washington average: 0.04%
4.08% relocated to other counties in Washington ($45,962 average AGI)
3.11% relocated to other states ($38,935 average AGI)
Snohomish County: 3.11% Washington average: 3.73%
Top counties to which taxpayers relocated from this county between 2020 and 2021:
| to King County, WA | |
| to Pierce County, WA | |
| to Skagit County, WA | |
| to Maricopa County, AZ | |
| to Island County, WA | |
| to Whatcom County, WA | |
| to Spokane County, WA |
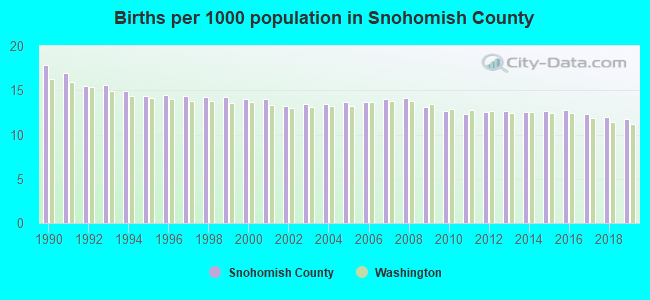
Births per 1000 population from 1990 to 1999: 15.2
Births per 1000 population from 2000 to 2009: 13.7
Births per 1000 population from 2010 to 2022: 10.4
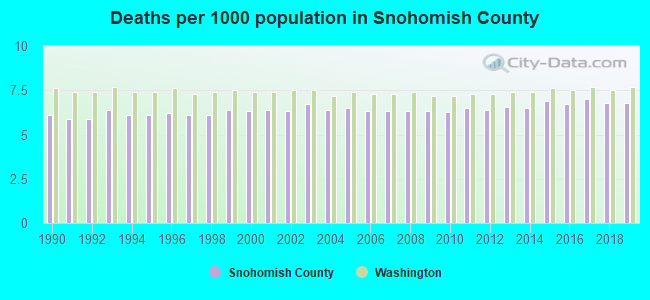
Deaths per 1000 population from 1990 to 1999: 6.1
Deaths per 1000 population from 2000 to 2009: 6.4
Deaths per 1000 population from 2010 to 2020: 6.7
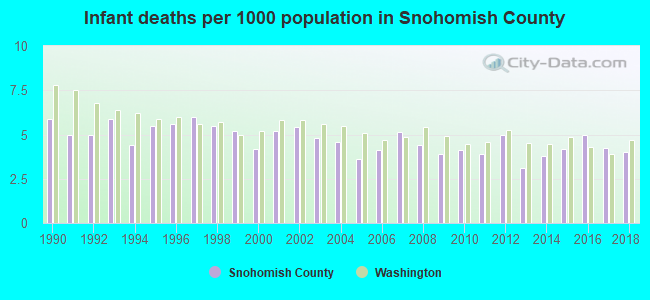
Infant deaths per 1000 live births from 1990 to 1999: 5.4
Infant deaths per 1000 live births from 2000 to 2009: 4.5
Infant deaths per 1000 live births from 2010 to 2021: 4.0
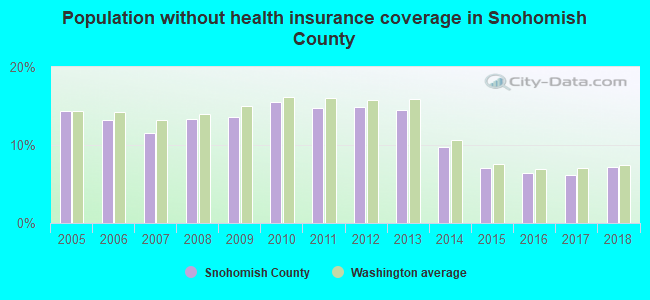
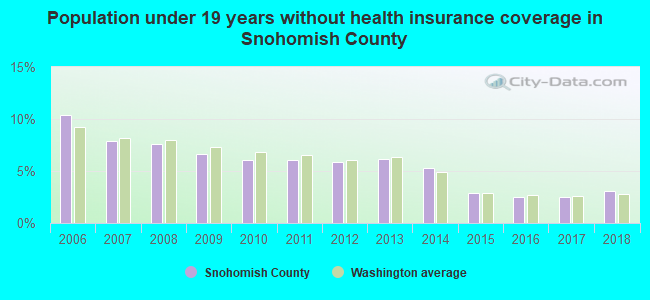
Persons under 19 years old without health insurance coverage in 2018: 3.1%
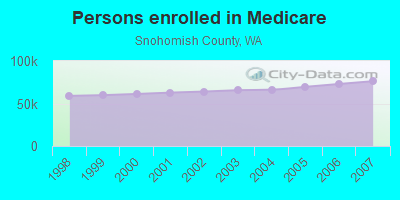
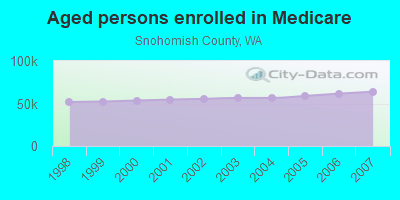
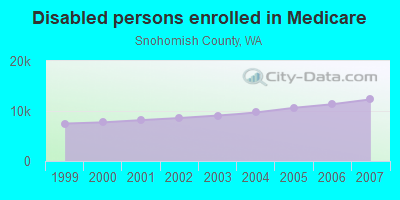
Persons enrolled in hospital insurance and/or supplemental medical insurance (Medicare) in July 1, 2007: 76,244 (63,913 aged, 12,331 disabled)
Children under 18 without health insurance coverage in 2007: 10,990 (6%)
Most common underlying causes of death in Snohomish County, Washington in 1999 - 2019:
- Bronchus or lung, unspecified - Malignant neoplasms (6,090)
- Atherosclerotic heart disease (5,521)
- Alzheimer disease, unspecified (5,419)
- Chronic obstructive pulmonary disease, unspecified (3,892)
- Atherosclerotic cardiovascular disease, so described (3,717)
- Acute myocardial infarction, unspecified (3,646)
- Stroke, not specified as haemorrhage or infarction (2,579)
- Breast, unspecified - Malignant neoplasms (1,606)
- Unspecified dementia (1,520)
- Pancreas, unspecified - Malignant neoplasms (1,456)
Population without health insurance coverage in 2000: 13%
Children under 18 without health insurance coverage in 2000: 10%
Short term general hospital admissions per 100,000 population in 2004: 5,255
Short term general hospital beds per 100,000 population in 2004: 91
Emergency room visits per 100,000 population in 2004: 25,690
General practice office based MDs per 100,000 population in 2005: 1,275
Medical specialist MDs per 100,000 population in 2005: 673
Dentists per 100,000 population in 1998: 4
Total births per 100,000 population, July 2005 - July 2006 : 45
Total deaths per 100,000 population, July 2005 - July 2006: 114
Limited-service eating places per 100,000 population in 2005 : 10
EPA green book nonattainment status in 2004-2006: 1
Homicides per 1,000,000 population from 2000 to 2006: 23.9. This is less than state average.
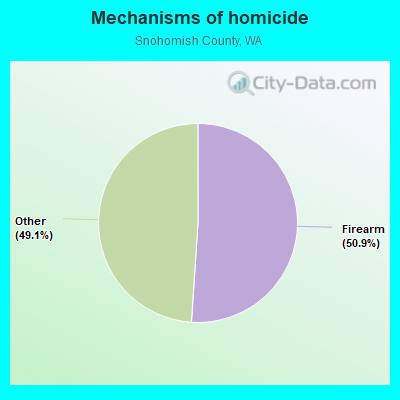
- Firearm - 12.2
- Other - 11.7
Suicides per 1,000,000 population from 2000 to 2006: 123.8. This is less than state average.
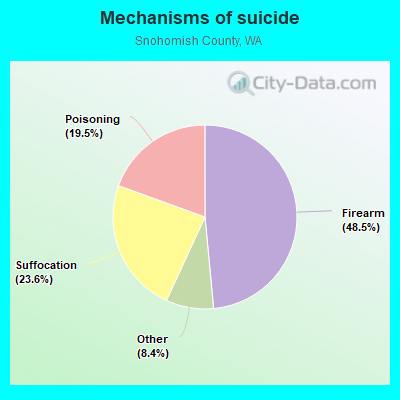
- Firearm - 60.1
- Suffocation - 29.3
- Poisoning - 24.1
- Other - 10.4
Household type by relationship:
Households: 840,079- Male householders: 163,168 (35,706 living alone), Female householders: 151,720 (40,226 living alone)
165,904 spouses (164,274 opposite-sex spouses), 26,430 unmarried partners, (24,298 opposite-sex unmarried partners), 236,134 children (221,498 natural, 4,984 adopted, 9,652 stepchildren), 12,063 grandchildren, 9,257 brothers or sisters, 17,970 parents, 119 foster children, 14,147 other relatives, 33,718 non-relatives
- In group quarters: 9,449
Size of family households: 83,661 2-persons, 48,746 3-persons, 44,445 4-persons, 20,341 5-persons, 7,612 6-persons, 5,411 7-or-more-persons.
Size of nonfamily households: 75,932 1-person, 24,050 2-persons, 3,546 3-persons, 462 4-persons, 381 5-persons, 172 6-persons, 129 7-or-more-persons.
135,560 married couples with children.
32,623 single-parent households (9,202 men, 23,421 women).
77.2% of residents of Snohomish speak English at home.
6.7% of residents speak Spanish at home (58% speak English very well, 23% speak English well, 12% speak English not well, 6% don't speak English at all).
5.5% of residents speak other Indo-European language at home (65% speak English very well, 22% speak English well, 9% speak English not well, 3% don't speak English at all).
8.7% of residents speak Asian or Pacific Island language at home (57% speak English very well, 27% speak English well, 14% speak English not well, 2% don't speak English at all).
1.8% of residents speak other language at home (70% speak English very well, 21% speak English well, 8% speak English not well).
In fiscal year 2004:
Federal Government expenditure: $2,555,166,000 ($3,966 per capita)
Department of Defense expenditure: $467,326,000
Federal direct payments to individuals for retirement and disability: $1,150,896,000
Federal other direct payments to individuals: $424,974,000
Federal direct payments not to individuals: $10,837,000
Federal grants: $443,471,000
Federal procurement contracts: $188,066,000 ($144,059,000 Department of Defense)
Federal salaries and wages: $336,922,000 ($228,253,000 Department of Defense)
Federal Government direct loans: $34,977,000
Federal guaranteed/insured loans: $906,189,000
Federal Government insurance: $336,865,000
Population change from April 1, 2000 to July 1, 2005:
Births: 44,480| Here: | 68 per 1000 residents |
| State: | 66 per 1000 residents |
Deaths: 21,515
| Here: | 33 per 1000 residents |
| State: | 38 per 1000 residents |
Net international migration: +12,092
| Here: | +18 per 1000 residents |
| State: | +21 per 1000 residents |
Net internal migration: +15,748
| Here: | +24 per 1000 residents |
| State: | +13 per 1000 residents |
Total withdrawal of fresh water for public supply: 71.07 millions of gallons per day (10% from ground, 90% from surface)
| Here: | 6.5 |
| State: | 6.5 |
| Here: | 4.0 |
| State: | 3.9 |
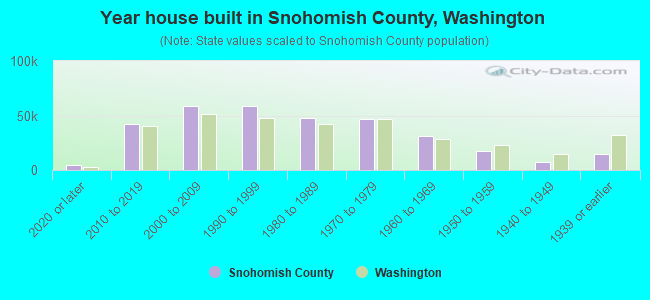
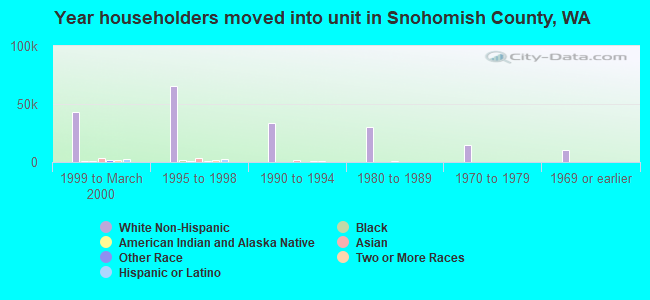
- Year house built in Snohomish County, Washington
- 9,3122020 or later
- 40,5492010 to 2019
- 59,5732000 to 2009
- 55,6871990 to 1999
- 51,8131980 to 1989
- 44,1901970 to 1979
- 35,7891960 to 1969
- 16,7971950 to 1959
- 6,1851940 to 1949
- 13,9241939 or earlier
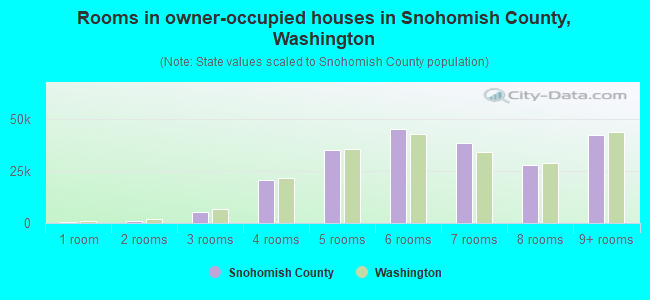
- Rooms in owner-occupied houses in Snohomish County, Washington
- 4961 room
- 2,8232 rooms
- 5,3293 rooms
- 19,8204 rooms
- 33,5515 rooms
- 45,1006 rooms
- 33,7347 rooms
- 28,0298 rooms
- 44,4939+ rooms
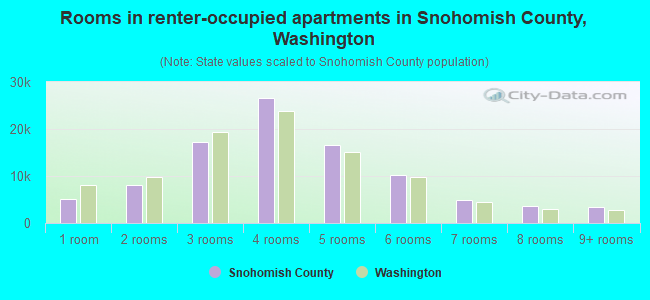
- Rooms in renter-occupied apartments in Snohomish County, Washington
- 4,9041 room
- 9,8262 rooms
- 22,0373 rooms
- 25,4904 rooms
- 13,1955 rooms
- 12,3326 rooms
- 5,4937 rooms
- 4,7008 rooms
- 3,5369+ rooms
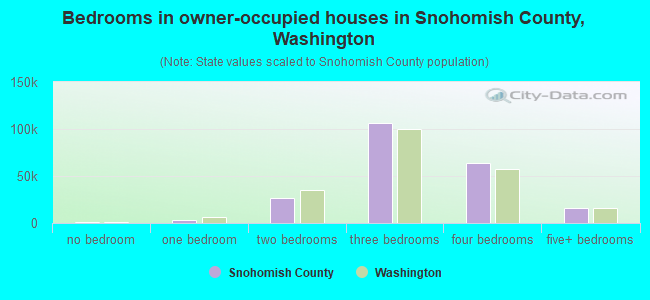
- Bedrooms in owner-occupied houses in Snohomish County, Washington
- 823no bedroom
- 4,9391 bedroom
- 30,3592 bedrooms
- 99,5593 bedrooms
- 61,9904 bedrooms
- 15,7055+ bedrooms
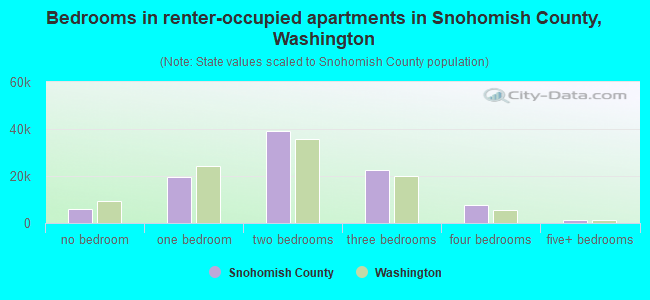
- Bedrooms in renter-occupied apartments in Snohomish County, Washington
- 5,789no bedroom
- 21,1241 bedroom
- 41,2822 bedrooms
- 23,1273 bedrooms
- 7,6614 bedrooms
- 2,5305+ bedrooms
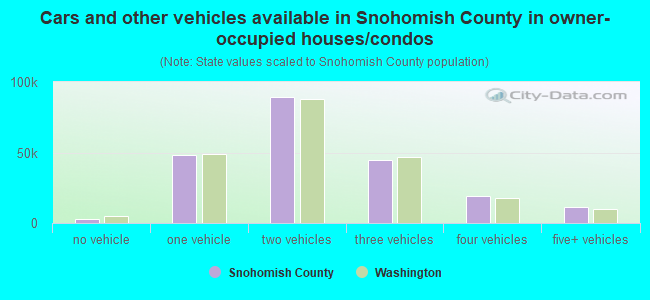
- Cars and other vehicles available in Snohomish County in owner-occupied houses/condos
- 4,239no vehicle
- 51,3531 vehicle
- 88,4512 vehicles
- 43,5993 vehicles
- 17,2054 vehicles
- 8,5285+ vehicles
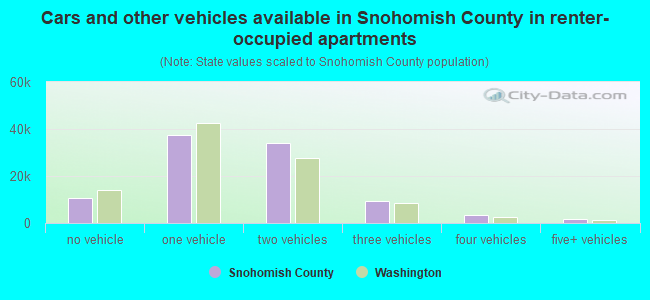
- Cars and other vehicles available in Snohomish County in renter-occupied apartments
- 9,485no vehicle
- 42,1641 vehicle
- 35,4582 vehicles
- 10,4793 vehicles
- 2,4044 vehicles
- 1,5235+ vehicles
86.9% of Snohomish County residents lived in the same house 1 years ago.
Out of people who lived in different houses, 35% lived in this county.
Out of people who lived in different counties, 63% lived in Washington.
| Snohomish County: | 86.9% |
| State average: | 85.2% |
Place of birth for U.S.-born residents:
- This state: 413,093
- Other state: 257,962
- Northeast: 29,605
- Midwest: 59,362
- South: 39,839
- West: 129,156
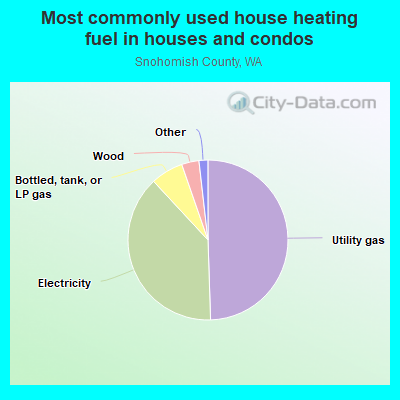
- 50.2%Utility gas
- 39.1%Electricity
- 5.2%Bottled, tank, or LP gas
- 3.6%Wood
- 0.7%Other fuel
- 0.6%Fuel oil, kerosene, etc.
- 0.5%No fuel used
- 0.2%Solar energy
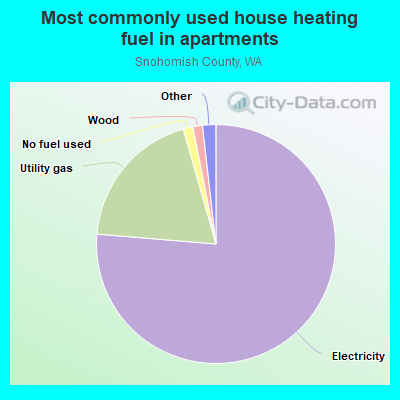
- 78.3%Electricity
- 17.4%Utility gas
- 2.3%Bottled, tank, or LP gas
- 0.8%Wood
- 0.7%No fuel used
- 0.3%Fuel oil, kerosene, etc.
- 0.1%Other fuel
Private vs. public school enrollment:
| Here: | 14.1% |
| Washington: | 12.4% |
| Here: | 8.0% |
| Washington: | 9.2% |
| Here: | 13.4% |
| Washington: | 16.5% |
Snohomish County government finances - Expenditure in 2018:
- Bond Funds - Cash and Securities: $64,181,000
Cash and Securities: $53,269,000
- Charges - Solid Waste Management: $62,667,000
Solid Waste Management: $59,131,000
Other: $45,047,000
Other: $44,875,000
Air Transportation: $28,673,000
Air Transportation: $26,677,000
Parks and Recreation: $3,256,000
Parks and Recreation: $2,342,000
Sewerage: $1,395,000
Sewerage: $654,000
Natural Resources - Other: $451,000
Natural Resources - Other: $384,000
Housing and Community Development: $15,000
- Construction - Judicial and Legal Services: $27,006,000
Regular Highways: $21,650,000
Regular Highways: $18,803,000
Parks and Recreation: $11,818,000
Parks and Recreation: $6,514,000
General - Other: $4,091,000
Judicial and Legal Services: $2,943,000
General - Other: $1,556,000
Natural Resources - Other: $1,540,000
Natural Resources - Other: $1,415,000
Central Staff Services: $1,383,000
Health - Other: $421,000
Central Staff Services: $232,000
Correctional Institutions: $65,000
Correctional Institutions: $35,000
Police Protection: $2,000
- Current Operations - Regular Highways: $74,309,000
Police Protection: $71,356,000
Correctional Institutions: $70,926,000
General - Other: $66,226,000
Judicial and Legal Services: $64,889,000
Judicial and Legal Services: $64,060,000
Correctional Institutions: $64,052,000
Police Protection: $62,064,000
Regular Highways: $60,653,000
Solid Waste Management: $57,054,000
Solid Waste Management: $54,078,000
General - Other: $52,849,000
Health - Other: $50,626,000
Health - Other: $41,786,000
Public Welfare - Other: $25,377,000
Sewerage: $23,997,000
Financial Administration: $22,362,000
Sewerage: $22,138,000
Public Welfare - Other: $20,397,000
Housing and Community Development: $19,757,000
Financial Administration: $19,639,000
Housing and Community Development: $19,135,000
Air Transportation: $18,008,000
Air Transportation: $13,915,000
Central Staff Services: $11,752,000
Central Staff Services: $11,231,000
Parks and Recreation: $11,017,000
Parks and Recreation: $9,622,000
Natural Resources - Other: $4,283,000
Natural Resources - Other: $3,374,000
Protective Inspection and Regulation - Other: $3,058,000
Protective Inspection and Regulation - Other: $2,883,000
Corrections - Other: $2,043,000
Corrections - Other: $1,798,000
Local Fire Protection: $1,461,000
Local Fire Protection: $1,151,000
Libraries: $23,000
- Federal Intergovernmental - Housing and Community Development: $14,261,000
Housing and Community Development: $12,176,000
Highways: $9,544,000
Highways: $2,920,000
General Local Government Support: $1,433,000
Other: $1,303,000
General Local Government Support: $1,287,000
Health and Hospitals: $1,286,000
Health and Hospitals: $1,209,000
Other: $1,026,000
Natural Resources: $280,000
Natural Resources: $32,000
- General - Interest on Debt: $15,557,000
Interest on Debt: $14,364,000
- Intergovernmental to Local - Other - General - Other: $3,328,000
Other - Health - Other: $2,517,000
Other - Health - Other: $905,000
Other - Public Welfare - Other: $92,000
Other - Parks and Recreation: $64,000
Other - Natural Resources - Other: $51,000
- Intergovernmental to State - Health - Other: $52,000
Health - Other: $11,000
- Local Intergovernmental - Other: $34,358,000
Other: $31,188,000
Health and Hospitals: $21,171,000
Health and Hospitals: $16,700,000
Highways: $13,015,000
Highways: $12,847,000
- Long Term Debt - Beginning Outstanding - Unspecified Public Purpose: $408,463,000
Outstanding Unspecified Public Purpose: $393,041,000
Outstanding Unspecified Public Purpose: $385,715,000
Beginning Outstanding - Unspecified Public Purpose: $367,878,000
Issue, Unspecified Public Purpose: $52,865,000
Retired Unspecified Public Purpose: $27,702,000
Retired Unspecified Public Purpose: $22,836,000
- Miscellaneous - Special Assessments: $25,934,000
Special Assessments: $20,917,000
Sale of Property: $13,852,000
Interest Earnings: $10,706,000
General Revenue - Other: $7,424,000
Fines and Forfeits: $5,001,000
Interest Earnings: $4,872,000
Fines and Forfeits: $4,332,000
General Revenue - Other: $2,329,000
Donations From Private Sources: $1,993,000
Donations From Private Sources: $1,489,000
Sale of Property: $1,200,000
- Other Capital Outlay - Regular Highways: $4,443,000
Regular Highways: $3,699,000
General - Other: $2,142,000
General - Other: $1,898,000
Judicial and Legal Services: $852,000
Police Protection: $551,000
Natural Resources - Other: $419,000
Correctional Institutions: $320,000
Natural Resources - Other: $242,000
Health - Other: $103,000
Parks and Recreation: $102,000
Parks and Recreation: $98,000
Central Staff Services: $67,000
Protective Inspection and Regulation - Other: $66,000
Correctional Institutions: $43,000
Police Protection: $36,000
Health - Other: $16,000
- Other Funds - Cash and Securities: $391,405,000
Cash and Securities: $227,562,000
- Sinking Funds - Cash and Securities: $218,000
Cash and Securities: $83,000
- State Intergovernmental - Other: $44,558,000
Other: $43,541,000
Health and Hospitals: $31,725,000
Health and Hospitals: $29,651,000
Highways: $14,025,000
Highways: $11,968,000
Public Welfare: $3,957,000
General Local Government Support: $2,466,000
General Local Government Support: $2,189,000
Public Welfare: $1,034,000
Housing and Community Development: $485,000
Housing and Community Development: $318,000
- Tax - Property: $161,868,000
Property: $154,679,000
General Sales and Gross Receipts: $102,026,000
General Sales and Gross Receipts: $74,794,000
Documentary and Stock Transfer: $24,462,000
Documentary and Stock Transfer: $22,867,000
Other License: $16,796,000
Other License: $14,671,000
Public Utilities Sales: $11,989,000
Public Utilities Sales: $11,865,000
Motor Vehicle License: $4,803,000
Other Selective Sales: $4,561,000
Other Selective Sales: $4,471,000
Motor Vehicle License: $4,168,000
Amusements Sales: $2,803,000
Amusements Sales: $2,704,000
Severance: $655,000
Occupation and Business License - Other: $466,000
Severance: $444,000
Occupation and Business License - Other: $427,000
- Total Salaries and Wages: $243,459,000
: $221,988,000
Snohomish County government finances - Revenue in 2018:
- Bond Funds - Cash and Securities: $64,181,000
Cash and Securities: $53,269,000
- Charges - Solid Waste Management: $62,667,000
Solid Waste Management: $59,131,000
Other: $45,047,000
Other: $44,875,000
Air Transportation: $28,673,000
Air Transportation: $26,677,000
Parks and Recreation: $3,256,000
Parks and Recreation: $2,342,000
Sewerage: $1,395,000
Sewerage: $654,000
Natural Resources - Other: $451,000
Natural Resources - Other: $384,000
Housing and Community Development: $15,000
- Construction - Judicial and Legal Services: $27,006,000
Regular Highways: $21,650,000
Regular Highways: $18,803,000
Parks and Recreation: $11,818,000
Parks and Recreation: $6,514,000
General - Other: $4,091,000
Judicial and Legal Services: $2,943,000
General - Other: $1,556,000
Natural Resources - Other: $1,540,000
Natural Resources - Other: $1,415,000
Central Staff Services: $1,383,000
Health - Other: $421,000
Central Staff Services: $232,000
Correctional Institutions: $65,000
Correctional Institutions: $35,000
Police Protection: $2,000
- Current Operations - Regular Highways: $74,309,000
Police Protection: $71,356,000
Correctional Institutions: $70,926,000
General - Other: $66,226,000
Judicial and Legal Services: $64,889,000
Judicial and Legal Services: $64,060,000
Correctional Institutions: $64,052,000
Police Protection: $62,064,000
Regular Highways: $60,653,000
Solid Waste Management: $57,054,000
Solid Waste Management: $54,078,000
General - Other: $52,849,000
Health - Other: $50,626,000
Health - Other: $41,786,000
Public Welfare - Other: $25,377,000
Sewerage: $23,997,000
Financial Administration: $22,362,000
Sewerage: $22,138,000
Public Welfare - Other: $20,397,000
Housing and Community Development: $19,757,000
Financial Administration: $19,639,000
Housing and Community Development: $19,135,000
Air Transportation: $18,008,000
Air Transportation: $13,915,000
Central Staff Services: $11,752,000
Central Staff Services: $11,231,000
Parks and Recreation: $11,017,000
Parks and Recreation: $9,622,000
Natural Resources - Other: $4,283,000
Natural Resources - Other: $3,374,000
Protective Inspection and Regulation - Other: $3,058,000
Protective Inspection and Regulation - Other: $2,883,000
Corrections - Other: $2,043,000
Corrections - Other: $1,798,000
Local Fire Protection: $1,461,000
Local Fire Protection: $1,151,000
Libraries: $23,000
- Federal Intergovernmental - Housing and Community Development: $14,261,000
Housing and Community Development: $12,176,000
Highways: $9,544,000
Highways: $2,920,000
General Local Government Support: $1,433,000
Other: $1,303,000
General Local Government Support: $1,287,000
Health and Hospitals: $1,286,000
Health and Hospitals: $1,209,000
Other: $1,026,000
Natural Resources: $280,000
Natural Resources: $32,000
- General - Interest on Debt: $15,557,000
Interest on Debt: $14,364,000
- Intergovernmental to Local - Other - General - Other: $3,328,000
Other - Health - Other: $2,517,000
Other - Health - Other: $905,000
Other - Public Welfare - Other: $92,000
Other - Parks and Recreation: $64,000
Other - Natural Resources - Other: $51,000
- Intergovernmental to State - Health - Other: $52,000
Health - Other: $11,000
- Local Intergovernmental - Other: $34,358,000
Other: $31,188,000
Health and Hospitals: $21,171,000
Health and Hospitals: $16,700,000
Highways: $13,015,000
Highways: $12,847,000
- Long Term Debt - Beginning Outstanding - Unspecified Public Purpose: $408,463,000
Outstanding Unspecified Public Purpose: $393,041,000
Outstanding Unspecified Public Purpose: $385,715,000
Beginning Outstanding - Unspecified Public Purpose: $367,878,000
Issue, Unspecified Public Purpose: $52,865,000
Retired Unspecified Public Purpose: $27,702,000
Retired Unspecified Public Purpose: $22,836,000
- Miscellaneous - Special Assessments: $25,934,000
Special Assessments: $20,917,000
Sale of Property: $13,852,000
Interest Earnings: $10,706,000
General Revenue - Other: $7,424,000
Fines and Forfeits: $5,001,000
Interest Earnings: $4,872,000
Fines and Forfeits: $4,332,000
General Revenue - Other: $2,329,000
Donations From Private Sources: $1,993,000
Donations From Private Sources: $1,489,000
Sale of Property: $1,200,000
- Other Capital Outlay - Regular Highways: $4,443,000
Regular Highways: $3,699,000
General - Other: $2,142,000
General - Other: $1,898,000
Judicial and Legal Services: $852,000
Police Protection: $551,000
Natural Resources - Other: $419,000
Correctional Institutions: $320,000
Natural Resources - Other: $242,000
Health - Other: $103,000
Parks and Recreation: $102,000
Parks and Recreation: $98,000
Central Staff Services: $67,000
Protective Inspection and Regulation - Other: $66,000
Correctional Institutions: $43,000
Police Protection: $36,000
Health - Other: $16,000
- Other Funds - Cash and Securities: $391,405,000
Cash and Securities: $227,562,000
- Sinking Funds - Cash and Securities: $218,000
Cash and Securities: $83,000
- State Intergovernmental - Other: $44,558,000
Other: $43,541,000
Health and Hospitals: $31,725,000
Health and Hospitals: $29,651,000
Highways: $14,025,000
Highways: $11,968,000
Public Welfare: $3,957,000
General Local Government Support: $2,466,000
General Local Government Support: $2,189,000
Public Welfare: $1,034,000
Housing and Community Development: $485,000
Housing and Community Development: $318,000
- Tax - Property: $161,868,000
Property: $154,679,000
General Sales and Gross Receipts: $102,026,000
General Sales and Gross Receipts: $74,794,000
Documentary and Stock Transfer: $24,462,000
Documentary and Stock Transfer: $22,867,000
Other License: $16,796,000
Other License: $14,671,000
Public Utilities Sales: $11,989,000
Public Utilities Sales: $11,865,000
Motor Vehicle License: $4,803,000
Other Selective Sales: $4,561,000
Other Selective Sales: $4,471,000
Motor Vehicle License: $4,168,000
Amusements Sales: $2,803,000
Amusements Sales: $2,704,000
Severance: $655,000
Occupation and Business License - Other: $466,000
Severance: $444,000
Occupation and Business License - Other: $427,000
- Total Salaries and Wages: $243,459,000
: $221,988,000
Snohomish County government finances - Debt in 2018:
- Bond Funds - Cash and Securities: $64,181,000
Cash and Securities: $53,269,000
- Charges - Solid Waste Management: $62,667,000
Solid Waste Management: $59,131,000
Other: $45,047,000
Other: $44,875,000
Air Transportation: $28,673,000
Air Transportation: $26,677,000
Parks and Recreation: $3,256,000
Parks and Recreation: $2,342,000
Sewerage: $1,395,000
Sewerage: $654,000
Natural Resources - Other: $451,000
Natural Resources - Other: $384,000
Housing and Community Development: $15,000
- Construction - Judicial and Legal Services: $27,006,000
Regular Highways: $21,650,000
Regular Highways: $18,803,000
Parks and Recreation: $11,818,000
Parks and Recreation: $6,514,000
General - Other: $4,091,000
Judicial and Legal Services: $2,943,000
General - Other: $1,556,000
Natural Resources - Other: $1,540,000
Natural Resources - Other: $1,415,000
Central Staff Services: $1,383,000
Health - Other: $421,000
Central Staff Services: $232,000
Correctional Institutions: $65,000
Correctional Institutions: $35,000
Police Protection: $2,000
- Current Operations - Regular Highways: $74,309,000
Police Protection: $71,356,000
Correctional Institutions: $70,926,000
General - Other: $66,226,000
Judicial and Legal Services: $64,889,000
Judicial and Legal Services: $64,060,000
Correctional Institutions: $64,052,000
Police Protection: $62,064,000
Regular Highways: $60,653,000
Solid Waste Management: $57,054,000
Solid Waste Management: $54,078,000
General - Other: $52,849,000
Health - Other: $50,626,000
Health - Other: $41,786,000
Public Welfare - Other: $25,377,000
Sewerage: $23,997,000
Financial Administration: $22,362,000
Sewerage: $22,138,000
Public Welfare - Other: $20,397,000
Housing and Community Development: $19,757,000
Financial Administration: $19,639,000
Housing and Community Development: $19,135,000
Air Transportation: $18,008,000
Air Transportation: $13,915,000
Central Staff Services: $11,752,000
Central Staff Services: $11,231,000
Parks and Recreation: $11,017,000
Parks and Recreation: $9,622,000
Natural Resources - Other: $4,283,000
Natural Resources - Other: $3,374,000
Protective Inspection and Regulation - Other: $3,058,000
Protective Inspection and Regulation - Other: $2,883,000
Corrections - Other: $2,043,000
Corrections - Other: $1,798,000
Local Fire Protection: $1,461,000
Local Fire Protection: $1,151,000
Libraries: $23,000
- Federal Intergovernmental - Housing and Community Development: $14,261,000
Housing and Community Development: $12,176,000
Highways: $9,544,000
Highways: $2,920,000
General Local Government Support: $1,433,000
Other: $1,303,000
General Local Government Support: $1,287,000
Health and Hospitals: $1,286,000
Health and Hospitals: $1,209,000
Other: $1,026,000
Natural Resources: $280,000
Natural Resources: $32,000
- General - Interest on Debt: $15,557,000
Interest on Debt: $14,364,000
- Intergovernmental to Local - Other - General - Other: $3,328,000
Other - Health - Other: $2,517,000
Other - Health - Other: $905,000
Other - Public Welfare - Other: $92,000
Other - Parks and Recreation: $64,000
Other - Natural Resources - Other: $51,000
- Intergovernmental to State - Health - Other: $52,000
Health - Other: $11,000
- Local Intergovernmental - Other: $34,358,000
Other: $31,188,000
Health and Hospitals: $21,171,000
Health and Hospitals: $16,700,000
Highways: $13,015,000
Highways: $12,847,000
- Long Term Debt - Beginning Outstanding - Unspecified Public Purpose: $408,463,000
Outstanding Unspecified Public Purpose: $393,041,000
Outstanding Unspecified Public Purpose: $385,715,000
Beginning Outstanding - Unspecified Public Purpose: $367,878,000
Issue, Unspecified Public Purpose: $52,865,000
Retired Unspecified Public Purpose: $27,702,000
Retired Unspecified Public Purpose: $22,836,000
- Miscellaneous - Special Assessments: $25,934,000
Special Assessments: $20,917,000
Sale of Property: $13,852,000
Interest Earnings: $10,706,000
General Revenue - Other: $7,424,000
Fines and Forfeits: $5,001,000
Interest Earnings: $4,872,000
Fines and Forfeits: $4,332,000
General Revenue - Other: $2,329,000
Donations From Private Sources: $1,993,000
Donations From Private Sources: $1,489,000
Sale of Property: $1,200,000
- Other Capital Outlay - Regular Highways: $4,443,000
Regular Highways: $3,699,000
General - Other: $2,142,000
General - Other: $1,898,000
Judicial and Legal Services: $852,000
Police Protection: $551,000
Natural Resources - Other: $419,000
Correctional Institutions: $320,000
Natural Resources - Other: $242,000
Health - Other: $103,000
Parks and Recreation: $102,000
Parks and Recreation: $98,000
Central Staff Services: $67,000
Protective Inspection and Regulation - Other: $66,000
Correctional Institutions: $43,000
Police Protection: $36,000
Health - Other: $16,000
- Other Funds - Cash and Securities: $391,405,000
Cash and Securities: $227,562,000
- Sinking Funds - Cash and Securities: $218,000
Cash and Securities: $83,000
- State Intergovernmental - Other: $44,558,000
Other: $43,541,000
Health and Hospitals: $31,725,000
Health and Hospitals: $29,651,000
Highways: $14,025,000
Highways: $11,968,000
Public Welfare: $3,957,000
General Local Government Support: $2,466,000
General Local Government Support: $2,189,000
Public Welfare: $1,034,000
Housing and Community Development: $485,000
Housing and Community Development: $318,000
- Tax - Property: $161,868,000
Property: $154,679,000
General Sales and Gross Receipts: $102,026,000
General Sales and Gross Receipts: $74,794,000
Documentary and Stock Transfer: $24,462,000
Documentary and Stock Transfer: $22,867,000
Other License: $16,796,000
Other License: $14,671,000
Public Utilities Sales: $11,989,000
Public Utilities Sales: $11,865,000
Motor Vehicle License: $4,803,000
Other Selective Sales: $4,561,000
Other Selective Sales: $4,471,000
Motor Vehicle License: $4,168,000
Amusements Sales: $2,803,000
Amusements Sales: $2,704,000
Severance: $655,000
Occupation and Business License - Other: $466,000
Severance: $444,000
Occupation and Business License - Other: $427,000
- Total Salaries and Wages: $243,459,000
: $221,988,000
Snohomish County government finances - Cash and Securities in 2018:
- Bond Funds - Cash and Securities: $64,181,000
Cash and Securities: $53,269,000
- Charges - Solid Waste Management: $62,667,000
Solid Waste Management: $59,131,000
Other: $45,047,000
Other: $44,875,000
Air Transportation: $28,673,000
Air Transportation: $26,677,000
Parks and Recreation: $3,256,000
Parks and Recreation: $2,342,000
Sewerage: $1,395,000
Sewerage: $654,000
Natural Resources - Other: $451,000
Natural Resources - Other: $384,000
Housing and Community Development: $15,000
- Construction - Judicial and Legal Services: $27,006,000
Regular Highways: $21,650,000
Regular Highways: $18,803,000
Parks and Recreation: $11,818,000
Parks and Recreation: $6,514,000
General - Other: $4,091,000
Judicial and Legal Services: $2,943,000
General - Other: $1,556,000
Natural Resources - Other: $1,540,000
Natural Resources - Other: $1,415,000
Central Staff Services: $1,383,000
Health - Other: $421,000
Central Staff Services: $232,000
Correctional Institutions: $65,000
Correctional Institutions: $35,000
Police Protection: $2,000
- Current Operations - Regular Highways: $74,309,000
Police Protection: $71,356,000
Correctional Institutions: $70,926,000
General - Other: $66,226,000
Judicial and Legal Services: $64,889,000
Judicial and Legal Services: $64,060,000
Correctional Institutions: $64,052,000
Police Protection: $62,064,000
Regular Highways: $60,653,000
Solid Waste Management: $57,054,000
Solid Waste Management: $54,078,000
General - Other: $52,849,000
Health - Other: $50,626,000
Health - Other: $41,786,000
Public Welfare - Other: $25,377,000
Sewerage: $23,997,000
Financial Administration: $22,362,000
Sewerage: $22,138,000
Public Welfare - Other: $20,397,000
Housing and Community Development: $19,757,000
Financial Administration: $19,639,000
Housing and Community Development: $19,135,000
Air Transportation: $18,008,000
Air Transportation: $13,915,000
Central Staff Services: $11,752,000
Central Staff Services: $11,231,000
Parks and Recreation: $11,017,000
Parks and Recreation: $9,622,000
Natural Resources - Other: $4,283,000
Natural Resources - Other: $3,374,000
Protective Inspection and Regulation - Other: $3,058,000
Protective Inspection and Regulation - Other: $2,883,000
Corrections - Other: $2,043,000
Corrections - Other: $1,798,000
Local Fire Protection: $1,461,000
Local Fire Protection: $1,151,000
Libraries: $23,000
- Federal Intergovernmental - Housing and Community Development: $14,261,000
Housing and Community Development: $12,176,000
Highways: $9,544,000
Highways: $2,920,000
General Local Government Support: $1,433,000
Other: $1,303,000
General Local Government Support: $1,287,000
Health and Hospitals: $1,286,000
Health and Hospitals: $1,209,000
Other: $1,026,000
Natural Resources: $280,000
Natural Resources: $32,000
- General - Interest on Debt: $15,557,000
Interest on Debt: $14,364,000
- Intergovernmental to Local - Other - General - Other: $3,328,000
Other - Health - Other: $2,517,000
Other - Health - Other: $905,000
Other - Public Welfare - Other: $92,000
Other - Parks and Recreation: $64,000
Other - Natural Resources - Other: $51,000
- Intergovernmental to State - Health - Other: $52,000
Health - Other: $11,000
- Local Intergovernmental - Other: $34,358,000
Other: $31,188,000
Health and Hospitals: $21,171,000
Health and Hospitals: $16,700,000
Highways: $13,015,000
Highways: $12,847,000
- Long Term Debt - Beginning Outstanding - Unspecified Public Purpose: $408,463,000
Outstanding Unspecified Public Purpose: $393,041,000
Outstanding Unspecified Public Purpose: $385,715,000
Beginning Outstanding - Unspecified Public Purpose: $367,878,000
Issue, Unspecified Public Purpose: $52,865,000
Retired Unspecified Public Purpose: $27,702,000
Retired Unspecified Public Purpose: $22,836,000
- Miscellaneous - Special Assessments: $25,934,000
Special Assessments: $20,917,000
Sale of Property: $13,852,000
Interest Earnings: $10,706,000
General Revenue - Other: $7,424,000
Fines and Forfeits: $5,001,000
Interest Earnings: $4,872,000
Fines and Forfeits: $4,332,000
General Revenue - Other: $2,329,000
Donations From Private Sources: $1,993,000
Donations From Private Sources: $1,489,000
Sale of Property: $1,200,000
- Other Capital Outlay - Regular Highways: $4,443,000
Regular Highways: $3,699,000
General - Other: $2,142,000
General - Other: $1,898,000
Judicial and Legal Services: $852,000
Police Protection: $551,000
Natural Resources - Other: $419,000
Correctional Institutions: $320,000
Natural Resources - Other: $242,000
Health - Other: $103,000
Parks and Recreation: $102,000
Parks and Recreation: $98,000
Central Staff Services: $67,000
Protective Inspection and Regulation - Other: $66,000
Correctional Institutions: $43,000
Police Protection: $36,000
Health - Other: $16,000
- Other Funds - Cash and Securities: $391,405,000
Cash and Securities: $227,562,000
- Sinking Funds - Cash and Securities: $218,000
Cash and Securities: $83,000
- State Intergovernmental - Other: $44,558,000
Other: $43,541,000
Health and Hospitals: $31,725,000
Health and Hospitals: $29,651,000
Highways: $14,025,000
Highways: $11,968,000
Public Welfare: $3,957,000
General Local Government Support: $2,466,000
General Local Government Support: $2,189,000
Public Welfare: $1,034,000
Housing and Community Development: $485,000
Housing and Community Development: $318,000
- Tax - Property: $161,868,000
Property: $154,679,000
General Sales and Gross Receipts: $102,026,000
General Sales and Gross Receipts: $74,794,000
Documentary and Stock Transfer: $24,462,000
Documentary and Stock Transfer: $22,867,000
Other License: $16,796,000
Other License: $14,671,000
Public Utilities Sales: $11,989,000
Public Utilities Sales: $11,865,000
Motor Vehicle License: $4,803,000
Other Selective Sales: $4,561,000
Other Selective Sales: $4,471,000
Motor Vehicle License: $4,168,000
Amusements Sales: $2,803,000
Amusements Sales: $2,704,000
Severance: $655,000
Occupation and Business License - Other: $466,000
Severance: $444,000
Occupation and Business License - Other: $427,000
- Total Salaries and Wages: $243,459,000
: $221,988,000
Supplemental Security Income (SSI) in 2006:
- Total number of recipients: 9,427
- Number of aged recipients: 1,456
- Number of blind and disabled recipients: 7,971
- Number of recipients under 18: 1,092
- Number of recipients between 18 and 64: 5,883
- Number of recipients older than 64: 2,452
- Number of recipients also receiving OASDI: 2,365
- Amount of payments (thousands of dollars): 4,842
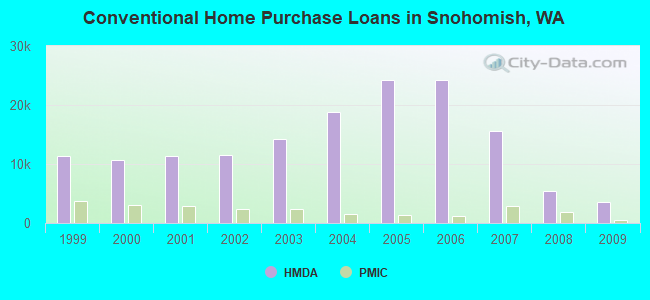
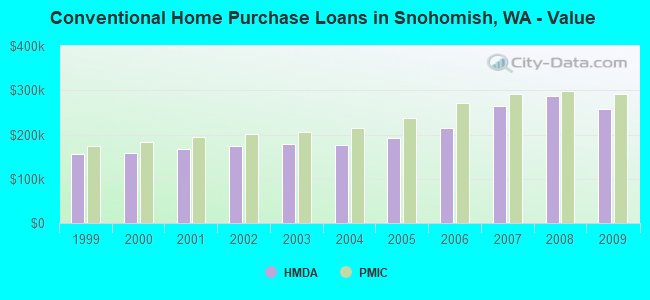
| Home Mortgage Disclosure Act Aggregated Statistics For Year 2009 (Based on 133 full tracts) | ||||||||||||||
| A) FHA, FSA/RHS & VA Home Purchase Loans | B) Conventional Home Purchase Loans | C) Refinancings | D) Home Improvement Loans | E) Loans on Dwellings For 5+ Families | F) Non-occupant Loans on < 5 Family Dwellings (A B C & D) | G) Loans On Manufactured Home Dwelling (A B C & D) | ||||||||
|---|---|---|---|---|---|---|---|---|---|---|---|---|---|---|
| Number | Average Value | Number | Average Value | Number | Average Value | Number | Average Value | Number | Average Value | Number | Average Value | Number | Average Value | |
| LOANS ORIGINATED | 3,970 | $272,476 | 3,607 | $257,663 | 23,987 | $256,591 | 629 | $159,789 | 66 | $1,055,727 | 1,285 | $221,156 | 642 | $190,696 |
| APPLICATIONS APPROVED, NOT ACCEPTED | 253 | $272,403 | 455 | $263,404 | 2,816 | $268,893 | 155 | $77,523 | 4 | $769,750 | 190 | $234,742 | 82 | $154,146 |
| APPLICATIONS DENIED | 585 | $256,499 | 667 | $247,441 | 7,211 | $282,386 | 381 | $124,717 | 12 | $510,583 | 525 | $226,920 | 303 | $167,079 |
| APPLICATIONS WITHDRAWN | 611 | $253,141 | 508 | $264,396 | 5,747 | $272,233 | 181 | $164,503 | 9 | $700,222 | 393 | $219,501 | 151 | $198,775 |
| FILES CLOSED FOR INCOMPLETENESS | 73 | $244,123 | 104 | $268,721 | 1,211 | $272,064 | 74 | $129,203 | 2 | $238,000 | 84 | $228,607 | 49 | $165,327 |
| Private Mortgage Insurance Companies Aggregated Statistics For Year 2009 (Based on 131 full tracts) | ||||||||
| A) Conventional Home Purchase Loans | B) Refinancings | C) Non-occupant Loans on < 5 Family Dwellings (A & B) | D) Loans On Manufactured Home Dwelling (A & B) | |||||
|---|---|---|---|---|---|---|---|---|
| Number | Average Value | Number | Average Value | Number | Average Value | Number | Average Value | |
| LOANS ORIGINATED | 480 | $291,329 | 428 | $303,133 | 8 | $255,000 | 1 | $187,000 |
| APPLICATIONS APPROVED, NOT ACCEPTED | 145 | $301,759 | 217 | $301,516 | 5 | $309,600 | 1 | $236,000 |
| APPLICATIONS DENIED | 118 | $275,517 | 184 | $302,641 | 3 | $249,667 | 0 | $0 |
| APPLICATIONS WITHDRAWN | 40 | $293,425 | 50 | $300,060 | 2 | $156,500 | 0 | $0 |
| FILES CLOSED FOR INCOMPLETENESS | 13 | $294,154 | 15 | $303,200 | 3 | $305,667 | 1 | $365,000 |
| Most common first names in Snohomish County, WA among deceased individuals | ||
| Name | Count | Lived (average) |
|---|---|---|
| John | 2,167 | 75.0 years |
| Robert | 1,916 | 71.9 years |
| William | 1,865 | 74.9 years |
| Mary | 1,459 | 79.6 years |
| James | 1,402 | 72.1 years |
| George | 1,133 | 77.0 years |
| Charles | 1,105 | 75.0 years |
| Margaret | 949 | 79.9 years |
| Helen | 935 | 80.6 years |
| Dorothy | 841 | 79.5 years |
| Most common last names in Snohomish County, WA among deceased individuals | ||
| Last name | Count | Lived (average) |
|---|---|---|
| Johnson | 1,093 | 77.6 years |
| Smith | 817 | 75.3 years |
| Anderson | 763 | 78.1 years |
| Nelson | 519 | 77.2 years |
| Miller | 512 | 76.1 years |
| Brown | 458 | 75.9 years |
| Jones | 391 | 74.8 years |
| Olson | 383 | 77.2 years |
| Peterson | 362 | 77.1 years |
| Wilson | 348 | 76.4 years |
| Businesses in Snohomish County, WA | ||||
| Name | Count | Name | Count | |
|---|---|---|---|---|
| 24 Hour Fitness | 2 | Justice | 2 | |
| 7-Eleven | 27 | KFC | 8 | |
| ALDO | 2 | Kincaid | 1 | |
| AT&T | 23 | Kmart | 2 | |
| Abercrombie & Fitch | 1 | Kohl's | 2 | |
| Abercrombie Kids | 1 | Kroger | 23 | |
| Ace Hardware | 8 | LA Fitness | 2 | |
| Aeropostale | 3 | La Quinta | 2 | |
| Aerosoles | 1 | La-Z-Boy | 3 | |
| Albertsons | 10 | Lane Bryant | 2 | |
| American Eagle Outfitters | 1 | Lane Furniture | 7 | |
| Ann Taylor | 2 | LensCrafters | 1 | |
| Apple Store | 1 | Levi Strauss & Co. | 1 | |
| Applebee's | 4 | Little Caesars Pizza | 11 | |
| Arby's | 5 | Long John Silver's | 1 | |
| AutoZone | 7 | Lowe's | 4 | |
| Avenue | 1 | Macy's | 3 | |
| Baja Fresh Mexican Grill | 1 | Marriott | 3 | |
| Bally Total Fitness | 1 | Marshalls | 2 | |
| Banana Republic | 2 | MasterBrand Cabinets | 43 | |
| Barnes & Noble | 1 | Mazda | 2 | |
| Baskin-Robbins | 15 | McDonald's | 27 | |
| Bath & Body Works | 3 | Men's Wearhouse | 1 | |
| Bed Bath & Beyond | 2 | Motel 6 | 2 | |
| Best Western | 6 | Motherhood Maternity | 3 | |
| Big O Tires | 2 | New Balance | 7 | |
| Blockbuster | 12 | Nike | 31 | |
| Brooks Brothers | 1 | Nissan | 2 | |
| Brookstone | 1 | Nordstrom | 2 | |
| Brunswick Bowling & Billiards | 1 | Office Depot | 4 | |
| Budget Car Rental | 1 | OfficeMax | 1 | |
| Burger King | 11 | Old Country Buffet | 1 | |
| Cache | 1 | Old Navy | 2 | |
| Carl\s Jr. | 1 | Olive Garden | 3 | |
| Casual Male XL | 1 | Outback | 2 | |
| Catherines | 2 | Outback Steakhouse | 2 | |
| Chevrolet | 3 | Pac Sun | 3 | |
| Chico's | 2 | Panda Express | 5 | |
| Chipotle | 1 | Panera Bread | 1 | |
| Chuck E. Cheese's | 1 | Papa John's Pizza | 6 | |
| Cinnabon | 2 | Payless | 10 | |
| Circle K | 1 | Penske | 4 | |
| Clarks | 2 | PetSmart | 3 | |
| Cold Stone Creamery | 3 | Pier 1 Imports | 2 | |
| Coldwater Creek | 2 | Pizza Hut | 9 | |
| Comfort Inn | 1 | Plato's Closet | 1 | |
| Costco | 3 | Pottery Barn | 1 | |
| Curves | 8 | Qdoba Mexican Grill | 2 | |
| DHL | 8 | Quality | 2 | |
| Dairy Queen | 10 | Quiznos | 12 | |
| Days Inn | 2 | RadioShack | 10 | |
| Decora Cabinetry | 1 | Red Lobster | 1 | |
| Dennys | 6 | Red Robin | 4 | |
| Discount Tire | 4 | Rite Aid | 14 | |
| Domino's Pizza | 9 | Rue21 | 1 | |
| DressBarn | 1 | SAS Shoes | 2 | |
| Dressbarn | 1 | Safeway | 4 | |
| Eddie Bauer | 2 | Sears | 6 | |
| Ethan Allen | 1 | Sephora | 2 | |
| Express | 1 | Skechers USA | 1 | |
| Extended Stay America | 3 | Soma Intimates | 1 | |
| Extended Stay Deluxe | 1 | Spencer Gifts | 2 | |
| Famous Footwear | 5 | Sprint Nextel | 8 | |
| Fashion Bug | 2 | Staples | 4 | |
| FedEx | 49 | Starbucks | 67 | |
| Finish Line | 1 | Studio 6 | 1 | |
| Firestone Complete Auto Care | 1 | Subaru | 1 | |
| Foot Locker | 2 | Subway | 27 | |
| Ford | 3 | T-Mobile | 19 | |
| Forever 21 | 2 | T.J.Maxx | 2 | |
| GNC | 14 | Taco Bell | 13 | |
| GameStop | 7 | Target | 4 | |
| Gap | 2 | The Limited | 1 | |
| Goodwill | 1 | The Room Place | 1 | |
| Gymboree | 2 | Toyota | 2 | |
| H&R Block | 20 | Toys"R"Us | 3 | |
| Hilton | 2 | Trader Joe's | 2 | |
| Hobby Lobby | 2 | Travelodge | 2 | |
| Holiday Inn | 5 | True Value | 7 | |
| Hollister Co. | 1 | U-Haul | 21 | |
| Home Depot | 3 | UPS | 67 | |
| Honda | 2 | Urban Outfitters | 1 | |
| Hot Topic | 2 | Vans | 8 | |
| IHOP | 4 | Verizon Wireless | 8 | |
| IZOD | 1 | Victoria's Secret | 2 | |
| J. Jill | 1 | Village Inn | 1 | |
| J.Crew | 1 | Volkswagen | 2 | |
| JCPenney | 3 | Vons | 14 | |
| Jack In The Box | 16 | Walgreens | 9 | |
| Jamba Juice | 5 | Walmart | 4 | |
| JoS. A. Bank | 1 | Wendy's | 7 | |
| Jones New York | 11 | Wet Seal | 2 | |
| Journeys | 3 | YMCA | 7 | |
Snohomish County on our top lists:
- #24 on the list of "Top 101 counties with the lowest Particulate Matter (PM2.5) Annual air pollution readings in 2012 (µg/m3)"
- #45 on the list of "Top 101 counties with the lowest number of infant deaths per 1000 residents 2007-2013 (pop. 50,000+)"
- #46 on the list of "Top 101 counties with the highest percentage of residents that exercised in the past month"
- #48 on the list of "Top 101 counties with the highest average weight of females"
- #60 on the list of "Top 101 counties with the most Other congregations (pop. 50,000+)"
- #63 on the list of "Top 101 counties with the most Other congregations"
- #64 on the list of "Top 101 counties with the most Evangelical Protestant congregations"
- #64 on the list of "Top 101 counties with the most Evangelical Protestant congregations (pop. 50,000+)"
- #72 on the list of "Top 101 counties with the largest increase in the number of infant deaths per 1000 residents 2000-2006 to 2007-2013 (pop. 50,000+)"
- #74 on the list of "Top 101 counties with the most Other adherents (pop. 50,000+)"
- #77 on the list of "Top 101 counties with the most Other adherents"
- #92 on the list of "Top 101 counties with the highest surface withdrawal of fresh water for public supply (pop. 50,000+)"
- #94 on the list of "Top 101 counties with the most Evangelical Protestant adherents"
- #94 on the list of "Top 101 counties with the most Evangelical Protestant adherents (pop. 50,000+)"
- #97 on the list of "Top 101 counties with the highest percentage of residents that keep firearms around their homes"
- #97 on the list of "Top 101 counties with the highest surface withdrawal of fresh water for public supply"