North Marysville, Washington Submit your own pictures of this place and show them to the world
OSM Map
General Map
Google Map
MSN Map
OSM Map
General Map
Google Map
MSN Map
OSM Map
General Map
Google Map
MSN Map
OSM Map
General Map
Google Map
MSN Map
Please wait while loading the map...
Population in 2010: 108. Population change since 2000: -99.5%Males: 47 Females: 61
March 2022 cost of living index in North Marysville: 98.2 (near average, U.S. average is 100) Percentage of residents living in poverty in 2022: 16.9%Business Search - 14 Million verified businesses
Data:
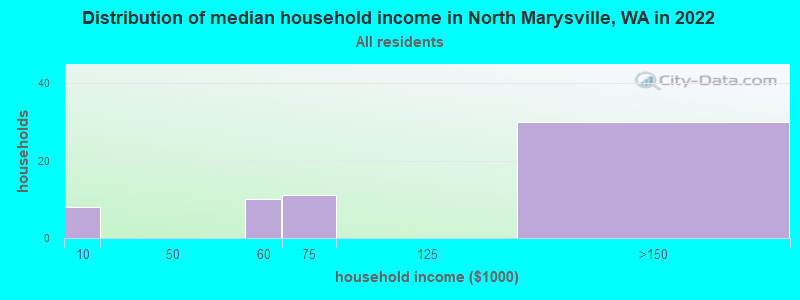
Median household income ($)
Median household income (% change since 2000)
Household income diversity
Ratio of average income to average house value (%)
Ratio of average income to average rent
Median household income ($) - White
Median household income ($) - Black or African American
Median household income ($) - Asian
Median household income ($) - Hispanic or Latino
Median household income ($) - American Indian and Alaska Native
Median household income ($) - Multirace
Median household income ($) - Other Race
Median household income for houses/condos with a mortgage ($)
Median household income for apartments without a mortgage ($)
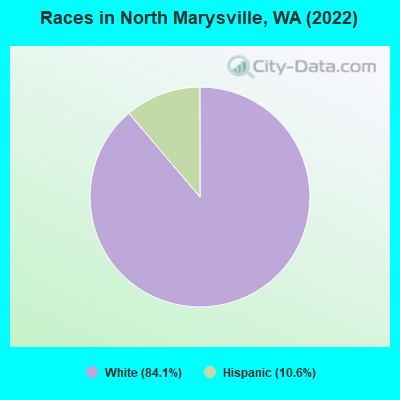
Races - White alone (%)
Races - White alone (% change since 2000)
Races - Black alone (%)
Races - Black alone (% change since 2000)
Races - American Indian alone (%)
Races - American Indian alone (% change since 2000)
Races - Asian alone (%)
Races - Asian alone (% change since 2000)
Races - Hispanic (%)
Races - Hispanic (% change since 2000)
Races - Native Hawaiian and Other Pacific Islander alone (%)
Races - Native Hawaiian and Other Pacific Islander alone (% change since 2000)
Races - Two or more races (%)
Races - Two or more races (% change since 2000)
Races - Other race alone (%)
Races - Other race alone (% change since 2000)
Racial diversity
Unemployment (%)
Unemployment (% change since 2000)
Unemployment (%) - White
Unemployment (%) - Black or African American
Unemployment (%) - Asian
Unemployment (%) - Hispanic or Latino
Unemployment (%) - American Indian and Alaska Native
Unemployment (%) - Multirace
Unemployment (%) - Other Race
Population density (people per square mile)
Population - Males (%)
Population - Females (%)
Population - Males (%) - White
Population - Males (%) - Black or African American
Population - Males (%) - Asian
Population - Males (%) - Hispanic or Latino
Population - Males (%) - American Indian and Alaska Native
Population - Males (%) - Multirace
Population - Males (%) - Other Race
Population - Females (%) - White
Population - Females (%) - Black or African American
Population - Females (%) - Asian
Population - Females (%) - Hispanic or Latino
Population - Females (%) - American Indian and Alaska Native
Population - Females (%) - Multirace
Population - Females (%) - Other Race
Coronavirus confirmed cases (Apr 28, 2024)
Deaths caused by coronavirus (Apr 28, 2024)
Coronavirus confirmed cases (per 100k population) (Apr 28, 2024)
Deaths caused by coronavirus (per 100k population) (Apr 28, 2024)
Daily increase in number of cases (Apr 28, 2024)
Weekly increase in number of cases (Apr 28, 2024)
Cases doubled (in days) (Apr 28, 2024)
Hospitalized patients (Apr 18, 2022)
Negative test results (Apr 18, 2022)
Total test results (Apr 18, 2022)
COVID Vaccine doses distributed (per 100k population) (Sep 19, 2023)
COVID Vaccine doses administered (per 100k population) (Sep 19, 2023)
COVID Vaccine doses distributed (Sep 19, 2023)
COVID Vaccine doses administered (Sep 19, 2023)
Likely homosexual households (%)
Likely homosexual households (% change since 2000)
Likely homosexual households - Lesbian couples (%)
Likely homosexual households - Lesbian couples (% change since 2000)
Likely homosexual households - Gay men (%)
Likely homosexual households - Gay men (% change since 2000)
Cost of living index
Median gross rent ($)
Median contract rent ($)
Median monthly housing costs ($)
Median house or condo value ($)
Median house or condo value ($ change since 2000)
Mean house or condo value by units in structure - 1, detached ($)
Mean house or condo value by units in structure - 1, attached ($)
Mean house or condo value by units in structure - 2 ($)
Mean house or condo value by units in structure by units in structure - 3 or 4 ($)
Mean house or condo value by units in structure - 5 or more ($)
Mean house or condo value by units in structure - Boat, RV, van, etc. ($)
Mean house or condo value by units in structure - Mobile home ($)
Median house or condo value ($) - White
Median house or condo value ($) - Black or African American
Median house or condo value ($) - Asian
Median house or condo value ($) - Hispanic or Latino
Median house or condo value ($) - American Indian and Alaska Native
Median house or condo value ($) - Multirace
Median house or condo value ($) - Other Race
Median resident age
Resident age diversity
Median resident age - Males
Median resident age - Females
Median resident age - White
Median resident age - Black or African American
Median resident age - Asian
Median resident age - Hispanic or Latino
Median resident age - American Indian and Alaska Native
Median resident age - Multirace
Median resident age - Other Race
Median resident age - Males - White
Median resident age - Males - Black or African American
Median resident age - Males - Asian
Median resident age - Males - Hispanic or Latino
Median resident age - Males - American Indian and Alaska Native
Median resident age - Males - Multirace
Median resident age - Males - Other Race
Median resident age - Females - White
Median resident age - Females - Black or African American
Median resident age - Females - Asian
Median resident age - Females - Hispanic or Latino
Median resident age - Females - American Indian and Alaska Native
Median resident age - Females - Multirace
Median resident age - Females - Other Race
Commute - mean travel time to work (minutes)
Travel time to work - Less than 5 minutes (%)
Travel time to work - Less than 5 minutes (% change since 2000)
Travel time to work - 5 to 9 minutes (%)
Travel time to work - 5 to 9 minutes (% change since 2000)
Travel time to work - 10 to 19 minutes (%)
Travel time to work - 10 to 19 minutes (% change since 2000)
Travel time to work - 20 to 29 minutes (%)
Travel time to work - 20 to 29 minutes (% change since 2000)
Travel time to work - 30 to 39 minutes (%)
Travel time to work - 30 to 39 minutes (% change since 2000)
Travel time to work - 40 to 59 minutes (%)
Travel time to work - 40 to 59 minutes (% change since 2000)
Travel time to work - 60 to 89 minutes (%)
Travel time to work - 60 to 89 minutes (% change since 2000)
Travel time to work - 90 or more minutes (%)
Travel time to work - 90 or more minutes (% change since 2000)
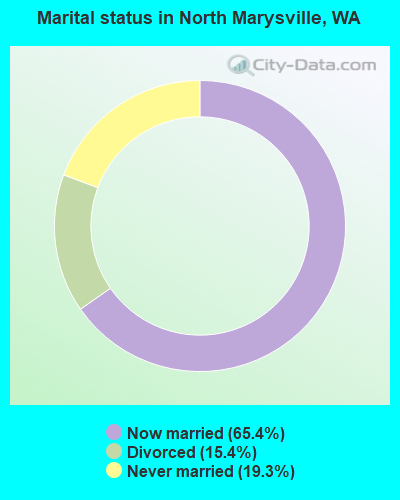
Marital status - Never married (%)
Marital status - Now married (%)
Marital status - Separated (%)
Marital status - Widowed (%)
Marital status - Divorced (%)
Median family income ($)
Median family income (% change since 2000)
Median non-family income ($)
Median non-family income (% change since 2000)
Median per capita income ($)
Median per capita income (% change since 2000)
Median family income ($) - White
Median family income ($) - Black or African American
Median family income ($) - Asian
Median family income ($) - Hispanic or Latino
Median family income ($) - American Indian and Alaska Native
Median family income ($) - Multirace
Median family income ($) - Other Race
Median year house/condo built
Median year apartment built
Year house built - Built 2005 or later (%)
Year house built - Built 2000 to 2004 (%)
Year house built - Built 1990 to 1999 (%)
Year house built - Built 1980 to 1989 (%)
Year house built - Built 1970 to 1979 (%)
Year house built - Built 1960 to 1969 (%)
Year house built - Built 1950 to 1959 (%)
Year house built - Built 1940 to 1949 (%)
Year house built - Built 1939 or earlier (%)
Average household size
Household density (households per square mile)
Average household size - White
Average household size - Black or African American
Average household size - Asian
Average household size - Hispanic or Latino
Average household size - American Indian and Alaska Native
Average household size - Multirace
Average household size - Other Race
Occupied housing units (%)
Vacant housing units (%)
Owner occupied housing units (%)
Renter occupied housing units (%)
Vacancy status - For rent (%)
Vacancy status - For sale only (%)
Vacancy status - Rented or sold, not occupied (%)
Vacancy status - For seasonal, recreational, or occasional use (%)
Vacancy status - For migrant workers (%)
Vacancy status - Other vacant (%)
Residents with income below the poverty level (%)
Residents with income below 50% of the poverty level (%)
Children below poverty level (%)
Poor families by family type - Married-couple family (%)
Poor families by family type - Male, no wife present (%)
Poor families by family type - Female, no husband present (%)
Poverty status for native-born residents (%)
Poverty status for foreign-born residents (%)
Poverty among high school graduates not in families (%)
Poverty among people who did not graduate high school not in families (%)
Residents with income below the poverty level (%) - White
Residents with income below the poverty level (%) - Black or African American
Residents with income below the poverty level (%) - Asian
Residents with income below the poverty level (%) - Hispanic or Latino
Residents with income below the poverty level (%) - American Indian and Alaska Native
Residents with income below the poverty level (%) - Multirace
Residents with income below the poverty level (%) - Other Race
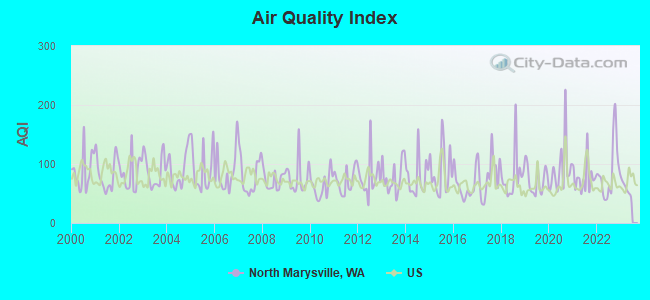
Air pollution - Air Quality Index (AQI)
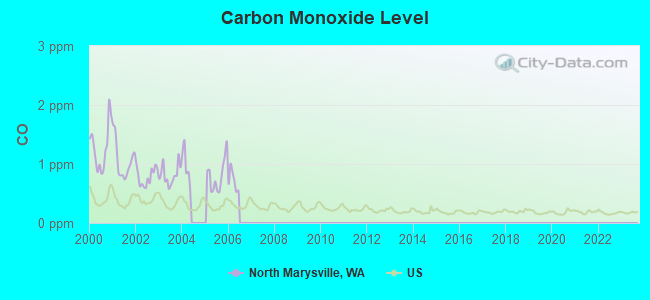
Air pollution - CO
Air pollution - NO2
Air pollution - SO2
Air pollution - Ozone
Air pollution - PM10
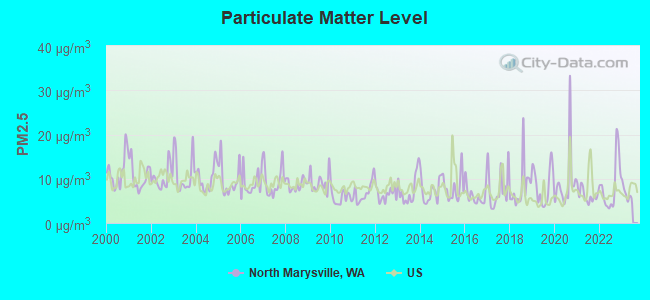
Air pollution - PM25
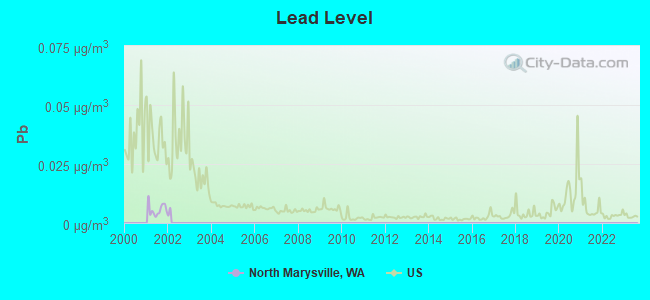
Air pollution - Pb
Crime - Murders per 100,000 population
Crime - Rapes per 100,000 population
Crime - Robberies per 100,000 population
Crime - Assaults per 100,000 population
Crime - Burglaries per 100,000 population
Crime - Thefts per 100,000 population
Crime - Auto thefts per 100,000 population
Crime - Arson per 100,000 population
Crime - City-data.com crime index
Crime - Violent crime index
Crime - Property crime index
Crime - Murders per 100,000 population (5 year average)
Crime - Rapes per 100,000 population (5 year average)
Crime - Robberies per 100,000 population (5 year average)
Crime - Assaults per 100,000 population (5 year average)
Crime - Burglaries per 100,000 population (5 year average)
Crime - Thefts per 100,000 population (5 year average)
Crime - Auto thefts per 100,000 population (5 year average)
Crime - Arson per 100,000 population (5 year average)
Crime - City-data.com crime index (5 year average)
Crime - Violent crime index (5 year average)
Crime - Property crime index (5 year average)
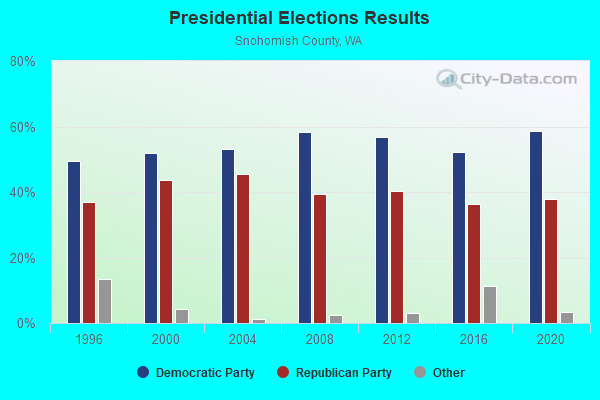
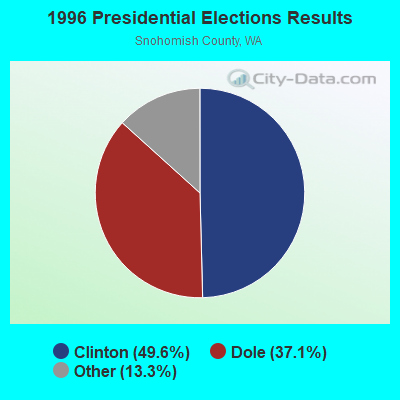
1996 Presidential Elections Results (%) - Democratic Party (Clinton)
1996 Presidential Elections Results (%) - Republican Party (Dole)
1996 Presidential Elections Results (%) - Other
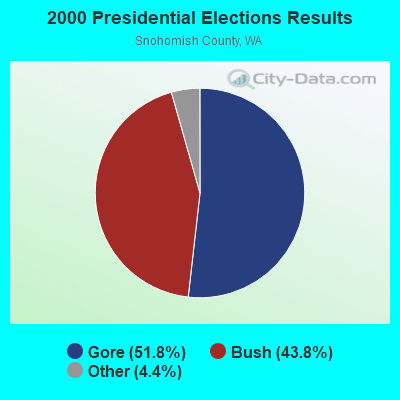
2000 Presidential Elections Results (%) - Democratic Party (Gore)
2000 Presidential Elections Results (%) - Republican Party (Bush)
2000 Presidential Elections Results (%) - Other
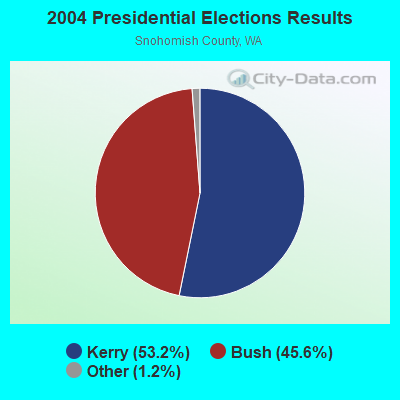
2004 Presidential Elections Results (%) - Democratic Party (Kerry)
2004 Presidential Elections Results (%) - Republican Party (Bush)
2004 Presidential Elections Results (%) - Other
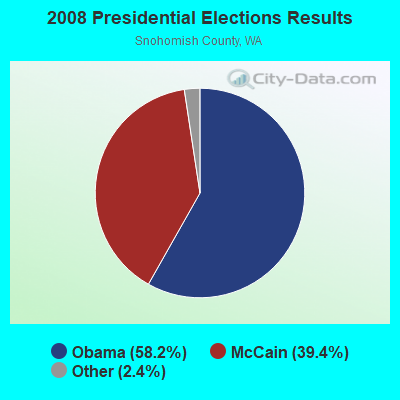
2008 Presidential Elections Results (%) - Democratic Party (Obama)
2008 Presidential Elections Results (%) - Republican Party (McCain)
2008 Presidential Elections Results (%) - Other
2012 Presidential Elections Results (%) - Democratic Party (Obama)
2012 Presidential Elections Results (%) - Republican Party (Romney)
2012 Presidential Elections Results (%) - Other
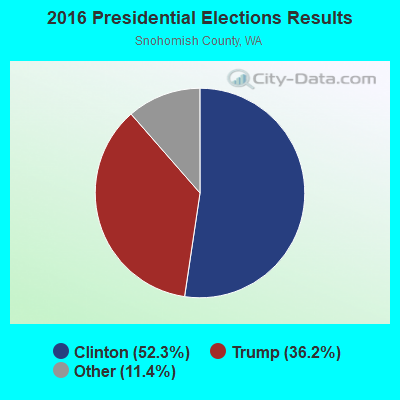
2016 Presidential Elections Results (%) - Democratic Party (Clinton)
2016 Presidential Elections Results (%) - Republican Party (Trump)
2016 Presidential Elections Results (%) - Other
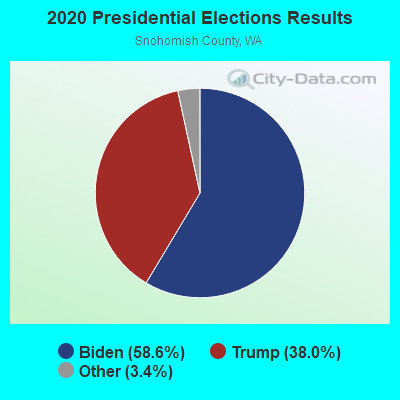
2020 Presidential Elections Results (%) - Democratic Party (Biden)
2020 Presidential Elections Results (%) - Republican Party (Trump)
2020 Presidential Elections Results (%) - Other
Ancestries Reported - Arab (%)
Ancestries Reported - Czech (%)
Ancestries Reported - Danish (%)
Ancestries Reported - Dutch (%)
Ancestries Reported - English (%)
Ancestries Reported - French (%)
Ancestries Reported - French Canadian (%)
Ancestries Reported - German (%)
Ancestries Reported - Greek (%)
Ancestries Reported - Hungarian (%)
Ancestries Reported - Irish (%)
Ancestries Reported - Italian (%)
Ancestries Reported - Lithuanian (%)
Ancestries Reported - Norwegian (%)
Ancestries Reported - Polish (%)
Ancestries Reported - Portuguese (%)
Ancestries Reported - Russian (%)
Ancestries Reported - Scotch-Irish (%)
Ancestries Reported - Scottish (%)
Ancestries Reported - Slovak (%)
Ancestries Reported - Subsaharan African (%)
Ancestries Reported - Swedish (%)
Ancestries Reported - Swiss (%)
Ancestries Reported - Ukrainian (%)
Ancestries Reported - United States (%)
Ancestries Reported - Welsh (%)
Ancestries Reported - West Indian (%)
Ancestries Reported - Other (%)
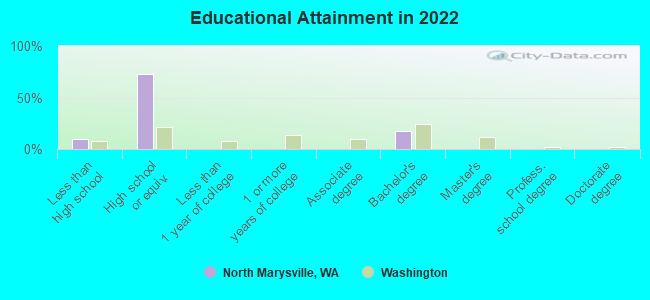
Educational Attainment - No schooling completed (%)
Educational Attainment - Less than high school (%)
Educational Attainment - High school or equivalent (%)
Educational Attainment - Less than 1 year of college (%)
Educational Attainment - 1 or more years of college (%)
Educational Attainment - Associate degree (%)
Educational Attainment - Bachelor's degree (%)
Educational Attainment - Master's degree (%)
Educational Attainment - Professional school degree (%)
Educational Attainment - Doctorate degree (%)
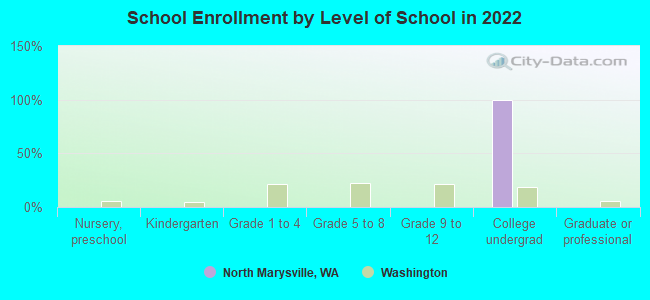
School Enrollment - Nursery, preschool (%)
School Enrollment - Kindergarten (%)
School Enrollment - Grade 1 to 4 (%)
School Enrollment - Grade 5 to 8 (%)
School Enrollment - Grade 9 to 12 (%)
School Enrollment - College undergrad (%)
School Enrollment - Graduate or professional (%)
School Enrollment - Not enrolled in school (%)
School enrollment - Public schools (%)
School enrollment - Private schools (%)
School enrollment - Not enrolled (%)
Median number of rooms in houses and condos
Median number of rooms in apartments
Housing units lacking complete plumbing facilities (%)
Housing units lacking complete kitchen facilities (%)
Density of houses
Urban houses (%)
Rural houses (%)
Households with people 60 years and over (%)
Households with people 65 years and over (%)
Households with people 75 years and over (%)
Households with one or more nonrelatives (%)
Households with no nonrelatives (%)
Population in households (%)
Family households (%)
Nonfamily households (%)
Population in families (%)
Family households with own children (%)
Median number of bedrooms in owner occupied houses
Mean number of bedrooms in owner occupied houses
Median number of bedrooms in renter occupied houses
Mean number of bedrooms in renter occupied houses
Median number of vehichles in owner occupied houses
Mean number of vehichles in owner occupied houses
Median number of vehichles in renter occupied houses
Mean number of vehichles in renter occupied houses
Mortgage status - with mortgage (%)
Mortgage status - with second mortgage (%)
Mortgage status - with home equity loan (%)
Mortgage status - with both second mortgage and home equity loan (%)
Mortgage status - without a mortgage (%)
Average family size
Average family size - White
Average family size - Black or African American
Average family size - Asian
Average family size - Hispanic or Latino
Average family size - American Indian and Alaska Native
Average family size - Multirace
Average family size - Other Race
Geographical mobility - Same house 1 year ago (%)
Geographical mobility - Moved within same county (%)
Geographical mobility - Moved from different county within same state (%)
Geographical mobility - Moved from different state (%)
Geographical mobility - Moved from abroad (%)
Place of birth - Born in state of residence (%)
Place of birth - Born in other state (%)
Place of birth - Native, outside of US (%)
Place of birth - Foreign born (%)
Housing units in structures - 1, detached (%)
Housing units in structures - 1, attached (%)
Housing units in structures - 2 (%)
Housing units in structures - 3 or 4 (%)
Housing units in structures - 5 to 9 (%)
Housing units in structures - 10 to 19 (%)
Housing units in structures - 20 to 49 (%)
Housing units in structures - 50 or more (%)
Housing units in structures - Mobile home (%)
Housing units in structures - Boat, RV, van, etc. (%)
House/condo owner moved in on average (years ago)
Renter moved in on average (years ago)
Year householder moved into unit - Moved in 1999 to March 2000 (%)
Year householder moved into unit - Moved in 1995 to 1998 (%)
Year householder moved into unit - Moved in 1990 to 1994 (%)
Year householder moved into unit - Moved in 1980 to 1989 (%)
Year householder moved into unit - Moved in 1970 to 1979 (%)
Year householder moved into unit - Moved in 1969 or earlier (%)
Means of transportation to work - Drove car alone (%)
Means of transportation to work - Carpooled (%)
Means of transportation to work - Public transportation (%)
Means of transportation to work - Bus or trolley bus (%)
Means of transportation to work - Streetcar or trolley car (%)
Means of transportation to work - Subway or elevated (%)
Means of transportation to work - Railroad (%)
Means of transportation to work - Ferryboat (%)
Means of transportation to work - Taxicab (%)
Means of transportation to work - Motorcycle (%)
Means of transportation to work - Bicycle (%)
Means of transportation to work - Walked (%)
Means of transportation to work - Other means (%)
Working at home (%)
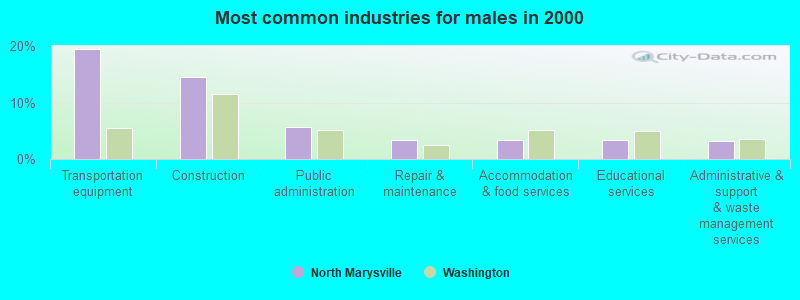
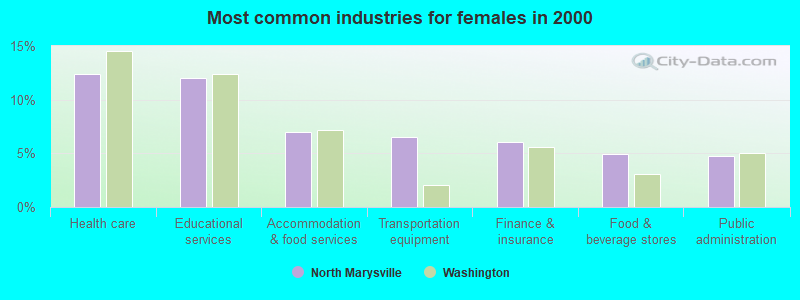
Industry diversity
Most Common Industries - Agriculture, forestry, fishing and hunting, and mining (%)
Most Common Industries - Agriculture, forestry, fishing and hunting (%)
Most Common Industries - Mining, quarrying, and oil and gas extraction (%)
Most Common Industries - Construction (%)
Most Common Industries - Manufacturing (%)
Most Common Industries - Wholesale trade (%)
Most Common Industries - Retail trade (%)
Most Common Industries - Transportation and warehousing, and utilities (%)
Most Common Industries - Transportation and warehousing (%)
Most Common Industries - Utilities (%)
Most Common Industries - Information (%)
Most Common Industries - Finance and insurance, and real estate and rental and leasing (%)
Most Common Industries - Finance and insurance (%)
Most Common Industries - Real estate and rental and leasing (%)
Most Common Industries - Professional, scientific, and management, and administrative and waste management services (%)
Most Common Industries - Professional, scientific, and technical services (%)
Most Common Industries - Management of companies and enterprises (%)
Most Common Industries - Administrative and support and waste management services (%)
Most Common Industries - Educational services, and health care and social assistance (%)
Most Common Industries - Educational services (%)
Most Common Industries - Health care and social assistance (%)
Most Common Industries - Arts, entertainment, and recreation, and accommodation and food services (%)
Most Common Industries - Arts, entertainment, and recreation (%)
Most Common Industries - Accommodation and food services (%)
Most Common Industries - Other services, except public administration (%)
Most Common Industries - Public administration (%)
Occupation diversity
Most Common Occupations - Management, business, science, and arts occupations (%)
Most Common Occupations - Management, business, and financial occupations (%)
Most Common Occupations - Management occupations (%)
Most Common Occupations - Business and financial operations occupations (%)
Most Common Occupations - Computer, engineering, and science occupations (%)
Most Common Occupations - Computer and mathematical occupations (%)
Most Common Occupations - Architecture and engineering occupations (%)
Most Common Occupations - Life, physical, and social science occupations (%)
Most Common Occupations - Education, legal, community service, arts, and media occupations (%)
Most Common Occupations - Community and social service occupations (%)
Most Common Occupations - Legal occupations (%)
Most Common Occupations - Education, training, and library occupations (%)
Most Common Occupations - Arts, design, entertainment, sports, and media occupations (%)
Most Common Occupations - Healthcare practitioners and technical occupations (%)
Most Common Occupations - Health diagnosing and treating practitioners and other technical occupations (%)
Most Common Occupations - Health technologists and technicians (%)
Most Common Occupations - Service occupations (%)
Most Common Occupations - Healthcare support occupations (%)
Most Common Occupations - Protective service occupations (%)
Most Common Occupations - Fire fighting and prevention, and other protective service workers including supervisors (%)
Most Common Occupations - Law enforcement workers including supervisors (%)
Most Common Occupations - Food preparation and serving related occupations (%)
Most Common Occupations - Building and grounds cleaning and maintenance occupations (%)
Most Common Occupations - Personal care and service occupations (%)
Most Common Occupations - Sales and office occupations (%)
Most Common Occupations - Sales and related occupations (%)
Most Common Occupations - Office and administrative support occupations (%)
Most Common Occupations - Natural resources, construction, and maintenance occupations (%)
Most Common Occupations - Farming, fishing, and forestry occupations (%)
Most Common Occupations - Construction and extraction occupations (%)
Most Common Occupations - Installation, maintenance, and repair occupations (%)
Most Common Occupations - Production, transportation, and material moving occupations (%)
Most Common Occupations - Production occupations (%)
Most Common Occupations - Transportation occupations (%)
Most Common Occupations - Material moving occupations (%)
People in Group quarters - Institutionalized population (%)
People in Group quarters - Correctional institutions (%)
People in Group quarters - Federal prisons and detention centers (%)
People in Group quarters - Halfway houses (%)
People in Group quarters - Local jails and other confinement facilities (including police lockups) (%)
People in Group quarters - Military disciplinary barracks (%)
People in Group quarters - State prisons (%)
People in Group quarters - Other types of correctional institutions (%)
People in Group quarters - Nursing homes (%)
People in Group quarters - Hospitals/wards, hospices, and schools for the handicapped (%)
People in Group quarters - Hospitals/wards and hospices for chronically ill (%)
People in Group quarters - Hospices or homes for chronically ill (%)
People in Group quarters - Military hospitals or wards for chronically ill (%)
People in Group quarters - Other hospitals or wards for chronically ill (%)
People in Group quarters - Hospitals or wards for drug/alcohol abuse (%)
People in Group quarters - Mental (Psychiatric) hospitals or wards (%)
People in Group quarters - Schools, hospitals, or wards for the mentally retarded (%)
People in Group quarters - Schools, hospitals, or wards for the physically handicapped (%)
People in Group quarters - Institutions for the deaf (%)
People in Group quarters - Institutions for the blind (%)
People in Group quarters - Orthopedic wards and institutions for the physically handicapped (%)
People in Group quarters - Wards in general hospitals for patients who have no usual home elsewhere (%)
People in Group quarters - Wards in military hospitals for patients who have no usual home elsewhere (%)
People in Group quarters - Juvenile institutions (%)
People in Group quarters - Long-term care (%)
People in Group quarters - Homes for abused, dependent, and neglected children (%)
People in Group quarters - Residential treatment centers for emotionally disturbed children (%)
People in Group quarters - Training schools for juvenile delinquents (%)
People in Group quarters - Short-term care, detention or diagnostic centers for delinquent children (%)
People in Group quarters - Type of juvenile institution unknown (%)
People in Group quarters - Noninstitutionalized population (%)
People in Group quarters - College dormitories (includes college quarters off campus) (%)
People in Group quarters - Military quarters (%)
People in Group quarters - On base (%)
People in Group quarters - Barracks, unaccompanied personnel housing (UPH), (Enlisted/Officer), ;and similar group living quarters for military personnel (%)
People in Group quarters - Transient quarters for temporary residents (%)
People in Group quarters - Military ships (%)
People in Group quarters - Group homes (%)
People in Group quarters - Homes or halfway houses for drug/alcohol abuse (%)
People in Group quarters - Homes for the mentally ill (%)
People in Group quarters - Homes for the mentally retarded (%)
People in Group quarters - Homes for the physically handicapped (%)
People in Group quarters - Other group homes (%)
People in Group quarters - Religious group quarters (%)
People in Group quarters - Dormitories (%)
People in Group quarters - Agriculture workers' dormitories on farms (%)
People in Group quarters - Job Corps and vocational training facilities (%)
People in Group quarters - Other workers' dormitories (%)
People in Group quarters - Crews of maritime vessels (%)
People in Group quarters - Other nonhousehold living situations (%)
People in Group quarters - Other noninstitutional group quarters (%)
Residents speaking English at home (%)
Residents speaking English at home - Born in the United States (%)
Residents speaking English at home - Native, born elsewhere (%)
Residents speaking English at home - Foreign born (%)
Residents speaking Spanish at home (%)
Residents speaking Spanish at home - Born in the United States (%)
Residents speaking Spanish at home - Native, born elsewhere (%)
Residents speaking Spanish at home - Foreign born (%)
Residents speaking other language at home (%)
Residents speaking other language at home - Born in the United States (%)
Residents speaking other language at home - Native, born elsewhere (%)
Residents speaking other language at home - Foreign born (%)
Class of Workers - Employee of private company (%)
Class of Workers - Self-employed in own incorporated business (%)
Class of Workers - Private not-for-profit wage and salary workers (%)
Class of Workers - Local government workers (%)
Class of Workers - State government workers (%)
Class of Workers - Federal government workers (%)
Class of Workers - Self-employed workers in own not incorporated business and Unpaid family workers (%)
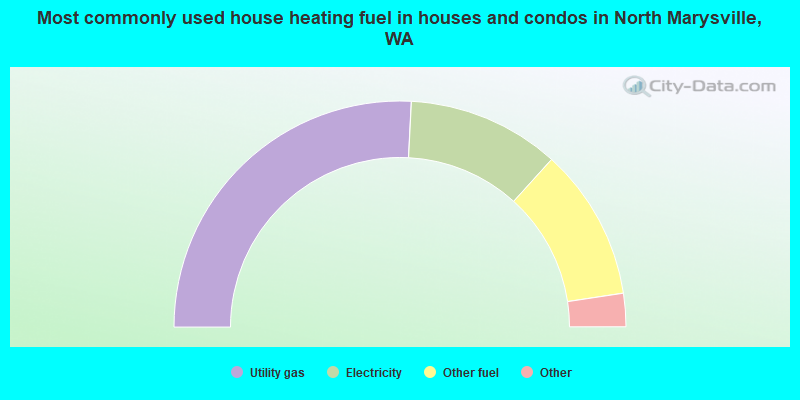
House heating fuel used in houses and condos - Utility gas (%)
House heating fuel used in houses and condos - Bottled, tank, or LP gas (%)
House heating fuel used in houses and condos - Electricity (%)
House heating fuel used in houses and condos - Fuel oil, kerosene, etc. (%)
House heating fuel used in houses and condos - Coal or coke (%)
House heating fuel used in houses and condos - Wood (%)
House heating fuel used in houses and condos - Solar energy (%)
House heating fuel used in houses and condos - Other fuel (%)
House heating fuel used in houses and condos - No fuel used (%)
House heating fuel used in apartments - Utility gas (%)
House heating fuel used in apartments - Bottled, tank, or LP gas (%)
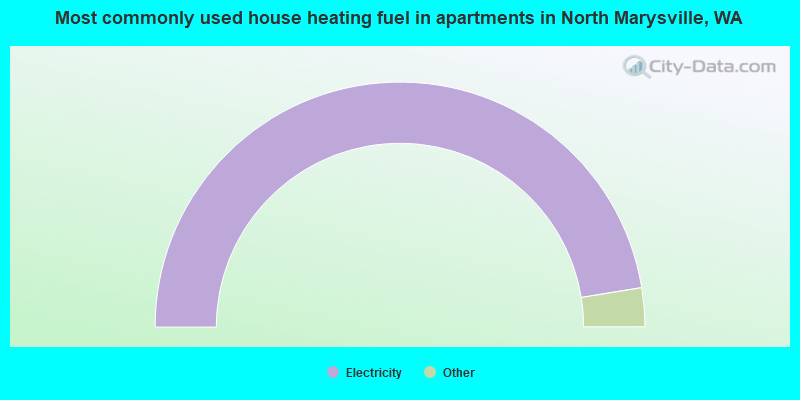
House heating fuel used in apartments - Electricity (%)
House heating fuel used in apartments - Fuel oil, kerosene, etc. (%)
House heating fuel used in apartments - Coal or coke (%)
House heating fuel used in apartments - Wood (%)
House heating fuel used in apartments - Solar energy (%)
House heating fuel used in apartments - Other fuel (%)
House heating fuel used in apartments - No fuel used (%)
Armed forces status - In Armed Forces (%)
Armed forces status - Civilian (%)
Armed forces status - Civilian - Veteran (%)
Armed forces status - Civilian - Nonveteran (%)
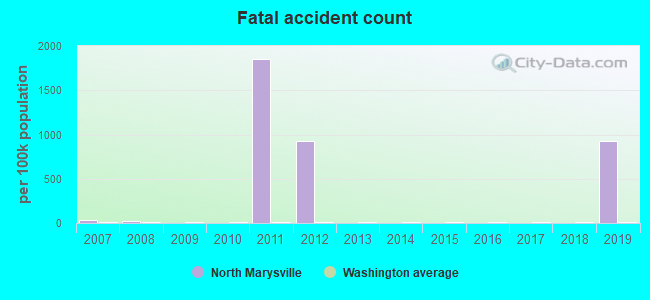
Fatal accidents locations in years 2005-2021
Fatal accidents locations in 2005
Fatal accidents locations in 2006
Fatal accidents locations in 2007
Fatal accidents locations in 2008
Fatal accidents locations in 2009
Fatal accidents locations in 2010
Fatal accidents locations in 2011
Fatal accidents locations in 2012
Fatal accidents locations in 2013
Fatal accidents locations in 2014
Fatal accidents locations in 2015
Fatal accidents locations in 2016
Fatal accidents locations in 2017
Fatal accidents locations in 2018
Fatal accidents locations in 2019
Fatal accidents locations in 2020
Fatal accidents locations in 2021
Alcohol use - People drinking some alcohol every month (%)
Alcohol use - People not drinking at all (%)
Alcohol use - Average days/month drinking alcohol
Alcohol use - Average drinks/week
Alcohol use - Average days/year people drink much
Audiometry - Average condition of hearing (%)
Audiometry - People that can hear a whisper from across a quiet room (%)
Audiometry - People that can hear normal voice from across a quiet room (%)
Audiometry - Ears ringing, roaring, buzzing (%)
Audiometry - Had a job exposure to loud noise (%)
Audiometry - Had off-work exposure to loud noise (%)
Blood Pressure & Cholesterol - Has high blood pressure (%)
Blood Pressure & Cholesterol - Checking blood pressure at home (%)
Blood Pressure & Cholesterol - Frequently checking blood cholesterol (%)
Blood Pressure & Cholesterol - Has high cholesterol level (%)
Consumer Behavior - Money monthly spent on food at supermarket/grocery store
Consumer Behavior - Money monthly spent on food at other stores
Consumer Behavior - Money monthly spent on eating out
Consumer Behavior - Money monthly spent on carryout/delivered foods
Consumer Behavior - Income spent on food at supermarket/grocery store (%)
Consumer Behavior - Income spent on food at other stores (%)
Consumer Behavior - Income spent on eating out (%)
Consumer Behavior - Income spent on carryout/delivered foods (%)
Current Health Status - General health condition (%)
Current Health Status - Blood donors (%)
Current Health Status - Has blood ever tested for HIV virus (%)
Current Health Status - Left-handed people (%)
Dermatology - People using sunscreen (%)
Diabetes - Diabetics (%)
Diabetes - Had a blood test for high blood sugar (%)
Diabetes - People taking insulin (%)
Diet Behavior & Nutrition - Diet health (%)
Diet Behavior & Nutrition - Milk product consumption (# of products/month)
Diet Behavior & Nutrition - Meals not home prepared (#/week)
Diet Behavior & Nutrition - Meals from fast food or pizza place (#/week)
Diet Behavior & Nutrition - Ready-to-eat foods (#/month)
Diet Behavior & Nutrition - Frozen meals/pizza (#/month)
Drug Use - People that ever used marijuana or hashish (%)
Drug Use - Ever used hard drugs (%)
Drug Use - Ever used any form of cocaine (%)
Drug Use - Ever used heroin (%)
Drug Use - Ever used methamphetamine (%)
Health Insurance - People covered by health insurance (%)
Kidney Conditions-Urology - Avg. # of times urinating at night
Medical Conditions - People with asthma (%)
Medical Conditions - People with anemia (%)
Medical Conditions - People with psoriasis (%)
Medical Conditions - People with overweight (%)
Medical Conditions - Elderly people having difficulties in thinking or remembering (%)
Medical Conditions - People who ever received blood transfusion (%)
Medical Conditions - People having trouble seeing even with glass/contacts (%)
Medical Conditions - People with arthritis (%)
Medical Conditions - People with gout (%)
Medical Conditions - People with congestive heart failure (%)
Medical Conditions - People with coronary heart disease (%)
Medical Conditions - People with angina pectoris (%)
Medical Conditions - People who ever had heart attack (%)
Medical Conditions - People who ever had stroke (%)
Medical Conditions - People with emphysema (%)
Medical Conditions - People with thyroid problem (%)
Medical Conditions - People with chronic bronchitis (%)
Medical Conditions - People with any liver condition (%)
Medical Conditions - People who ever had cancer or malignancy (%)
Mental Health - People who have little interest in doing things (%)
Mental Health - People feeling down, depressed, or hopeless (%)
Mental Health - People who have trouble sleeping or sleeping too much (%)
Mental Health - People feeling tired or having little energy (%)
Mental Health - People with poor appetite or overeating (%)
Mental Health - People feeling bad about themself (%)
Mental Health - People who have trouble concentrating on things (%)
Mental Health - People moving or speaking slowly or too fast (%)
Mental Health - People having thoughts they would be better off dead (%)
Oral Health - Average years since last visit a dentist
Oral Health - People embarrassed because of mouth (%)
Oral Health - People with gum disease (%)
Oral Health - General health of teeth and gums (%)
Oral Health - Average days a week using dental floss/device
Oral Health - Average days a week using mouthwash for dental problem
Oral Health - Average number of teeth
Pesticide Use - Households using pesticides to control insects (%)
Pesticide Use - Households using pesticides to kill weeds (%)
Physical Activity - People doing vigorous-intensity work activities (%)
Physical Activity - People doing moderate-intensity work activities (%)
Physical Activity - People walking or bicycling (%)
Physical Activity - People doing vigorous-intensity recreational activities (%)
Physical Activity - People doing moderate-intensity recreational activities (%)
Physical Activity - Average hours a day doing sedentary activities
Physical Activity - Average hours a day watching TV or videos
Physical Activity - Average hours a day using computer
Physical Functioning - People having limitations keeping them from working (%)
Physical Functioning - People limited in amount of work they can do (%)
Physical Functioning - People that need special equipment to walk (%)
Physical Functioning - People experiencing confusion/memory problems (%)
Physical Functioning - People requiring special healthcare equipment (%)
Prescription Medications - Average number of prescription medicines taking
Preventive Aspirin Use - Adults 40+ taking low-dose aspirin (%)
Reproductive Health - Vaginal deliveries (%)
Reproductive Health - Cesarean deliveries (%)
Reproductive Health - Deliveries resulted in a live birth (%)
Reproductive Health - Pregnancies resulted in a delivery (%)
Reproductive Health - Women breastfeeding newborns (%)
Reproductive Health - Women that had a hysterectomy (%)
Reproductive Health - Women that had both ovaries removed (%)
Reproductive Health - Women that have ever taken birth control pills (%)
Reproductive Health - Women taking birth control pills (%)
Reproductive Health - Women that have ever used Depo-Provera or injectables (%)
Reproductive Health - Women that have ever used female hormones (%)
Sexual Behavior - People 18+ that ever had sex (vaginal, anal, or oral) (%)
Sexual Behavior - Males 18+ that ever had vaginal sex with a woman (%)
Sexual Behavior - Males 18+ that ever performed oral sex on a woman (%)
Sexual Behavior - Males 18+ that ever had anal sex with a woman (%)
Sexual Behavior - Males 18+ that ever had any sex with a man (%)
Sexual Behavior - Females 18+ that ever had vaginal sex with a man (%)
Sexual Behavior - Females 18+ that ever performed oral sex on a man (%)
Sexual Behavior - Females 18+ that ever had anal sex with a man (%)
Sexual Behavior - Females 18+ that ever had any kind of sex with a woman (%)
Sexual Behavior - Average age people first had sex
Sexual Behavior - Average number of female sex partners in lifetime (males 18+)
Sexual Behavior - Average number of female vaginal sex partners in lifetime (males 18+)
Sexual Behavior - Average age people first performed oral sex on a woman (18+)
Sexual Behavior - Average number of woman performed oral sex on in lifetime (18+)
Sexual Behavior - Average number of male sex partners in lifetime (males 18+)
Sexual Behavior - Average number of male anal sex partners in lifetime (males 18+)
Sexual Behavior - Average age people first performed oral sex on a man (18+)
Sexual Behavior - Average number of male oral sex partners in lifetime (18+)
Sexual Behavior - People using protection when performing oral sex (%)
Sexual Behavior - Average number of times people have vaginal or anal sex a year
Sexual Behavior - People having sex without condom (%)
Sexual Behavior - Average number of male sex partners in lifetime (females 18+)
Sexual Behavior - Average number of male vaginal sex partners in lifetime (females 18+)
Sexual Behavior - Average number of female sex partners in lifetime (females 18+)
Sexual Behavior - Circumcised males 18+ (%)
Sleep Disorders - Average hours sleeping at night
Sleep Disorders - People that has trouble sleeping (%)
Smoking-Cigarette Use - People smoking cigarettes (%)
Taste & Smell - People 40+ having problems with smell (%)
Taste & Smell - People 40+ having problems with taste (%)
Taste & Smell - People 40+ that ever had wisdom teeth removed (%)
Taste & Smell - People 40+ that ever had tonsils teeth removed (%)
Taste & Smell - People 40+ that ever had a loss of consciousness because of a head injury (%)
Taste & Smell - People 40+ that ever had a broken nose or other serious injury to face or skull (%)
Taste & Smell - People 40+ that ever had two or more sinus infections (%)
Weight - Average height (inches)
Weight - Average weight (pounds)
Weight - Average BMI
Weight - People that are obese (%)
Weight - People that ever were obese (%)
Weight - People trying to lose weight (%)
Latest news from North Marysville, WA collected exclusively by city-data.com from local newspapers, TV, and radio stations
Ancestries: Dutch (74.0%), American (26.0%).
Current Local Time:
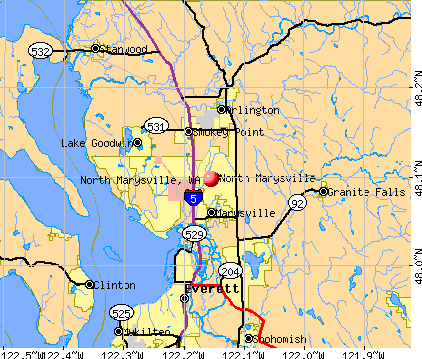
Land area: 13.7 square miles.
Population density: 7.9 people per square mile (very low).
11 residents are foreign born (7.2% Europe ).
This place:
7.2%Washington:
100.0%
Median real estate property taxes paid for housing units in 2000: North Marysville CDP:
1.1% ($1,759)Washington:
1.2% ($1,915)
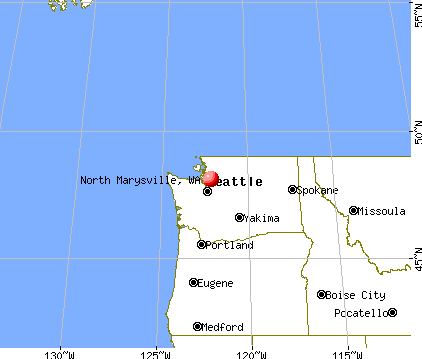
Nearest city with pop. 50,000+: Everett, WA
Nearest city with pop. 200,000+: East Seattle, WA (33.2 miles
Nearest city with pop. 1,000,000+: Los Angeles, CA
Nearest cities:
Latitude: 48.10 N, Longitude: 122.16 W
Daytime population change due to commuting: -110 (-72.5%)Workers who live and work in this place: 19 (17.3%)
Area code commonly used in this area: 360
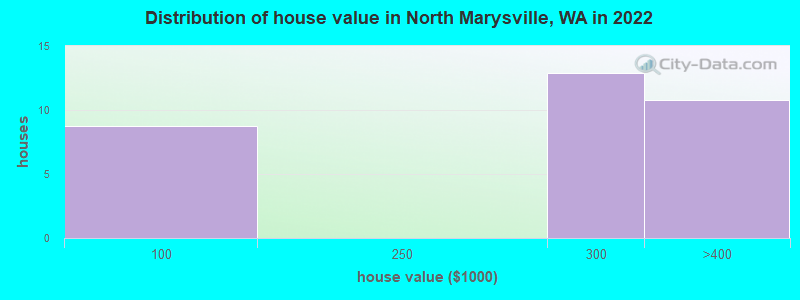
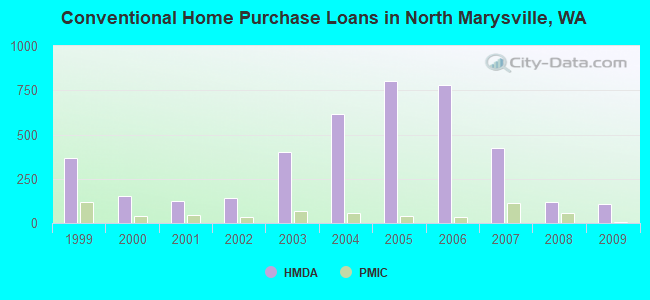
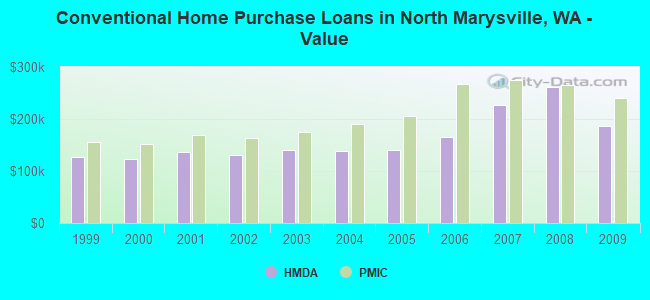
Property values in North Marysville, WA
Unemployment in December 2023:
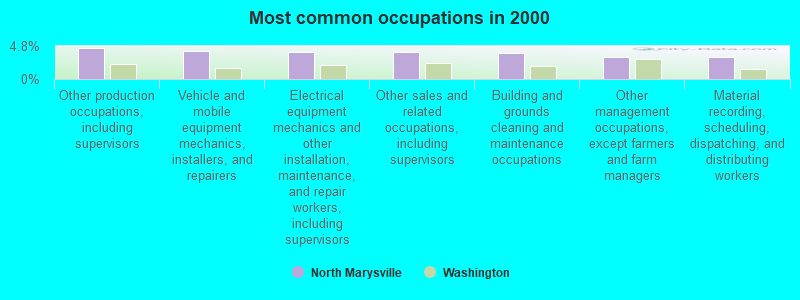
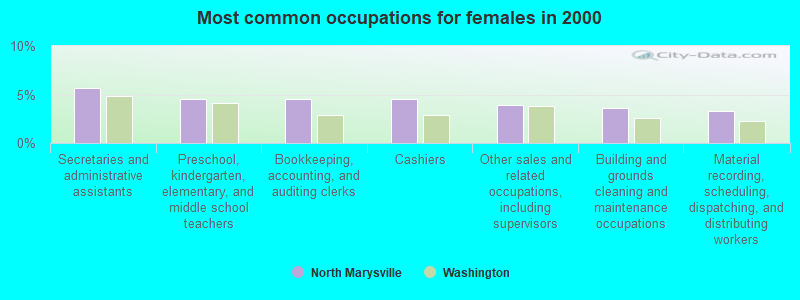
Most common occupations in North Marysville, WA (%)
Both Males Females
Other production occupations, including supervisors (4.4%)
Vehicle and mobile equipment mechanics, installers, and repairers (4.1%)
Electrical equipment mechanics and other installation, maintenance, and repair workers, including supervisors (3.9%)
Other sales and related occupations, including supervisors (3.9%)
Building and grounds cleaning and maintenance occupations (3.8%)
Other management occupations, except farmers and farm managers (3.2%)
Material recording, scheduling, dispatching, and distributing workers (3.2%)
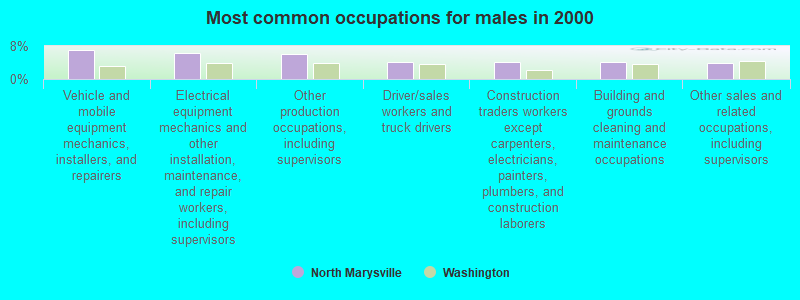
Vehicle and mobile equipment mechanics, installers, and repairers (6.9%)
Electrical equipment mechanics and other installation, maintenance, and repair workers, including supervisors (6.2%)
Other production occupations, including supervisors (6.1%)
Driver/sales workers and truck drivers (4.1%)
Construction traders workers except carpenters, electricians, painters, plumbers, and construction laborers (4.1%)
Building and grounds cleaning and maintenance occupations (4.1%)
Other sales and related occupations, including supervisors (3.9%)
Secretaries and administrative assistants (5.7%)
Preschool, kindergarten, elementary, and middle school teachers (4.6%)
Bookkeeping, accounting, and auditing clerks (4.5%)
Cashiers (4.5%)
Other sales and related occupations, including supervisors (3.9%)
Building and grounds cleaning and maintenance occupations (3.6%)
Material recording, scheduling, dispatching, and distributing workers (3.3%)
Air pollution and air quality trends(lower is better)
AQI CO PM2.5 Pb
Earthquake activity:
North Marysville-area historical earthquake activity is significantly above Washington state average. It is 1180% greater than the overall U.S. average. On 4/13/1949 at 19:55:42, a magnitude 7.0 (7.0 UK, Class: Major, Intensity: VIII - XII) earthquake occurred 60.7 miles away from the city center, causing $80,000,000 total damage On 2/28/2001 at 18:54:32, a magnitude 6.8 (6.8 MD, Depth: 32.2 mi, Class: Strong, Intensity: VII - IX) earthquake occurred 70.8 miles away from the city center On 2/28/2001 at 18:54:32, a magnitude 6.8 (6.5 MB, 6.6 MS, 6.8 MW) earthquake occurred 72.4 miles away from the city center, causing $2,000,000,000 total damage and $305,000,000 insured lossesOn 4/29/1965 at 15:28:43, a magnitude 6.6 (6.6 UK) earthquake occurred 54.6 miles away from the city center, causing $28,000,000 total damage On 7/3/1999 at 01:43:54, a magnitude 5.8 (5.4 MB, 5.5 MS, 5.8 MW, 5.3 ME, Depth: 25.2 mi, Class: Moderate, Intensity: VI - VII) earthquake occurred 87.6 miles away from the city center On 5/3/1996 at 04:04:22, a magnitude 5.5 (5.2 MB, 5.3 MD, 5.5 ML, Depth: 2.5 mi) earthquake occurred 26.2 miles away from North Marysville center Magnitude types: body-wave magnitude (MB), duration magnitude (MD), energy magnitude (ME), local magnitude (ML), surface-wave magnitude (MS), moment magnitude (MW) Natural disasters: The number of natural disasters in Snohomish County (31) is a lot greater than the US average (15).Major Disasters (Presidential) Declared: 27Emergencies Declared: 2Floods: 21, Storms: 17, Mudslides: 14, Landslides: 10, Winter Storms: 6, Winds: 5, Earthquakes: 2, Heavy Rain: 1, Hurricane: 1, Snow: 1, Tornado: 1, Volcanic Eruption: 1, Other: 1 (Note: some incidents may be assigned to more than one category). Hospitals and medical centers near North Marysville: HAVENWOOD CARE CENTER (Nursing Home, about 4 miles away; MARYSVILLE, WA)
MARYSVILLE CARE CENTER (Nursing Home, about 4 miles away; MARYSVILLE, WA)
LIFE CARE AT HOME OF WA (Home Health Center, about 4 miles away; MARYSVILLE, WA)
MADELEINE VILLA HEALTH CARE C (Nursing Home, about 4 miles away; MARYSVILLE, WA)
PUGET SOUND KIDNEY CENTER SMOKEY POINT (Dialysis Facility, about 6 miles away; ARLINGTON, WA)
REGENCY CARE CENTER AT ARLINGTON (Nursing Home, about 7 miles away; ARLINGTON, WA)
CASCADE VALLEY HOSPITAL (about 7 miles away; ARLINGTON, WA)
Amtrak stations near North Marysville: 9 miles: EVERETT (2900 BOND ST.) Services: ticket office, partially wheelchair accessible, enclosed waiting area, public payphones, free short-term parking, free long-term parking, call for car rental service, taxi stand, public transit connection.
19 miles: MONROE (RED BARN UNOCAL) - Bus Station Colleges/universities with over 2000 students nearest to North Marysville:
Everett Community College (about 7 miles; Everett, WA ; Full-time enrollment: 5,818)
Edmonds Community College (about 21 miles; Lynnwood, WA ; FT enrollment: 7,271)
University of Washington-Bothell Campus (about 24 miles; Bothell, WA ; FT enrollment: 3,902)
Cascadia Community College (about 24 miles; Bothell, WA ; FT enrollment: 2,238)
Skagit Valley College (about 25 miles; Mount Vernon, WA ; FT enrollment: 3,803)
Shoreline Community College (about 26 miles; Shoreline, WA ; FT enrollment: 5,026)
Lake Washington Institute of Technology (about 28 miles; Kirkland, WA ; FT enrollment: 2,947)
Notable locations in North Marysville: (A) , Neff Farms (B) , Kellogg Marsh Grange (C) , Marysville Fire District / Snohomish County Fire District 12 Station 62 (D) . Display/hide their locations on the map
Churches in North Marysville include: (A) , The Church of Jesus Christ of Latter Day Saints (B) , Allen Creek Baptist Church (C) , Cascade Christian Reformed Church (D) , Marysville Seventh Day Adventist Church (E) , Atonement Free Lutheran Church (F) , Mountain View Presbyterian Church (G) , Word of Life Lutheran Brethren Church (H) . Display/hide their locations on the map
Reservoir: (A) . Display/hide its location on the map
Creeks: (A) , Little Coho Creek (B) , Hayho Creek (C) , Westphal Creek (D) . Display/hide their locations on the map
Snohomish County has a predicted average indoor radon screening level less than 2 pCi/L (pico curies per liter) - Low Potential Average household size: This place:
2.8 peopleWashington:
2.5 people
Percentage of family households: This place:
65.8%Whole state:
64.4%
Percentage of households with unmarried partners: This place:
21.1%Whole state:
7.7%
No gay or lesbian households reported
People in group quarters in North Marysville in 2000:
10 people in homes for the physically handicapped
9 people in other group homes
2 people in homes for the mentally retarded
For population 15 years and over in North Marysville:
Never married: 19.3%Now married: 65.4%Separated: 0.0%Widowed: 0.0%Divorced: 15.4% For population 25 years and over in North Marysville:
High school or higher: 90.8%Bachelor's degree or higher: 17.6%Graduate or professional degree: 0.0%Unemployed: 5.7%Mean travel time to work (commute): 29.6 minutes
Education Gini index (Inequality in education) Here:
4.6Washington average:
11.6
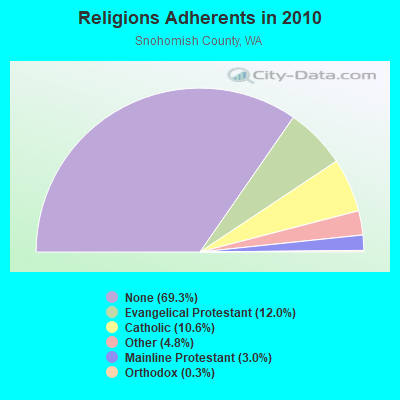
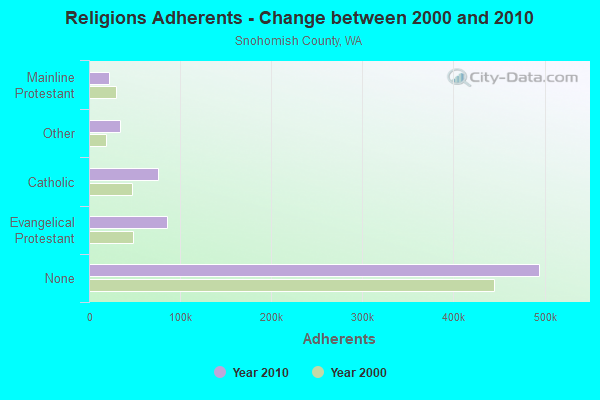
Religion statistics for North Marysville, WA (based on Snohomish County data)
Religion Adherents Congregations Evangelical Protestant 85,354 327 Catholic 75,393 16 Other 34,270 90 Mainline Protestant 21,642 71 Orthodox 1,943 6 Black Protestant 406 4 None 494,327 -
Source: Clifford Grammich, Kirk Hadaway, Richard Houseal, Dale E.Jones, Alexei Krindatch, Richie Stanley and Richard H.Taylor. 2012. 2010 U.S.Religion Census: Religious Congregations & Membership Study. Association of Statisticians of American Religious Bodies. Jones, Dale E., et al. 2002. Congregations and Membership in the United States 2000. Nashville, TN: Glenmary Research Center. Graphs represent county-level data
Food Environment Statistics: Number of grocery stores : 121Snohomish County :
1.79 / 10,000 pop.Washington :
2.06 / 10,000 pop.
Number of supercenters and club stores : 12This county :
0.18 / 10,000 pop.Washington :
0.19 / 10,000 pop.
Number of convenience stores (no gas) : 96Snohomish County :
1.42 / 10,000 pop.Washington :
1.18 / 10,000 pop.
Number of convenience stores (with gas) : 172This county :
2.55 / 10,000 pop.State :
2.67 / 10,000 pop.
Number of full-service restaurants : 469Snohomish County :
6.95 / 10,000 pop.Washington :
8.26 / 10,000 pop.
Adult diabetes rate : This county :
7.5%Washington :
7.7%
Adult obesity rate : Here :
27.4%Washington :
25.7%
Low-income preschool obesity rate : Snohomish County :
14.3%Washington :
13.9%
Health and Nutrition: Healthy diet rate : This city:
47.0%Washington:
49.9%
Average overall health of teeth and gums : This city:
42.6%Washington:
47.2%
People feeling badly about themselves : This city:
24.9%Washington:
20.9%
People not drinking alcohol at all : North Marysville:
18.2%State:
10.5%
Average hours sleeping at night : North Marysville:
6.7Washington:
6.8
Overweight people : This city:
41.8%Washington:
32.8%
General health condition : This city:
52.0%Washington:
56.8%
Average condition of hearing : Here:
78.4%Washington:
79.4%
More about Health and Nutrition of North Marysville, WA Residents
7.60% of this county's 2021 resident taxpayers lived in other counties in 2020 ($97,930 average adjusted gross income )
Here:
7.60%Washington average:
7.53%
0.04% of residents moved from foreign countries ($285 average AGI )Snohomish County:
0.04%Washington average:
0.05%
Top counties from which taxpayers relocated into this county between 2020 and 2021:
7.20% of this county's 2020 resident taxpayers moved to other counties in 2021 ($85,049 average adjusted gross income )
Here:
7.20%Washington average:
7.40%
0.02% of residents moved to foreign countries ($153 average AGI )Snohomish County:
0.02%Washington average:
0.04%
Top counties to which taxpayers relocated from this county between 2020 and 2021: Strongest AM radio stations in North Marysville:
KRKO (1380 AM; 50 kW; EVERETT, WA; Owner: S-R BROADCASTING, CO.)
KIXI (880 AM; 50 kW; MERCER ISLAND/SEATTL, WA; Owner: BELLEVUE RADIO, INC.)
KKOL (1300 AM; 50 kW; SEATTLE, WA; Owner: INSPIRATION MEDIA, INC.)
KIRO (710 AM; 50 kW; SEATTLE, WA; Owner: ENTERCOM SEATTLE LICENSE, LLC)
KGNW (820 AM; 50 kW; BURIEN-SEATTLE, WA; Owner: INSPIRATION MEDIA, INC.)
KTTH (770 AM; 50 kW; SEATTLE, WA; Owner: ENTERCOM SEATTLE LICENSE, LLC)
KOMO (1000 AM; 50 kW; SEATTLE, WA; Owner: FISHER BROADCASTING - SEATTLE RADIO, L.L.C.)
KAPS (660 AM; 10 kW; MOUNT VERNON, WA; Owner: VALLEY BROADCASTERS, INC.)
KYCW (1090 AM; 50 kW; SEATTLE, WA; Owner: INFINITY RADIO SUBSIDIARY OPERATIONS INC.)
KJR (950 AM; 50 kW; SEATTLE, WA)
KCIS (630 AM; 5 kW; EDMONDS, WA; Owner: CRISTA MINISTRIES)
KRPI (1550 AM; 50 kW; FERNDALE, WA; Owner: BBC BROADCASTING, INC.)
KWYZ (1230 AM; 1 kW; EVERETT, WA; Owner: RADIO HANKOOK, INC.)
Strongest FM radio stations in North Marysville:
KSER (90.7 FM; EVERETT, WA; Owner: KSER FOUNDATION)
K205DL (88.9 FM; GRANITE FALLS/EVERET, WA; Owner: CALVARY CHAPEL OF TWIN FALLS, INC.)
KISW (99.9 FM; SEATTLE, WA; Owner: ENTERCOM SEATTLE LICENSE, LLC)
K206CU (89.1 FM; MOUNT VERNON, WA; Owner: CALVARY CHAPEL OF TWIN FALLS, INC.)
KQBZ (100.7 FM; SEATTLE, WA; Owner: ENTERCOM SEATTLE LICENSE, LLC)
KSVR (91.7 FM; MOUNT VERNON, WA; Owner: BOARD OF TRUSTEES OF SKAGIT VALLEY COLLEGE)
KCMS (105.3 FM; EDMONDS, WA; Owner: CRISTA MINISTRIES, INC.)
KMTT (103.7 FM; TACOMA, WA; Owner: ENTERCOM SEATTLE LICENSE, LLC)
KNDD (107.7 FM; SEATTLE, WA; Owner: ENTERCOM SEATTLE LICENSE, LLC)
KYPT (96.5 FM; SEATTLE, WA; Owner: INFINITY RADIO SUBSIDIARY OPERATIONS INC.)
KBSG-FM (97.3 FM; TACOMA, WA; Owner: ENTERCOM SEATTLE LICENSE, LLC)
KZOK-FM (102.5 FM; SEATTLE, WA; Owner: INFINITY RADIO SUBSIDIARY OPERATIONS INC.)
KBKS (106.1 FM; TACOMA, WA; Owner: INFINITY RADIO SUBSIDIARY OPERATIONS INC.)
KING-FM (98.1 FM; SEATTLE, WA; Owner: CLASSIC RADIO, INC.)
KLSY-FM (92.5 FM; BELLEVUE, WA; Owner: BELLEVUE RADIO INC.)
KPLU-FM (88.5 FM; TACOMA, WA; Owner: PACIFIC LUTHERAN UNIVERSITY, INC.)
KWJZ (98.9 FM; SEATTLE, WA; Owner: ORCA RADIO, INC.)
KMPS-FM (94.1 FM; SEATTLE, WA; Owner: INFINITY RADIO SUBSIDIARY OPERATIONS INC.)
KISM (92.9 FM; BELLINGHAM, WA; Owner: SAGA BROADCASTING, LLC)
K213BM (90.5 FM; EVERETT, ETC., WA; Owner: JACK STRAW FOUNDATION)
TV broadcast stations around North Marysville:
KING-TV (Channel 5; SEATTLE, WA; Owner: KING BROADCASTING COMPANY)
KSTW (Channel 11; TACOMA, WA; Owner: UPN TELEVISION STATIONS INC.)
K58DP (Channel 58; SEATTLE, WA; Owner: WORD OF GOD FELLOWSHIP, INC.)
KTWB-TV (Channel 22; SEATTLE, WA; Owner: TRIBUNE TELEVISION HOLDINGS, INC.)
KOMO-TV (Channel 4; SEATTLE, WA; Owner: FISHER BROADCASTING - SEATTLE TV, L.L.C.)
KIRO-TV (Channel 7; SEATTLE, WA; Owner: KIRO-TV HOLDINGS, INC.)
KHCV (Channel 45; SEATTLE, WA; Owner: NORTH PACIFIC INTERNATIONAL TELEVISION, INC.)
K58BW (Channel 58; EVERETT, WA; Owner: KIRO-TV HOLDINGS, INC.)
KWPX (Channel 33; BELLEVUE, WA; Owner: PAXSON COMMUNICATIONS LICENSE COMPANY, LLC)
K29ED (Channel 29; EVERETT, WA; Owner: TRIBUNE TELEVISION HOLDINGS, INC.)
K57HB (Channel 57; EUREKA, CA; Owner: MS COMMUNICATIONS, LLC)
National Bridge Inventory (NBI) Statistics 1 Number of bridges10ft / 3.4m Total length $3,739,000 Total costs4,270 Total average daily traffic427 Total average daily truck traffic7,000 Total future (year 2042) average daily traffic
FCC Registered Microwave Towers: 3
MARYSVILLE T, Hickok Road And Highway 9, 3 Miles East Of Marysville (Lat: 48.052306 Lon: -122.111778), Type: Ltower, Structure height: 91.4 m, Call Sign: WPTP450, Assigned Frequencies: 10955.0 MHz, 10915.0 MHz, 11605.0 MHz, 11645.0 MHz, 10995.0 MHz, 19405.0 MHz, 5974.85 MHz, Grant Date: 10/14/2021, Expiration Date: 11/15/2031, Certifier: Spencer L Bahner, Registrant: Snohomish County 911, 14900 40th Ave Ne #200, Marysville, WA 98271, Phone: (360) 722-0522, Email:
GETCHELL HIL, 9229 76th Ave. Ne (Lat: 48.078583 Lon: -122.124139), Type: Upole, Structure height: 16.2 m, Call Sign: WQRN333, Assigned Frequencies: 11365.0 MHz, 11365.0 MHz, 11365.0 MHz, 11365.0 MHz, 11365.0 MHz, 11365.0 MHz, Grant Date: 05/23/2023, Expiration Date: 06/24/2033, Certifier: Gregory M Romano, Registrant: Verizon, 5055 North Point Pkwy, Alpharetta, GA 30022, Phone: (770) 797-1070, Email:
SE60XC202, 5611 108th St Ne (Lat: 48.095722 Lon: -122.152972), Type: Mtower, Structure height: 42.7 m, Overall height: 46.3 m, Call Sign: WQUX955, Assigned Frequencies: 21825.0 MHz, Grant Date: 11/13/2014, Expiration Date: 11/13/2024, Cancellation Date: 05/12/2023, Certifier: David Werblow, Registrant: T-Mobile Usa, Inc., 12920 Se 38th Street, Bellevue, WA 98006, Phone: (425) 383-8401, Email:
Home Mortgage Disclosure Act Aggregated Statistics For Year 2009(Based on 1 full and 6 partial tracts) A) FHA, FSA/RHS & VA B) Conventional C) Refinancings D) Home Improvement Loans E) Loans on Dwellings For 5+ Families F) Non-occupant Loans on G) Loans On Manufactured Number Average Value Number Average Value Number Average Value Number Average Value Number Average Value Number Average Value Number Average Value
LOANS ORIGINATED 190 $236,910 108 $186,887 596 $210,108 13 $129,051 4 $821,755 43 $178,253 19 $151,017 APPLICATIONS APPROVED, NOT ACCEPTED 9 $253,859 10 $205,932 60 $230,393 6 $56,197 0 $0 2 $220,945 3 $169,020 APPLICATIONS DENIED 17 $209,552 19 $197,561 213 $229,774 20 $124,335 0 $0 15 $207,527 8 $132,122 APPLICATIONS WITHDRAWN 20 $231,232 9 $189,943 181 $223,161 9 $132,399 0 $0 9 $205,026 1 $263,130 FILES CLOSED FOR INCOMPLETENESS 5 $225,448 0 $0 41 $234,125 1 $50,540 0 $0 1 $336,360 1 $250,880
Aggregated Statistics For Year 2008(Based on 1 full and 6 partial tracts) A) FHA, FSA/RHS & VA B) Conventional C) Refinancings D) Home Improvement Loans E) Loans on Dwellings For 5+ Families F) Non-occupant Loans on G) Loans On Manufactured Number Average Value Number Average Value Number Average Value Number Average Value Number Average Value Number Average Value Number Average Value
LOANS ORIGINATED 121 $264,092 116 $260,780 493 $221,939 28 $142,436 2 $2,424,940 75 $266,032 11 $153,275 APPLICATIONS APPROVED, NOT ACCEPTED 9 $275,163 15 $198,797 83 $223,330 10 $68,758 0 $0 11 $194,903 6 $71,378 APPLICATIONS DENIED 21 $253,314 29 $242,851 316 $245,599 59 $133,177 1 $4,505,810 24 $225,129 10 $93,627 APPLICATIONS WITHDRAWN 11 $260,990 21 $253,216 177 $239,642 16 $135,818 0 $0 19 $215,959 4 $240,605 FILES CLOSED FOR INCOMPLETENESS 2 $248,825 4 $360,028 30 $247,678 3 $171,330 0 $0 2 $243,405 1 $163,030
Aggregated Statistics For Year 2007(Based on 1 full and 6 partial tracts) A) FHA, FSA/RHS & VA B) Conventional C) Refinancings D) Home Improvement Loans E) Loans on Dwellings For 5+ Families F) Non-occupant Loans on G) Loans On Manufactured Number Average Value Number Average Value Number Average Value Number Average Value Number Average Value Number Average Value Number Average Value
LOANS ORIGINATED 36 $279,721 424 $226,382 770 $205,266 76 $114,607 1 $1,173,380 126 $211,355 24 $107,444 APPLICATIONS APPROVED, NOT ACCEPTED 2 $239,055 56 $198,010 133 $214,838 24 $134,101 0 $0 22 $238,600 6 $102,490 APPLICATIONS DENIED 5 $216,864 109 $214,147 422 $219,734 110 $135,187 0 $0 46 $220,001 12 $155,757 APPLICATIONS WITHDRAWN 5 $266,854 55 $234,071 223 $223,140 32 $168,940 0 $0 20 $213,331 4 $175,578 FILES CLOSED FOR INCOMPLETENESS 1 $151,530 12 $205,538 69 $234,234 6 $174,327 0 $0 4 $237,285 2 $164,245
Aggregated Statistics For Year 2006(Based on 1 full and 6 partial tracts) A) FHA, FSA/RHS & VA B) Conventional C) Refinancings D) Home Improvement Loans E) Loans on Dwellings For 5+ Families F) Non-occupant Loans on G) Loans On Manufactured Number Average Value Number Average Value Number Average Value Number Average Value Number Average Value Number Average Value Number Average Value
LOANS ORIGINATED 39 $261,006 779 $164,572 898 $177,131 92 $81,727 1 $404,690 178 $178,841 20 $136,224 APPLICATIONS APPROVED, NOT ACCEPTED 1 $155,380 81 $160,775 143 $183,911 14 $56,722 0 $0 17 $175,361 5 $95,066 APPLICATIONS DENIED 9 $273,443 158 $171,715 448 $185,990 80 $102,095 0 $0 39 $189,767 14 $126,007 APPLICATIONS WITHDRAWN 6 $298,143 102 $161,194 341 $188,012 36 $170,104 0 $0 25 $158,111 4 $172,325 FILES CLOSED FOR INCOMPLETENESS 1 $231,530 9 $199,697 69 $201,565 4 $70,435 0 $0 1 $274,340 1 $218,300
Aggregated Statistics For Year 2005(Based on 1 full and 6 partial tracts) A) FHA, FSA/RHS & VA B) Conventional C) Refinancings D) Home Improvement Loans E) Loans on Dwellings For 5+ Families F) Non-occupant Loans on G) Loans On Manufactured Number Average Value Number Average Value Number Average Value Number Average Value Number Average Value Number Average Value Number Average Value
LOANS ORIGINATED 39 $218,826 804 $141,274 897 $163,784 69 $76,549 1 $4,418,750 154 $179,320 16 $103,578 APPLICATIONS APPROVED, NOT ACCEPTED 1 $150,470 93 $141,317 145 $158,064 9 $110,840 0 $0 18 $141,168 5 $106,984 APPLICATIONS DENIED 6 $204,060 143 $139,130 472 $172,075 69 $73,695 0 $0 34 $146,700 19 $113,765 APPLICATIONS WITHDRAWN 3 $264,067 114 $146,781 386 $169,767 42 $126,632 0 $0 32 $154,557 4 $117,812 FILES CLOSED FOR INCOMPLETENESS 1 $246,380 12 $134,418 107 $188,499 3 $51,163 0 $0 2 $106,355 0 $0
Aggregated Statistics For Year 2004(Based on 1 full and 6 partial tracts) A) FHA, FSA/RHS & VA B) Conventional C) Refinancings D) Home Improvement Loans E) Loans on Dwellings For 5+ Families F) Non-occupant Loans on G) Loans On Manufactured Number Average Value Number Average Value Number Average Value Number Average Value Number Average Value Number Average Value Number Average Value
LOANS ORIGINATED 99 $187,899 616 $137,578 830 $147,601 66 $45,973 1 $350,000 160 $160,420 22 $83,560 APPLICATIONS APPROVED, NOT ACCEPTED 5 $201,496 69 $142,021 150 $156,422 7 $52,880 0 $0 19 $156,714 5 $88,568 APPLICATIONS DENIED 12 $188,449 118 $136,871 434 $159,344 61 $57,774 0 $0 30 $156,523 24 $99,707 APPLICATIONS WITHDRAWN 10 $189,689 69 $133,476 295 $154,986 15 $97,060 0 $0 16 $160,428 2 $108,660 FILES CLOSED FOR INCOMPLETENESS 3 $222,350 15 $141,852 99 $165,856 8 $54,301 0 $0 3 $107,280 0 $0
Aggregated Statistics For Year 2003(Based on 1 full and 6 partial tracts) A) FHA, FSA/RHS & VA B) Conventional C) Refinancings D) Home Improvement Loans E) Loans on Dwellings For 5+ Families F) Non-occupant Loans on Number Average Value Number Average Value Number Average Value Number Average Value Number Average Value Number Average Value
LOANS ORIGINATED 204 $177,294 401 $140,095 1,678 $143,073 60 $19,862 5 $1,762,064 164 $136,468 APPLICATIONS APPROVED, NOT ACCEPTED 10 $178,877 48 $133,764 216 $155,799 17 $30,774 0 $0 16 $147,388 APPLICATIONS DENIED 14 $180,272 79 $132,439 432 $157,159 51 $22,846 0 $0 39 $154,625 APPLICATIONS WITHDRAWN 16 $183,059 52 $148,946 328 $157,613 7 $40,881 0 $0 12 $132,642 FILES CLOSED FOR INCOMPLETENESS 3 $222,823 7 $124,080 58 $156,551 2 $33,440 0 $0 1 $184,150
Aggregated Statistics For Year 2002(Based on 4 partial tracts) A) FHA, FSA/RHS & VA B) Conventional C) Refinancings D) Home Improvement Loans E) Loans on Dwellings For 5+ Families F) Non-occupant Loans on Number Average Value Number Average Value Number Average Value Number Average Value Number Average Value Number Average Value
LOANS ORIGINATED 109 $170,636 139 $131,042 594 $139,961 29 $31,345 1 $896,880 47 $125,447 APPLICATIONS APPROVED, NOT ACCEPTED 6 $177,010 24 $132,555 90 $148,913 12 $17,574 0 $0 7 $136,164 APPLICATIONS DENIED 9 $150,070 21 $133,535 176 $143,943 27 $12,110 0 $0 9 $143,443 APPLICATIONS WITHDRAWN 5 $152,522 18 $145,394 127 $146,696 5 $29,066 0 $0 6 $142,873 FILES CLOSED FOR INCOMPLETENESS 0 $0 8 $118,818 37 $138,069 1 $7,660 0 $0 2 $209,145
Aggregated Statistics For Year 2001(Based on 4 partial tracts) A) FHA, FSA/RHS & VA B) Conventional C) Refinancings D) Home Improvement Loans E) Loans on Dwellings For 5+ Families F) Non-occupant Loans on Number Average Value Number Average Value Number Average Value Number Average Value Number Average Value Number Average Value
LOANS ORIGINATED 113 $166,329 126 $136,215 487 $133,950 37 $20,698 1 $2,268,760 39 $120,394 APPLICATIONS APPROVED, NOT ACCEPTED 5 $170,298 24 $116,897 57 $129,165 7 $23,189 0 $0 4 $142,522 APPLICATIONS DENIED 6 $156,102 25 $106,651 187 $127,895 33 $23,763 0 $0 10 $122,139 APPLICATIONS WITHDRAWN 10 $168,265 20 $116,804 124 $136,386 10 $32,261 0 $0 4 $128,162 FILES CLOSED FOR INCOMPLETENESS 2 $142,540 5 $108,760 32 $138,449 0 $0 0 $0 1 $138,590
Aggregated Statistics For Year 2000(Based on 4 partial tracts) A) FHA, FSA/RHS & VA B) Conventional C) Refinancings D) Home Improvement Loans E) Loans on Dwellings For 5+ Families F) Non-occupant Loans on Number Average Value Number Average Value Number Average Value Number Average Value Number Average Value Number Average Value
LOANS ORIGINATED 92 $160,109 152 $123,228 135 $103,045 49 $24,591 2 $1,465,140 25 $106,521 APPLICATIONS APPROVED, NOT ACCEPTED 6 $124,910 22 $128,843 30 $116,794 16 $22,020 0 $0 1 $91,910 APPLICATIONS DENIED 8 $147,355 54 $105,062 110 $92,888 27 $26,279 0 $0 3 $73,323 APPLICATIONS WITHDRAWN 9 $159,106 22 $126,152 48 $117,877 4 $41,965 0 $0 4 $141,988 FILES CLOSED FOR INCOMPLETENESS 1 $160,420 6 $119,193 26 $118,185 2 $29,240 0 $0 1 $123,760
Aggregated Statistics For Year 1999(Based on 6 partial tracts) A) FHA, FSA/RHS & VA B) Conventional C) Refinancings D) Home Improvement Loans E) Loans on Dwellings For 5+ Families F) Non-occupant Loans on Number Average Value Number Average Value Number Average Value Number Average Value Number Average Value Number Average Value
LOANS ORIGINATED 268 $153,934 368 $126,460 424 $112,596 81 $32,186 3 $1,629,517 78 $114,643 APPLICATIONS APPROVED, NOT ACCEPTED 4 $140,872 50 $106,503 64 $107,418 22 $18,265 1 $105,320 6 $114,805 APPLICATIONS DENIED 14 $149,562 90 $96,898 179 $102,882 62 $27,438 0 $0 12 $113,269 APPLICATIONS WITHDRAWN 13 $151,978 35 $123,069 120 $115,228 10 $51,101 0 $0 10 $117,116 FILES CLOSED FOR INCOMPLETENESS 2 $209,095 10 $114,875 43 $110,895 2 $37,350 0 $0 3 $154,627
Detailed HMDA statistics for the following Tracts:
0527.01
, 0527.04 , 0528.03 , 0528.04 , 0528.05 , 0528.06 , 0529.01
Private Mortgage Insurance Companies Aggregated Statistics For Year 2009(Based on 1 full and 6 partial tracts) A) Conventional B) Refinancings Number Average Value Number Average Value
LOANS ORIGINATED 5 $241,006 8 $265,532 APPLICATIONS APPROVED, NOT ACCEPTED 0 $0 8 $293,079 APPLICATIONS DENIED 3 $216,337 9 $238,526 APPLICATIONS WITHDRAWN 1 $123,870 2 $299,880 FILES CLOSED FOR INCOMPLETENESS 0 $0 0 $0
Aggregated Statistics For Year 2008(Based on 1 full and 6 partial tracts) A) Conventional B) Refinancings C) Non-occupant Loans on Number Average Value Number Average Value Number Average Value
LOANS ORIGINATED 55 $265,966 48 $258,282 7 $236,139 APPLICATIONS APPROVED, NOT ACCEPTED 25 $272,698 20 $277,409 1 $244,800 APPLICATIONS DENIED 7 $265,194 8 $234,544 4 $282,402 APPLICATIONS WITHDRAWN 8 $266,822 1 $249,850 2 $294,875 FILES CLOSED FOR INCOMPLETENESS 0 $0 1 $281,440 1 $213,890
Aggregated Statistics For Year 2007(Based on 1 full and 6 partial tracts) A) Conventional B) Refinancings C) Non-occupant Loans on Number Average Value Number Average Value Number Average Value
LOANS ORIGINATED 115 $274,442 71 $266,900 9 $278,007 APPLICATIONS APPROVED, NOT ACCEPTED 12 $275,298 13 $262,703 1 $352,480 APPLICATIONS DENIED 3 $348,347 1 $198,470 1 $233,940 APPLICATIONS WITHDRAWN 10 $281,030 7 $257,140 0 $0 FILES CLOSED FOR INCOMPLETENESS 4 $265,492 1 $225,000 0 $0
Aggregated Statistics For Year 2006(Based on 1 full and 6 partial tracts) A) Conventional B) Refinancings C) Non-occupant Loans on Number Average Value Number Average Value Number Average Value
LOANS ORIGINATED 35 $266,727 29 $239,009 2 $227,980 APPLICATIONS APPROVED, NOT ACCEPTED 4 $300,745 9 $226,929 0 $0 APPLICATIONS DENIED 1 $359,860 1 $324,610 0 $0 APPLICATIONS WITHDRAWN 2 $174,900 5 $218,476 0 $0 FILES CLOSED FOR INCOMPLETENESS 0 $0 0 $0 0 $0
Aggregated Statistics For Year 2005(Based on 1 full and 6 partial tracts) A) Conventional B) Refinancings C) Non-occupant Loans on Number Average Value Number Average Value Number Average Value
LOANS ORIGINATED 39 $206,231 32 $213,183 5 $154,660 APPLICATIONS APPROVED, NOT ACCEPTED 4 $188,655 6 $167,298 1 $112,790 APPLICATIONS DENIED 0 $0 0 $0 0 $0 APPLICATIONS WITHDRAWN 3 $156,230 2 $239,610 2 $149,845 FILES CLOSED FOR INCOMPLETENESS 1 $275,720 0 $0 0 $0
Aggregated Statistics For Year 2004(Based on 1 full and 6 partial tracts) A) Conventional B) Refinancings C) Non-occupant Loans on Number Average Value Number Average Value Number Average Value
LOANS ORIGINATED 54 $191,107 49 $175,437 9 $165,318 APPLICATIONS APPROVED, NOT ACCEPTED 7 $186,284 24 $182,106 3 $166,977 APPLICATIONS DENIED 0 $0 1 $122,820 0 $0 APPLICATIONS WITHDRAWN 2 $194,980 4 $200,742 0 $0 FILES CLOSED FOR INCOMPLETENESS 0 $0 0 $0 0 $0
Aggregated Statistics For Year 2003(Based on 1 full and 6 partial tracts) A) Conventional B) Refinancings C) Non-occupant Loans on Number Average Value Number Average Value Number Average Value
LOANS ORIGINATED 70 $175,330 136 $166,148 10 $147,545 APPLICATIONS APPROVED, NOT ACCEPTED 10 $169,485 37 $169,183 1 $130,000 APPLICATIONS DENIED 1 $218,260 3 $188,757 0 $0 APPLICATIONS WITHDRAWN 3 $174,980 15 $181,824 0 $0 FILES CLOSED FOR INCOMPLETENESS 0 $0 1 $174,000 0 $0
Aggregated Statistics For Year 2002(Based on 4 partial tracts) A) Conventional B) Refinancings C) Non-occupant Loans on Number Average Value Number Average Value Number Average Value
LOANS ORIGINATED 32 $163,475 55 $169,629 6 $129,953 APPLICATIONS APPROVED, NOT ACCEPTED 3 $158,520 19 $181,737 0 $0 APPLICATIONS DENIED 2 $211,245 1 $216,950 2 $165,730 APPLICATIONS WITHDRAWN 0 $0 2 $157,775 0 $0 FILES CLOSED FOR INCOMPLETENESS 0 $0 0 $0 0 $0
Aggregated Statistics For Year 2001(Based on 4 partial tracts) A) Conventional B) Refinancings C) Non-occupant Loans on Number Average Value Number Average Value Number Average Value
LOANS ORIGINATED 43 $170,053 70 $164,876 4 $166,495 APPLICATIONS APPROVED, NOT ACCEPTED 8 $158,422 14 $180,925 3 $106,850 APPLICATIONS DENIED 1 $150,160 7 $169,864 0 $0 APPLICATIONS WITHDRAWN 1 $129,940 1 $199,680 0 $0 FILES CLOSED FOR INCOMPLETENESS 0 $0 0 $0 0 $0
Aggregated Statistics For Year 2000(Based on 4 partial tracts) A) Conventional B) Refinancings C) Non-occupant Loans on Number Average Value Number Average Value Number Average Value
LOANS ORIGINATED 37 $152,786 15 $154,754 5 $138,968 APPLICATIONS APPROVED, NOT ACCEPTED 3 $153,500 1 $201,250 0 $0 APPLICATIONS DENIED 2 $127,830 1 $104,710 0 $0 APPLICATIONS WITHDRAWN 0 $0 0 $0 0 $0 FILES CLOSED FOR INCOMPLETENESS 0 $0 0 $0 0 $0
Aggregated Statistics For Year 1999(Based on 6 partial tracts) A) Conventional B) Refinancings C) Non-occupant Loans on Number Average Value Number Average Value Number Average Value
LOANS ORIGINATED 119 $155,098 52 $151,399 8 $137,726 APPLICATIONS APPROVED, NOT ACCEPTED 3 $245,217 8 $144,386 0 $0 APPLICATIONS DENIED 4 $200,695 4 $168,688 0 $0 APPLICATIONS WITHDRAWN 2 $181,600 0 $0 0 $0 FILES CLOSED FOR INCOMPLETENESS 0 $0 0 $0 0 $0
Detailed PMIC statistics for the following Tracts:
0527.01
, 0527.04 , 0528.03 , 0528.04 , 0528.05 , 0528.06 , 0529.01 North Marysville compared to Washington state average:
Unemployed percentage below state average. Black race population percentage significantly below state average. Hispanic race population percentage significantly below state average. Median age above state average. Foreign-born population percentage significantly below state average. Length of stay since moving in significantly above state average. Number of rooms per house above state average. House age significantly below state average. Number of college students significantly below state average. Percentage of population with a bachelor's degree or higher below state average. North Marysville on our top lists :
#2 on the list of "Top 101 cities where residents moved more then 10 years ago (1,000+ households)"
#24 on the list of "Top 101 counties with the lowest Particulate Matter (PM2.5 ) Annual air pollution readings in 2012 (µg/m3 )"
#45 on the list of "Top 101 counties with the lowest number of infant deaths per 1000 residents 2007-2013 (pop. 50,000+)"
#46 on the list of "Top 101 counties with the highest percentage of residents that exercised in the past month"
#48 on the list of "Top 101 counties with the highest average weight of females"
#60 on the list of "Top 101 counties with the most Other congregations (pop. 50,000+)"


 Recent articles from our blog. Our writers, many of them Ph.D. graduates or candidates, create easy-to-read articles on a wide variety of topics.

 (9.5 miles