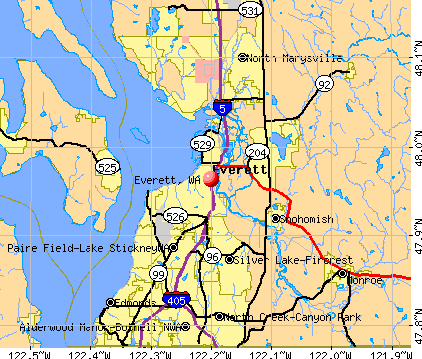
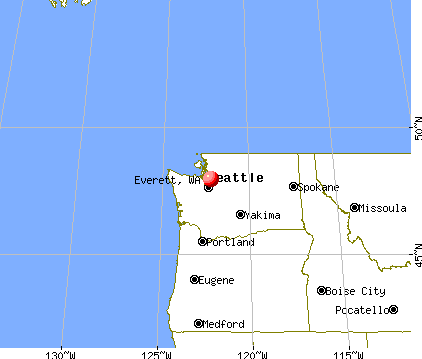
Everett, Washington

Everett: Nov 06 snow
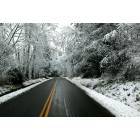
Everett: Nov 06 snow
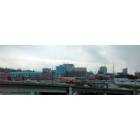
Everett: Everett, Washington skyline.
Everett: Everett High School
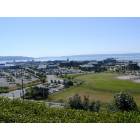
Everett: Everett waterfront and Navy station (Puget Sound)
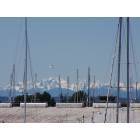
Everett: Olympic Mountians from the Everett Farmer's Market
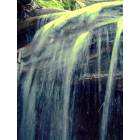
Everett: waterfall at howarth park stream
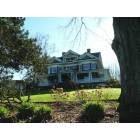
Everett: Rucker hill, Everett
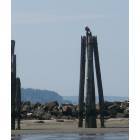
Everett: Eagle on pileing at Jetty Island, Everett
Everett: Everett Station
Everett: Corner of Colby and Hewitt Ave.
- see
24
more - add
your
Submit your own pictures of this city and show them to the world
- OSM Map
- General Map
- Google Map
- MSN Map
Population change since 2000: +21.7%
 |
| Males: 58,259 | |
| Females: 53,078 |
| Median resident age: | 35.8 years |
| Washington median age: | 38.4 years |
Zip codes: 98201, 98203, 98204, 98207, 98275, 98294.
Everett Zip Code Map| Everett: | $79,723 |
| WA: | $91,306 |
Estimated per capita income in 2022: $48,923 (it was $20,577 in 2000)
Everett city income, earnings, and wages data
Estimated median house or condo value in 2022: $573,800 (it was $161,700 in 2000)
| Everett: | $573,800 |
| WA: | $569,500 |
Mean prices in 2022: all housing units: $646,378; detached houses: $734,573; townhouses or other attached units: $500,036; in 2-unit structures: $636,451; in 3-to-4-unit structures: $429,024; in 5-or-more-unit structures: $344,146; mobile homes: $212,871
Median gross rent in 2022: $1,648.
(13.5% for White Non-Hispanic residents, 7.5% for Black residents, 13.2% for Hispanic or Latino residents, 18.2% for American Indian residents, 38.6% for Native Hawaiian and other Pacific Islander residents, 13.1% for other race residents, 13.9% for two or more races residents)
Detailed information about poverty and poor residents in Everett, WA


- 63,75757.3%White alone
- 21,35019.2%Hispanic
- 8,8077.9%Asian alone
- 8,5167.6%Two or more races
- 4,9114.4%Black alone
- 2,9442.6%Native Hawaiian and Other
Pacific Islander alone - 8570.8%Other race alone
- 2060.2%American Indian alone
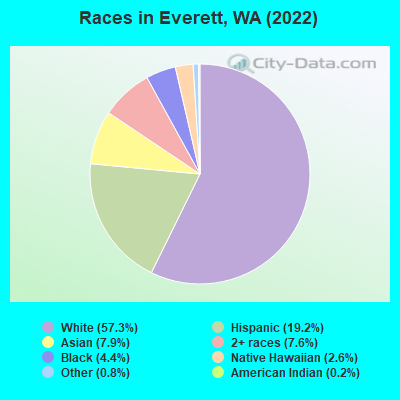
Races in Everett detailed stats: ancestries, foreign born residents, place of birth
According to our research of Washington and other state lists, there were 134 registered sex offenders living in Everett, Washington as of April 27, 2024.
The ratio of all residents to sex offenders in Everett is 814 to 1.
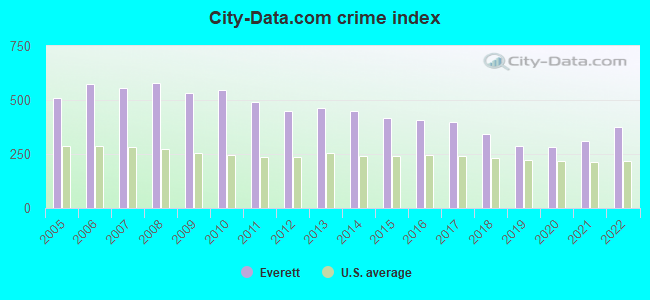
The City-Data.com crime index weighs serious crimes and violent crimes more heavily. Higher means more crime, U.S. average is 246.1. It adjusts for the number of visitors and daily workers commuting into cities.
- means the value is smaller than the state average.- means the value is about the same as the state average.
- means the value is bigger than the state average.
- means the value is much bigger than the state average.
Crime rate in Everett detailed stats: murders, rapes, robberies, assaults, burglaries, thefts, arson
Full-time law enforcement employees in 2021, including police officers: 225 (192 officers - 170 male; 22 female).
| Officers per 1,000 residents here: | 1.69 |
| Washington average: | 1.35 |
 Recent articles from our blog. Our writers, many of them Ph.D. graduates or candidates, create easy-to-read articles on a wide variety of topics.


Latest news from Everett, WA collected exclusively by city-data.com from local newspapers, TV, and radio stations
Ancestries: German (6.1%), English (5.1%), Irish (4.3%), European (3.9%), American (3.8%), Norwegian (3.5%).
Current Local Time: PST time zone
Incorporated in 1893
Elevation: 110 feet
Land area: 32.5 square miles.
Population density: 3,425 people per square mile (average).
23,968 residents are foreign born (7.8% Asia, 6.6% Latin America, 2.8% Europe, 2.7% Africa).
| This city: | 21.3% |
| Washington: | 14.9% |
Median real estate property taxes paid for housing units with mortgages in 2022: $3,697 (0.6%)
Median real estate property taxes paid for housing units with no mortgage in 2022: $3,961 (0.7%)
Nearest city with pop. 200,000+: East Seattle, WA (24.1 miles  , pop. 480,100).
Nearest city with pop. 1,000,000+: Los Angeles, CA (980.1 miles , pop. 3,694,820).
Nearest cities:
), ), ), ), ), ), Latitude: 47.96 N, Longitude: 122.20 W
Daytime population change due to commuting: +34,276 (+30.8%)
Workers who live and work in this city: 27,312 (47.6%)
Area code: 425

Property values in Everett, WA

Everett tourist attractions:
Everett, Washington accommodation & food services, waste management - Economy and Business Data
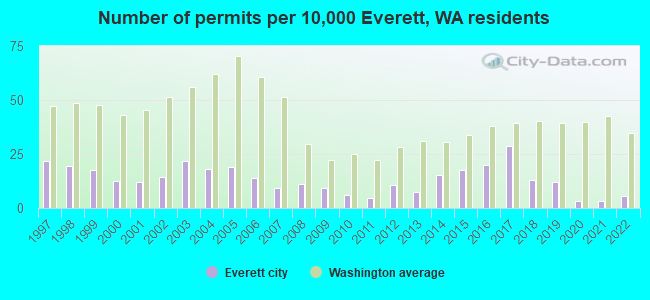
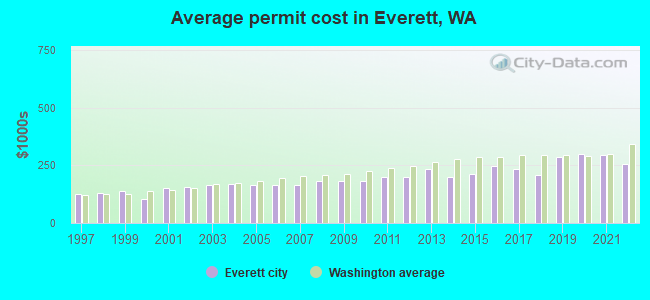
Single-family new house construction building permits:
- 2022: 51 buildings, average cost: $257,700
- 2021: 31 buildings, average cost: $297,200
- 2020: 28 buildings, average cost: $298,400
- 2019: 112 buildings, average cost: $287,700
- 2018: 117 buildings, average cost: $209,000
- 2017: 261 buildings, average cost: $234,200
- 2016: 183 buildings, average cost: $248,600
- 2015: 162 buildings, average cost: $213,100
- 2014: 140 buildings, average cost: $202,400
- 2013: 68 buildings, average cost: $234,400
- 2012: 99 buildings, average cost: $200,500
- 2011: 41 buildings, average cost: $200,200
- 2010: 56 buildings, average cost: $184,300
- 2009: 84 buildings, average cost: $181,800
- 2008: 100 buildings, average cost: $181,700
- 2007: 86 buildings, average cost: $167,100
- 2006: 126 buildings, average cost: $167,200
- 2005: 175 buildings, average cost: $167,000
- 2004: 167 buildings, average cost: $167,500
- 2003: 199 buildings, average cost: $164,100
- 2002: 133 buildings, average cost: $157,300
- 2001: 112 buildings, average cost: $153,800
- 2000: 115 buildings, average cost: $103,200
- 1999: 162 buildings, average cost: $137,200
- 1998: 176 buildings, average cost: $131,600
- 1997: 198 buildings, average cost: $123,600
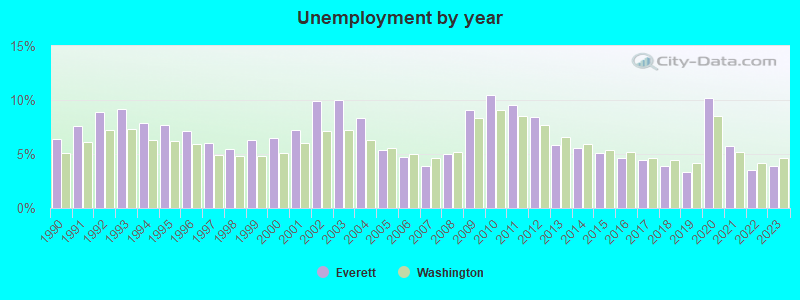
| Here: | 3.9% |
| Washington: | 4.6% |
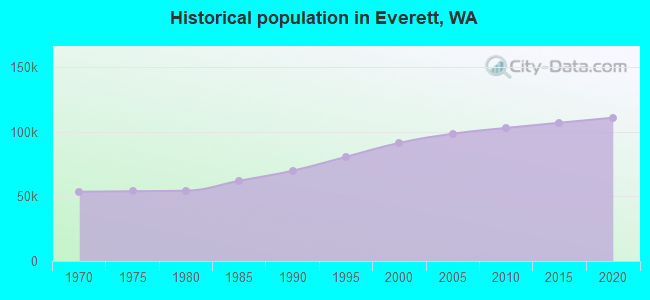
Population change in the 1990s: +19,181 (+26.5%).
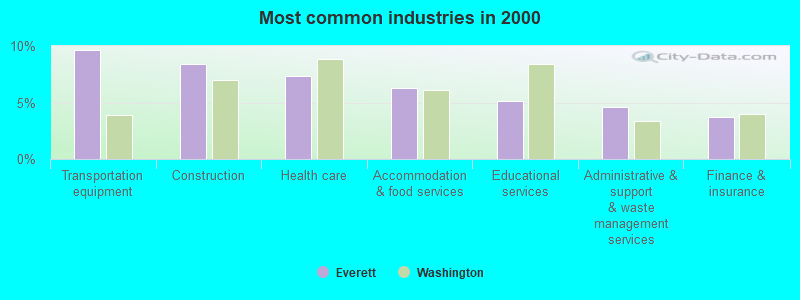
- Transportation equipment (9.7%)
- Construction (8.4%)
- Health care (7.3%)
- Accommodation & food services (6.3%)
- Educational services (5.1%)
- Administrative & support & waste management services (4.6%)
- Finance & insurance (3.7%)
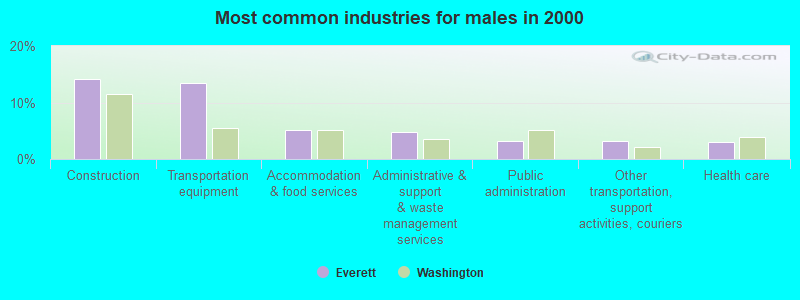
- Construction (14.1%)
- Transportation equipment (13.5%)
- Accommodation & food services (5.1%)
- Administrative & support & waste management services (4.8%)
- Public administration (3.2%)
- Other transportation, support activities, couriers (3.1%)
- Health care (3.0%)
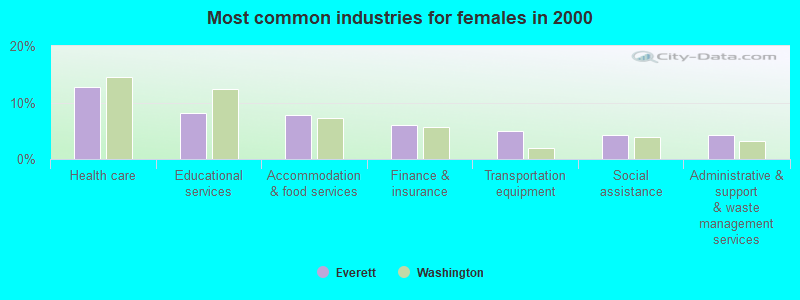
- Health care (12.7%)
- Educational services (8.1%)
- Accommodation & food services (7.7%)
- Finance & insurance (6.0%)
- Transportation equipment (5.0%)
- Social assistance (4.3%)
- Administrative & support & waste management services (4.3%)
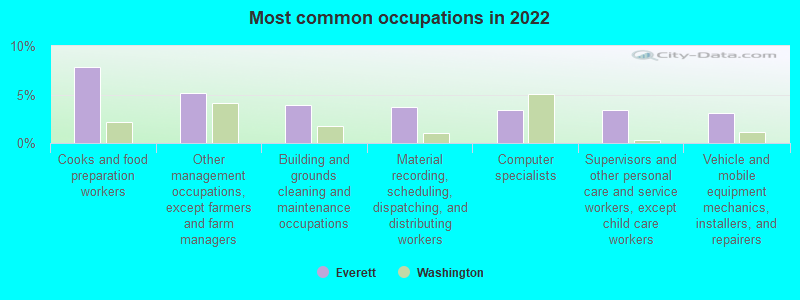
- Cooks and food preparation workers (7.9%)
- Other management occupations, except farmers and farm managers (5.2%)
- Building and grounds cleaning and maintenance occupations (3.9%)
- Material recording, scheduling, dispatching, and distributing workers (3.7%)
- Computer specialists (3.4%)
- Supervisors and other personal care and service workers, except child care workers (3.4%)
- Vehicle and mobile equipment mechanics, installers, and repairers (3.1%)
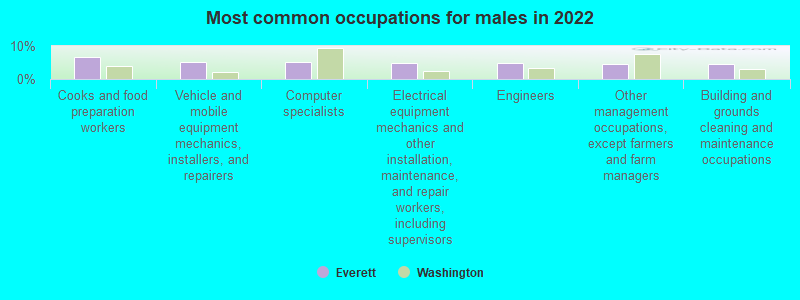
- Cooks and food preparation workers (6.6%)
- Vehicle and mobile equipment mechanics, installers, and repairers (5.2%)
- Computer specialists (5.1%)
- Electrical equipment mechanics and other installation, maintenance, and repair workers, including supervisors (4.9%)
- Engineers (4.9%)
- Other management occupations, except farmers and farm managers (4.5%)
- Building and grounds cleaning and maintenance occupations (4.4%)
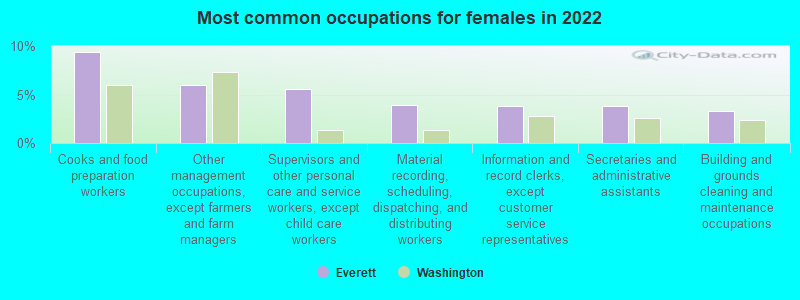
- Cooks and food preparation workers (9.4%)
- Other management occupations, except farmers and farm managers (5.9%)
- Supervisors and other personal care and service workers, except child care workers (5.6%)
- Material recording, scheduling, dispatching, and distributing workers (3.9%)
- Information and record clerks, except customer service representatives (3.8%)
- Secretaries and administrative assistants (3.8%)
- Building and grounds cleaning and maintenance occupations (3.3%)
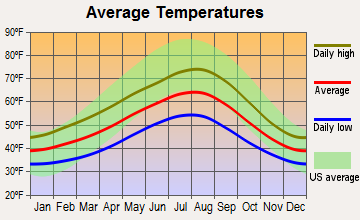
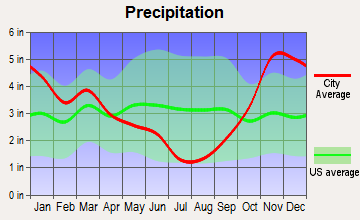
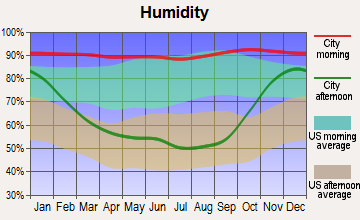
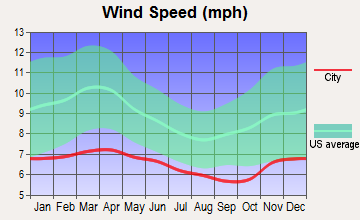
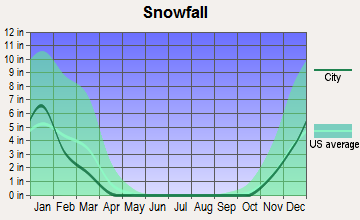
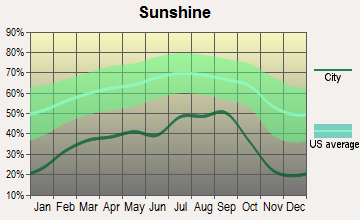
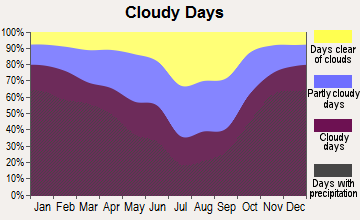
Average climate in Everett, Washington
Based on data reported by over 4,000 weather stations
|
|

(lower is better)
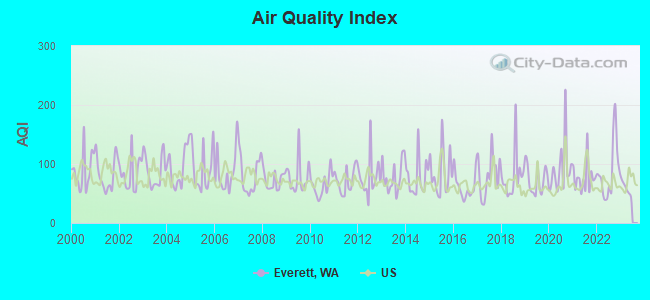
Air Quality Index (AQI) level in 2022 was 87.7. This is worse than average.
| City: | 87.7 |
| U.S.: | 72.6 |
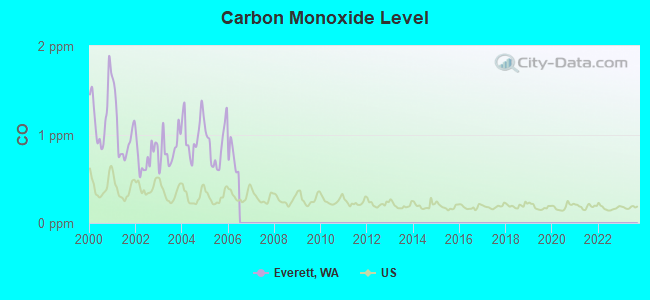
Carbon Monoxide (CO) [ppm] level in 2005 was 0.866. This is significantly worse than average. Closest monitor was 1.1 miles away from the city center.
| City: | 0.866 |
| U.S.: | 0.251 |
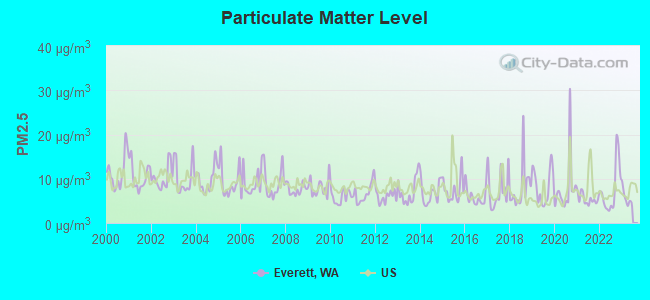
Particulate Matter (PM2.5) [µg/m3] level in 2022 was 7.60. This is about average. Closest monitor was 6.4 miles away from the city center.
| City: | 7.60 |
| U.S.: | 8.11 |
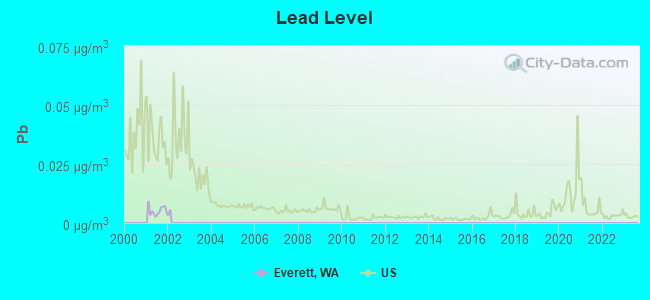
Lead (Pb) [µg/m3] level in 2001 was 0.00523. This is significantly better than average. Closest monitor was 14.9 miles away from the city center.
| City: | 0.00523 |
| U.S.: | 0.00931 |
Earthquake activity:
Everett-area historical earthquake activity is significantly above Washington state average. It is 1214% greater than the overall U.S. average.On 4/13/1949 at 19:55:42, a magnitude 7.0 (7.0 UK, Class: Major, Intensity: VIII - XII) earthquake occurred 51.3 miles away from Everett center, causing $80,000,000 total damage
On 2/28/2001 at 18:54:32, a magnitude 6.8 (6.8 MD, Depth: 32.2 mi, Class: Strong, Intensity: VII - IX) earthquake occurred 61.5 miles away from Everett center
On 2/28/2001 at 18:54:32, a magnitude 6.8 (6.5 MB, 6.6 MS, 6.8 MW) earthquake occurred 63.0 miles away from the city center, causing $2,000,000,000 total damage and $305,000,000 insured losses
On 4/29/1965 at 15:28:43, a magnitude 6.6 (6.6 UK) earthquake occurred 45.1 miles away from the city center, causing $28,000,000 total damage
On 7/3/1999 at 01:43:54, a magnitude 5.8 (5.4 MB, 5.5 MS, 5.8 MW, 5.3 ME, Depth: 25.2 mi, Class: Moderate, Intensity: VI - VII) earthquake occurred 79.0 miles away from the city center
On 5/3/1996 at 04:04:22, a magnitude 5.5 (5.2 MB, 5.3 MD, 5.5 ML, Depth: 2.5 mi) earthquake occurred 22.9 miles away from Everett center
Magnitude types: body-wave magnitude (MB), duration magnitude (MD), energy magnitude (ME), local magnitude (ML), surface-wave magnitude (MS), moment magnitude (MW)
Natural disasters:
The number of natural disasters in Snohomish County (31) is a lot greater than the US average (15).Major Disasters (Presidential) Declared: 27
Emergencies Declared: 2
Causes of natural disasters: Floods: 21, Storms: 17, Mudslides: 14, Landslides: 10, Winter Storms: 6, Winds: 5, Earthquakes: 2, Heavy Rain: 1, Hurricane: 1, Snow: 1, Tornado: 1, Volcanic Eruption: 1, Other: 1 (Note: some incidents may be assigned to more than one category).
Main business address for: UNOVA INC (COMPUTER PERIPHERAL EQUIPMENT, NEC), CASCADE FINANCIAL CORP (STATE COMMERCIAL BANKS), Zumiez Inc (RETAIL-APPAREL & ACCESSORY STORES), FRONTIER FINANCIAL CORP /WA/ (STATE COMMERCIAL BANKS).
Hospitals in Everett:
- PROVIDENCE HOSPITAL (916 PACIFIC AVE (P O BOX 1067))
- PROVIDENCE REGIONAL MEDICAL CENTER EVERETT (Voluntary non-profit - Church, 1321 COLBY AVENUE)
Nursing Homes in Everett:
- BETHANY AT PACIFIC (916 PACIFIC AVENUE 3RD-5TH FLOORS)
- BETHANY AT SILVER LAKE (2235 LAKE HEIGHTS DRIVE)
- BETHANY ON BROADWAY (3322 BROADWAY ST)
- EVERETT CARE AND REHABILITATION CENTER (1919 112TH STREET SOUTHWEST)
- EVERETT REHABILITATION AND MEDICAL CTR (1919 - 112TH STREET SOUTHWEST)
- EVERETT TRANSITIONAL CARE SERV (916 PACIFIC AVENUE - 6TH FLOOR)
- FOREST VIEW TRANSITIONAL HEALTH CENTER (5129 HILLTOP ROAD)
- PLEASANT ACRES (5129 HILLTOP RD)
- PROVIDENCE HOSPITAL - EVERETT (916 PACIFIC AVENUE)
- SUNRISE VIEW CONVALESCENT CTR (2520 MADISON)
- VIRGINIA MANOR CONVALESCENT HOME (3515 HOYT AVENUE)
Dialysis Facilities in Everett:
Home Health Centers in Everett:
Airports and heliports located in Everett:
- Snohomish County (Paine Fld) Airport (PAE) (Runways: 3, Commercial Ops: 4,142, Air Taxi Ops: 1,364, Itinerant Ops: 52,017, Local Ops: 54,325, Military Ops: 940)
- Heineck Farm Airport (76WA) (Runways: 1)
- Jim & Julie's Airport (96WA) (Runways: 1)
- Calkins Equipment Company Heliport (1WA3)
- General Hospital Of Everett Heliport (1WA5)
- Naval Station Everett Heliport (0WA9)
- Providence Hospital Heliport (1WA4)
- The Boeing Company Heliport (WA82)
Colleges/Universities in Everett:
- Everett Community College (Full-time enrollment: 5,818; Location: 2000 Tower Street; Public; Website: www.everettcc.edu)
- Everest College-Everett (Full-time enrollment: 735; Location: 906 SE Everett Mall Parkway, 6th Floor; Private, for-profit; Website: www.everest.edu/campus/everett)
- ITT Technical Institute-Everett (Full-time enrollment: 318; Location: 1615 75th Street Sw, Suite 220; Private, for-profit; Website: www.itt-tech.edu)
- Evergreen Beauty and Barber College-Everett (Full-time enrollment: 208; Location: 802 SE Everett Mall Way Ste A; Private, for-profit; Website: www.evergreenbeauty.edu)
- Trinity Lutheran College (Full-time enrollment: 188; Location: 2802 Wetmore Ave.; Private, not-for-profit; Website: www.tlc.edu)
- Paroba College of Cosmetology (Full-time enrollment: 135; Location: 607 SE Everett Mall, Suite 5; Private, for-profit; Website: www.parobacollege.com)
Other colleges/universities with over 2000 students near Everett:
- Edmonds Community College (about 12 miles; Lynnwood, WA; Full-time enrollment: 7,271)
- University of Washington-Bothell Campus (about 15 miles; Bothell, WA; FT enrollment: 3,902)
- Cascadia Community College (about 15 miles; Bothell, WA; FT enrollment: 2,238)
- Shoreline Community College (about 17 miles; Shoreline, WA; FT enrollment: 5,026)
- Lake Washington Institute of Technology (about 18 miles; Kirkland, WA; FT enrollment: 2,947)
- Seattle Community College-North Campus (about 20 miles; Seattle, WA; FT enrollment: 4,220)
- University of Washington-Seattle Campus (about 22 miles; Seattle, WA; FT enrollment: 39,445)
Biggest public high schools in Everett:
- SNOHOMISH DETENTION CENTER (Location: 2801 10TH STREET, Grades: 6-12)
- PASS PROGRAM (Location: 2731 10TH ST. SUITE 106, Grades: 6-12)
- CASCADE HIGH SCHOOL (Location: 801 E. CASINO RD., Grades: 9-12)
- EVERETT HIGH SCHOOL (Location: 2416 COLBY AVE., Grades: 9-12)
- SEQUOIA HIGH SCHOOL (Location: 3516 RUCKER AVE, Grades: 9-12)
- OTHER SCHOOLS (Location: 4730 COLBY AVENUE, Grades: 5-12)
- SPECIAL SERVICES (Location: 4730 COLBY AVENUE, Grades: PK-12)
- PORT GARDNER (Location: 3516 RUCKER AVE, Grades: KG-12)
- SNO CO JAIL (Location: 1918 WALL STREET, Grades: 7-12)
- GRADUATION ALLIANCE EVERETT (Location: 3516 RUCKER AVENUE, Grades: 9-12)
Private high schools in Everett:
Biggest public elementary/middle schools in Everett:
- EISENHOWER MIDDLE SCHOOL (Location: 10200 25TH AVE. SE, Grades: 6-8)
- EMERSON ELEMENTARY SCHOOL (Location: 8702 7TH AVENUE SE, Grades: PK-5)
- EVERGREEN MIDDLE SCHOOL (Location: 7621 BEVERLY LN., Grades: 6-8)
- GARFIELD ELEMENTARY SCHOOL (Location: 2215 PINE STREET, Grades: PK-5)
- NORTH MIDDLE SCHOOL (Location: 2514 RAINIER AVE., Grades: 6-8)
- HAWTHORNE ELEMENTARY SCHOOL - EVERETT (Location: 1110 POPLAR ST., Grades: PK-5)
- JACKSON ELEMENTARY SCHOOL (Location: 3700 FEDERAL AVE, Grades: KG-5)
- JEFFERSON ELEMENTARY (Location: 2500 CADET WAY, Grades: KG-5)
- LOWELL ELEMENTARY - EVERETT (Location: 5010 VIEW DR., Grades: PK-5)
- MADISON ELEMENTARY (Location: 616 PECKS DR, Grades: PK-5)
Private elementary/middle schools in Everett:
- NORTHSHORE CHRISTIAN ACADEMY (Students: 848, Location: 5700 23RD DR W, Grades: PK-8)
- ST MARY MAGDALEN ELEMENTARY SCHOOL (Students: 394, Location: 8615 7TH AVE SE, Grades: PK-8)
- IMMACULATE CONCEPTION SCHOOL (Students: 275, Location: 2508 HOYT AVE, Grades: PK-8)
- CEDAR PARK CHRISTIAN SCHOOL - EVERETT CAMPUS (Students: 159, Location: 1300 21ST DR SE, Grades: PK-8)
- EVERETT CHRISTIAN SCHOOL (Students: 105, Location: 2221 CEDAR ST, Grades: PK-8)
- VALLEY VIEW CHRISTIAN SCHOOL (Students: 45, Location: 9717 31ST AVE SE, Grades: PK-2)
- CALVARY CHRISTIAN ACADEMY (Students: 14, Location: 3332 COLBY AVE, Grades: PK-3)
- FOREST PARK ADVENTIST CHRISTIAN SCHOOL (Students: 14, Location: 4120 FEDERAL AVE, Grades: 3-8)
User-submitted facts and corrections:
- The population is 95,550
added by Chocolate
Points of interest:
Notable locations in Everett: Spane Dairy (A), Boeing Aircraft Plant (B), Everett Golf and Country Club (C), Everett Water Work Intake (D), Frontier Village Center (E), Everett Transit Station (F), Everett City Water Treatment Facility (G), Beverly Park Substation (H), Casino Substation (I), Delta Substation (J), Everett Substation (K), Kimberly Clark Substation (L), Pinehurst Substation (M), Silver Lake Substation (N), Snohomish County Fifty Second Street Substation (O), Tenth Street Substation (P), Waterfront Substation (Q), Silver Lake Fairgrounds (R), Walter E Hall Municipal Golf Course (S), Port of Everett (T). Display/hide their locations on the map
Shopping Centers: Everett Mall Plaza (1), College Plaza Shopping Center (2), Pilchuck Center Shopping Center (3), Cascade Shopping Center (4), B and M Shopping Center (5), Andersons Shopping Center (6), Albertsons Shopping Center (7), Safeway Shopping Center (8), Puget Park Shopping Center (9). Display/hide their locations on the map
Main business address in Everett include: UNOVA INC (A), CASCADE FINANCIAL CORP (B), Zumiez Inc (C), FRONTIER FINANCIAL CORP /WA/ (D). Display/hide their locations on the map
Churches in Everett include: New Beginnings Church (A), New Faith Church (B), New Life Center Foursquare Church (C), Northside Church of God (D), Our Lady of Perpetual Help Church (E), Our Saviours Lutheran Church (F), Saint Paul United Methodist Church (G), Parkside Bible Chapel (H), Bethel Baptist Church (I). Display/hide their locations on the map
Cemeteries: Cypress Lawn Cemetery (1), Evergreen Cemetery (2). Display/hide their locations on the map
Lakes and reservoirs: Silver Lake (A), Beverly Lake (B), Lake Chaplain (C), Powder Mill Gulch Retention Basin (D), Reservoir Number Four (E), Reservoir Number Three (F), Reservoir Number Two (G), Reservoir Number Five (H). Display/hide their locations on the map
Streams, rivers, and creeks: Forgotten Creek (A), Pigeon Creek (B), Union Slough (C), Wood Creek (D). Display/hide their locations on the map
Parks in Everett include: Clark Park (1), Forest Park (2), American Legion Memorial Park (3), Bagshaw Field (4), Beverly Park (5), Everett Memorial Stadium (6), Riverdale Park (7). Display/hide their locations on the map
Tourist attractions: Imagine Children's Museum (1502 Wall Street) (1), Museum Of Snohomish County History (Cultural Attractions- Events- & Facilities; 1913 Hewitt Ave) (2), MacDhai Enterprises (Cultural Attractions- Events- & Facilities; 10121 Evergreen Way Suite 536) (3), Museum of Flight Restoration Facility (Cultural Attractions- Events- & Facilities; 2909 100th Street Southwest) (4), Church of Jesus Christ of Latter-Day Saints - Family History Center Genealogy Libra (Cultural Attractions- Events- & Facilities; 9509 19th Avenue Southeast) (5), Jazwieck's Golf (Amusement & Theme Parks; 7828 Broadway) (6), Blues By The Bay (2520 Colby Avenue) (7), Cruise Planners (Recreational Trips & Guides; 5714 Parkview Ln) (8). Display/hide their approximate locations on the map
Hotels: Holiday Inn Express Hotel & Suites (131 128th Street Southwest) (1), Marina Village Inn (1728 West Marine View Drive) (2), Days Inn-Everett (1122 Broadway) (3), Inn At Port Gardner (1700 W Marine View Dr) (4), Everett Inn (12619 4th Av W) (5), Motel Express (2301 Broadway) (6), Comfort Inn & Suites (101 128th Street Southeast Building B) (7), Lifestyle Marketing (2024 Madison) (8), Howard Johnson Plaza Hotel (3105 Pine) (9). Display/hide their approximate locations on the map
Courts: Everett City - Children's Services- Municipal Court Of Everett (3028 Wetmore Avenue) (1), Gma Court Services (3000 Rockefeller Avenue) (2), Courts - Snohomish County Juvenile Court (2801 10th Street) (3), Courts - Snohomish County Superior Court- Family Court (2722 Colby Avenue) (4). Display/hide their approximate locations on the map
Birthplace of: Dennis Erickson - Football player and coach, Randy Couture - Martial artist, Glenn Beck - Talk radio and television host, Henry M. Jackson, Carol Kaye - Rock bass guitarist, Patrick J. Conroy - Roman Catholic priest, Linda Lee Cadwell - Biographer, Anne Quast - Amateur golfer, Brent Lillibridge - Baseball player, Chris Chandler - 2005 NFL player (St. Louis Rams, born: Oct 12, 1965).
Drinking water stations with addresses in Everett and their reported violations in the past:
GOLD BASIN CAMPGROUND (Address: 2930 Wetmore Ave Suite 3A , Population served: 183, Groundwater):Past monitoring violations:MIDDLE FORK CAMPGROUND #2 (Address: 2930 Wetmore Ave Suite 3A , Population served: 54, Groundwater):
- One routine major monitoring violation
Past monitoring violations:EVANS CREEK CAMPGROUND (Address: 2930 Wetmore Ave Suite 3A , Population served: 50, Groundwater):
- One routine major monitoring violation
- One regular monitoring violation
Past monitoring violations:DOUGLAS FIR CAMPGROUND - EAST (Address: 2930 Wetmore Ave Suite 3A , Population served: 45, Groundwater):
- 2 routine major monitoring violations
- 4 regular monitoring violations
Past monitoring violations:DOUGLAS FIR CAMPGROUND - WEST (Address: 2930 Wetmore Ave Suite 3A , Population served: 45, Groundwater):
- One routine major monitoring violation
Past monitoring violations:
- One regular monitoring violation
Drinking water stations with addresses in Everett that have no violations reported:
- HORSESHOE COVE CAMPGROUND (Address: 2930 Wetmore Ave Suite 3A , Population served: 175, Primary Water Source Type: Groundwater)
- EXCELSIOR GROUP SITE CAMPGROUND WS (Address: 2930 Wetmore Ave Suite 3A , Population served: 29, Primary Water Source Type: Groundwater)
- MILLER RIVER CAMPGROUND (Address: 2930 Wetmore Ave Suite 3A , Population served: 27, Primary Water Source Type: Groundwater)
| This city: | 2.4 people |
| Washington: | 2.5 people |
| This city: | 56.4% |
| Whole state: | 64.4% |
| This city: | 9.3% |
| Whole state: | 7.7% |
Likely homosexual households (counted as self-reported same-sex unmarried-partner households)
- Lesbian couples: 0.5% of all households
- Gay men: 0.3% of all households
People in group quarters in Everett in 2010:
- 1,170 people in local jails and other municipal confinement facilities
- 757 people in military barracks and dormitories (nondisciplinary)
- 683 people in military ships
- 404 people in nursing facilities/skilled-nursing facilities
- 283 people in emergency and transitional shelters (with sleeping facilities) for people experiencing homelessness
- 282 people in group homes intended for adults
- 222 people in other noninstitutional facilities
- 75 people in workers' group living quarters and job corps centers
- 72 people in residential treatment centers for adults
- 65 people in college/university student housing
- 50 people in correctional facilities intended for juveniles
- 43 people in hospitals with patients who have no usual home elsewhere
- 30 people in mental (psychiatric) hospitals and psychiatric units in other hospitals
- 5 people in group homes for juveniles (non-correctional)
- 4 people in correctional residential facilities
People in group quarters in Everett in 2000:
- 2,036 people in military ships
- 812 people in other noninstitutional group quarters
- 585 people in local jails and other confinement facilities (including police lockups)
- 211 people in nursing homes
- 189 people in other group homes
- 98 people in military barracks, etc.
- 91 people in homes or halfway houses for drug/alcohol abuse
- 86 people in short-term care, detention or diagnostic centers for delinquent children
- 81 people in homes for the mentally ill
- 14 people in military transient quarters for temporary residents
Banks with most branches in Everett (2011 data):
- JPMorgan Chase Bank, National Association: Everett Branch, Everett Mall Way Branch, Silverlake Branch, Murphy's Corner, Evergreen Way Branch, South Everett. Info updated 2011/11/10: Bank assets: $1,811,678.0 mil, Deposits: $1,190,738.0 mil, headquarters in Columbus, OH, positive income, International Specialization, 5577 total offices, Holding Company: Jpmorgan Chase & Co.
- Opus Bank: Silver Lake Branch, Evergreen Way Branch, Lake Stevens, Broadway Branch, Cascade Bank Branch. Info updated 2011/11/08: Bank assets: $2,404.2 mil, Deposits: $1,831.2 mil, headquarters in Irvine, CA, negative income in the last year, Commercial Lending Specialization, 38 total offices
- Wells Fargo Bank, National Association: Everett Main Branch, Evergreen Way Banking Center, Evergreen Way Branch, North Puget Sound Pcs Branch, Broadway Branch. Info updated 2011/04/05: Bank assets: $1,161,490.0 mil, Deposits: $905,653.0 mil, headquarters in Sioux Falls, SD, positive income, 6395 total offices, Holding Company: Wells Fargo & Company
- Bank of America, National Association: Silver Lake Branch, South Everett Branch, Everett Branch, Casino Branch, Everett Mall Branch. Info updated 2009/11/18: Bank assets: $1,451,969.3 mil, Deposits: $1,077,176.8 mil, headquarters in Charlotte, NC, positive income, 5782 total offices, Holding Company: Bank Of America Corporation
- KeyBank National Association: Evergreen Way Branch, Evertrust Bank Branch, Evertrust Bank Branch, Everett Branch. Info updated 2008/03/03: Bank assets: $86,198.8 mil, Deposits: $64,214.8 mil, headquarters in Cleveland, OH, positive income, Commercial Lending Specialization, 1067 total offices, Holding Company: Keycorp
- Banner Bank: Everett Colby Branch, Everett - Evergreen Way Branch, South Everett Branch. Info updated 2011/05/03: Bank assets: $4,048.2 mil, Deposits: $3,348.4 mil, headquarters in Walla Walla, WA, positive income, Commercial Lending Specialization, 87 total offices, Holding Company: Banner Corporation
- Washington Federal: Evergree Way Branch, Everett Branch, Murphys Corner Branch. Info updated 2011/12/19: Bank assets: $13,653.0 mil, Deposits: $8,905.8 mil, headquarters in Seattle, WA, positive income, Mortgage Lending Specialization, 174 total offices
- Union Bank, National Association: Everett Main Branch, Everett - Evergreen Way Branch, Everett - Downtown Branch. Info updated 2011/09/01: Bank assets: $88,967.5 mil, Deposits: $65,286.4 mil, headquarters in San Francisco, CA, positive income, Commercial Lending Specialization, 403 total offices, Holding Company: Mitsubishi Ufj Financial Group, Inc.
- Coastal Community Bank: at 2817 Colby Avenue, branch established on 1997/04/01; Silver Lake Branch at 10520 19th Avenue Se, branch established on 2009/02/20. Info updated 2008/10/28: Bank assets: $297.1 mil, Deposits: $264.2 mil, local headquarters, positive income, Commercial Lending Specialization, 8 total offices, Holding Company: Coastal Financial Corporation
- 6 other banks with 9 local branches
For population 15 years and over in Everett:
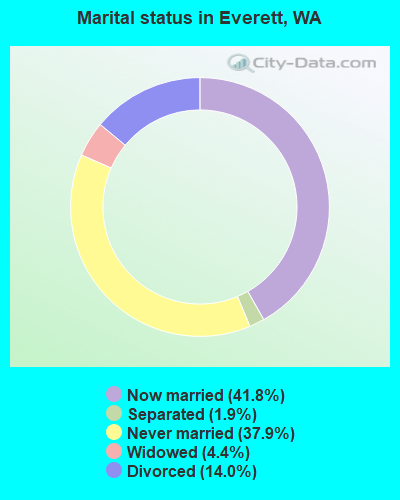
- Never married: 37.9%
- Now married: 41.8%
- Separated: 1.9%
- Widowed: 4.4%
- Divorced: 14.0%
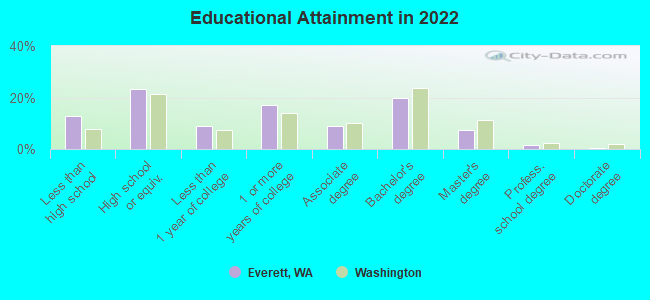
For population 25 years and over in Everett:
- High school or higher: 87.3%
- Bachelor's degree or higher: 29.1%
- Graduate or professional degree: 9.4%
- Unemployed: 8.1%
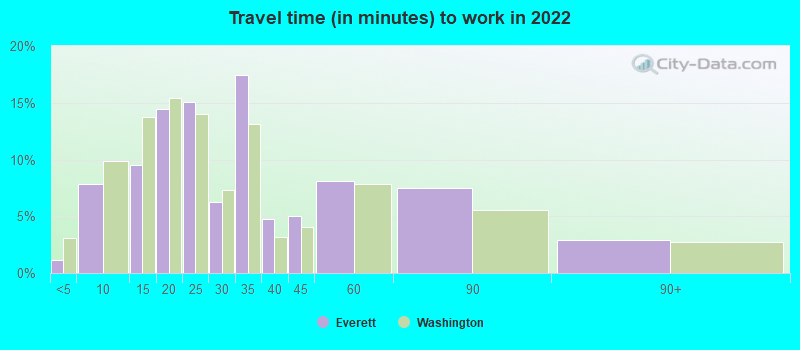
- Mean travel time to work (commute): 21.9 minutes
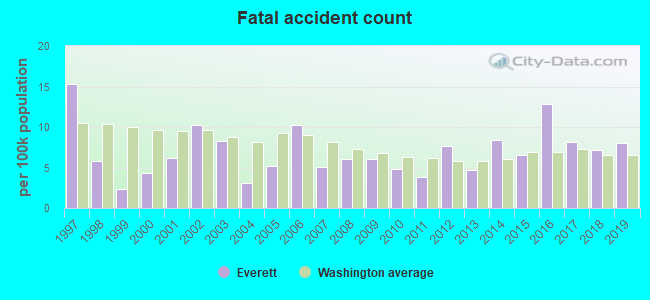
| Here: | 11.9 |
| Washington average: | 11.6 |
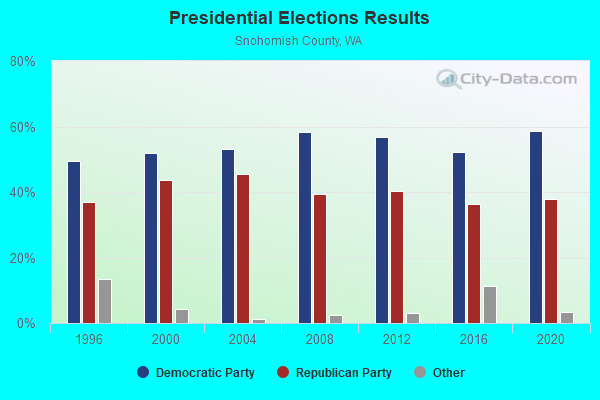
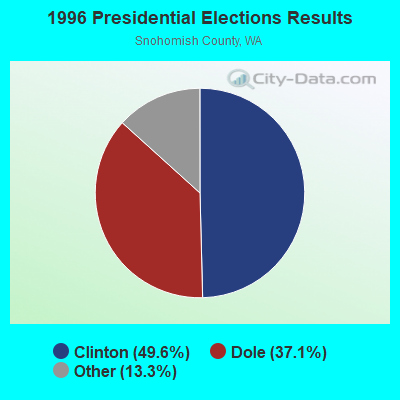
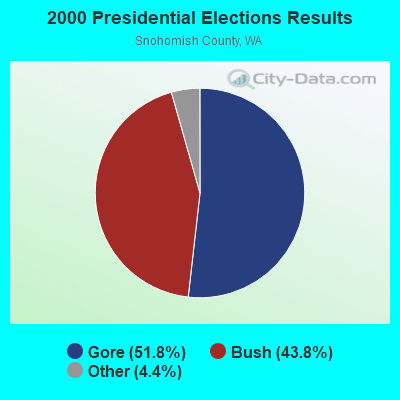
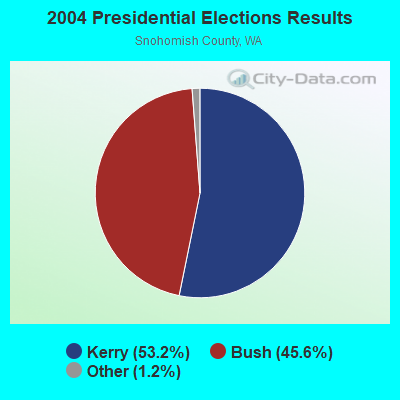
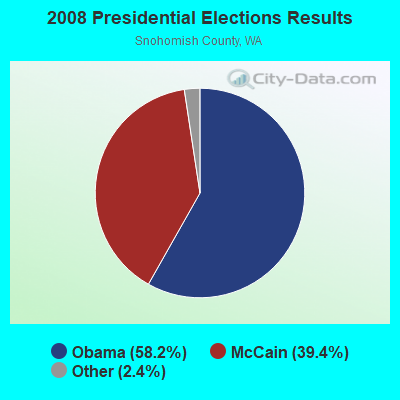

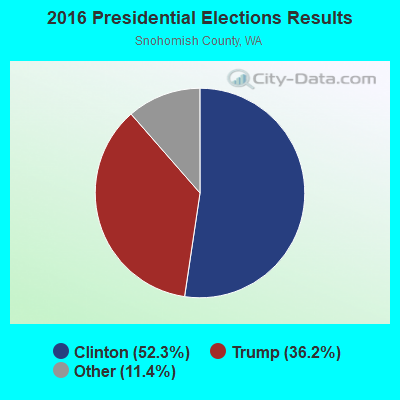
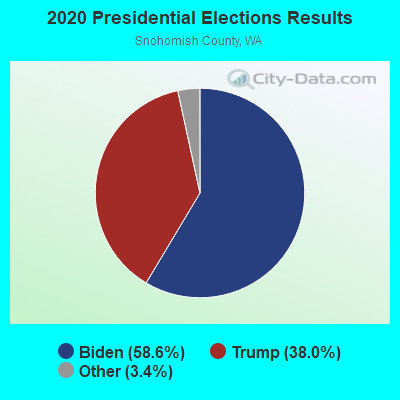
Graphs represent county-level data. Detailed 2008 Election Results
Religion statistics for Everett, WA (based on Snohomish County data)
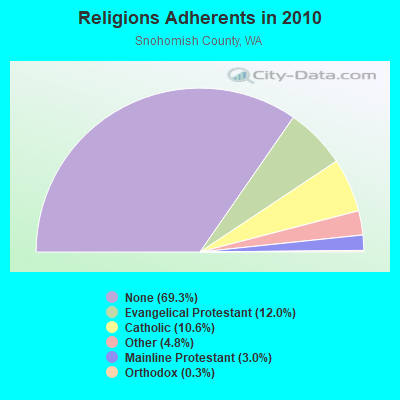
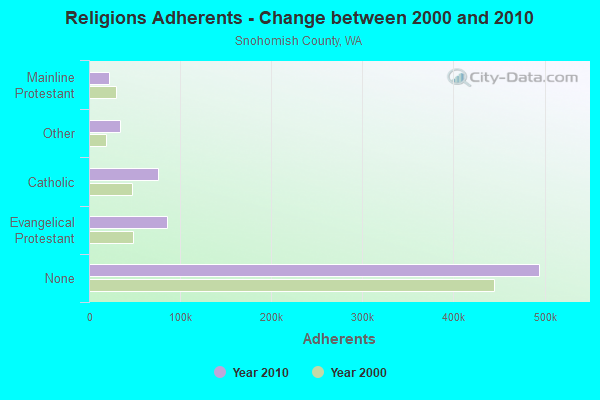
| Religion | Adherents | Congregations |
|---|---|---|
| Evangelical Protestant | 85,354 | 327 |
| Catholic | 75,393 | 16 |
| Other | 34,270 | 90 |
| Mainline Protestant | 21,642 | 71 |
| Orthodox | 1,943 | 6 |
| Black Protestant | 406 | 4 |
| None | 494,327 | - |
Food Environment Statistics:
| Snohomish County: | 1.79 / 10,000 pop. |
| State: | 2.06 / 10,000 pop. |
| Snohomish County: | 0.18 / 10,000 pop. |
| Washington: | 0.19 / 10,000 pop. |
| Here: | 1.42 / 10,000 pop. |
| Washington: | 1.18 / 10,000 pop. |
| Snohomish County: | 2.55 / 10,000 pop. |
| Washington: | 2.67 / 10,000 pop. |
| This county: | 6.95 / 10,000 pop. |
| State: | 8.26 / 10,000 pop. |
| Snohomish County: | 7.5% |
| Washington: | 7.7% |
| Snohomish County: | 27.4% |
| State: | 25.7% |
| This county: | 14.3% |
| Washington: | 13.9% |
Health and Nutrition:
| Everett: | 50.0% |
| Washington: | 49.9% |
| This city: | 47.9% |
| State: | 47.2% |
| This city: | 28.2 |
| Washington: | 28.4 |
| This city: | 20.0% |
| State: | 20.9% |
| Here: | 10.6% |
| Washington: | 10.5% |
| Here: | 6.8 |
| Washington: | 6.8 |
| This city: | 30.9% |
| Washington: | 32.8% |
| Here: | 57.8% |
| Washington: | 56.8% |
| This city: | 80.4% |
| Washington: | 79.4% |
More about Health and Nutrition of Everett, WA Residents
| Local government employment and payroll (March 2022) | |||||
| Function | Full-time employees | Monthly full-time payroll | Average yearly full-time wage | Part-time employees | Monthly part-time payroll |
|---|---|---|---|---|---|
| Police Protection - Officers | 191 | $2,096,264 | $131,702 | 0 | $0 |
| Firefighters | 180 | $2,136,431 | $142,429 | 0 | $0 |
| Water Supply | 114 | $862,774 | $90,818 | 0 | $0 |
| Transit | 113 | $728,412 | $77,353 | 0 | $0 |
| Sewerage | 103 | $775,365 | $90,334 | 0 | $0 |
| Streets and Highways | 68 | $523,796 | $92,435 | 0 | $0 |
| Other and Unallocable | 48 | $345,406 | $86,352 | 0 | $0 |
| Financial Administration | 45 | $389,493 | $103,865 | 1 | $748 |
| Parks and Recreation | 44 | $298,612 | $81,440 | 5 | $6,011 |
| Police - Other | 35 | $209,113 | $71,696 | 0 | $0 |
| Judicial and Legal | 28 | $240,290 | $102,981 | 5 | $13,910 |
| Local Libraries | 27 | $193,389 | $85,951 | 16 | $62,275 |
| Welfare | 24 | $115,519 | $57,760 | 0 | $0 |
| Other Government Administration | 23 | $233,386 | $121,767 | 8 | $22,017 |
| Housing and Community Development (Local) | 23 | $206,077 | $107,518 | 1 | $5,376 |
| Health | 16 | $91,060 | $68,295 | 5 | $8,775 |
| Fire - Other | 10 | $71,402 | $85,682 | 0 | $0 |
| Correction | 3 | $25,201 | $100,804 | 0 | $0 |
| Totals for Government | 1,095 | $9,541,991 | $104,570 | 41 | $119,112 |
Everett government finances - Expenditure in 2021 (per resident):
- Construction - Regular Highways: $11,526,000 ($103.52)
Water Utilities: $6,555,000 ($58.88)
Sewerage: $5,195,000 ($46.66)
Parks and Recreation: $2,190,000 ($19.67)
Libraries: $430,000 ($3.86)
Police Protection: $312,000 ($2.80)
- Current Operations - Police Protection: $37,727,000 ($338.85)
Water Utilities: $31,465,000 ($282.61)
Sewerage: $29,203,000 ($262.29)
Transit Utilities: $25,306,000 ($227.29)
Local Fire Protection: $24,531,000 ($220.33)
Health - Other: $16,030,000 ($143.98)
General - Other: $12,352,000 ($110.94)
Parks and Recreation: $12,082,000 ($108.52)
Central Staff Services: $8,287,000 ($74.43)
Financial Administration: $7,247,000 ($65.09)
Regular Highways: $6,634,000 ($59.58)
General Public Buildings: $5,196,000 ($46.67)
Libraries: $3,564,000 ($32.01)
Housing and Community Development: $2,733,000 ($24.55)
Judicial and Legal Services: $2,131,000 ($19.14)
Protective Inspection and Regulation - Other: $1,955,000 ($17.56)
Public Welfare - Other: $629,000 ($5.65)
Parking Facilities: $599,000 ($5.38)
Solid Waste Management: $372,000 ($3.34)
- General - Interest on Debt: $7,118,000 ($63.93)
- Intergovernmental to Local - Other - Correctional Institutions: $2,549,000 ($22.89)
Other - General - Other: $1,060,000 ($9.52)
- Other Capital Outlay - Water Utilities: $2,245,000 ($20.16)
Transit Utilities: $2,167,000 ($19.46)
Police Protection: $993,000 ($8.92)
Libraries: $699,000 ($6.28)
Regular Highways: $436,000 ($3.92)
General - Other: $407,000 ($3.66)
Parks and Recreation: $310,000 ($2.78)
Local Fire Protection: $222,000 ($1.99)
- Total Salaries and Wages: $109,341,000 ($982.07)
Everett government finances - Revenue in 2021 (per resident):
- Charges - Sewerage: $49,025,000 ($440.33)
Other: $11,555,000 ($103.78)
Parks and Recreation: $4,077,000 ($36.62)
Solid Waste Management: $2,550,000 ($22.90)
Parking Facilities: $569,000 ($5.11)
Regular Highways: $13,000 ($0.12)
- Federal Intergovernmental - Highways: $7,965,000 ($71.54)
Housing and Community Development: $1,630,000 ($14.64)
Other: $15,000 ($0.13)
- Local Intergovernmental - Other: $827,000 ($7.43)
- Miscellaneous - General Revenue - Other: $4,953,000 ($44.49)
Rents: $4,176,000 ($37.51)
Interest Earnings: $2,729,000 ($24.51)
Fines and Forfeits: $1,121,000 ($10.07)
Donations From Private Sources: $950,000 ($8.53)
Sale of Property: $407,000 ($3.66)
Special Assessments: $1,000 ($0.01)
- Revenue - Water Utilities: $46,167,000 ($414.66)
Transit Utilities: $1,724,000 ($15.48)
- State Intergovernmental - Health and Hospitals: $11,064,000 ($99.37)
Other: $6,447,000 ($57.91)
Highways: $4,679,000 ($42.03)
General Local Government Support: $1,683,000 ($15.12)
Housing and Community Development: $74,000 ($0.66)
- Tax - General Sales and Gross Receipts: $51,852,000 ($465.72)
Property: $47,385,000 ($425.60)
Occupation and Business License - Other: $18,252,000 ($163.93)
Public Utilities Sales: $14,484,000 ($130.09)
Documentary and Stock Transfer: $5,246,000 ($47.12)
Other License: $1,627,000 ($14.61)
Motor Vehicle License: $1,624,000 ($14.59)
Amusements Sales: $529,000 ($4.75)
Other Selective Sales: $375,000 ($3.37)
Everett government finances - Debt in 2021 (per resident):
- Long Term Debt - Beginning Outstanding - Unspecified Public Purpose: $318,891,000 ($2864.20)
Outstanding Unspecified Public Purpose: $311,797,000 ($2800.48)
Retired Unspecified Public Purpose: $66,088,000 ($593.59)
Issue, Unspecified Public Purpose: $58,993,000 ($529.86)
Everett government finances - Cash and Securities in 2021 (per resident):
- Bond Funds - Cash and Securities: $2,159,000 ($19.39)
- Other Funds - Cash and Securities: $268,703,000 ($2413.42)
- Sinking Funds - Cash and Securities: $1,760,000 ($15.81)
7.60% of this county's 2021 resident taxpayers lived in other counties in 2020 ($97,930 average adjusted gross income)
| Here: | 7.60% |
| Washington average: | 7.53% |
0.04% of residents moved from foreign countries ($285 average AGI)
Snohomish County: 0.04% Washington average: 0.05%
Top counties from which taxpayers relocated into this county between 2020 and 2021:
| from King County, WA | |
| from Pierce County, WA | |
| from Skagit County, WA |
7.20% of this county's 2020 resident taxpayers moved to other counties in 2021 ($85,049 average adjusted gross income)
| Here: | 7.20% |
| Washington average: | 7.40% |
0.02% of residents moved to foreign countries ($153 average AGI)
Snohomish County: 0.02% Washington average: 0.04%
Top counties to which taxpayers relocated from this county between 2020 and 2021:
| to King County, WA | |
| to Pierce County, WA | |
| to Skagit County, WA |
| Businesses in Everett, WA | ||||
| Name | Count | Name | Count | |
|---|---|---|---|---|
| 24 Hour Fitness | 1 | Macy's | 1 | |
| 7-Eleven | 8 | MasterBrand Cabinets | 6 | |
| AT&T | 7 | Mazda | 1 | |
| Ace Hardware | 2 | McDonald's | 5 | |
| Aeropostale | 1 | Motel 6 | 2 | |
| Albertsons | 2 | Motherhood Maternity | 1 | |
| Applebee's | 2 | New Balance | 2 | |
| Arby's | 1 | Nike | 13 | |
| AutoZone | 2 | Nissan | 1 | |
| Baja Fresh Mexican Grill | 1 | Office Depot | 1 | |
| Baskin-Robbins | 5 | Old Navy | 1 | |
| Bath & Body Works | 1 | Olive Garden | 1 | |
| Bed Bath & Beyond | 1 | Outback | 1 | |
| Best Western | 2 | Outback Steakhouse | 1 | |
| Blockbuster | 2 | Pac Sun | 1 | |
| Budget Car Rental | 1 | Panda Express | 2 | |
| Burger King | 2 | Papa John's Pizza | 2 | |
| Catherines | 1 | Payless | 2 | |
| Cinnabon | 1 | Penske | 1 | |
| Cold Stone Creamery | 1 | PetSmart | 1 | |
| Costco | 1 | Pier 1 Imports | 1 | |
| Curves | 1 | Pizza Hut | 3 | |
| DHL | 2 | Qdoba Mexican Grill | 1 | |
| Dairy Queen | 3 | Quality | 1 | |
| Days Inn | 1 | Quiznos | 3 | |
| Dennys | 3 | RadioShack | 3 | |
| Discount Tire | 1 | Red Robin | 1 | |
| Domino's Pizza | 1 | Rite Aid | 2 | |
| Extended Stay America | 1 | Rue21 | 1 | |
| Extended Stay Deluxe | 1 | SAS Shoes | 1 | |
| Famous Footwear | 1 | Safeway | 1 | |
| Fashion Bug | 1 | Sears | 3 | |
| FedEx | 14 | Spencer Gifts | 1 | |
| Firestone Complete Auto Care | 1 | Sprint Nextel | 2 | |
| Foot Locker | 1 | Staples | 1 | |
| Ford | 1 | Starbucks | 18 | |
| GNC | 2 | Subway | 11 | |
| GameStop | 2 | T-Mobile | 6 | |
| H&R Block | 8 | T.J.Maxx | 1 | |
| Hobby Lobby | 1 | Taco Bell | 4 | |
| Holiday Inn | 2 | Target | 1 | |
| Home Depot | 1 | Toyota | 1 | |
| Honda | 1 | Toys"R"Us | 1 | |
| Hot Topic | 1 | Trader Joe's | 1 | |
| IHOP | 2 | Travelodge | 1 | |
| Jack In The Box | 6 | True Value | 1 | |
| Jamba Juice | 2 | U-Haul | 6 | |
| Jimmy John's | 1 | UPS | 16 | |
| Jones New York | 3 | Vans | 2 | |
| Journeys | 1 | Verizon Wireless | 2 | |
| KFC | 3 | Victoria's Secret | 1 | |
| Kmart | 1 | Village Inn | 1 | |
| Kroger | 6 | Volkswagen | 1 | |
| LA Fitness | 1 | Vons | 5 | |
| La Quinta | 1 | Walgreens | 4 | |
| La-Z-Boy | 1 | Walmart | 1 | |
| Lane Furniture | 2 | Wendy's | 4 | |
| Little Caesars Pizza | 2 | Wet Seal | 1 | |
| Long John Silver's | 1 | YMCA | 4 | |
| Lowe's | 1 | |||
Strongest AM radio stations in Everett:
- KRKO (1380 AM; 50 kW; EVERETT, WA; Owner: S-R BROADCASTING, CO.)
- KWYZ (1230 AM; 1 kW; EVERETT, WA; Owner: RADIO HANKOOK, INC.)
- KIXI (880 AM; 50 kW; MERCER ISLAND/SEATTL, WA; Owner: BELLEVUE RADIO, INC.)
- KKOL (1300 AM; 50 kW; SEATTLE, WA; Owner: INSPIRATION MEDIA, INC.)
- KIRO (710 AM; 50 kW; SEATTLE, WA; Owner: ENTERCOM SEATTLE LICENSE, LLC)
- KGNW (820 AM; 50 kW; BURIEN-SEATTLE, WA; Owner: INSPIRATION MEDIA, INC.)
- KTTH (770 AM; 50 kW; SEATTLE, WA; Owner: ENTERCOM SEATTLE LICENSE, LLC)
- KOMO (1000 AM; 50 kW; SEATTLE, WA; Owner: FISHER BROADCASTING - SEATTLE RADIO, L.L.C.)
- KCIS (630 AM; 5 kW; EDMONDS, WA; Owner: CRISTA MINISTRIES)
- KYCW (1090 AM; 50 kW; SEATTLE, WA; Owner: INFINITY RADIO SUBSIDIARY OPERATIONS INC.)
- KJR (950 AM; 50 kW; SEATTLE, WA)
- KKNW (1150 AM; 10 kW; SEATTLE, WA; Owner: ORCA RADIO, INC.)
- KAPS (660 AM; 10 kW; MOUNT VERNON, WA; Owner: VALLEY BROADCASTERS, INC.)
Strongest FM radio stations in Everett:
- KSER (90.7 FM; EVERETT, WA; Owner: KSER FOUNDATION)
- KISW (99.9 FM; SEATTLE, WA; Owner: ENTERCOM SEATTLE LICENSE, LLC)
- KCMS (105.3 FM; EDMONDS, WA; Owner: CRISTA MINISTRIES, INC.)
- KQBZ (100.7 FM; SEATTLE, WA; Owner: ENTERCOM SEATTLE LICENSE, LLC)
- K205DL (88.9 FM; GRANITE FALLS/EVERET, WA; Owner: CALVARY CHAPEL OF TWIN FALLS, INC.)
- K213BM (90.5 FM; EVERETT, ETC., WA; Owner: JACK STRAW FOUNDATION)
- KMTT (103.7 FM; TACOMA, WA; Owner: ENTERCOM SEATTLE LICENSE, LLC)
- KNDD (107.7 FM; SEATTLE, WA; Owner: ENTERCOM SEATTLE LICENSE, LLC)
- KYPT (96.5 FM; SEATTLE, WA; Owner: INFINITY RADIO SUBSIDIARY OPERATIONS INC.)
- KBSG-FM (97.3 FM; TACOMA, WA; Owner: ENTERCOM SEATTLE LICENSE, LLC)
- KBKS (106.1 FM; TACOMA, WA; Owner: INFINITY RADIO SUBSIDIARY OPERATIONS INC.)
- KING-FM (98.1 FM; SEATTLE, WA; Owner: CLASSIC RADIO, INC.)
- KLSY-FM (92.5 FM; BELLEVUE, WA; Owner: BELLEVUE RADIO INC.)
- KPLU-FM (88.5 FM; TACOMA, WA; Owner: PACIFIC LUTHERAN UNIVERSITY, INC.)
- KWJZ (98.9 FM; SEATTLE, WA; Owner: ORCA RADIO, INC.)
- KZOK-FM (102.5 FM; SEATTLE, WA; Owner: INFINITY RADIO SUBSIDIARY OPERATIONS INC.)
- KMPS-FM (94.1 FM; SEATTLE, WA; Owner: INFINITY RADIO SUBSIDIARY OPERATIONS INC.)
- KRWM (106.9 FM; BREMERTON, WA; Owner: SEASCAPE RADIO, INC.)
- K206CU (89.1 FM; MOUNT VERNON, WA; Owner: CALVARY CHAPEL OF TWIN FALLS, INC.)
- KJR-FM (95.7 FM; SEATTLE, WA; Owner: ACKERLEY MEDIA GROUP, INC.)
TV broadcast stations around Everett:
- K29ED (Channel 29; EVERETT, WA; Owner: TRIBUNE TELEVISION HOLDINGS, INC.)
- KING-TV (Channel 5; SEATTLE, WA; Owner: KING BROADCASTING COMPANY)
- KSTW (Channel 11; TACOMA, WA; Owner: UPN TELEVISION STATIONS INC.)
- K58DP (Channel 58; SEATTLE, WA; Owner: WORD OF GOD FELLOWSHIP, INC.)
- KTWB-TV (Channel 22; SEATTLE, WA; Owner: TRIBUNE TELEVISION HOLDINGS, INC.)
- KOMO-TV (Channel 4; SEATTLE, WA; Owner: FISHER BROADCASTING - SEATTLE TV, L.L.C.)
- KIRO-TV (Channel 7; SEATTLE, WA; Owner: KIRO-TV HOLDINGS, INC.)
- KCTS-TV (Channel 9; SEATTLE, WA; Owner: KCTS TELEVISION)
- KHCV (Channel 45; SEATTLE, WA; Owner: NORTH PACIFIC INTERNATIONAL TELEVISION, INC.)
- KWPX (Channel 33; BELLEVUE, WA; Owner: PAXSON COMMUNICATIONS LICENSE COMPANY, LLC)
- K57HB (Channel 57; EUREKA, CA; Owner: MS COMMUNICATIONS, LLC)
- KONG-TV (Channel 16; EVERETT, WA; Owner: KONG-TV, INC.)
- KCPQ (Channel 13; TACOMA, WA; Owner: TRIBUNE TELEVISION NORTHWEST, INC.)
- KWDK (Channel 56; TACOMA, WA; Owner: PUGET SOUND EDUCATIONAL TV, INC.)
- K68DL (Channel 68; SEATTLE, WA; Owner: THREE ANGELS BROADCASTING NETWORK)
- K58BW (Channel 58; EVERETT, WA; Owner: KIRO-TV HOLDINGS, INC.)
- National Bridge Inventory (NBI) Statistics
- 126Number of bridges
- 5,469ft / 1,667mTotal length
- $1,001,210,000Total costs
- 4,805,444Total average daily traffic
- 288,242Total average daily truck traffic
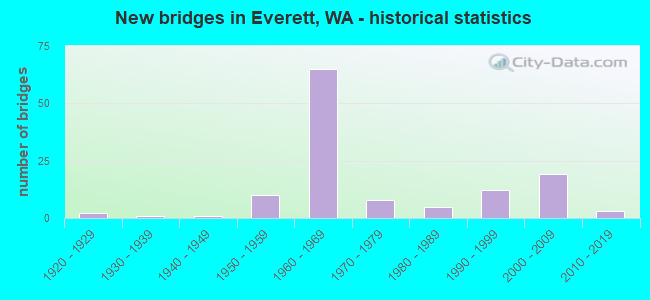
- New bridges - historical statistics
- 21920-1929
- 11930-1939
- 11940-1949
- 101950-1959
- 651960-1969
- 81970-1979
- 51980-1989
- 121990-1999
- 192000-2009
- 32010-2019
FCC Registered Antenna Towers: 419 (See the full list of FCC Registered Antenna Towers)
FCC Registered Commercial Land Mobile Towers: 8 (See the full list of FCC Registered Commercial Land Mobile Towers in Everett, WA)
FCC Registered Private Land Mobile Towers: 11 (See the full list of FCC Registered Private Land Mobile Towers)
FCC Registered Broadcast Land Mobile Towers: 115 (See the full list of FCC Registered Broadcast Land Mobile Towers)
FCC Registered Microwave Towers: 89 (See the full list of FCC Registered Microwave Towers in this town)
FCC Registered Paging Towers: 21 (See the full list of FCC Registered Paging Towers)
FCC Registered Maritime Coast & Aviation Ground Towers: 26 (See the full list of FCC Registered Maritime Coast & Aviation Ground Towers)
FCC Registered Amateur Radio Licenses: 1,286 (See the full list of FCC Registered Amateur Radio Licenses in Everett)
FAA Registered Aircraft Manufacturers and Dealers: 4 (See the full list of FAA Registered Manufacturers and Dealers in Everett)
FAA Registered Aircraft: 160 (See the full list of FAA Registered Aircraft)
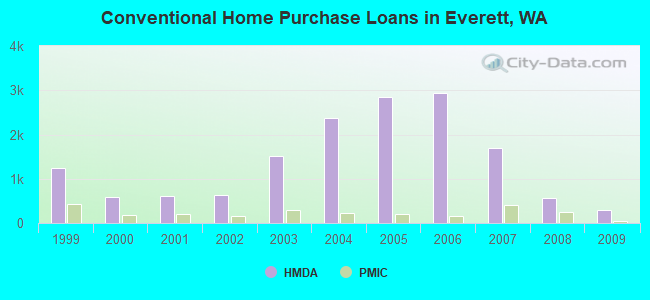
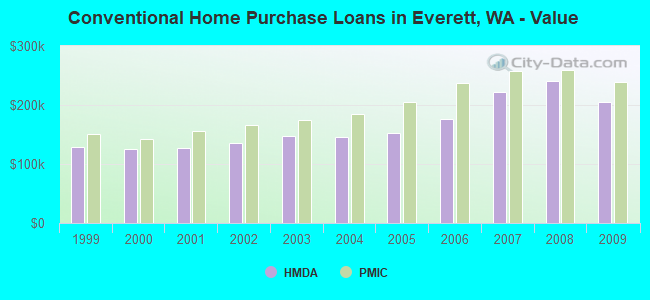
| Home Mortgage Disclosure Act Aggregated Statistics For Year 2009 (Based on 17 full and 11 partial tracts) | ||||||||||||||
| A) FHA, FSA/RHS & VA Home Purchase Loans | B) Conventional Home Purchase Loans | C) Refinancings | D) Home Improvement Loans | E) Loans on Dwellings For 5+ Families | F) Non-occupant Loans on < 5 Family Dwellings (A B C & D) | G) Loans On Manufactured Home Dwelling (A B C & D) | ||||||||
|---|---|---|---|---|---|---|---|---|---|---|---|---|---|---|
| Number | Average Value | Number | Average Value | Number | Average Value | Number | Average Value | Number | Average Value | Number | Average Value | Number | Average Value | |
| LOANS ORIGINATED | 434 | $229,846 | 302 | $204,720 | 2,128 | $225,314 | 69 | $138,747 | 13 | $2,219,308 | 169 | $188,648 | 18 | $138,209 |
| APPLICATIONS APPROVED, NOT ACCEPTED | 26 | $233,057 | 59 | $207,837 | 255 | $232,651 | 26 | $66,955 | 2 | $727,500 | 21 | $174,174 | 1 | $71,390 |
| APPLICATIONS DENIED | 57 | $212,752 | 73 | $192,416 | 770 | $243,113 | 45 | $95,570 | 4 | $969,882 | 90 | $201,420 | 21 | $107,332 |
| APPLICATIONS WITHDRAWN | 69 | $233,370 | 49 | $204,447 | 585 | $237,860 | 23 | $132,584 | 1 | $1,007,270 | 67 | $221,134 | 3 | $240,370 |
| FILES CLOSED FOR INCOMPLETENESS | 12 | $211,901 | 12 | $172,156 | 135 | $227,051 | 5 | $162,552 | 1 | $210,790 | 10 | $236,321 | 2 | $118,570 |
Detailed mortgage data for all 28 tracts in Everett, WA
| Private Mortgage Insurance Companies Aggregated Statistics For Year 2009 (Based on 15 full and 11 partial tracts) | ||||
| A) Conventional Home Purchase Loans | B) Refinancings | |||
|---|---|---|---|---|
| Number | Average Value | Number | Average Value | |
| LOANS ORIGINATED | 45 | $239,751 | 46 | $254,587 |
| APPLICATIONS APPROVED, NOT ACCEPTED | 14 | $254,391 | 32 | $266,555 |
| APPLICATIONS DENIED | 12 | $235,842 | 27 | $281,780 |
| APPLICATIONS WITHDRAWN | 2 | $228,500 | 8 | $275,644 |
| FILES CLOSED FOR INCOMPLETENESS | 1 | $284,740 | 1 | $406,480 |
2002 - 2018 National Fire Incident Reporting System (NFIRS) incidents
- Fire incident types reported to NFIRS in Everett, WA
- 3,71447.6%Outside Fires
- 2,34930.1%Structure Fires
- 1,23015.8%Mobile Property/Vehicle Fires
- 5046.5%Other
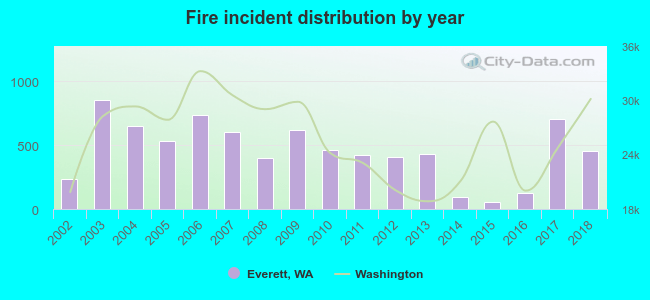 Based on the data from the years 2002 - 2018 the average number of fire incidents per year is 459. The highest number of fires - 852 took place in 2003, and the least - 56 in 2015. The data has a growing trend.
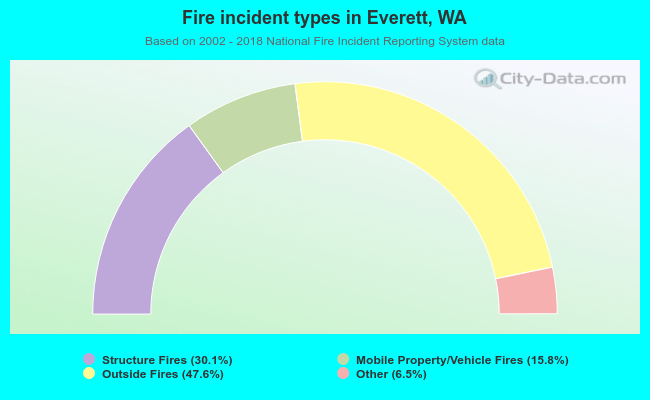 When looking into fire subcategories, the most reports belonged to: Outside Fires (47.6%), and Structure Fires (30.1%).
Fire-safe hotels and motels in Everett, Washington:
- La Quinta Inn, 12619 4th Ave W, Everett, Washington 98204 , Phone: (425) 347-9099, Fax: (425) 348-3048
- Holiday Inn Everett, 3105 Pine St, Everett, Washington 98201 , Phone: (425) 339-2000, Fax: (425) 339-3348
- Extended Stay America - Seattle - Everett - North, 8410 Broadway, Everett, Washington 98208 , Phone: (425) 355-1923, Fax: (425) 267-9722
- Extended Stay America - Seattle - Everett - Silverlake, 1431 112th St SE, Everett, Washington 98208 , Phone: (425) 337-1341, Fax: (425) 337-1721
- Holiday Inn Express & Suites Everett, 131 128th St SW, Everett, Washington 98208 , Phone: (425) 609-4000, Fax: (425) 609-4010
- Days Inn, 1602 SE Everett Mall Way, Everett, Washington 98208 , Phone: (425) 355-1570, Fax: (425) 347-3381
- Hampton Inn Seattle Everett/Downtown, 2931 W Marine View Dr, Everett, Washington 98201 , Phone: (425) 349-4466, Fax: (425) 349-4678
- Courtyard by Marriott - Seattle North/Everett Downtown, 3003 Colby Ave, Everett, Washington 98201 , Phone: (425) 259-2200
- 4 other hotels and motels
| Most common first names in Everett, WA among deceased individuals | ||
| Name | Count | Lived (average) |
|---|---|---|
| John | 691 | 74.7 years |
| William | 584 | 74.6 years |
| Robert | 540 | 71.6 years |
| Mary | 432 | 79.7 years |
| James | 391 | 70.8 years |
| George | 323 | 76.7 years |
| Charles | 314 | 74.6 years |
| Margaret | 289 | 80.2 years |
| Helen | 282 | 80.8 years |
| Dorothy | 245 | 78.7 years |
| Most common last names in Everett, WA among deceased individuals | ||
| Last name | Count | Lived (average) |
|---|---|---|
| Johnson | 374 | 77.7 years |
| Smith | 245 | 74.4 years |
| Anderson | 244 | 78.3 years |
| Nelson | 180 | 76.9 years |
| Miller | 142 | 75.9 years |
| Thompson | 134 | 77.0 years |
| Brown | 130 | 75.5 years |
| Olson | 121 | 76.7 years |
| Peterson | 112 | 77.6 years |
| Wilson | 108 | 74.7 years |

- 48.6%Electricity
- 44.9%Utility gas
- 2.8%Bottled, tank, or LP gas
- 1.9%Wood
- 1.2%Fuel oil, kerosene, etc.
- 0.3%Other fuel
- 0.2%No fuel used

- 86.3%Electricity
- 11.0%Utility gas
- 0.7%Wood
- 0.7%No fuel used
- 0.6%Bottled, tank, or LP gas
- 0.3%Fuel oil, kerosene, etc.
- 0.2%Other fuel
- 0.1%Solar energy
Everett compared to Washington state average:
- Unemployed percentage below state average.
- Foreign-born population percentage above state average.
- Renting percentage above state average.
Everett, WA compared to other similar cities:
Everett on our top lists:
- #3 on the list of "Top 101 cities with the lowest average sunshine amount (population 50,000+)"
- #3 on the list of "Top 101 cities with the lowest maximum monthly sunshine amount (population 50,000+)"
- #3 on the list of "Top 101 cities with the lowest minimum monthly sunshine amount (population 50,000+)"
- #8 on the list of "Top 101 cities with the lowest average wind speeds (population 50,000+)"
- #13 on the list of "Top 101 cities with the largest percentage of people in military ships (population 1,000+)"
- #15 on the list of "Top 101 cities with the least people having Doctorate degrees (population 50,000+)"
- #24 on the list of "Top 101 cities with largest percentage of males in occupations: installation, maintenance, and repair occupations (population 50,000+)"
- #27 on the list of "Top 101 cities with largest percentage of males in industries: manufacturing (population 50,000+)"
- #27 on the list of "Top 101 cities with the highest average humidity (population 50,000+)"
- #28 on the list of "Top 101 cities with largest percentage of females in industries: arts, entertainment, and recreation (population 50,000+)"
- #28 on the list of "Top 101 cities with the highest number of auto thefts per 100,000 residents, excludes tourist destinations and others with a lot of outsiders visiting based on city industries data (population 50,000+)"
- #34 on the list of "Top 101 cities with largest percentage of females in occupations: construction and extraction occupations (population 50,000+)"
- #37 on the list of "Top 101 cities with largest percentage of females in occupations: personal care and service occupations (population 50,000+)"
- #40 on the list of "Top 101 cities with largest percentage of males in industries: management of companies and enterprises (population 50,000+)"
- #44 on the list of "Top 100 cities with the largest percentage of males (pop. 50,000+)"
- #44 on the list of "Top 101 cities with the highest number of thefts per 100,000 residents, excludes tourist destinations and others with a lot of outsiders visiting based on city industries data (population 50,000+)"
- #45 on the list of "Top 100 high-educated but low-earning cities (pop. 50,000+)"
- #45 on the list of "Top 101 cities with the highest maximum monthly morning or afternoon humidity (population 50,000+)"
- #61 on the list of "Top 101 cities with largest percentage of males in occupations: architecture and engineering occupations (population 50,000+)"
- #65 on the list of "Top 101 cities with the largest percentage of unmarried partner households (population 50,000+)"
- #62 (98204) on the list of "Top 101 zip codes with the largest percentage of Ukrainian first ancestries"
- #24 on the list of "Top 101 counties with the lowest Particulate Matter (PM2.5) Annual air pollution readings in 2012 (µg/m3)"
- #45 on the list of "Top 101 counties with the lowest number of infant deaths per 1000 residents 2007-2013 (pop. 50,000+)"
- #46 on the list of "Top 101 counties with the highest percentage of residents that exercised in the past month"
- #48 on the list of "Top 101 counties with the highest average weight of females"
- #60 on the list of "Top 101 counties with the most Other congregations (pop. 50,000+)"

|
|
Total of 1291 patent applications in 2008-2024.