The comparison between living in East Seattle, Washington and Everett, Washington reveals varying contrasts and similarities. From employment opportunities to cultural activities, education, cost of living, infrastructure, and tax systems, each city has its unique characteristics and advantages. Whether you're looking to relocate or planning a brief vacation, both cities offer diverse options to suit different preferences.
In comparison, East Seattle has lower crime rates than Everett which makes it safer for both residents and tourists. Everett, while still safer than many U.S. cities, has a slightly higher crime rate. Both cities have local law enforcement agencies actively working to maintain safety. Additionally, various community programs are set up in both cities to ensure the safety of its residents and visitors.
Cost of Living
The cost of living in East Seattle is generally higher than in Everett. This is largely due to higher housing costs in East Seattle, driven by its proximity to downtown Seattle. However, Everett offers more affordable housing options making it a better choice for budget-conscious families and individuals.
Income Tax
There's no state or city income tax in either East Seattle or Everett, so citizens in both cities enjoy this financial advantage.
Property Tax
Property tax rates in East Seattle are higher due to the more expensive real estate compared to Everett. Anyone considering investing in property should account for this difference.
Sales Tax
Both cities share the same state sales tax rate as they are in the same state, Washington. However, Everett has a slightly higher local sales tax rate compared to East Seattle.
Income
Type
East Seattle
Everett
Estimated median household income
$135,835
$70,023
Estimated per capita income
$77,151
$38,113
Cost of living index (U.S. average is 100)
128.6
113.7
If you make $50,000 in Everett, you will have to make $56,552 in East Seattle to maintain the same standard of living.
Geographical Conditions
Both cities are closely situated to natural wonders. East Seattle residents enjoy views of Lake Sammamish and the Cascade Mountains, while Everett sits by Puget Sound, offering great water and mountain views.
Geographical information
Type
East Seattle
Everett
Land area
217.1 sq. miles
32.5 sq. miles
Population density
2,361.6 people per sq. mile
3,409.1 people per sq. mile
Relative area comparison
East Seattle, WA Everett, WA
Education
East Seattle offers access to a higher number of top-rated schools and has a larger concentration of residents with bachelor's or higher degrees compared to Everett. However, Everett also has some excellent schools, as well as options for higher education, including Everett Community College.
While both cities have healthy economies, there's more job diversity in East Seattle, thanks to its wider range of businesses and industries. Everett, with its focus on manufacturing and aerospace industries, offers more specialist roles, especially for those interested in these sectors.
Biggest Employers
Microsoft and Amazon, two of the biggest names in the tech industry, are major employers in East Seattle. On the other hand, Everett is home to Boeing’s largest assembly plant, ensuring the aerospace company remains one of the city's biggest employers.
In East Seattle (King County), 69.0% voted for Democrats and 28.5% for Republicans in 2012 Presidential Election. In Everett (Snohomish County), 56.9% voted for Democrats and 40.2% for Republicans.
Elections
Type
Democrats
Republicans
Other
Year
East Seattle
Everett
East Seattle
Everett
East Seattle
Everett
2020
75.1%
58.6%
22.3%
38.0%
2.6%
3.4%
2016
70.0%
52.3%
21.1%
36.2%
8.9%
11.4%
2012
69.0%
56.9%
28.5%
40.2%
2.5%
2.9%
2008
70.2%
58.2%
28.1%
39.4%
1.7%
2.4%
2004
65.1%
53.2%
33.8%
45.6%
1.1%
1.2%
2000
60.3%
51.8%
34.5%
43.8%
5.2%
4.4%
1996
56.4%
49.6%
31.4%
37.1%
12.2%
13.3%
Breakdown of population affiliated with a religious congregation
Type
Adherents
Congregations
Religion
East Seattle
Everett
East Seattle
Everett
CATHOLIC CHURCH
14.4%
10.6%
4.9%
3.1%
EVANGELICAL LUTHERAN CHURCH IN AMERICA
1.3%
1.5%
4.7%
4.7%
EPISCOPAL CHURCH
0.8%
0.2%
2.4%
1.4%
AMERICAN BAPTIST CHURCHES IN THE USA
0.6%
0.2%
2.9%
1.8%
MUSLIM ESTIMATE
0.6%
0.5%
1.4%
1.0%
SEVENTH DAY ADVENTIST CHURCH
0.6%
0.4%
2.3%
2.7%
LUTHERAN CHURCH
0.5%
0.3%
2.0%
2.1%
SOUTHERN BAPTIST CONVENTION
0.3%
0.3%
3.8%
6.4%
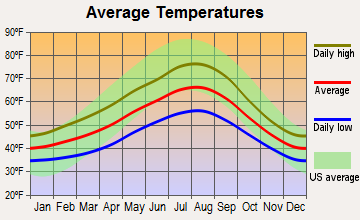
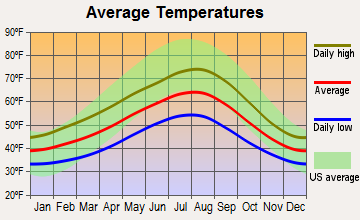
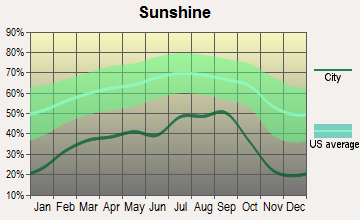
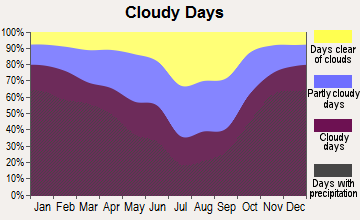
Weather
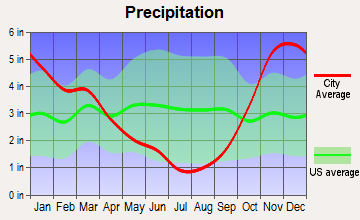
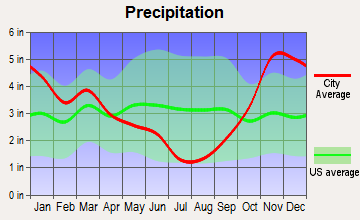
Both cities are located in Washington State and share a similar northwest coastal climate: cool, wet winters and warm, dry summers. Rain is common in both cities, but East Seattle generally experiences slightly more rainfall. However, the differences are minor, and those who enjoy a temperate maritime climate would be comfortable in either city.
Weather and climate
Type
East Seattle
Everett
Temperature - Average
52.5°F
51.1°F
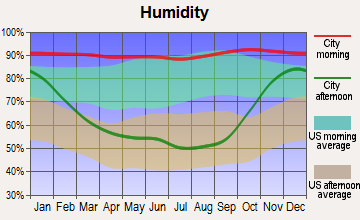
Humidity - Average morning or afternoon humidity
78.5%
78.8%
Humidity - Differences between morning and afternoon humidity
38%
38.1%
Humidity - Maximum monthly morning or afternoon humidity
86%
86.3%
Humidity - Minimum monthly morning or afternoon humidity
48%
48.2%
Precipitation - Yearly average
36.8 in
37.6 in
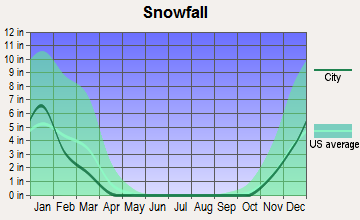
Snowfall - Yearly average
21.4 in
21.9 in
Clouds - Number of days clear of clouds
11.7%
11.5%
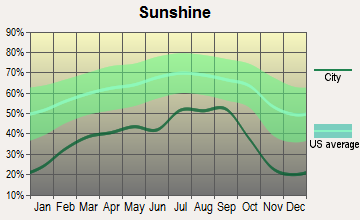
Sunshine amount - Average
49.4%
49.2%
Sunshine amount - Differences during a year
44%
43.8%
Sunshine amount - Maximum monthly
64%
63.7%
Sunshine amount - Minimum monthly
20%
19.9%
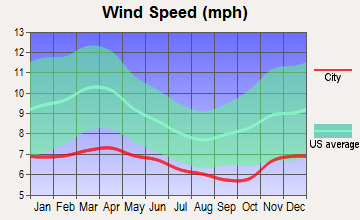
Wind speed - Average
8.6 mph
8.4 mph
Average climate in East Seattle, Washington
Average climate in Everett, Washington
Air pollution
Type
AQI
CO
NO2
OZONE
PB
PM10
PM25
SO2
Year
East Seattle
Everett
East Seattle
Everett
East Seattle
East Seattle
East Seattle
Everett
East Seattle
East Seattle
Everett
East Seattle
2018
85
79
0.21
N/A
10.6
N/A
21.0
N/A
N/A
N/A
N/A
N/A
5.1
7.9
0.7
N/A
2017
100
81
0.23
N/A
11.1
N/A
21.2
N/A
N/A
N/A
N/A
N/A
4.6
7.5
0.3
N/A
2016
67
62
0.22
N/A
11.9
N/A
20.2
N/A
N/A
N/A
N/A
N/A
3.8
5.9
0.6
N/A
2015
88
85
0.23
N/A
10.8
N/A
19.4
N/A
N/A
N/A
N/A
N/A
5.6
7.4
0.8
N/A
2014
75
77
0.24
N/A
11.5
N/A
19.5
N/A
N/A
N/A
N/A
N/A
5.7
6.8
N/A
N/A
2013
81
79
0.24
N/A
N/A
N/A
17.2
N/A
N/A
N/A
N/A
N/A
5.9
7.2
0.8
N/A
2012
83
77
0.23
N/A
N/A
N/A
19.3
N/A
N/A
N/A
N/A
N/A
5.2
6.0
1.0
N/A
2011
73
72
0.24
N/A
N/A
N/A
18.6
N/A
N/A
N/A
N/A
N/A
5.2
6.7
1.1
N/A
2010
73
64
0.24
N/A
N/A
N/A
18.0
N/A
N/A
N/A
N/A
N/A
4.4
5.9
1.1
N/A
2009
94
78
0.27
N/A
N/A
N/A
18.3
N/A
N/A
N/A
N/A
N/A
6.0
8.1
1.4
N/A
2008
80
72
0.30
N/A
N/A
N/A
17.8
N/A
N/A
N/A
N/A
N/A
5.4
7.6
1.3
N/A
2007
85
80
0.30
N/A
N/A
N/A
17.7
N/A
N/A
N/A
19.0
N/A
6.4
8.9
1.5
N/A
2006
102
86
N/A
N/A
N/A
N/A
18.4
N/A
N/A
N/A
21.1
N/A
7.2
8.9
N/A
N/A
2005
104
92
0.80
0.87
18.3
N/A
N/A
N/A
N/A
N/A
22.9
N/A
7.6
9.5
3.5
N/A
2004
110
95
0.81
1.01
17.9
N/A
N/A
N/A
N/A
N/A
N/A
N/A
8.3
9.9
3.0
N/A
2003
100
88
0.85
0.83
18.5
N/A
N/A
N/A
N/A
N/A
N/A
N/A
8.3
10.2
2.4
N/A
2002
90
84
1.07
0.75
19.3
N/A
N/A
N/A
N/A
N/A
N/A
N/A
10.7
10.1
2.7
N/A
2001
91
83
1.08
1.01
20.5
N/A
N/A
N/A
0.004
0.005
N/A
N/A
11.1
10.5
3.7
N/A
2000
99
88
1.21
1.25
20.9
N/A
N/A
N/A
N/A
N/A
N/A
N/A
12.1
11.5
3.2
N/A
Natural disasters
Type
East Seattle
Everett
Tornado activity compared to U.S. average
5.5%
5%
Earthquake activity compared to U.S. average
1,403%
1,314.4%
Natural disasters compared to U.S. average
30%
31%
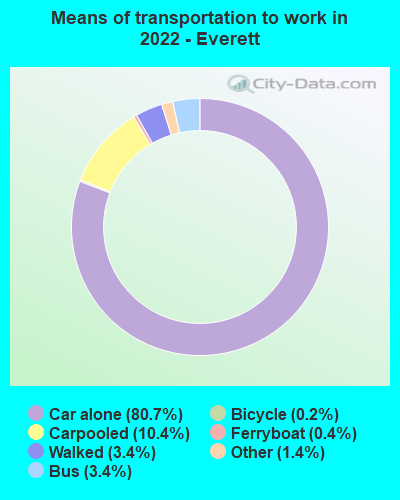
Transportation
East Seattle boasts superior public transit and less commuting time due to its proximity to Seattle city center. Everett also has a sound public transit system, and while the commuting time may be longer, traffic is significantly lower.
Transport
Type
East Seattle
Everett
Amtrak stations
0
1
Amtrak stations nearby
3
3
FAA registered aircraft
0
160
FAA registered aircraft manufacturers and dealers
0
4
Means of transportation to work
Type
East Seattle
Everett
Bicycle
0.3%
0.2%
Bus
5%
2.3%
Carpooled
11%
9.8%
Car alone
76.3%
84.5%
Ferryboat
0%
0.5%
Motorcycle
0.1%
0.1%
Taxicab
0%
0.1%
Walked
1.7%
1.2%
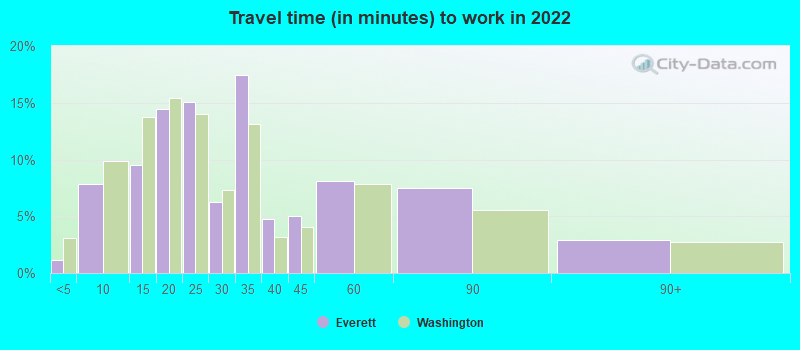
Average travel time to work
Type
East Seattle
Everett
Average
25 min
29.3 min
Real Estate
East Seattle's real estate is pricier, with a higher median home price compared to Everett, reflecting its overall higher cost of living. However, the market in both cities is robust, offering a range of properties for renters and buyers.
Neighborhoods
Both cities have several distinctive neighborhoods. Those in East Seattle are dynamic, culturally diverse and offer urban conveniences. Meanwhile, Everett's neighborhoods are more residential and family-friendly, with a quieter, more suburban feel.
Houses and residents
Type
East Seattle
Everett
Houses
199,933
48,306
Average household size (people)
2.5
2.4
Houses occupied
191,630 (95.8%)
45,029 (93.2%)
Houses occupied by owners
128,209 (66.9%)
21,308 (47.3%)
Houses occupied by renters
63,421 (33.1%)
23,721 (52.7%)
Median rent asked for vacant for-rent units
$2,281
$1,536
Median price asked for vacant for-sale houses and condos
$820,468
$872,850
Estimated median house or condo value
$877,325
$496,900
Median number of rooms in apartments
3.5
3.9
Median number of rooms in houses and condos
7.8
6.4
Housing density (houses/condos per square mile)
920.9
1,486.1
Household income disparities
34.9%
41.4%
Housing units without a mortgage
22,582 (20.8%)
122 (0.8%)
Housing units with both a second mortgage and home equity loan
352 (0.3%)
1,618 (10.4%)
Housing units with a mortgage
85,751 (79.2%)
15,397 (99.2%)
Housing units with a home equity loan
11,674 (10.8%)
249 (1.6%)
Housing units with a second mortgage
9,796 (9%)
2,776 (17.9%)
Housing units lacking complete kitchen facilities
0.8%
2.2%
Housing units lacking complete plumbing facilities
Self-employed workers in own not incorporated business
16,907
2,084
State government workers
10,270
1,784
Unpaid family workers
584
0
Industries and Occupations
The significant employers in East Seattle are in technology, healthcare, and retail, while in Everett, aerospace, healthcare, and manufacturing industries dominate. Job seekers in high-tech and retail setting may prefer East Seattle while Everett may be more appealing to those in aviation and manufacturing.
Health care facilities in both cities are solid. East Seattle has access to numerous top-rated hospitals within the Seattle area. Everett also has highly-rated medical facilities, including the Providence Regional Medical Center.
Health (county statistics)
Type
East Seattle
Everett
General health status score of residents in this county from 1 (poor) to 5 (excellent)
East Seattle's infrastructure is more developed due to its closeness to Seattle's metropolitan area. Everett, however, also has solid infrastructure, with ongoing development in many areas. Both cities offer stable utilities, well-maintained roads, and reliable public services.
Infrastructure
Type
East Seattle
Everett
TV stations
16
16
Schools
School facilities
Type
East Seattle
Everett
Private elementary/middle schools
1
8
Private high schools
1
2
Public elementary/middle schools
2
26
Public high schools
2
15
Colleges/Universities
0
6
Culture and Food
Culturally, East Seattle is more diverse with a wider range of food options, including a range of international cuisines. Everett also offers various local and international food delights but has a closer-knit community feel with arts and cultural festivals.
Sports Teams
East Seattle benefits from its proximity to Seattle, with easy access to national sports teams like the Seattle Seahawks(NFL) and Seattle Mariners(MLB). Everett has local sports teams, like the Everett Silvertips (hockey) and Aquasox (baseball).
 East Seattle, WA
 Everett, WA