Lynnwood, Washington Submit your own pictures of this city and show them to the world
OSM Map
General Map
Google Map
MSN Map
OSM Map
General Map
Google Map
MSN Map
OSM Map
General Map
Google Map
MSN Map
OSM Map
General Map
Google Map
MSN Map
Please wait while loading the map...
Population in 2022: 43,212 (100% urban, 0% rural). Population change since 2000: +27.7%Males: 21,162 Females: 22,050
March 2022 cost of living index in Lynnwood: 116.9 (more than average, U.S. average is 100) Percentage of residents living in poverty in 2022: 14.9%for White Non-Hispanic residents , 16.7% for Black residents , 20.4% for Hispanic or Latino residents , 37.1% for Native Hawaiian and other Pacific Islander residents , 7.8% for other race residents , 22.5% for two or more races residents )
Profiles of local businesses
Business Search - 14 Million verified businesses
Data:
Median household income ($)
Median household income (% change since 2000)
Household income diversity
Ratio of average income to average house value (%)
Ratio of average income to average rent
Median household income ($) - White
Median household income ($) - Black or African American
Median household income ($) - Asian
Median household income ($) - Hispanic or Latino
Median household income ($) - American Indian and Alaska Native
Median household income ($) - Multirace
Median household income ($) - Other Race
Median household income for houses/condos with a mortgage ($)
Median household income for apartments without a mortgage ($)
Races - White alone (%)
Races - White alone (% change since 2000)
Races - Black alone (%)
Races - Black alone (% change since 2000)
Races - American Indian alone (%)
Races - American Indian alone (% change since 2000)
Races - Asian alone (%)
Races - Asian alone (% change since 2000)
Races - Hispanic (%)
Races - Hispanic (% change since 2000)
Races - Native Hawaiian and Other Pacific Islander alone (%)
Races - Native Hawaiian and Other Pacific Islander alone (% change since 2000)
Races - Two or more races (%)
Races - Two or more races (% change since 2000)
Races - Other race alone (%)
Races - Other race alone (% change since 2000)
Racial diversity
Unemployment (%)
Unemployment (% change since 2000)
Unemployment (%) - White
Unemployment (%) - Black or African American
Unemployment (%) - Asian
Unemployment (%) - Hispanic or Latino
Unemployment (%) - American Indian and Alaska Native
Unemployment (%) - Multirace
Unemployment (%) - Other Race
Population density (people per square mile)
Population - Males (%)
Population - Females (%)
Population - Males (%) - White
Population - Males (%) - Black or African American
Population - Males (%) - Asian
Population - Males (%) - Hispanic or Latino
Population - Males (%) - American Indian and Alaska Native
Population - Males (%) - Multirace
Population - Males (%) - Other Race
Population - Females (%) - White
Population - Females (%) - Black or African American
Population - Females (%) - Asian
Population - Females (%) - Hispanic or Latino
Population - Females (%) - American Indian and Alaska Native
Population - Females (%) - Multirace
Population - Females (%) - Other Race
Coronavirus confirmed cases (Apr 27, 2024)
Deaths caused by coronavirus (Apr 27, 2024)
Coronavirus confirmed cases (per 100k population) (Apr 27, 2024)
Deaths caused by coronavirus (per 100k population) (Apr 27, 2024)
Daily increase in number of cases (Apr 27, 2024)
Weekly increase in number of cases (Apr 27, 2024)
Cases doubled (in days) (Apr 27, 2024)
Hospitalized patients (Apr 18, 2022)
Negative test results (Apr 18, 2022)
Total test results (Apr 18, 2022)
COVID Vaccine doses distributed (per 100k population) (Sep 19, 2023)
COVID Vaccine doses administered (per 100k population) (Sep 19, 2023)
COVID Vaccine doses distributed (Sep 19, 2023)
COVID Vaccine doses administered (Sep 19, 2023)
Likely homosexual households (%)
Likely homosexual households (% change since 2000)
Likely homosexual households - Lesbian couples (%)
Likely homosexual households - Lesbian couples (% change since 2000)
Likely homosexual households - Gay men (%)
Likely homosexual households - Gay men (% change since 2000)
Cost of living index
Median gross rent ($)
Median contract rent ($)
Median monthly housing costs ($)
Median house or condo value ($)
Median house or condo value ($ change since 2000)
Mean house or condo value by units in structure - 1, detached ($)
Mean house or condo value by units in structure - 1, attached ($)
Mean house or condo value by units in structure - 2 ($)
Mean house or condo value by units in structure by units in structure - 3 or 4 ($)
Mean house or condo value by units in structure - 5 or more ($)
Mean house or condo value by units in structure - Boat, RV, van, etc. ($)
Mean house or condo value by units in structure - Mobile home ($)
Median house or condo value ($) - White
Median house or condo value ($) - Black or African American
Median house or condo value ($) - Asian
Median house or condo value ($) - Hispanic or Latino
Median house or condo value ($) - American Indian and Alaska Native
Median house or condo value ($) - Multirace
Median house or condo value ($) - Other Race
Median resident age
Resident age diversity
Median resident age - Males
Median resident age - Females
Median resident age - White
Median resident age - Black or African American
Median resident age - Asian
Median resident age - Hispanic or Latino
Median resident age - American Indian and Alaska Native
Median resident age - Multirace
Median resident age - Other Race
Median resident age - Males - White
Median resident age - Males - Black or African American
Median resident age - Males - Asian
Median resident age - Males - Hispanic or Latino
Median resident age - Males - American Indian and Alaska Native
Median resident age - Males - Multirace
Median resident age - Males - Other Race
Median resident age - Females - White
Median resident age - Females - Black or African American
Median resident age - Females - Asian
Median resident age - Females - Hispanic or Latino
Median resident age - Females - American Indian and Alaska Native
Median resident age - Females - Multirace
Median resident age - Females - Other Race
Commute - mean travel time to work (minutes)
Travel time to work - Less than 5 minutes (%)
Travel time to work - Less than 5 minutes (% change since 2000)
Travel time to work - 5 to 9 minutes (%)
Travel time to work - 5 to 9 minutes (% change since 2000)
Travel time to work - 10 to 19 minutes (%)
Travel time to work - 10 to 19 minutes (% change since 2000)
Travel time to work - 20 to 29 minutes (%)
Travel time to work - 20 to 29 minutes (% change since 2000)
Travel time to work - 30 to 39 minutes (%)
Travel time to work - 30 to 39 minutes (% change since 2000)
Travel time to work - 40 to 59 minutes (%)
Travel time to work - 40 to 59 minutes (% change since 2000)
Travel time to work - 60 to 89 minutes (%)
Travel time to work - 60 to 89 minutes (% change since 2000)
Travel time to work - 90 or more minutes (%)
Travel time to work - 90 or more minutes (% change since 2000)
Marital status - Never married (%)
Marital status - Now married (%)
Marital status - Separated (%)
Marital status - Widowed (%)
Marital status - Divorced (%)
Median family income ($)
Median family income (% change since 2000)
Median non-family income ($)
Median non-family income (% change since 2000)
Median per capita income ($)
Median per capita income (% change since 2000)
Median family income ($) - White
Median family income ($) - Black or African American
Median family income ($) - Asian
Median family income ($) - Hispanic or Latino
Median family income ($) - American Indian and Alaska Native
Median family income ($) - Multirace
Median family income ($) - Other Race
Median year house/condo built
Median year apartment built
Year house built - Built 2005 or later (%)
Year house built - Built 2000 to 2004 (%)
Year house built - Built 1990 to 1999 (%)
Year house built - Built 1980 to 1989 (%)
Year house built - Built 1970 to 1979 (%)
Year house built - Built 1960 to 1969 (%)
Year house built - Built 1950 to 1959 (%)
Year house built - Built 1940 to 1949 (%)
Year house built - Built 1939 or earlier (%)
Average household size
Household density (households per square mile)
Average household size - White
Average household size - Black or African American
Average household size - Asian
Average household size - Hispanic or Latino
Average household size - American Indian and Alaska Native
Average household size - Multirace
Average household size - Other Race
Occupied housing units (%)
Vacant housing units (%)
Owner occupied housing units (%)
Renter occupied housing units (%)
Vacancy status - For rent (%)
Vacancy status - For sale only (%)
Vacancy status - Rented or sold, not occupied (%)
Vacancy status - For seasonal, recreational, or occasional use (%)
Vacancy status - For migrant workers (%)
Vacancy status - Other vacant (%)
Residents with income below the poverty level (%)
Residents with income below 50% of the poverty level (%)
Children below poverty level (%)
Poor families by family type - Married-couple family (%)
Poor families by family type - Male, no wife present (%)
Poor families by family type - Female, no husband present (%)
Poverty status for native-born residents (%)
Poverty status for foreign-born residents (%)
Poverty among high school graduates not in families (%)
Poverty among people who did not graduate high school not in families (%)
Residents with income below the poverty level (%) - White
Residents with income below the poverty level (%) - Black or African American
Residents with income below the poverty level (%) - Asian
Residents with income below the poverty level (%) - Hispanic or Latino
Residents with income below the poverty level (%) - American Indian and Alaska Native
Residents with income below the poverty level (%) - Multirace
Residents with income below the poverty level (%) - Other Race
Air pollution - Air Quality Index (AQI)
Air pollution - CO
Air pollution - NO2
Air pollution - SO2
Air pollution - Ozone
Air pollution - PM10
Air pollution - PM25
Air pollution - Pb
Crime - Murders per 100,000 population
Crime - Rapes per 100,000 population
Crime - Robberies per 100,000 population
Crime - Assaults per 100,000 population
Crime - Burglaries per 100,000 population
Crime - Thefts per 100,000 population
Crime - Auto thefts per 100,000 population
Crime - Arson per 100,000 population
Crime - City-data.com crime index
Crime - Violent crime index
Crime - Property crime index
Crime - Murders per 100,000 population (5 year average)
Crime - Rapes per 100,000 population (5 year average)
Crime - Robberies per 100,000 population (5 year average)
Crime - Assaults per 100,000 population (5 year average)
Crime - Burglaries per 100,000 population (5 year average)
Crime - Thefts per 100,000 population (5 year average)
Crime - Auto thefts per 100,000 population (5 year average)
Crime - Arson per 100,000 population (5 year average)
Crime - City-data.com crime index (5 year average)
Crime - Violent crime index (5 year average)
Crime - Property crime index (5 year average)
1996 Presidential Elections Results (%) - Democratic Party (Clinton)
1996 Presidential Elections Results (%) - Republican Party (Dole)
1996 Presidential Elections Results (%) - Other
2000 Presidential Elections Results (%) - Democratic Party (Gore)
2000 Presidential Elections Results (%) - Republican Party (Bush)
2000 Presidential Elections Results (%) - Other
2004 Presidential Elections Results (%) - Democratic Party (Kerry)
2004 Presidential Elections Results (%) - Republican Party (Bush)
2004 Presidential Elections Results (%) - Other
2008 Presidential Elections Results (%) - Democratic Party (Obama)
2008 Presidential Elections Results (%) - Republican Party (McCain)
2008 Presidential Elections Results (%) - Other
2012 Presidential Elections Results (%) - Democratic Party (Obama)
2012 Presidential Elections Results (%) - Republican Party (Romney)
2012 Presidential Elections Results (%) - Other
2016 Presidential Elections Results (%) - Democratic Party (Clinton)
2016 Presidential Elections Results (%) - Republican Party (Trump)
2016 Presidential Elections Results (%) - Other
2020 Presidential Elections Results (%) - Democratic Party (Biden)
2020 Presidential Elections Results (%) - Republican Party (Trump)
2020 Presidential Elections Results (%) - Other
Ancestries Reported - Arab (%)
Ancestries Reported - Czech (%)
Ancestries Reported - Danish (%)
Ancestries Reported - Dutch (%)
Ancestries Reported - English (%)
Ancestries Reported - French (%)
Ancestries Reported - French Canadian (%)
Ancestries Reported - German (%)
Ancestries Reported - Greek (%)
Ancestries Reported - Hungarian (%)
Ancestries Reported - Irish (%)
Ancestries Reported - Italian (%)
Ancestries Reported - Lithuanian (%)
Ancestries Reported - Norwegian (%)
Ancestries Reported - Polish (%)
Ancestries Reported - Portuguese (%)
Ancestries Reported - Russian (%)
Ancestries Reported - Scotch-Irish (%)
Ancestries Reported - Scottish (%)
Ancestries Reported - Slovak (%)
Ancestries Reported - Subsaharan African (%)
Ancestries Reported - Swedish (%)
Ancestries Reported - Swiss (%)
Ancestries Reported - Ukrainian (%)
Ancestries Reported - United States (%)
Ancestries Reported - Welsh (%)
Ancestries Reported - West Indian (%)
Ancestries Reported - Other (%)
Educational Attainment - No schooling completed (%)
Educational Attainment - Less than high school (%)
Educational Attainment - High school or equivalent (%)
Educational Attainment - Less than 1 year of college (%)
Educational Attainment - 1 or more years of college (%)
Educational Attainment - Associate degree (%)
Educational Attainment - Bachelor's degree (%)
Educational Attainment - Master's degree (%)
Educational Attainment - Professional school degree (%)
Educational Attainment - Doctorate degree (%)
School Enrollment - Nursery, preschool (%)
School Enrollment - Kindergarten (%)
School Enrollment - Grade 1 to 4 (%)
School Enrollment - Grade 5 to 8 (%)
School Enrollment - Grade 9 to 12 (%)
School Enrollment - College undergrad (%)
School Enrollment - Graduate or professional (%)
School Enrollment - Not enrolled in school (%)
School enrollment - Public schools (%)
School enrollment - Private schools (%)
School enrollment - Not enrolled (%)
Median number of rooms in houses and condos
Median number of rooms in apartments
Housing units lacking complete plumbing facilities (%)
Housing units lacking complete kitchen facilities (%)
Density of houses
Urban houses (%)
Rural houses (%)
Households with people 60 years and over (%)
Households with people 65 years and over (%)
Households with people 75 years and over (%)
Households with one or more nonrelatives (%)
Households with no nonrelatives (%)
Population in households (%)
Family households (%)
Nonfamily households (%)
Population in families (%)
Family households with own children (%)
Median number of bedrooms in owner occupied houses
Mean number of bedrooms in owner occupied houses
Median number of bedrooms in renter occupied houses
Mean number of bedrooms in renter occupied houses
Median number of vehichles in owner occupied houses
Mean number of vehichles in owner occupied houses
Median number of vehichles in renter occupied houses
Mean number of vehichles in renter occupied houses
Mortgage status - with mortgage (%)
Mortgage status - with second mortgage (%)
Mortgage status - with home equity loan (%)
Mortgage status - with both second mortgage and home equity loan (%)
Mortgage status - without a mortgage (%)
Average family size
Average family size - White
Average family size - Black or African American
Average family size - Asian
Average family size - Hispanic or Latino
Average family size - American Indian and Alaska Native
Average family size - Multirace
Average family size - Other Race
Geographical mobility - Same house 1 year ago (%)
Geographical mobility - Moved within same county (%)
Geographical mobility - Moved from different county within same state (%)
Geographical mobility - Moved from different state (%)
Geographical mobility - Moved from abroad (%)
Place of birth - Born in state of residence (%)
Place of birth - Born in other state (%)
Place of birth - Native, outside of US (%)
Place of birth - Foreign born (%)
Housing units in structures - 1, detached (%)
Housing units in structures - 1, attached (%)
Housing units in structures - 2 (%)
Housing units in structures - 3 or 4 (%)
Housing units in structures - 5 to 9 (%)
Housing units in structures - 10 to 19 (%)
Housing units in structures - 20 to 49 (%)
Housing units in structures - 50 or more (%)
Housing units in structures - Mobile home (%)
Housing units in structures - Boat, RV, van, etc. (%)
House/condo owner moved in on average (years ago)
Renter moved in on average (years ago)
Year householder moved into unit - Moved in 1999 to March 2000 (%)
Year householder moved into unit - Moved in 1995 to 1998 (%)
Year householder moved into unit - Moved in 1990 to 1994 (%)
Year householder moved into unit - Moved in 1980 to 1989 (%)
Year householder moved into unit - Moved in 1970 to 1979 (%)
Year householder moved into unit - Moved in 1969 or earlier (%)
Means of transportation to work - Drove car alone (%)
Means of transportation to work - Carpooled (%)
Means of transportation to work - Public transportation (%)
Means of transportation to work - Bus or trolley bus (%)
Means of transportation to work - Streetcar or trolley car (%)
Means of transportation to work - Subway or elevated (%)
Means of transportation to work - Railroad (%)
Means of transportation to work - Ferryboat (%)
Means of transportation to work - Taxicab (%)
Means of transportation to work - Motorcycle (%)
Means of transportation to work - Bicycle (%)
Means of transportation to work - Walked (%)
Means of transportation to work - Other means (%)
Working at home (%)
Industry diversity
Most Common Industries - Agriculture, forestry, fishing and hunting, and mining (%)
Most Common Industries - Agriculture, forestry, fishing and hunting (%)
Most Common Industries - Mining, quarrying, and oil and gas extraction (%)
Most Common Industries - Construction (%)
Most Common Industries - Manufacturing (%)
Most Common Industries - Wholesale trade (%)
Most Common Industries - Retail trade (%)
Most Common Industries - Transportation and warehousing, and utilities (%)
Most Common Industries - Transportation and warehousing (%)
Most Common Industries - Utilities (%)
Most Common Industries - Information (%)
Most Common Industries - Finance and insurance, and real estate and rental and leasing (%)
Most Common Industries - Finance and insurance (%)
Most Common Industries - Real estate and rental and leasing (%)
Most Common Industries - Professional, scientific, and management, and administrative and waste management services (%)
Most Common Industries - Professional, scientific, and technical services (%)
Most Common Industries - Management of companies and enterprises (%)
Most Common Industries - Administrative and support and waste management services (%)
Most Common Industries - Educational services, and health care and social assistance (%)
Most Common Industries - Educational services (%)
Most Common Industries - Health care and social assistance (%)
Most Common Industries - Arts, entertainment, and recreation, and accommodation and food services (%)
Most Common Industries - Arts, entertainment, and recreation (%)
Most Common Industries - Accommodation and food services (%)
Most Common Industries - Other services, except public administration (%)
Most Common Industries - Public administration (%)
Occupation diversity
Most Common Occupations - Management, business, science, and arts occupations (%)
Most Common Occupations - Management, business, and financial occupations (%)
Most Common Occupations - Management occupations (%)
Most Common Occupations - Business and financial operations occupations (%)
Most Common Occupations - Computer, engineering, and science occupations (%)
Most Common Occupations - Computer and mathematical occupations (%)
Most Common Occupations - Architecture and engineering occupations (%)
Most Common Occupations - Life, physical, and social science occupations (%)
Most Common Occupations - Education, legal, community service, arts, and media occupations (%)
Most Common Occupations - Community and social service occupations (%)
Most Common Occupations - Legal occupations (%)
Most Common Occupations - Education, training, and library occupations (%)
Most Common Occupations - Arts, design, entertainment, sports, and media occupations (%)
Most Common Occupations - Healthcare practitioners and technical occupations (%)
Most Common Occupations - Health diagnosing and treating practitioners and other technical occupations (%)
Most Common Occupations - Health technologists and technicians (%)
Most Common Occupations - Service occupations (%)
Most Common Occupations - Healthcare support occupations (%)
Most Common Occupations - Protective service occupations (%)
Most Common Occupations - Fire fighting and prevention, and other protective service workers including supervisors (%)
Most Common Occupations - Law enforcement workers including supervisors (%)
Most Common Occupations - Food preparation and serving related occupations (%)
Most Common Occupations - Building and grounds cleaning and maintenance occupations (%)
Most Common Occupations - Personal care and service occupations (%)
Most Common Occupations - Sales and office occupations (%)
Most Common Occupations - Sales and related occupations (%)
Most Common Occupations - Office and administrative support occupations (%)
Most Common Occupations - Natural resources, construction, and maintenance occupations (%)
Most Common Occupations - Farming, fishing, and forestry occupations (%)
Most Common Occupations - Construction and extraction occupations (%)
Most Common Occupations - Installation, maintenance, and repair occupations (%)
Most Common Occupations - Production, transportation, and material moving occupations (%)
Most Common Occupations - Production occupations (%)
Most Common Occupations - Transportation occupations (%)
Most Common Occupations - Material moving occupations (%)
People in Group quarters - Institutionalized population (%)
People in Group quarters - Correctional institutions (%)
People in Group quarters - Federal prisons and detention centers (%)
People in Group quarters - Halfway houses (%)
People in Group quarters - Local jails and other confinement facilities (including police lockups) (%)
People in Group quarters - Military disciplinary barracks (%)
People in Group quarters - State prisons (%)
People in Group quarters - Other types of correctional institutions (%)
People in Group quarters - Nursing homes (%)
People in Group quarters - Hospitals/wards, hospices, and schools for the handicapped (%)
People in Group quarters - Hospitals/wards and hospices for chronically ill (%)
People in Group quarters - Hospices or homes for chronically ill (%)
People in Group quarters - Military hospitals or wards for chronically ill (%)
People in Group quarters - Other hospitals or wards for chronically ill (%)
People in Group quarters - Hospitals or wards for drug/alcohol abuse (%)
People in Group quarters - Mental (Psychiatric) hospitals or wards (%)
People in Group quarters - Schools, hospitals, or wards for the mentally retarded (%)
People in Group quarters - Schools, hospitals, or wards for the physically handicapped (%)
People in Group quarters - Institutions for the deaf (%)
People in Group quarters - Institutions for the blind (%)
People in Group quarters - Orthopedic wards and institutions for the physically handicapped (%)
People in Group quarters - Wards in general hospitals for patients who have no usual home elsewhere (%)
People in Group quarters - Wards in military hospitals for patients who have no usual home elsewhere (%)
People in Group quarters - Juvenile institutions (%)
People in Group quarters - Long-term care (%)
People in Group quarters - Homes for abused, dependent, and neglected children (%)
People in Group quarters - Residential treatment centers for emotionally disturbed children (%)
People in Group quarters - Training schools for juvenile delinquents (%)
People in Group quarters - Short-term care, detention or diagnostic centers for delinquent children (%)
People in Group quarters - Type of juvenile institution unknown (%)
People in Group quarters - Noninstitutionalized population (%)
People in Group quarters - College dormitories (includes college quarters off campus) (%)
People in Group quarters - Military quarters (%)
People in Group quarters - On base (%)
People in Group quarters - Barracks, unaccompanied personnel housing (UPH), (Enlisted/Officer), ;and similar group living quarters for military personnel (%)
People in Group quarters - Transient quarters for temporary residents (%)
People in Group quarters - Military ships (%)
People in Group quarters - Group homes (%)
People in Group quarters - Homes or halfway houses for drug/alcohol abuse (%)
People in Group quarters - Homes for the mentally ill (%)
People in Group quarters - Homes for the mentally retarded (%)
People in Group quarters - Homes for the physically handicapped (%)
People in Group quarters - Other group homes (%)
People in Group quarters - Religious group quarters (%)
People in Group quarters - Dormitories (%)
People in Group quarters - Agriculture workers' dormitories on farms (%)
People in Group quarters - Job Corps and vocational training facilities (%)
People in Group quarters - Other workers' dormitories (%)
People in Group quarters - Crews of maritime vessels (%)
People in Group quarters - Other nonhousehold living situations (%)
People in Group quarters - Other noninstitutional group quarters (%)
Residents speaking English at home (%)
Residents speaking English at home - Born in the United States (%)
Residents speaking English at home - Native, born elsewhere (%)
Residents speaking English at home - Foreign born (%)
Residents speaking Spanish at home (%)
Residents speaking Spanish at home - Born in the United States (%)
Residents speaking Spanish at home - Native, born elsewhere (%)
Residents speaking Spanish at home - Foreign born (%)
Residents speaking other language at home (%)
Residents speaking other language at home - Born in the United States (%)
Residents speaking other language at home - Native, born elsewhere (%)
Residents speaking other language at home - Foreign born (%)
Class of Workers - Employee of private company (%)
Class of Workers - Self-employed in own incorporated business (%)
Class of Workers - Private not-for-profit wage and salary workers (%)
Class of Workers - Local government workers (%)
Class of Workers - State government workers (%)
Class of Workers - Federal government workers (%)
Class of Workers - Self-employed workers in own not incorporated business and Unpaid family workers (%)
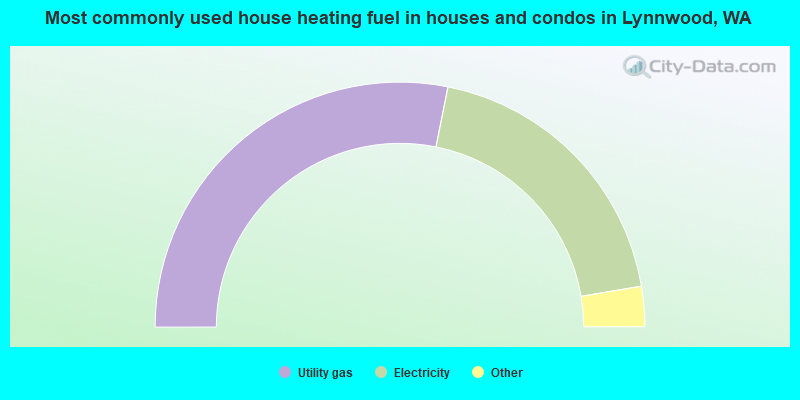
House heating fuel used in houses and condos - Utility gas (%)
House heating fuel used in houses and condos - Bottled, tank, or LP gas (%)
House heating fuel used in houses and condos - Electricity (%)
House heating fuel used in houses and condos - Fuel oil, kerosene, etc. (%)
House heating fuel used in houses and condos - Coal or coke (%)
House heating fuel used in houses and condos - Wood (%)
House heating fuel used in houses and condos - Solar energy (%)
House heating fuel used in houses and condos - Other fuel (%)
House heating fuel used in houses and condos - No fuel used (%)
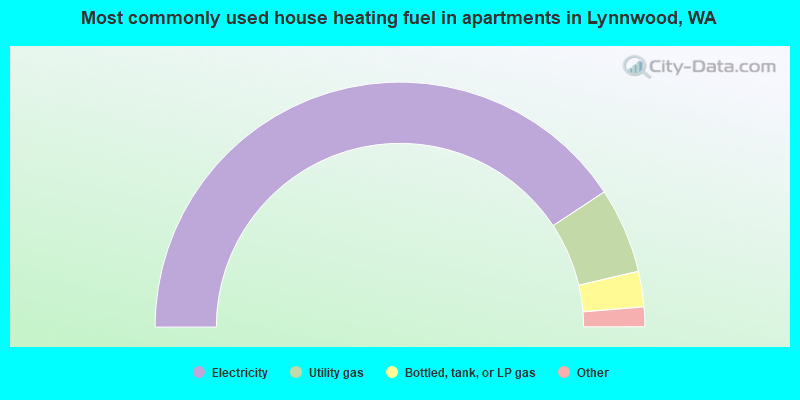
House heating fuel used in apartments - Utility gas (%)
House heating fuel used in apartments - Bottled, tank, or LP gas (%)
House heating fuel used in apartments - Electricity (%)
House heating fuel used in apartments - Fuel oil, kerosene, etc. (%)
House heating fuel used in apartments - Coal or coke (%)
House heating fuel used in apartments - Wood (%)
House heating fuel used in apartments - Solar energy (%)
House heating fuel used in apartments - Other fuel (%)
House heating fuel used in apartments - No fuel used (%)
Armed forces status - In Armed Forces (%)
Armed forces status - Civilian (%)
Armed forces status - Civilian - Veteran (%)
Armed forces status - Civilian - Nonveteran (%)
Fatal accidents locations in years 2005-2021
Fatal accidents locations in 2005
Fatal accidents locations in 2006
Fatal accidents locations in 2007
Fatal accidents locations in 2008
Fatal accidents locations in 2009
Fatal accidents locations in 2010
Fatal accidents locations in 2011
Fatal accidents locations in 2012
Fatal accidents locations in 2013
Fatal accidents locations in 2014
Fatal accidents locations in 2015
Fatal accidents locations in 2016
Fatal accidents locations in 2017
Fatal accidents locations in 2018
Fatal accidents locations in 2019
Fatal accidents locations in 2020
Fatal accidents locations in 2021
Alcohol use - People drinking some alcohol every month (%)
Alcohol use - People not drinking at all (%)
Alcohol use - Average days/month drinking alcohol
Alcohol use - Average drinks/week
Alcohol use - Average days/year people drink much
Audiometry - Average condition of hearing (%)
Audiometry - People that can hear a whisper from across a quiet room (%)
Audiometry - People that can hear normal voice from across a quiet room (%)
Audiometry - Ears ringing, roaring, buzzing (%)
Audiometry - Had a job exposure to loud noise (%)
Audiometry - Had off-work exposure to loud noise (%)
Blood Pressure & Cholesterol - Has high blood pressure (%)
Blood Pressure & Cholesterol - Checking blood pressure at home (%)
Blood Pressure & Cholesterol - Frequently checking blood cholesterol (%)
Blood Pressure & Cholesterol - Has high cholesterol level (%)
Consumer Behavior - Money monthly spent on food at supermarket/grocery store
Consumer Behavior - Money monthly spent on food at other stores
Consumer Behavior - Money monthly spent on eating out
Consumer Behavior - Money monthly spent on carryout/delivered foods
Consumer Behavior - Income spent on food at supermarket/grocery store (%)
Consumer Behavior - Income spent on food at other stores (%)
Consumer Behavior - Income spent on eating out (%)
Consumer Behavior - Income spent on carryout/delivered foods (%)
Current Health Status - General health condition (%)
Current Health Status - Blood donors (%)
Current Health Status - Has blood ever tested for HIV virus (%)
Current Health Status - Left-handed people (%)
Dermatology - People using sunscreen (%)
Diabetes - Diabetics (%)
Diabetes - Had a blood test for high blood sugar (%)
Diabetes - People taking insulin (%)
Diet Behavior & Nutrition - Diet health (%)
Diet Behavior & Nutrition - Milk product consumption (# of products/month)
Diet Behavior & Nutrition - Meals not home prepared (#/week)
Diet Behavior & Nutrition - Meals from fast food or pizza place (#/week)
Diet Behavior & Nutrition - Ready-to-eat foods (#/month)
Diet Behavior & Nutrition - Frozen meals/pizza (#/month)
Drug Use - People that ever used marijuana or hashish (%)
Drug Use - Ever used hard drugs (%)
Drug Use - Ever used any form of cocaine (%)
Drug Use - Ever used heroin (%)
Drug Use - Ever used methamphetamine (%)
Health Insurance - People covered by health insurance (%)
Kidney Conditions-Urology - Avg. # of times urinating at night
Medical Conditions - People with asthma (%)
Medical Conditions - People with anemia (%)
Medical Conditions - People with psoriasis (%)
Medical Conditions - People with overweight (%)
Medical Conditions - Elderly people having difficulties in thinking or remembering (%)
Medical Conditions - People who ever received blood transfusion (%)
Medical Conditions - People having trouble seeing even with glass/contacts (%)
Medical Conditions - People with arthritis (%)
Medical Conditions - People with gout (%)
Medical Conditions - People with congestive heart failure (%)
Medical Conditions - People with coronary heart disease (%)
Medical Conditions - People with angina pectoris (%)
Medical Conditions - People who ever had heart attack (%)
Medical Conditions - People who ever had stroke (%)
Medical Conditions - People with emphysema (%)
Medical Conditions - People with thyroid problem (%)
Medical Conditions - People with chronic bronchitis (%)
Medical Conditions - People with any liver condition (%)
Medical Conditions - People who ever had cancer or malignancy (%)
Mental Health - People who have little interest in doing things (%)
Mental Health - People feeling down, depressed, or hopeless (%)
Mental Health - People who have trouble sleeping or sleeping too much (%)
Mental Health - People feeling tired or having little energy (%)
Mental Health - People with poor appetite or overeating (%)
Mental Health - People feeling bad about themself (%)
Mental Health - People who have trouble concentrating on things (%)
Mental Health - People moving or speaking slowly or too fast (%)
Mental Health - People having thoughts they would be better off dead (%)
Oral Health - Average years since last visit a dentist
Oral Health - People embarrassed because of mouth (%)
Oral Health - People with gum disease (%)
Oral Health - General health of teeth and gums (%)
Oral Health - Average days a week using dental floss/device
Oral Health - Average days a week using mouthwash for dental problem
Oral Health - Average number of teeth
Pesticide Use - Households using pesticides to control insects (%)
Pesticide Use - Households using pesticides to kill weeds (%)
Physical Activity - People doing vigorous-intensity work activities (%)
Physical Activity - People doing moderate-intensity work activities (%)
Physical Activity - People walking or bicycling (%)
Physical Activity - People doing vigorous-intensity recreational activities (%)
Physical Activity - People doing moderate-intensity recreational activities (%)
Physical Activity - Average hours a day doing sedentary activities
Physical Activity - Average hours a day watching TV or videos
Physical Activity - Average hours a day using computer
Physical Functioning - People having limitations keeping them from working (%)
Physical Functioning - People limited in amount of work they can do (%)
Physical Functioning - People that need special equipment to walk (%)
Physical Functioning - People experiencing confusion/memory problems (%)
Physical Functioning - People requiring special healthcare equipment (%)
Prescription Medications - Average number of prescription medicines taking
Preventive Aspirin Use - Adults 40+ taking low-dose aspirin (%)
Reproductive Health - Vaginal deliveries (%)
Reproductive Health - Cesarean deliveries (%)
Reproductive Health - Deliveries resulted in a live birth (%)
Reproductive Health - Pregnancies resulted in a delivery (%)
Reproductive Health - Women breastfeeding newborns (%)
Reproductive Health - Women that had a hysterectomy (%)
Reproductive Health - Women that had both ovaries removed (%)
Reproductive Health - Women that have ever taken birth control pills (%)
Reproductive Health - Women taking birth control pills (%)
Reproductive Health - Women that have ever used Depo-Provera or injectables (%)
Reproductive Health - Women that have ever used female hormones (%)
Sexual Behavior - People 18+ that ever had sex (vaginal, anal, or oral) (%)
Sexual Behavior - Males 18+ that ever had vaginal sex with a woman (%)
Sexual Behavior - Males 18+ that ever performed oral sex on a woman (%)
Sexual Behavior - Males 18+ that ever had anal sex with a woman (%)
Sexual Behavior - Males 18+ that ever had any sex with a man (%)
Sexual Behavior - Females 18+ that ever had vaginal sex with a man (%)
Sexual Behavior - Females 18+ that ever performed oral sex on a man (%)
Sexual Behavior - Females 18+ that ever had anal sex with a man (%)
Sexual Behavior - Females 18+ that ever had any kind of sex with a woman (%)
Sexual Behavior - Average age people first had sex
Sexual Behavior - Average number of female sex partners in lifetime (males 18+)
Sexual Behavior - Average number of female vaginal sex partners in lifetime (males 18+)
Sexual Behavior - Average age people first performed oral sex on a woman (18+)
Sexual Behavior - Average number of woman performed oral sex on in lifetime (18+)
Sexual Behavior - Average number of male sex partners in lifetime (males 18+)
Sexual Behavior - Average number of male anal sex partners in lifetime (males 18+)
Sexual Behavior - Average age people first performed oral sex on a man (18+)
Sexual Behavior - Average number of male oral sex partners in lifetime (18+)
Sexual Behavior - People using protection when performing oral sex (%)
Sexual Behavior - Average number of times people have vaginal or anal sex a year
Sexual Behavior - People having sex without condom (%)
Sexual Behavior - Average number of male sex partners in lifetime (females 18+)
Sexual Behavior - Average number of male vaginal sex partners in lifetime (females 18+)
Sexual Behavior - Average number of female sex partners in lifetime (females 18+)
Sexual Behavior - Circumcised males 18+ (%)
Sleep Disorders - Average hours sleeping at night
Sleep Disorders - People that has trouble sleeping (%)
Smoking-Cigarette Use - People smoking cigarettes (%)
Taste & Smell - People 40+ having problems with smell (%)
Taste & Smell - People 40+ having problems with taste (%)
Taste & Smell - People 40+ that ever had wisdom teeth removed (%)
Taste & Smell - People 40+ that ever had tonsils teeth removed (%)
Taste & Smell - People 40+ that ever had a loss of consciousness because of a head injury (%)
Taste & Smell - People 40+ that ever had a broken nose or other serious injury to face or skull (%)
Taste & Smell - People 40+ that ever had two or more sinus infections (%)
Weight - Average height (inches)
Weight - Average weight (pounds)
Weight - Average BMI
Weight - People that are obese (%)
Weight - People that ever were obese (%)
Weight - People trying to lose weight (%)
According to our research of Washington and other state lists, there were 19 registered sex offenders living in Lynnwood, Washington as of April 26, 2024 . The ratio of all residents to sex offenders in Lynnwood is 2,014 to 1.The ratio of registered sex offenders to all residents in this city is lower than the state average.
Officers per 1,000 residents here:
1.57Washington average:
1.35
Latest news from Lynnwood, WA collected exclusively by city-data.com from local newspapers, TV, and radio stations
Ancestries: German (5.3%), English (5.1%), Ethiopian (5.1%), European (4.0%), American (3.0%), African (2.8%).
Current Local Time:
Land area: 7.64 square miles.
Population density: 5,657 people per square mile (average).
12,490 residents are foreign born (15.2% Asia , 6.5% Latin America , 4.5% Africa , 3.4% Europe ).
This city:
30.9%Washington:
14.9%
Median real estate property taxes paid for housing units with mortgages in 2022: $5,177 (0.7%)Median real estate property taxes paid for housing units with no mortgage in 2022: $4,593 (0.7%)
Nearest city with pop. 50,000+: Shoreline, WA
Nearest city with pop. 200,000+: Seattle, WA
Nearest city with pop. 1,000,000+: Los Angeles, CA
Nearest cities:
Latitude: 47.83 N, Longitude: 122.31 W
Daytime population change due to commuting: +8,970 (+22.2%)Workers who live and work in this city: 6,930 (34.4%)
Property values in Lynnwood, WA
Lynnwood tourist attractions:
Single-family new house construction building permits:
2022: 61 buildings , average cost: $633,9002021: 14 buildings , average cost: $432,3002020: 55 buildings , average cost: $415,5002019: 30 buildings , average cost: $399,4002018: 69 buildings , average cost: $423,9002017: 43 buildings , average cost: $314,3002016: 14 buildings , average cost: $368,4002015: 18 buildings , average cost: $351,6002014: 34 buildings , average cost: $337,1002013: 13 buildings , average cost: $316,4002012: 7 buildings , average cost: $315,4002011: 10 buildings , average cost: $262,8002010: 9 buildings , average cost: $274,4002009: 4 buildings , average cost: $317,0002008: 17 buildings , average cost: $135,0002007: 37 buildings , average cost: $135,0002006: 59 buildings , average cost: $135,0002005: 80 buildings , average cost: $135,0002004: 80 buildings , average cost: $135,1002003: 73 buildings , average cost: $134,9002002: 64 buildings , average cost: $135,7002001: 65 buildings , average cost: $132,3002000: 35 buildings , average cost: $159,5001999: 150 buildings , average cost: $112,9001998: 145 buildings , average cost: $112,9001997: 132 buildings , average cost: $112,900Unemployment in December 2023:
Population change in the 1990s: +3,812 (+12.7%).
Most common occupations in Lynnwood, WA (%)
Both Males Females
Other management occupations, except farmers and farm managers (4.7%)
Other sales and related occupations, including supervisors (4.4%)
Other office and administrative support workers, including supervisors (4.2%)
Retail sales workers, except cashiers (3.9%)
Building and grounds cleaning and maintenance occupations (3.6%)
Computer specialists (3.4%)
Other production occupations, including supervisors (3.0%)
Other management occupations, except farmers and farm managers (4.6%)
Computer specialists (4.6%)
Other sales and related occupations, including supervisors (4.5%)
Vehicle and mobile equipment mechanics, installers, and repairers (4.1%)
Other production occupations, including supervisors (4.1%)
Building and grounds cleaning and maintenance occupations (4.1%)
Electrical equipment mechanics and other installation, maintenance, and repair workers, including supervisors (4.0%)
Other office and administrative support workers, including supervisors (6.7%)
Other management occupations, except farmers and farm managers (4.7%)
Retail sales workers, except cashiers (4.7%)
Information and record clerks, except customer service representatives (4.3%)
Other sales and related occupations, including supervisors (4.2%)
Secretaries and administrative assistants (3.8%)
Cashiers (3.2%)
Earthquake activity:
Lynnwood-area historical earthquake activity is significantly above Washington state average. It is 1246% greater than the overall U.S. average. On 4/13/1949 at 19:55:42, a magnitude 7.0 (7.0 UK, Class: Major, Intensity: VIII - XII) earthquake occurred 41.0 miles away from Lynnwood center, causing $80,000,000 total damage On 2/28/2001 at 18:54:32, a magnitude 6.8 (6.8 MD, Depth: 32.2 mi, Class: Strong, Intensity: VII - IX) earthquake occurred 50.9 miles away from Lynnwood center On 2/28/2001 at 18:54:32, a magnitude 6.8 (6.5 MB, 6.6 MS, 6.8 MW) earthquake occurred 52.6 miles away from the city center, causing $2,000,000,000 total damage and $305,000,000 insured lossesOn 4/29/1965 at 15:28:43, a magnitude 6.6 (6.6 UK) earthquake occurred 35.4 miles away from the city center, causing $28,000,000 total damage On 7/3/1999 at 01:43:54, a magnitude 5.8 (5.4 MB, 5.5 MS, 5.8 MW, 5.3 ME, Depth: 25.2 mi, Class: Moderate, Intensity: VI - VII) earthquake occurred 68.6 miles away from the city center On 5/3/1996 at 04:04:22, a magnitude 5.5 (5.2 MB, 5.3 MD, 5.5 ML, Depth: 2.5 mi) earthquake occurred 26.0 miles away from the city center Magnitude types: body-wave magnitude (MB), duration magnitude (MD), energy magnitude (ME), local magnitude (ML), surface-wave magnitude (MS), moment magnitude (MW) Natural disasters: The number of natural disasters in Snohomish County (31) is a lot greater than the US average (15).Major Disasters (Presidential) Declared: 27Emergencies Declared: 2Floods: 21, Storms: 17, Mudslides: 14, Landslides: 10, Winter Storms: 6, Winds: 5, Earthquakes: 2, Heavy Rain: 1, Hurricane: 1, Snow: 1, Tornado: 1, Volcanic Eruption: 1, Other: 1 (Note: some incidents may be assigned to more than one category). Hospitals and medical centers in Lynnwood: EMERALD HILLS REHABILITATION AND SKILLED NURSING (5821 188TH SOUTHWEST)
LYNNWOOD MANOR HEALTH CARE CENTER (5821 188TH SW)
MANOR CARE HEALTH SERVICES (3701 188TH STREET SOUTHWEST)
Amtrak stations near Lynnwood: 4 miles: EDMONDS (211 RAILROAD AVE.) Services: ticket office, fully wheelchair accessible, enclosed waiting area, public restrooms, public payphones, vending machines, paid short-term parking, paid long-term parking, call for taxi service, public transit connection.
12 miles: EVERETT (2900 BOND ST.) Services: ticket office, partially wheelchair accessible, enclosed waiting area, public payphones, free short-term parking, free long-term parking, call for car rental service, taxi stand, public transit connection.
16 miles: MONROE (RED BARN UNOCAL) - Bus Station
College/University in Lynnwood: Edmonds Community College Full-time enrollment: 7,271; Location: 20000 68th Ave W; Public; Website: www.edcc.edu)
Other colleges/universities with over 2000 students near Lynnwood:
Shoreline Community College (about 7 miles; Shoreline, WA ; Full-time enrollment: 5,026)
University of Washington-Bothell Campus (about 8 miles; Bothell, WA ; FT enrollment: 3,902)
Cascadia Community College (about 8 miles; Bothell, WA ; FT enrollment: 2,238)
Seattle Community College-North Campus (about 9 miles; Seattle, WA ; FT enrollment: 4,220)
Lake Washington Institute of Technology (about 11 miles; Kirkland, WA ; FT enrollment: 2,947)
University of Washington-Seattle Campus (about 12 miles; Seattle, WA ; FT enrollment: 39,445)
Seattle Pacific University (about 13 miles; Seattle, WA ; FT enrollment: 3,897)
Public high schools in Lynnwood:
Private high school in Lynnwood: PROVIDENCE CLASSICAL CHRISTIAN SCHOOL Students: 171, Location: 21500 CYPRESS WAY STE B, Grades: PK-12)
Biggest public elementary/middle schools in Lynnwood: ALDERWOOD MIDDLE SCHOOL Location: 20000 28TH AVE W, Grades: 7-8)BEVERLY ELEMENTARY Location: 5221 168TH ST SW, Grades: KG-6)CEDAR VALLEY COMMUNITY SCHOOL Location: 19200 56TH AVE W, Grades: KG-8)COLLEGE PLACE ELEMENTARY Location: 20401 76TH AVE W, Grades: KG-6)COLLEGE PLACE MIDDLE SCHOOL Location: 7501 208TH ST SW, Grades: 7-8)HAZELWOOD ELEMENTARY Location: 3300 204TH ST SW, Grades: KG-6)HILLTOP ELEMENTARY Location: 20425 DAMSON ROAD, Grades: KG-6)LYNNDALE ELEMENTARY Location: 7200 191ST PL SW, Grades: KG-6)LYNNWOOD ELEMENTARY Location: 18638 44TH AVE W, Grades: KG-6)MEADOWDALE ELEMENTARY Location: 6505 168TH ST SW, Grades: KG-6)Private elementary/middle schools in Lynnwood: BRIGHTON SCHOOL Students: 301, Location: 6717 212TH ST SW, Grades: PK-8)ST THOMAS MORE PARISH SCHOOL Students: 283, Location: 6511 176TH ST SW, Grades: PK-8)
SOUNDVIEW SCHOOL Students: 140, Location: 6515 196TH ST SW, Grades: PK-8)CEDAR PARK CHRISTIAN SCHOOL-LYNNWOOD CAMPUS Students: 100, Location: 17931 64TH AVE W, Grades: KG-6)
CYPRESS ADVENTIST SCHOOL Students: 61, Location: 21500 CYPRESS WAY STE A, Grades: KG-8)
HAPPY HEARTS MONTESSORI SCHOOL Students: 19, Location: 7231 196TH ST SW STE A, Grades: PK-1)
REDEMPTION EVANGELICAL LUTHERAN Students: 14, Location: 20120 24TH AVE W, Grades: KG-8)
See full list of schools located in Lynnwood User-submitted facts and corrections:
New zip code for Lynnwood, WA 98087
Notable locations in Lynnwood: (A) , Fisher Business Center at Lynnwood (B) , Alderwood Manor Substation (C) , Keelers Substation (D) , Meadowdale Substation (E) , Lynnwood Transit Center Park and Ride (F) , Twin Cedars Recreational Vehicle Park (G) , Vaughns Village (H) , Target Plaza (I) , Lynnwood Home Club Center (J) , Lynnwood Square (K) , Fred Meyer Center (L) , Alderwood Village (M) , Alderwood Plaza (N) , Lynnwood North Administration Building (O) , Lynnwood City Water Tanks (P) , Lynnwood Convention Center (Q) , Lynnwood Senior Center (R) , Lynnwood Recreation Center (S) , Sunrise of Lynnwood Senior Living Center (T) . Display/hide their locations on the map
Shopping Centers: (1) , Lake Stevens Marketplace Shopping Center (2) , Scriber Square Shopping Center (3) , Lynnwood Shopping Center (4) , James Village Shopping Center (5) . Display/hide their locations on the map
Churches in Lynnwood include: (A) , The Church of Jesus Christ of Latter Day Saints (B) , Seattle Central Mission Church (C) , Saint Thomas More Church (D) , Lynnwood Free Methodist Church (E) , Lynnwood Evangelical Free Church (F) , Lynnwood Church of the Nazarene (G) , Korean Emmanuel Church (H) , Kingdom Hall of Jehovahs Witnesses (I) . Display/hide their locations on the map
Lakes: (A) , Hall Lake (B) . Display/hide their locations on the map
Tourist attractions:
Hotels:
Birthplace of: Tom McGrath (animator) - Animator, Chris Frank - Ice hockey player.
Snohomish County has a predicted average indoor radon screening level less than 2 pCi/L (pico curies per liter) - Low Potential Drinking water stations with addresses in Lynnwood and their reported violations in the past:
ALASKA GENERAL SEAFOODS NAKNEK - PROCESS (Serves AK, Population served: 120, Groundwater):
Past monitoring violations:
4 routine major monitoring violations
3 regular monitoring violations
Drinking water stations with addresses in Lynnwood that have no violations reported:
ALDERWOOD WATER DISTRICT (Population served: 171,500, Primary Water Source Type: Purch surface water)
Average household size: This city:
2.5 peopleWashington:
2.5 people
Percentage of family households: This city:
60.3%Whole state:
64.4%
Percentage of households with unmarried partners: This city:
7.0%Whole state:
7.7%
Likely homosexual households (counted as self-reported same-sex unmarried-partner households)
Lesbian couples: 0.5% of all households Gay men: 0.4% of all households
People in group quarters in Lynnwood in 2010:
195 people in nursing facilities/skilled-nursing facilities
163 people in college/university student housing
139 people in group homes intended for adults
47 people in emergency and transitional shelters (with sleeping facilities) for people experiencing homelessness
39 people in local jails and other municipal confinement facilities
25 people in workers' group living quarters and job corps centers
6 people in residential treatment centers for adults
2 people in in-patient hospice facilities
People in group quarters in Lynnwood in 2000:
447 people in other noninstitutional group quarters
32 people in local jails and other confinement facilities (including police lockups)
22 people in homes or halfway houses for drug/alcohol abuse
15 people in nursing homes
6 people in other group homes
Banks with most branches in Lynnwood (2011 data):
JPMorgan Chase Bank, National Association: Alderwood, Lynnwood Branch, North Lynnwood, Lynnwood Financial Center Branch, Alderwood Mall Pkwy & 164th Banking. Info updated 2011/11/10: Bank assets: $1,811,678.0 mil, Deposits: $1,190,738.0 mil, headquarters in Columbus, OH, positive income , International Specialization, 5577 total offices , Holding Company: Jpmorgan Chase & Co.
Bank of America, National Association: Martha Lake Branch, Lynnwood Branch, North Lynnwood Branch, Alderwood Branch. Info updated 2009/11/18: Bank assets: $1,451,969.3 mil, Deposits: $1,077,176.8 mil, headquarters in Charlotte, NC, positive income , 5782 total offices , Holding Company: Bank Of America Corporation
Prime Pacific Bank, National Association: Courier Service Branch, Lynnwood Messenger Service Branch, Lynnwood Branch, at 2502 196th Street, S.W.. Info updated 2010/05/13: Bank assets: $133.2 mil, Deposits: $122.4 mil, local headquarters , negative income in the last year , Commercial Lending Specialization, 6 total offices , Holding Company: Prime Pacific Financial Services, Inc.
Wells Fargo Bank, National Association: Martha Lake Branch, Lynnwood Branch, Alderwood Branch, West Lynnwood Branch. Info updated 2011/04/05: Bank assets: $1,161,490.0 mil, Deposits: $905,653.0 mil, headquarters in Sioux Falls, SD, positive income , 6395 total offices , Holding Company: Wells Fargo & Company
U.S. Bank National Association: Alderwood Mall Fred Meyer Branch, 44th Avenue Branch, James Village Branch. Info updated 2012/01/30: Bank assets: $330,470.8 mil, Deposits: $236,091.5 mil, headquarters in Cincinnati, OH, positive income , 3121 total offices , Holding Company: U.S. Bancorp
Whidbey Island Bank: North Lynnwood Branch at 14807 Hwy 99, branch established on 1974/04/15; Lynnwood Branch at 19510 57th Pl, branch established on 1980/02/04. Info updated 2010/09/27: Bank assets: $1,668.6 mil, Deposits: $1,471.8 mil, headquarters in Coupeville, WA, positive income , Commercial Lending Specialization, 32 total offices , Holding Company: Washington Banking Company
Pacific International Bank: Lynnwood Branch at 17424 Highway 99, Suite 201, branch established on 2005/01/24; Lynnwood H-Mart Branch at 3301 184th St Sw #125, branch established on 2008/12/04. Info updated 2006/11/03: Bank assets: $229.6 mil, Deposits: $179.9 mil, headquarters in Seattle, WA, negative income in the last year , Commercial Lending Specialization, 5 total offices , Holding Company: Pacific International Bancorp, Inc.
KeyBank National Association: Lynnwood Branch at 4401 168th Street, S.W., branch established on 1971/06/01; Lynnwood Branch at 19820 44th Avenue West, branch established on 1970/01/02. Info updated 2008/03/03: Bank assets: $86,198.8 mil, Deposits: $64,214.8 mil, headquarters in Cleveland, OH, positive income , Commercial Lending Specialization, 1067 total offices , Holding Company: Keycorp
Washington Federal: Lynnwood Branch at 5809 196th Southwest, branch established on 1917/01/01. Info updated 2011/12/19: Bank assets: $13,653.0 mil, Deposits: $8,905.8 mil, headquarters in Seattle, WA, positive income , Mortgage Lending Specialization, 174 total offices
11 other banks with 11 local branches
For population 15 years and over in Lynnwood:
Never married: 34.2%Now married: 44.4%Separated: 2.3%Widowed: 6.1%Divorced: 13.0% For population 25 years and over in Lynnwood:
High school or higher: 87.7%Bachelor's degree or higher: 30.6%Graduate or professional degree: 9.6%Unemployed: 5.1%Mean travel time to work (commute): 23.7 minutes
Education Gini index (Inequality in education) Here:
12.2Washington average:
11.6
Religion statistics for Lynnwood, WA (based on Snohomish County data)
Religion Adherents Congregations Evangelical Protestant 85,354 327 Catholic 75,393 16 Other 34,270 90 Mainline Protestant 21,642 71 Orthodox 1,943 6 Black Protestant 406 4 None 494,327 -
Source: Clifford Grammich, Kirk Hadaway, Richard Houseal, Dale E.Jones, Alexei Krindatch, Richie Stanley and Richard H.Taylor. 2012. 2010 U.S.Religion Census: Religious Congregations & Membership Study. Association of Statisticians of American Religious Bodies. Jones, Dale E., et al. 2002. Congregations and Membership in the United States 2000. Nashville, TN: Glenmary Research Center. Graphs represent county-level data
Food Environment Statistics: Number of grocery stores : 121This county :
1.79 / 10,000 pop.Washington :
2.06 / 10,000 pop.
Number of supercenters and club stores : 12Snohomish County :
0.18 / 10,000 pop.State :
0.19 / 10,000 pop.
Number of convenience stores (no gas) : 96This county :
1.42 / 10,000 pop.State :
1.18 / 10,000 pop.
Number of convenience stores (with gas) : 172Snohomish County :
2.55 / 10,000 pop.Washington :
2.67 / 10,000 pop.
Number of full-service restaurants : 469Snohomish County :
6.95 / 10,000 pop.State :
8.26 / 10,000 pop.
Adult diabetes rate : This county :
7.5%Washington :
7.7%
Adult obesity rate : Snohomish County :
27.4%Washington :
25.7%
Low-income preschool obesity rate : Here :
14.3%Washington :
13.9%
Health and Nutrition: Healthy diet rate : This city:
49.6%Washington:
49.9%
Average overall health of teeth and gums : This city:
45.9%Washington:
47.2%
Average BMI : Lynnwood:
28.0Washington:
28.4
People feeling badly about themselves : Lynnwood:
20.5%Washington:
20.9%
People not drinking alcohol at all : Lynnwood:
12.6%Washington:
10.5%
Average hours sleeping at night : Lynnwood:
6.8Washington:
6.8
Overweight people : Lynnwood:
30.8%State:
32.8%
General health condition : This city:
56.0%Washington:
56.8%
Average condition of hearing : More about Health and Nutrition of Lynnwood, WA Residents
Local government employment and payroll (March 2022)
Function
Full-time employees
Monthly full-time payroll
Average yearly full-time wage
Part-time employees
Monthly part-time payroll
Police Protection - Officers
67 $738,978 $132,354 3 $5,888 Parks and Recreation
37 $255,619 $82,903 158 $82,808 Other and Unallocable
35 $352,375 $120,814 0 $0 Financial Administration
34 $295,100 $104,153 4 $8,317 Other Government Administration
19 $119,463 $75,450 9 $25,588 Correction
18 $126,961 $84,641 0 $0 Police - Other
18 $133,265 $88,843 0 $0 Sewerage
15 $118,781 $95,025 0 $0 Streets and Highways
15 $110,508 $88,406 0 $0 Judicial and Legal
11 $72,155 $78,715 0 $0 Water Supply
11 $72,020 $78,567 0 $0 Housing and Community Development (Local)
9 $81,523 $108,697 0 $0 Health
5 $37,495 $89,988 0 $0
Totals for Government
294 $2,514,242 $102,622 174 $122,601
Lynnwood government finances - Expenditure in 2021 (per resident):
Construction - Regular Highways: $8,300,000 ($192.08)
Correctional Institutions: $1,926,000 ($44.57)Parks and Recreation: $450,000 ($10.41)General - Other: $337,000 ($7.80)Central Staff Services: $117,000 ($2.71)Libraries: $108,000 ($2.50)Housing and Community Development: $50,000 ($1.16)Current Operations - Police Protection: $16,272,000 ($376.56)
Sewerage: $10,891,000 ($252.04)Water Utilities: $6,075,000 ($140.59)Parks and Recreation: $4,006,000 ($92.71)Regular Highways: $3,973,000 ($91.94)Central Staff Services: $3,641,000 ($84.26)Natural Resources - Other: $3,605,000 ($83.43)Correctional Institutions: $3,398,000 ($78.64)Financial Administration: $3,111,000 ($71.99)Housing and Community Development: $2,122,000 ($49.11)Judicial and Legal Services: $1,807,000 ($41.82)General - Other: $1,429,000 ($33.07)General Public Buildings: $1,423,000 ($32.93)Local Fire Protection: $1,128,000 ($26.10)Corrections - Other: $316,000 ($7.31)Solid Waste Management: $38,000 ($0.88)General - Interest on Debt: $2,221,000 ($51.40)
Intergovernmental to Local - Other - General - Other: $1,297,000 ($30.01)
Other Capital Outlay - Sewerage: $5,712,000 ($132.19)
Water Utilities: $3,883,000 ($89.86)Solid Waste Management: $1,232,000 ($28.51)Police Protection: $172,000 ($3.98)Natural Resources - Other: $89,000 ($2.06)Regular Highways: $62,000 ($1.43)General - Other: $31,000 ($0.72)Total Salaries and Wages: $28,559,000 ($660.90)
Water Utilities - Interest on Debt: $310,000 ($7.17)
Lynnwood government finances - Revenue in 2021 (per resident):
Charges - Sewerage: $17,085,000 ($395.38)
Parks and Recreation: $2,146,000 ($49.66)Other: $1,397,000 ($32.33)Regular Highways: $2,000 ($0.05)Federal Intergovernmental - Other: $50,000 ($1.16)
Local Intergovernmental - Other: $920,000 ($21.29)
Miscellaneous - Fines and Forfeits: $3,238,000 ($74.93)
Interest Earnings: $914,000 ($21.15)Rents: $413,000 ($9.56)Special Assessments: $253,000 ($5.85)General Revenue - Other: $189,000 ($4.37)Donations From Private Sources: $41,000 ($0.95)Revenue - Water Utilities: $7,140,000 ($165.23)
State Intergovernmental - Highways: $2,745,000 ($63.52)
Health and Hospitals: $1,607,000 ($37.19)Other: $1,300,000 ($30.08)General Local Government Support: $580,000 ($13.42)Tax - General Sales and Gross Receipts: $24,350,000 ($563.50)
Public Utilities Sales: $6,096,000 ($141.07)Other License: $4,742,000 ($109.74)Property: $4,280,000 ($99.05)Occupation and Business License - Other: $2,689,000 ($62.23)Documentary and Stock Transfer: $1,794,000 ($41.52)Motor Vehicle License: $1,306,000 ($30.22)Other Selective Sales: $342,000 ($7.91)Amusements Sales: $225,000 ($5.21)
Lynnwood government finances - Debt in 2021 (per resident):
Long Term Debt - Beginning Outstanding - Unspecified Public Purpose: $89,488,000 ($2070.91)
Outstanding Unspecified Public Purpose: $87,744,000 ($2030.55)Retired Unspecified Public Purpose: $11,162,000 ($258.31)Issue, Unspecified Public Purpose: $9,418,000 ($217.95)
Lynnwood government finances - Cash and Securities in 2021 (per resident):
Other Funds - Cash and Securities: $75,914,000 ($1756.78)
7.60% of this county's 2021 resident taxpayers lived in other counties in 2020 ($97,930 average adjusted gross income )
Here:
7.60%Washington average:
7.53%
0.04% of residents moved from foreign countries ($285 average AGI )Snohomish County:
0.04%Washington average:
0.05%
Top counties from which taxpayers relocated into this county between 2020 and 2021:
7.20% of this county's 2020 resident taxpayers moved to other counties in 2021 ($85,049 average adjusted gross income )
Here:
7.20%Washington average:
7.40%
0.02% of residents moved to foreign countries ($153 average AGI )Snohomish County:
0.02%Washington average:
0.04%
Top counties to which taxpayers relocated from this county between 2020 and 2021:
Businesses in Lynnwood, WA
Name Count Name Count
24 Hour Fitness 1 Journeys 1 7-Eleven 5 Justice 1 ALDO 1 KFC 1 AT&T 6 Kincaid 1 Abercrombie & Fitch 1 Kohl's 1 Abercrombie Kids 1 Kroger 7 Aeropostale 1 LA Fitness 1 Albertsons 2 La Quinta 1 American Eagle Outfitters 1 La-Z-Boy 1 Ann Taylor 1 Lane Bryant 1 Apple Store 1 Lane Furniture 3 Applebee's 1 LensCrafters 1 Arby's 1 Little Caesars Pizza 2 AutoZone 2 Lowe's 1 Avenue 1 Macy's 2 Bally Total Fitness 1 Marriott 2 Banana Republic 1 Marshalls 1 Barnes & Noble 1 MasterBrand Cabinets 5 Baskin-Robbins 3 McDonald's 5 Bath & Body Works 1 Men's Wearhouse 1 Bed Bath & Beyond 1 Motherhood Maternity 2 Best Western 1 New Balance 3 Big O Tires 1 Nike 11 Blockbuster 2 Nordstrom 2 Brookstone 1 Office Depot 1 Brunswick Bowling & Billiards 1 Old Country Buffet 1 Casual Male XL 1 Old Navy 1 Catherines 1 Olive Garden 1 Chico's 1 Pac Sun 1 Chipotle 1 Panda Express 3 Chuck E. Cheese's 1 Panera Bread 1 Cinnabon 1 Papa John's Pizza 1 Clarks 1 Payless 3 Cold Stone Creamery 1 Penske 1 Coldwater Creek 1 PetSmart 1 Costco 1 Pier 1 Imports 1 Curves 1 Pizza Hut 1 DHL 1 Plato's Closet 1 Dairy Queen 3 Pottery Barn 1 Days Inn 1 Qdoba Mexican Grill 1 Dennys 1 Quiznos 3 Discount Tire 2 RadioShack 2 Domino's Pizza 2 Red Lobster 1 Eddie Bauer 1 Red Robin 1 Ethan Allen 1 Rite Aid 2 Express 1 Safeway 2 Extended Stay America 1 Sears 2 Famous Footwear 1 Sephora 2 FedEx 7 Soma Intimates 1 Finish Line 1 Spencer Gifts 1 Foot Locker 1 Sprint Nextel 3 Ford 1 Staples 1 Forever 21 2 Starbucks 15 GNC 2 Subway 4 GameStop 4 T-Mobile 7 Gap 1 Taco Bell 2 Goodwill 1 Target 1 Gymboree 1 The Room Place 1 H&R Block 5 Toys"R"Us 2 Hilton 2 Trader Joe's 1 Hobby Lobby 1 True Value 1 Holiday Inn 1 U-Haul 3 Hollister Co. 1 UPS 12 Hot Topic 1 Urban Outfitters 1 IHOP 1 Vans 3 J. Jill 1 Verizon Wireless 4 JCPenney 1 Victoria's Secret 1 Jack In The Box 3 Vons 2 Jamba Juice 1 Walgreens 3 Jimmy John's 1 Walmart 1 JoS. A. Bank 1 Wendy's 1 Jones New York 2 Wet Seal 1
Strongest AM radio stations in Lynnwood:
KCIS (630 AM; 5 kW; EDMONDS, WA; Owner: CRISTA MINISTRIES)
KRKO (1380 AM; 50 kW; EVERETT, WA; Owner: S-R BROADCASTING, CO.)
KIXI (880 AM; 50 kW; MERCER ISLAND/SEATTL, WA; Owner: BELLEVUE RADIO, INC.)
KKOL (1300 AM; 50 kW; SEATTLE, WA; Owner: INSPIRATION MEDIA, INC.)
KGNW (820 AM; 50 kW; BURIEN-SEATTLE, WA; Owner: INSPIRATION MEDIA, INC.)
KOMO (1000 AM; 50 kW; SEATTLE, WA; Owner: FISHER BROADCASTING - SEATTLE RADIO, L.L.C.)
KIRO (710 AM; 50 kW; SEATTLE, WA; Owner: ENTERCOM SEATTLE LICENSE, LLC)
KTTH (770 AM; 50 kW; SEATTLE, WA; Owner: ENTERCOM SEATTLE LICENSE, LLC)
KYCW (1090 AM; 50 kW; SEATTLE, WA; Owner: INFINITY RADIO SUBSIDIARY OPERATIONS INC.)
KJR (950 AM; 50 kW; SEATTLE, WA)
KKNW (1150 AM; 10 kW; SEATTLE, WA; Owner: ORCA RADIO, INC.)
KLFE (1590 AM; 10 kW; SEATTLE, WA; Owner: INSPIRATION MEDIA, INC.)
KARR (1460 AM; 5 kW; KIRKLAND, WA; Owner: FAMILY STATIONS, INC.)
Strongest FM radio stations in Lynnwood:
KCMS (105.3 FM; EDMONDS, WA; Owner: CRISTA MINISTRIES, INC.)
KISW (99.9 FM; SEATTLE, WA; Owner: ENTERCOM SEATTLE LICENSE, LLC)
KQBZ (100.7 FM; SEATTLE, WA; Owner: ENTERCOM SEATTLE LICENSE, LLC)
KMTT (103.7 FM; TACOMA, WA; Owner: ENTERCOM SEATTLE LICENSE, LLC)
KNDD (107.7 FM; SEATTLE, WA; Owner: ENTERCOM SEATTLE LICENSE, LLC)
KYPT (96.5 FM; SEATTLE, WA; Owner: INFINITY RADIO SUBSIDIARY OPERATIONS INC.)
KRWM (106.9 FM; BREMERTON, WA; Owner: SEASCAPE RADIO, INC.)
KBSG-FM (97.3 FM; TACOMA, WA; Owner: ENTERCOM SEATTLE LICENSE, LLC)
KBKS (106.1 FM; TACOMA, WA; Owner: INFINITY RADIO SUBSIDIARY OPERATIONS INC.)
KING-FM (98.1 FM; SEATTLE, WA; Owner: CLASSIC RADIO, INC.)
KLSY-FM (92.5 FM; BELLEVUE, WA; Owner: BELLEVUE RADIO INC.)
KPLU-FM (88.5 FM; TACOMA, WA; Owner: PACIFIC LUTHERAN UNIVERSITY, INC.)
KWJZ (98.9 FM; SEATTLE, WA; Owner: ORCA RADIO, INC.)
KZOK-FM (102.5 FM; SEATTLE, WA; Owner: INFINITY RADIO SUBSIDIARY OPERATIONS INC.)
KMPS-FM (94.1 FM; SEATTLE, WA; Owner: INFINITY RADIO SUBSIDIARY OPERATIONS INC.)
K213BM (90.5 FM; EVERETT, ETC., WA; Owner: JACK STRAW FOUNDATION)
KJR-FM (95.7 FM; SEATTLE, WA; Owner: ACKERLEY MEDIA GROUP, INC.)
KUBE (93.3 FM; SEATTLE, WA; Owner: ACKERLEY MEDIA GROUP, INC.)
KPLZ-FM (101.5 FM; SEATTLE, WA; Owner: FISHER BROADCASTING - SEATTLE RADIO, L.L.C.)
KUOW (94.9 FM; SEATTLE, WA; Owner: THE UNIVERSITY OF WASHINGTON)
TV broadcast stations around Lynnwood:
KING-TV (Channel 5; SEATTLE, WA; Owner: KING BROADCASTING COMPANY)
KSTW (Channel 11; TACOMA, WA; Owner: UPN TELEVISION STATIONS INC.)
KOMO-TV (Channel 4; SEATTLE, WA; Owner: FISHER BROADCASTING - SEATTLE TV, L.L.C.)
KTWB-TV (Channel 22; SEATTLE, WA; Owner: TRIBUNE TELEVISION HOLDINGS, INC.)
K58DP (Channel 58; SEATTLE, WA; Owner: WORD OF GOD FELLOWSHIP, INC.)
KIRO-TV (Channel 7; SEATTLE, WA; Owner: KIRO-TV HOLDINGS, INC.)
KCTS-TV (Channel 9; SEATTLE, WA; Owner: KCTS TELEVISION)
K57HB (Channel 57; EUREKA, CA; Owner: MS COMMUNICATIONS, LLC)
KONG-TV (Channel 16; EVERETT, WA; Owner: KONG-TV, INC.)
KHCV (Channel 45; SEATTLE, WA; Owner: NORTH PACIFIC INTERNATIONAL TELEVISION, INC.)
KWPX (Channel 33; BELLEVUE, WA; Owner: PAXSON COMMUNICATIONS LICENSE COMPANY, LLC)
K68DL (Channel 68; SEATTLE, WA; Owner: THREE ANGELS BROADCASTING NETWORK)
KCPQ (Channel 13; TACOMA, WA; Owner: TRIBUNE TELEVISION NORTHWEST, INC.)
KWDK (Channel 56; TACOMA, WA; Owner: PUGET SOUND EDUCATIONAL TV, INC.)
K29ED (Channel 29; EVERETT, WA; Owner: TRIBUNE TELEVISION HOLDINGS, INC.)
National Bridge Inventory (NBI) Statistics 23 Number of bridges390ft / 119m Total length $88,037,000 Total costs1,098,976 Total average daily traffic55,432 Total average daily truck traffic
New bridges - historical statistics
8 1960-1969 6 1990-1999 5 2000-2009 4 2010-2019
See full National Bridge Inventory statistics for Lynnwood, WA
Home Mortgage Disclosure Act Aggregated Statistics For Year 2009(Based on 5 full and 4 partial tracts) A) FHA, FSA/RHS & VA B) Conventional C) Refinancings D) Home Improvement Loans E) Loans on Dwellings For 5+ Families F) Non-occupant Loans on G) Loans On Manufactured Number Average Value Number Average Value Number Average Value Number Average Value Number Average Value Number Average Value Number Average Value
LOANS ORIGINATED 118 $271,951 109 $233,530 952 $240,694 34 $141,327 1 $139,960 55 $211,745 1 $97,000 APPLICATIONS APPROVED, NOT ACCEPTED 8 $218,064 15 $237,636 98 $245,902 8 $67,561 0 $0 6 $189,197 0 $0 APPLICATIONS DENIED 24 $251,979 31 $213,230 298 $277,156 17 $159,314 0 $0 20 $240,952 3 $64,917 APPLICATIONS WITHDRAWN 23 $216,319 26 $266,090 254 $259,812 6 $120,082 0 $0 24 $212,262 1 $45,890 FILES CLOSED FOR INCOMPLETENESS 2 $236,695 4 $131,945 44 $275,433 1 $8,390 0 $0 5 $160,148 0 $0
Aggregated Statistics For Year 2008(Based on 5 full and 4 partial tracts) A) FHA, FSA/RHS & VA B) Conventional C) Refinancings D) Home Improvement Loans E) Loans on Dwellings For 5+ Families F) Non-occupant Loans on G) Loans On Manufactured Number Average Value Number Average Value Number Average Value Number Average Value Number Average Value Number Average Value Number Average Value
LOANS ORIGINATED 64 $273,638 191 $253,105 578 $236,999 48 $109,339 5 $3,639,258 57 $221,441 1 $32,910 APPLICATIONS APPROVED, NOT ACCEPTED 8 $214,338 28 $256,615 91 $252,182 16 $131,063 0 $0 8 $318,751 1 $32,840 APPLICATIONS DENIED 16 $273,229 49 $273,021 319 $267,560 41 $159,040 2 $9,073,145 22 $204,418 1 $152,220 APPLICATIONS WITHDRAWN 7 $307,611 27 $262,280 168 $261,811 10 $207,651 1 $5,364,900 22 $219,810 0 $0 FILES CLOSED FOR INCOMPLETENESS 2 $164,075 8 $273,045 35 $291,035 8 $106,576 1 $2,381,280 1 $347,840 1 $13,000
Aggregated Statistics For Year 2007(Based on 5 full and 4 partial tracts) A) FHA, FSA/RHS & VA B) Conventional C) Refinancings D) Home Improvement Loans E) Loans on Dwellings For 5+ Families F) Non-occupant Loans on G) Loans On Manufactured Number Average Value Number Average Value Number Average Value Number Average Value Number Average Value Number Average Value Number Average Value
LOANS ORIGINATED 6 $231,060 649 $233,786 807 $226,416 78 $119,176 9 $1,647,043 136 $213,346 6 $21,193 APPLICATIONS APPROVED, NOT ACCEPTED 0 $0 113 $228,516 147 $227,583 17 $131,264 0 $0 23 $186,522 1 $185,320 APPLICATIONS DENIED 1 $189,870 183 $233,073 379 $242,103 54 $103,167 0 $0 47 $232,834 3 $20,697 APPLICATIONS WITHDRAWN 1 $264,000 79 $239,787 237 $230,625 30 $142,889 0 $0 29 $224,849 0 $0 FILES CLOSED FOR INCOMPLETENESS 1 $55,380 17 $232,488 62 $285,802 4 $101,138 0 $0 3 $228,290 0 $0
Aggregated Statistics For Year 2006(Based on 5 full and 4 partial tracts) A) FHA, FSA/RHS & VA B) Conventional C) Refinancings D) Home Improvement Loans E) Loans on Dwellings For 5+ Families F) Non-occupant Loans on G) Loans On Manufactured Number Average Value Number Average Value Number Average Value Number Average Value Number Average Value Number Average Value Number Average Value
LOANS ORIGINATED 20 $207,643 959 $202,393 857 $198,704 109 $104,642 11 $2,652,768 160 $219,292 5 $35,576 APPLICATIONS APPROVED, NOT ACCEPTED 1 $110,640 143 $206,745 178 $234,805 12 $70,556 0 $0 24 $186,187 3 $63,570 APPLICATIONS DENIED 1 $295,250 258 $195,359 399 $200,555 85 $104,631 0 $0 47 $180,375 7 $163,359 APPLICATIONS WITHDRAWN 5 $237,626 124 $208,832 307 $219,422 33 $166,392 1 $615,000 33 $232,146 0 $0 FILES CLOSED FOR INCOMPLETENESS 0 $0 16 $154,800 72 $219,209 6 $110,827 0 $0 8 $192,090 0 $0
Aggregated Statistics For Year 2005(Based on 5 full and 4 partial tracts) A) FHA, FSA/RHS & VA B) Conventional C) Refinancings D) Home Improvement Loans E) Loans on Dwellings For 5+ Families F) Non-occupant Loans on G) Loans On Manufactured Number Average Value Number Average Value Number Average Value Number Average Value Number Average Value Number Average Value Number Average Value
LOANS ORIGINATED 20 $192,670 1,054 $181,050 1,002 $185,823 70 $103,035 17 $2,010,715 182 $170,759 5 $49,998 APPLICATIONS APPROVED, NOT ACCEPTED 3 $120,403 127 $175,016 151 $188,642 18 $112,228 0 $0 26 $156,703 0 $0 APPLICATIONS DENIED 4 $190,325 244 $175,640 432 $193,103 65 $116,137 1 $685,510 47 $175,670 7 $53,501 APPLICATIONS WITHDRAWN 0 $0 146 $191,389 367 $195,364 32 $122,764 1 $9,399,520 31 $198,228 2 $92,400 FILES CLOSED FOR INCOMPLETENESS 2 $223,535 29 $191,194 158 $219,893 9 $73,492 1 $3,429,840 6 $312,543 1 $225,000
Aggregated Statistics For Year 2004(Based on 5 full and 4 partial tracts) A) FHA, FSA/RHS & VA B) Conventional C) Refinancings D) Home Improvement Loans E) Loans on Dwellings For 5+ Families F) Non-occupant Loans on G) Loans On Manufactured Number Average Value Number Average Value Number Average Value Number Average Value Number Average Value Number Average Value Number Average Value
LOANS ORIGINATED 33 $199,220 743 $158,592 936 $166,984 73 $73,595 8 $933,729 153 $152,410 13 $36,402 APPLICATIONS APPROVED, NOT ACCEPTED 3 $117,087 90 $167,472 151 $175,387 17 $63,980 0 $0 14 $150,720 0 $0 APPLICATIONS DENIED 13 $171,665 113 $161,992 390 $176,183 66 $81,491 3 $547,487 39 $172,385 3 $24,697 APPLICATIONS WITHDRAWN 3 $235,303 98 $164,236 311 $173,179 13 $83,532 0 $0 19 $169,359 0 $0 FILES CLOSED FOR INCOMPLETENESS 0 $0 26 $190,439 145 $199,997 4 $111,170 0 $0 11 $144,220 0 $0
Aggregated Statistics For Year 2003(Based on 5 full and 4 partial tracts) A) FHA, FSA/RHS & VA B) Conventional C) Refinancings D) Home Improvement Loans E) Loans on Dwellings For 5+ Families F) Non-occupant Loans on Number Average Value Number Average Value Number Average Value Number Average Value Number Average Value Number Average Value
LOANS ORIGINATED 104 $171,345 593 $166,680 2,182 $154,551 56 $41,304 6 $1,022,032 196 $151,590 APPLICATIONS APPROVED, NOT ACCEPTED 4 $129,955 73 $153,537 222 $164,177 14 $24,735 1 $149,070 15 $152,005 APPLICATIONS DENIED 6 $166,613 83 $135,753 466 $168,794 39 $39,604 0 $0 39 $141,829 APPLICATIONS WITHDRAWN 6 $134,467 50 $133,458 366 $175,470 9 $32,399 0 $0 16 $139,602 FILES CLOSED FOR INCOMPLETENESS 2 $165,455 9 $166,067 66 $172,478 3 $26,457 0 $0 4 $174,105
Aggregated Statistics For Year 2002(Based on 2 full and 3 partial tracts) A) FHA, FSA/RHS & VA B) Conventional C) Refinancings D) Home Improvement Loans E) Loans on Dwellings For 5+ Families F) Non-occupant Loans on Number Average Value Number Average Value Number Average Value Number Average Value Number Average Value Number Average Value
LOANS ORIGINATED 46 $162,663 226 $154,092 599 $157,132 25 $35,293 4 $519,628 55 $200,235 APPLICATIONS APPROVED, NOT ACCEPTED 5 $167,940 36 $148,149 78 $143,523 8 $35,725 1 $629,200 6 $104,630 APPLICATIONS DENIED 1 $233,790 52 $111,813 141 $142,691 13 $25,636 2 $364,265 10 $137,988 APPLICATIONS WITHDRAWN 8 $161,205 31 $135,467 143 $157,294 2 $26,495 0 $0 11 $129,381 FILES CLOSED FOR INCOMPLETENESS 2 $125,955 18 $131,631 36 $145,574 1 $40,540 0 $0 3 $99,920
Aggregated Statistics For Year 2001(Based on 2 full and 3 partial tracts) A) FHA, FSA/RHS & VA B) Conventional C) Refinancings D) Home Improvement Loans E) Loans on Dwellings For 5+ Families F) Non-occupant Loans on Number Average Value Number Average Value Number Average Value Number Average Value Number Average Value Number Average Value
LOANS ORIGINATED 62 $152,557 182 $150,203 476 $141,603 33 $21,309 6 $930,445 40 $125,818 APPLICATIONS APPROVED, NOT ACCEPTED 1 $192,220 29 $138,671 48 $137,081 5 $21,034 0 $0 2 $141,000 APPLICATIONS DENIED 6 $150,418 41 $113,801 135 $138,428 25 $43,121 0 $0 7 $134,784 APPLICATIONS WITHDRAWN 7 $163,331 26 $156,312 122 $148,176 6 $36,218 1 $1,447,530 5 $134,034 FILES CLOSED FOR INCOMPLETENESS 0 $0 5 $79,518 38 $150,048 3 $42,650 1 $3,581,600 0 $0
Aggregated Statistics For Year 2000(Based on 2 full and 3 partial tracts) A) FHA, FSA/RHS & VA B) Conventional C) Refinancings D) Home Improvement Loans E) Loans on Dwellings For 5+ Families F) Non-occupant Loans on Number Average Value Number Average Value Number Average Value Number Average Value Number Average Value Number Average Value
LOANS ORIGINATED 48 $131,261 208 $138,973 111 $114,019 53 $24,110 3 $3,499,170 27 $121,286 APPLICATIONS APPROVED, NOT ACCEPTED 2 $121,325 31 $144,738 28 $98,188 15 $22,409 0 $0 1 $162,940 APPLICATIONS DENIED 7 $125,117 62 $117,342 66 $102,111 27 $32,278 0 $0 12 $183,064 APPLICATIONS WITHDRAWN 6 $135,642 22 $141,092 49 $116,808 6 $80,743 0 $0 6 $142,268 FILES CLOSED FOR INCOMPLETENESS 0 $0 9 $120,228 31 $124,105 2 $19,810 0 $0 4 $128,575
Aggregated Statistics For Year 1999(Based on 3 full and 4 partial tracts) A) FHA, FSA/RHS & VA B) Conventional C) Refinancings D) Home Improvement Loans E) Loans on Dwellings For 5+ Families F) Non-occupant Loans on Number Average Value Number Average Value Number Average Value Number Average Value Number Average Value Number Average Value
LOANS ORIGINATED 146 $148,952 458 $136,527 596 $117,024 111 $26,589 9 $799,083 87 $104,540 APPLICATIONS APPROVED, NOT ACCEPTED 3 $132,187 45 $124,427 99 $116,897 34 $15,428 0 $0 7 $103,360 APPLICATIONS DENIED 8 $117,362 98 $124,475 208 $127,022 55 $21,010 0 $0 12 $364,807 APPLICATIONS WITHDRAWN 9 $134,350 46 $123,812 133 $123,492 12 $73,809 3 $1,780,680 8 $104,825 FILES CLOSED FOR INCOMPLETENESS 2 $166,985 15 $109,587 54 $123,955 1 $157,150 0 $0 2 $110,775
Detailed mortgage data for all 9 tracts in Lynnwood, WA
Private Mortgage Insurance Companies Aggregated Statistics For Year 2009(Based on 5 full and 4 partial tracts) A) Conventional B) Refinancings Number Average Value Number Average Value
LOANS ORIGINATED 7 $296,976 24 $270,593 APPLICATIONS APPROVED, NOT ACCEPTED 6 $246,522 8 $283,275 APPLICATIONS DENIED 2 $312,345 5 $350,388 APPLICATIONS WITHDRAWN 0 $0 5 $269,160 FILES CLOSED FOR INCOMPLETENESS 2 $295,000 1 $301,960
Aggregated Statistics For Year 2008(Based on 5 full and 4 partial tracts) A) Conventional B) Refinancings C) Non-occupant Loans on Number Average Value Number Average Value Number Average Value
LOANS ORIGINATED 80 $288,500 48 $288,880 2 $236,795 APPLICATIONS APPROVED, NOT ACCEPTED 29 $295,027 20 $333,172 2 $267,660 APPLICATIONS DENIED 8 $280,226 6 $281,997 3 $264,070 APPLICATIONS WITHDRAWN 3 $259,840 3 $353,283 0 $0 FILES CLOSED FOR INCOMPLETENESS 1 $188,470 1 $270,190 0 $0
Aggregated Statistics For Year 2007(Based on 5 full and 4 partial tracts) A) Conventional B) Refinancings C) Non-occupant Loans on Number Average Value Number Average Value Number Average Value
LOANS ORIGINATED 120 $268,234 47 $281,854 7 $294,970 APPLICATIONS APPROVED, NOT ACCEPTED 9 $273,646 6 $259,470 0 $0 APPLICATIONS DENIED 3 $258,667 2 $133,000 0 $0 APPLICATIONS WITHDRAWN 10 $263,759 2 $313,805 1 $277,480 FILES CLOSED FOR INCOMPLETENESS 3 $436,150 0 $0 0 $0
Aggregated Statistics For Year 2006(Based on 5 full and 4 partial tracts) A) Conventional B) Refinancings C) Non-occupant Loans on Number Average Value Number Average Value Number Average Value
LOANS ORIGINATED 51 $259,763 15 $304,433 2 $350,705 APPLICATIONS APPROVED, NOT ACCEPTED 4 $275,008 5 $263,748 0 $0 APPLICATIONS DENIED 0 $0 0 $0 0 $0 APPLICATIONS WITHDRAWN 2 $182,305 3 $209,667 0 $0 FILES CLOSED FOR INCOMPLETENESS 0 $0 1 $387,000 0 $0
Aggregated Statistics For Year 2005(Based on 5 full and 4 partial tracts) A) Conventional B) Refinancings C) Non-occupant Loans on Number Average Value Number Average Value Number Average Value
LOANS ORIGINATED 55 $216,557 27 $250,137 6 $227,870 APPLICATIONS APPROVED, NOT ACCEPTED 4 $192,788 3 $344,243 2 $94,745 APPLICATIONS DENIED 0 $0 1 $309,000 0 $0 APPLICATIONS WITHDRAWN 0 $0 2 $358,120 0 $0 FILES CLOSED FOR INCOMPLETENESS 0 $0 0 $0 0 $0
Aggregated Statistics For Year 2004(Based on 5 full and 4 partial tracts) A) Conventional B) Refinancings C) Non-occupant Loans on Number Average Value Number Average Value Number Average Value
LOANS ORIGINATED 80 $190,535 43 $204,890 6 $141,358 APPLICATIONS APPROVED, NOT ACCEPTED 8 $190,760 15 $199,393 2 $182,470 APPLICATIONS DENIED 0 $0 0 $0 0 $0 APPLICATIONS WITHDRAWN 5 $199,850 3 $240,793 0 $0 FILES CLOSED FOR INCOMPLETENESS 1 $208,120 2 $212,230 0 $0
Aggregated Statistics For Year 2003(Based on 5 full and 4 partial tracts) A) Conventional B) Refinancings C) Non-occupant Loans on Number Average Value Number Average Value Number Average Value
LOANS ORIGINATED 104 $198,087 127 $185,577 7 $150,651 APPLICATIONS APPROVED, NOT ACCEPTED 11 $192,321 25 $180,957 2 $139,935 APPLICATIONS DENIED 0 $0 5 $224,682 0 $0 APPLICATIONS WITHDRAWN 3 $142,000 7 $177,413 1 $100,130 FILES CLOSED FOR INCOMPLETENESS 0 $0 1 $210,000 0 $0
Aggregated Statistics For Year 2002(Based on 2 full and 3 partial tracts) A) Conventional B) Refinancings C) Non-occupant Loans on Number Average Value Number Average Value Number Average Value
LOANS ORIGINATED 61 $185,772 45 $177,045 3 $138,290 APPLICATIONS APPROVED, NOT ACCEPTED 9 $149,551 11 $158,906 3 $123,370 APPLICATIONS DENIED 3 $212,810 3 $152,243 0 $0 APPLICATIONS WITHDRAWN 1 $223,490 3 $165,780 1 $163,590 FILES CLOSED FOR INCOMPLETENESS 0 $0 0 $0 0 $0
Aggregated Statistics For Year 2001(Based on 2 full and 3 partial tracts) A) Conventional B) Refinancings C) Non-occupant Loans on Number Average Value Number Average Value Number Average Value
LOANS ORIGINATED 51 $181,911 48 $181,035 5 $143,718 APPLICATIONS APPROVED, NOT ACCEPTED 6 $151,843 7 $172,684 1 $125,870 APPLICATIONS DENIED 1 $188,800 5 $186,526 0 $0 APPLICATIONS WITHDRAWN 0 $0 2 $128,755 0 $0 FILES CLOSED FOR INCOMPLETENESS 0 $0 0 $0 0 $0
Aggregated Statistics For Year 2000(Based on 2 full and 3 partial tracts) A) Conventional B) Refinancings C) Non-occupant Loans on Number Average Value Number Average Value Number Average Value
LOANS ORIGINATED 67 $155,704 11 $177,092 5 $172,592 APPLICATIONS APPROVED, NOT ACCEPTED 6 $122,392 0 $0 0 $0 APPLICATIONS DENIED 4 $152,502 1 $192,400 3 $140,360 APPLICATIONS WITHDRAWN 3 $143,380 1 $100,130 0 $0 FILES CLOSED FOR INCOMPLETENESS 1 $171,340 0 $0 0 $0
Aggregated Statistics For Year 1999(Based on 3 full and 4 partial tracts) A) Conventional B) Refinancings C) Non-occupant Loans on Number Average Value Number Average Value Number Average Value
LOANS ORIGINATED 143 $158,591 55 $155,587 6 $128,108 APPLICATIONS APPROVED, NOT ACCEPTED 8 $127,818 12 $161,727 2 $94,355 APPLICATIONS DENIED 2 $128,895 8 $152,385 0 $0 APPLICATIONS WITHDRAWN 6 $145,463 7 $166,661 0 $0 FILES CLOSED FOR INCOMPLETENESS 1 $62,590 0 $0 0 $0
Fire-safe hotels and motels in Lynnwood, Washington:
Residence Inn By Marriott Seattle Lynnwood/Everett, 18200 Alderwood Mall Pkwy, Lynnwood, Washington 98037 Phone: (425) 771-1100, Fax: (425) 771-6602
Embassy Suites Hotel Seattle North/Lynnwood, 20610 44th Ave W, Lynnwood, Washington 98036 Phone: (425) 775-2500, Fax: (425) 774-0485
Comfort Inn Lynnwood, 4117 196th St SW, Lynnwood, Washington 98036 Phone: (425) 775-8030, Fax: (425) 774-0344
Best Western Alderwood, 19332 36TH Ave W, Lynnwood, Washington 98036 Phone: (800) 205-6935, Fax: (425) 771-3087
Extended Stay America - Seattle - Lynnwood, 3021 196th St SW, Lynnwood, Washington 98036 Phone: (425) 670-2520, Fax: (425) 670-2780
La Quinta Inn, 4300 Alderwood Mall Blvd, Lynnwood, Washington 98036 Phone: (425) 775-7447, Fax: (425) 775-8063
Courtyard By Marriott, 4220 Alderwood Mall Blvd, Lynnwood, Washington 98036 Phone: (425) 670-0500, Fax: (425) 670-0555
Holiday Inn Express, 2515 196th St SW, Lynnwood, Washington 98036 Phone: (425) 672-1234, Fax: (425) 776-2345
2 other hotels and motels
All 10 fire-safe hotels and motels in Lynnwood, Washington
Most common first names in Lynnwood, WA among deceased individuals Name Count Lived (average)
John 251 74.3 years Robert 218 71.0 years William 204 74.3 years James 175 71.5 years Mary 143 77.6 years Charles 139 71.1 years Margaret 127 78.4 years George 118 77.0 years Helen 112 78.8 years Ruth 100 80.7 years
Most common last names in Lynnwood, WA among deceased individuals Last name Count Lived (average)
Johnson 93 77.3 years Smith 89 72.1 years Anderson 78 77.1 years Miller 72 74.3 years Nelson 53 77.2 years Brown 49 78.1 years Wilson 43 78.9 years Jones 41 73.4 years Davis 34 77.5 years Martin 31 74.1 years
Lynnwood compared to Washington state average:
Unemployed percentage below state average. Black race population percentage above state average. Median age above state average. Foreign-born population percentage significantly above state average. Length of stay since moving in significantly above state average.
#57 on the list of "Top 101 cities with the most residents born in Other Western Africa (population 500+)"
#84 on the list of "Top 101 cities with the most residents born in Ethiopia (population 500+)"
#24 on the list of "Top 101 counties with the lowest Particulate Matter (PM2.5 ) Annual air pollution readings in 2012 (µg/m3 )"
#45 on the list of "Top 101 counties with the lowest number of infant deaths per 1000 residents 2007-2013 (pop. 50,000+)"
#46 on the list of "Top 101 counties with the highest percentage of residents that exercised in the past month"
#48 on the list of "Top 101 counties with the highest average weight of females"
#60 on the list of "Top 101 counties with the most Other congregations (pop. 50,000+)"
Top Patent Applicants
Clifford A. Kushler (53)
Alan D. Snow (34)
Dean R. Brown (22)
Spencer Frazer (21)
Geoffrey J. Hulten (21)
Benjamin A. Johnson (13)
Alan Snow (9)
Mark E. Wentland (9)
Benjamin N. Truelove (8)
Karl Mills (8)
Total of 1002 patent applications in 2008-2024.
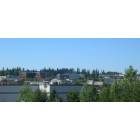
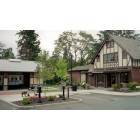
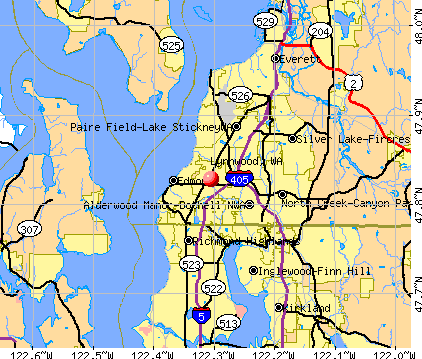


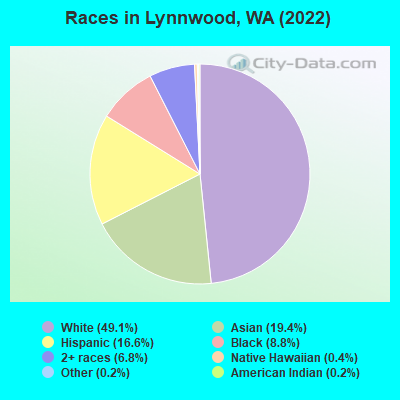
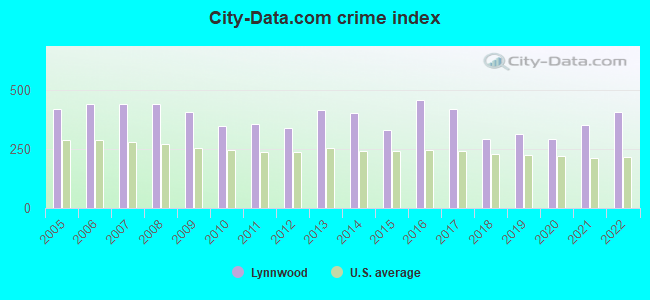
 Recent articles from our blog. Our writers, many of them Ph.D. graduates or candidates, create easy-to-read articles on a wide variety of topics.

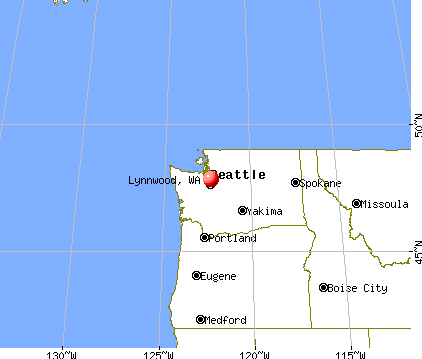
 (5.2 miles
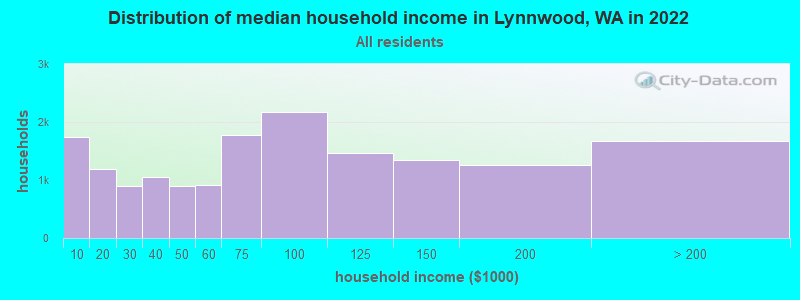
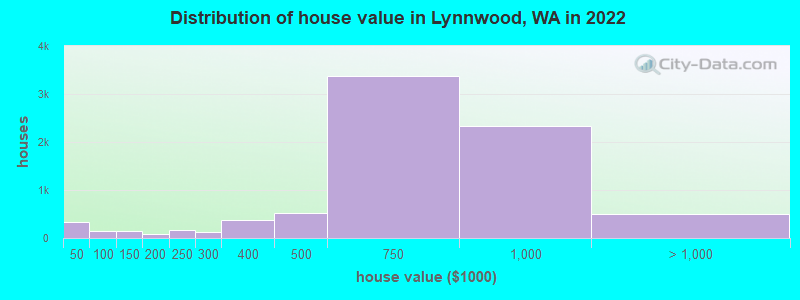
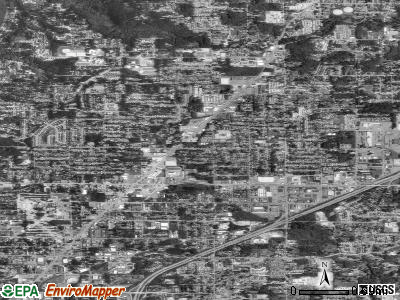
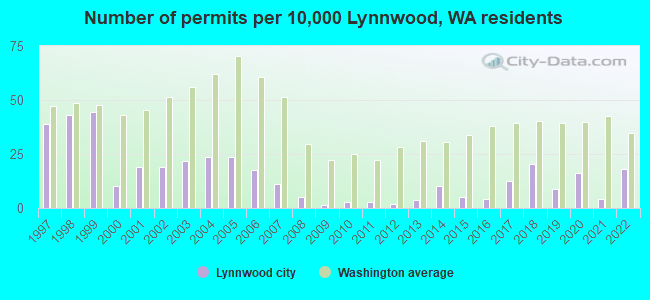
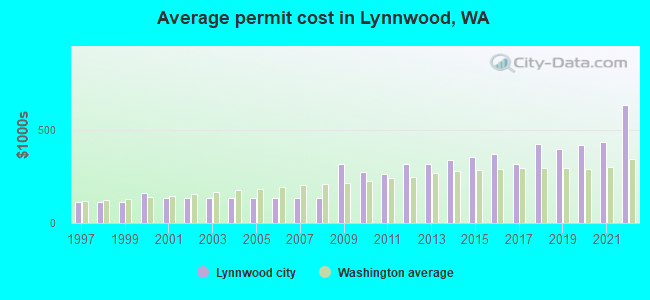
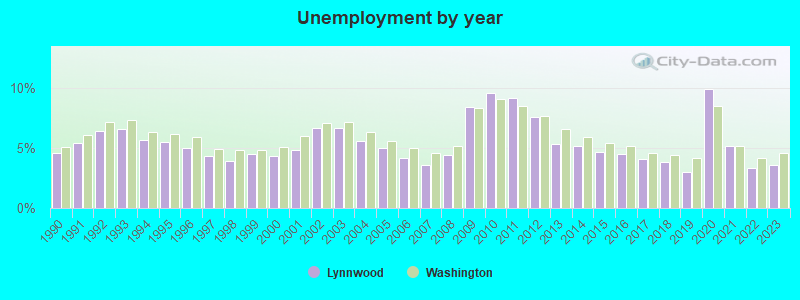
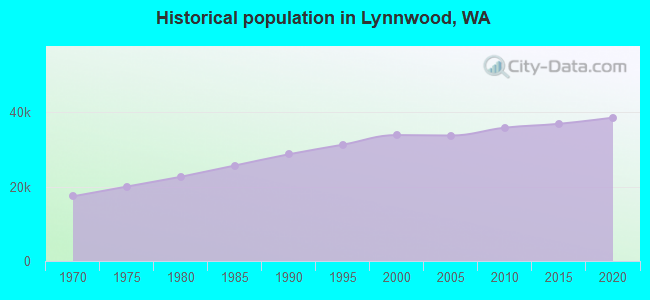
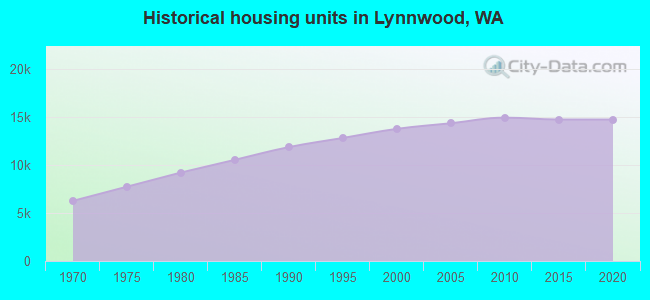
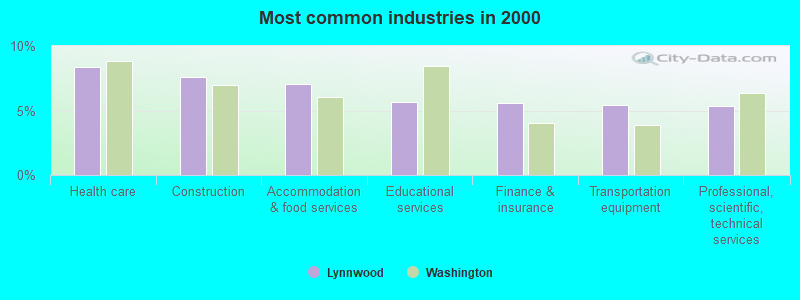
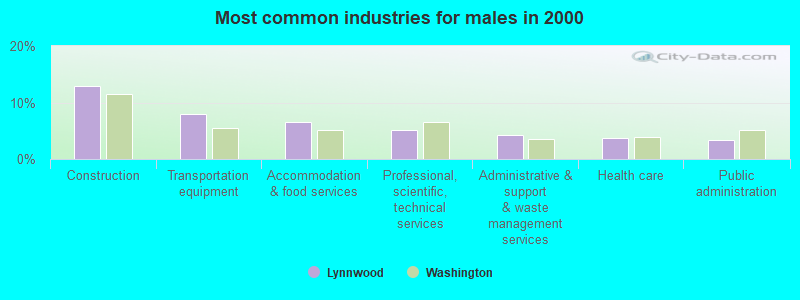
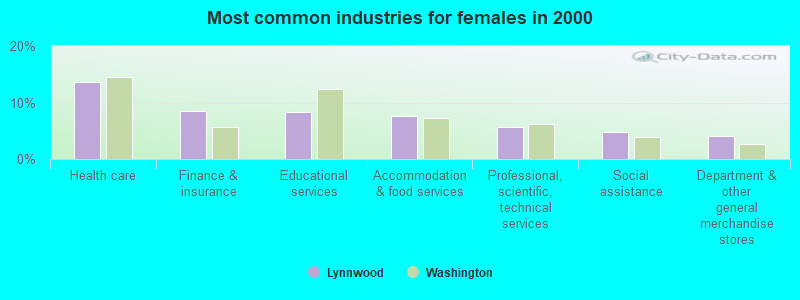
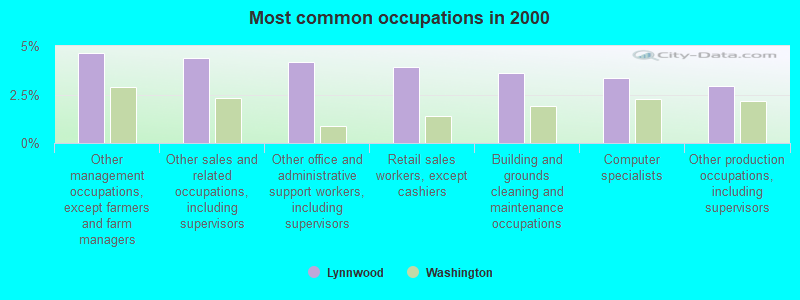
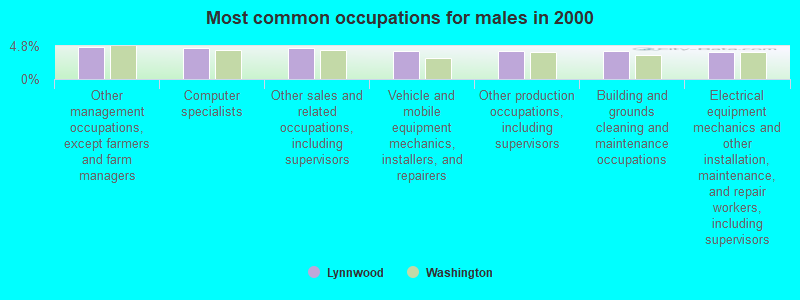
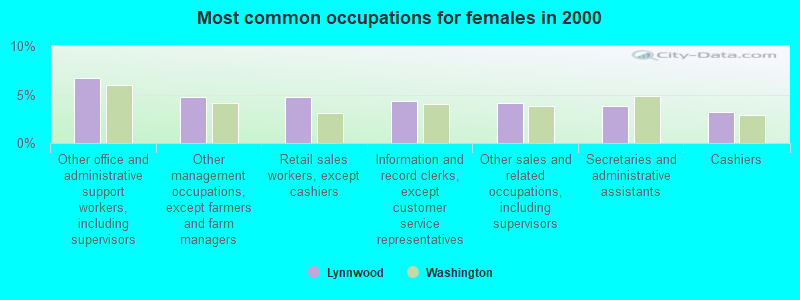
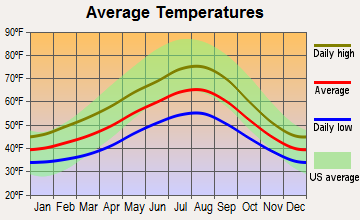
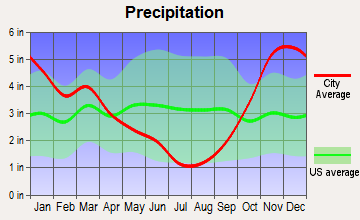
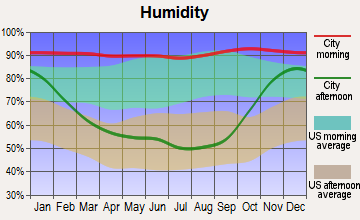
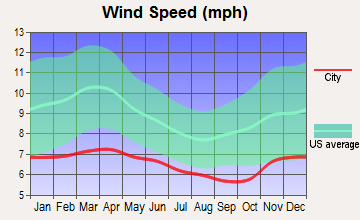
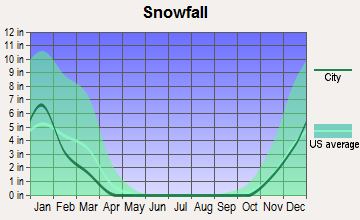
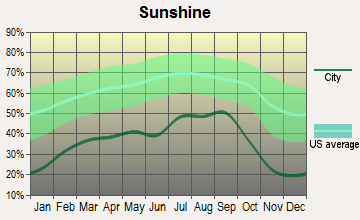
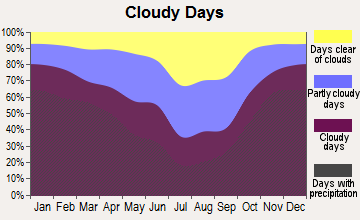
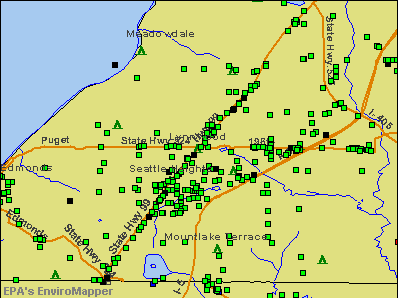

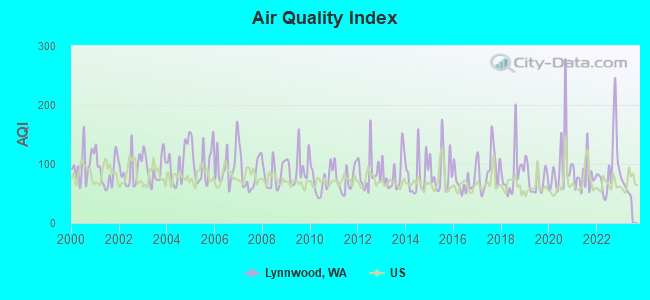
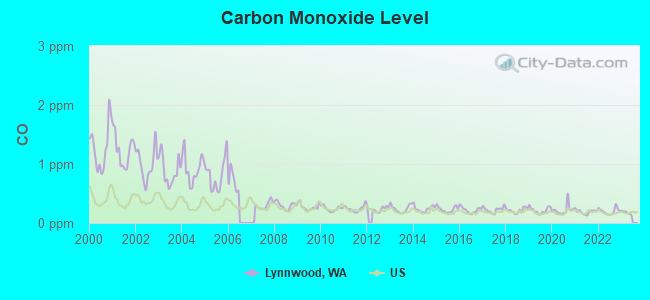
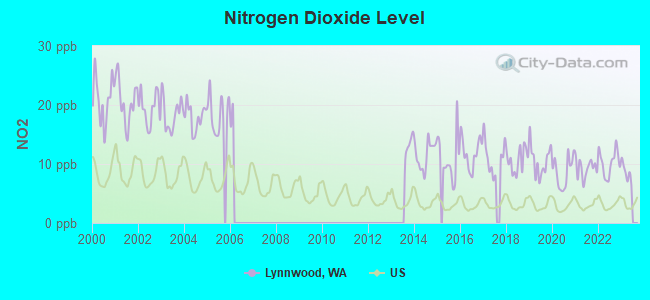
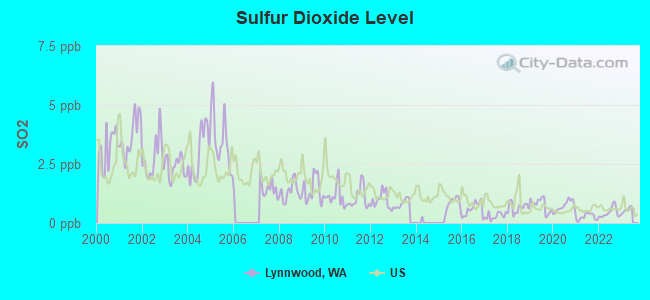
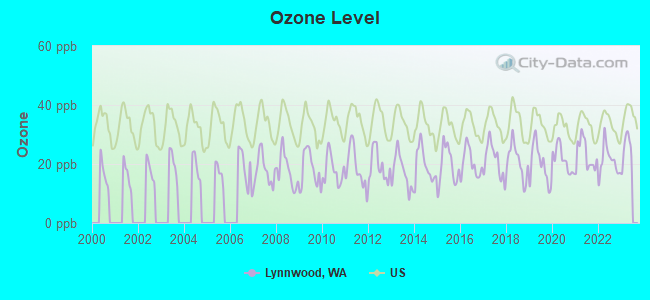
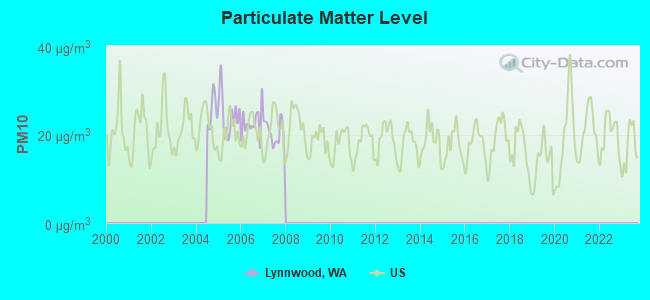
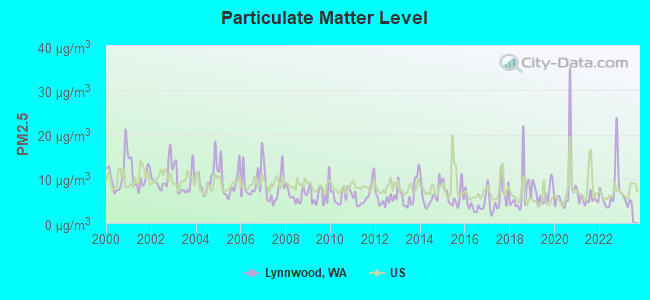
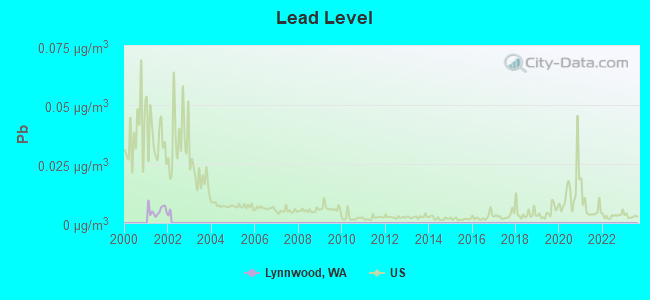
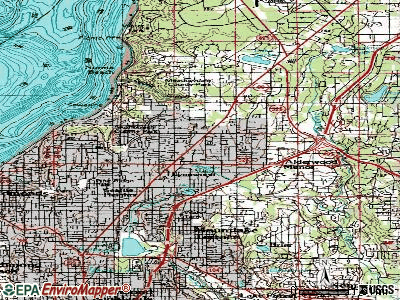
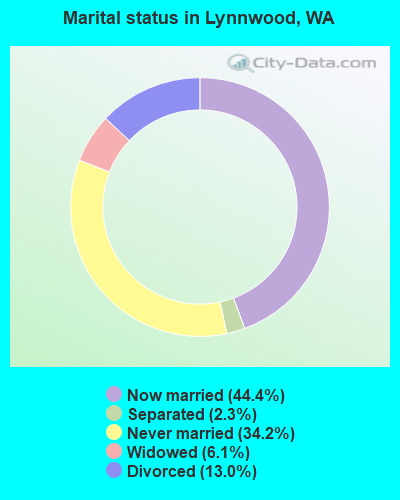
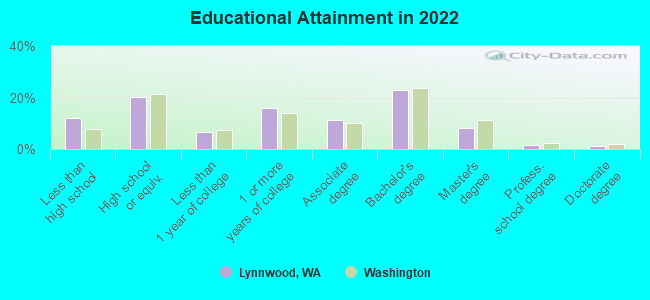
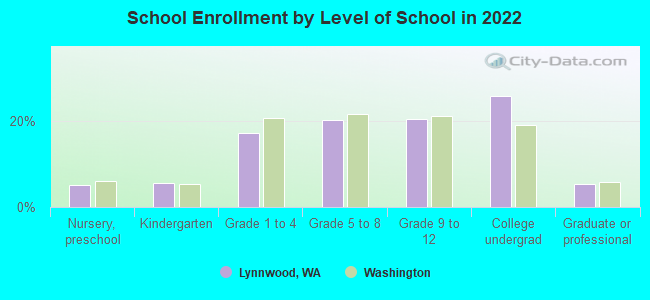
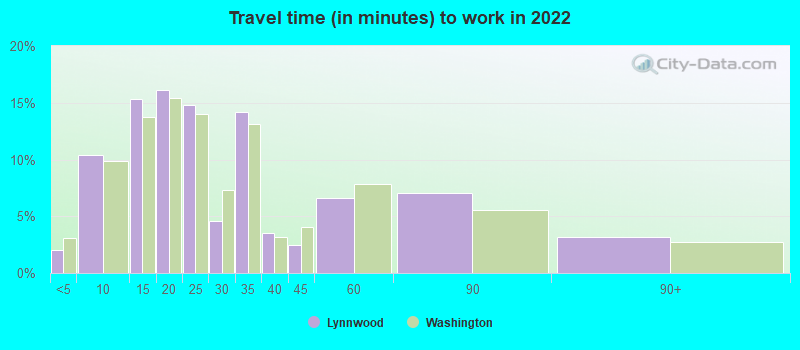
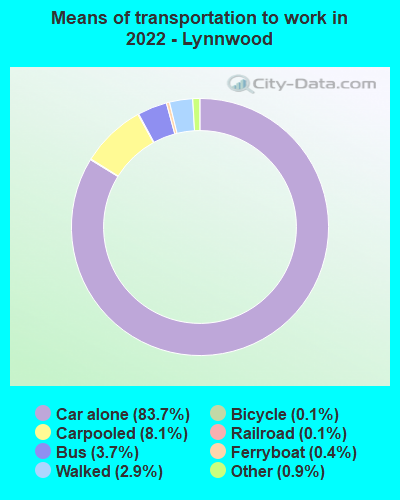
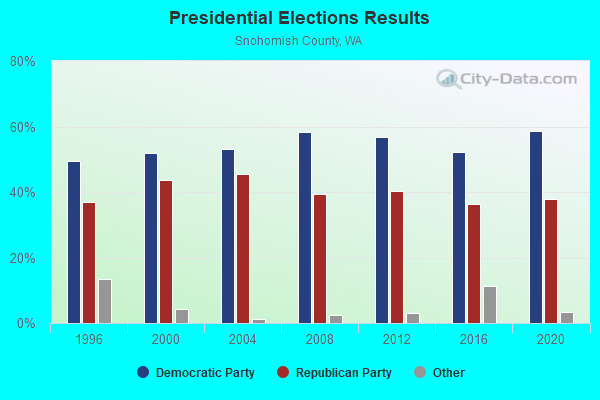
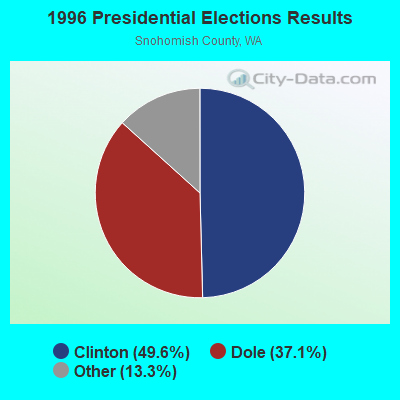
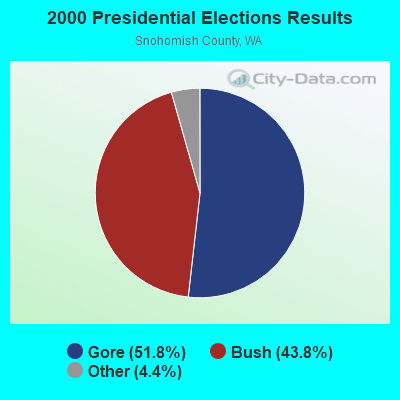
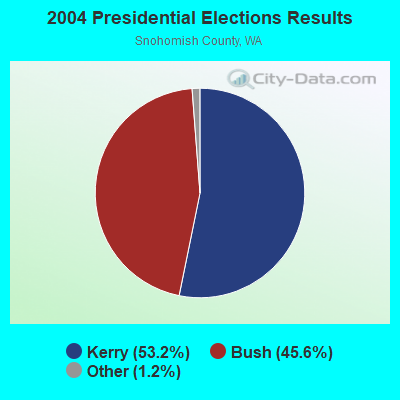
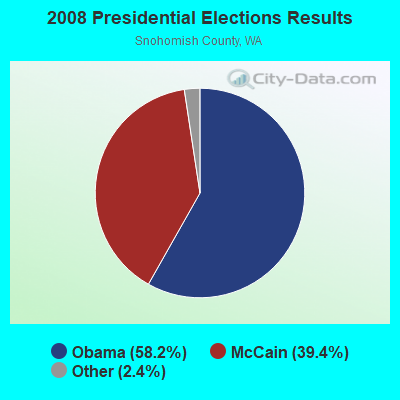

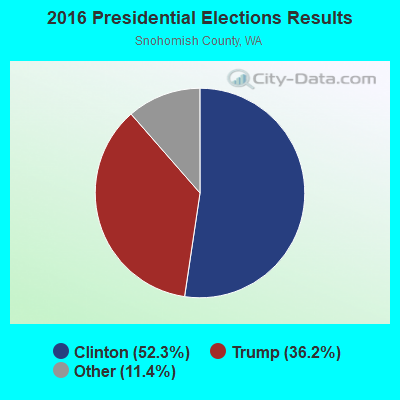
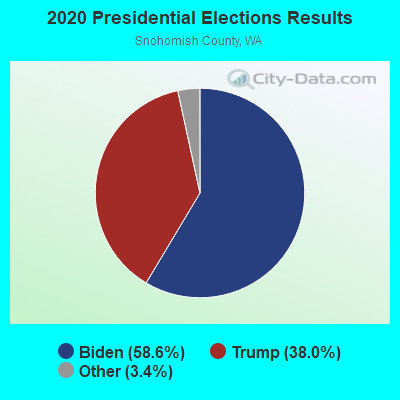
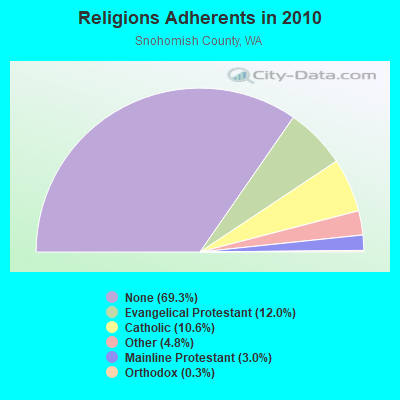
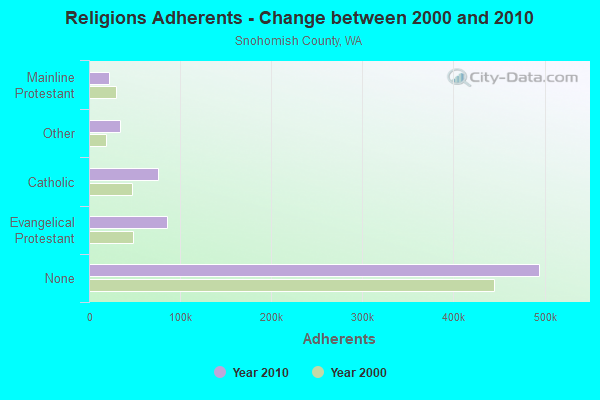
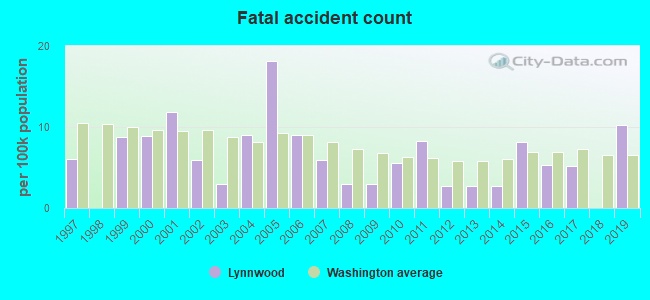
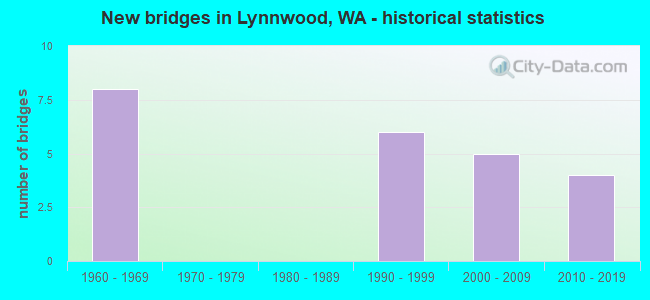
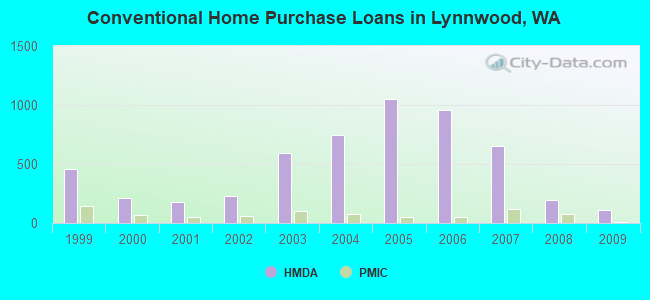
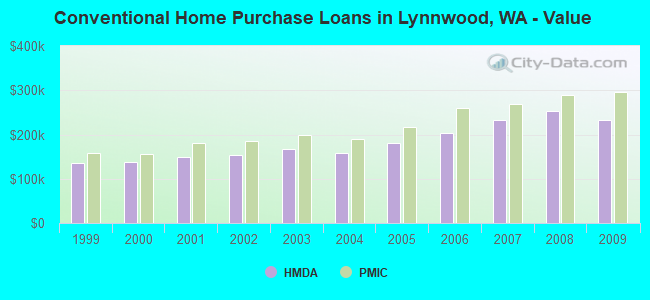
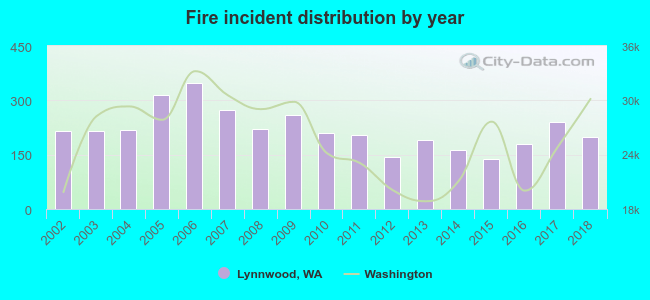 Based on the data from the years 2002 - 2018 the average number of fires per year is 219. The highest number of reported fires - 347 took place in 2006, and the least - 138 in 2015. The data has a declining trend.
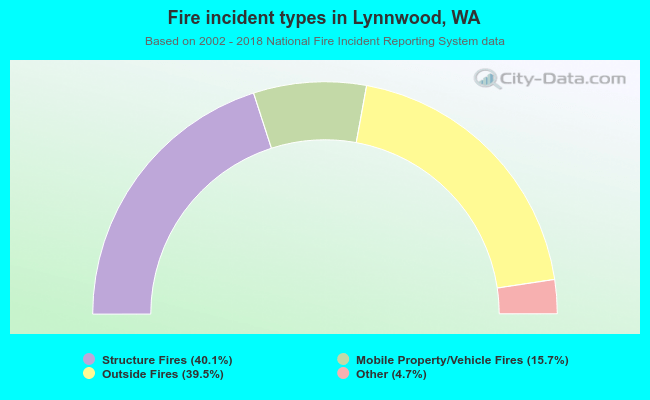 When looking into fire subcategories, the most reports belonged to: Structure Fires (40.1%), and Outside Fires (39.5%).