Estimated zip code population in 2022: 42,697 Zip code population in 2010: 36,000 Zip code population in 2000: 33,705
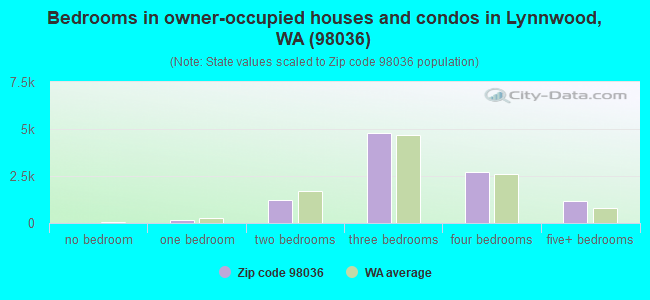
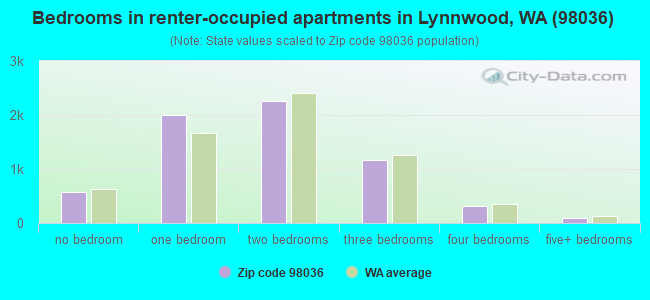
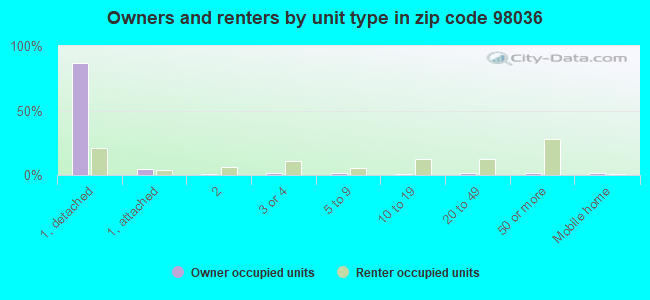
Houses and condos: 17,206 Renter-occupied apartments: 6,426
% of renters here:
39%
State:
36%
March 2022 cost of living index in zip code 98036: 114.7 (more than average, U.S. average is 100)
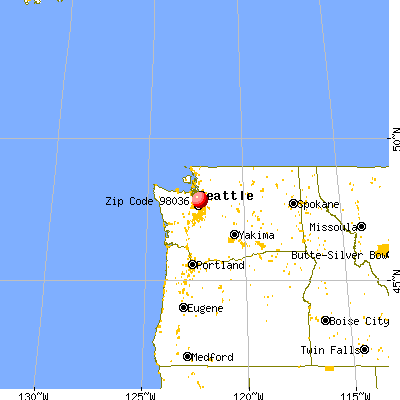
Land area: 9.7 sq. mi. Water area: 0.0 sq. mi.
Population density: 4,409 people per square mile
(average).
OSM Map
General Map
Google Map
MSN Map
OSM Map
General Map
Google Map
MSN Map
OSM Map
General Map
Google Map
MSN Map
OSM Map
General Map
Google Map
MSN Map
Please wait while loading the map...
Real estate property taxes paid for housing units in 2022:
This zip code:
0.7% ($5,663)
Washington:
0.8% ($4,283)
Median real estate property taxes paid for housing units with mortgages in 2022: $5,745 (0.7%) Median real estate property taxes paid for housing units with no mortgage in 2022: $5,489 (0.8%)
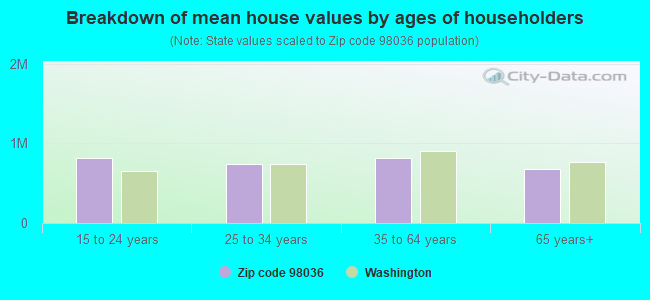
Estimated median house/condo value in 2022: $794,341
98036:
$794,341
Washington:
$569,500
According to our research of Washington and other state lists, there were 8 registered sex offenders living in 98036 zip code as of April 27, 2024. The ratio of all residents to sex offenders in zip code 98036 is 4,886 to 1. The ratio of registered sex offenders to all residents in this zip code is much lower than the state average.
Median resident age:
This zip code:
39.5 years
Washington median age:
38.4 years
Average household size:
This zip code:
2.6 people
Washington:
2.5 people
Averages for the 2020 tax year for zip code 98036, filed in 2021:
Average Adjusted Gross Income (AGI) in 2020: $86,387 (Individual Income Tax Returns)
Here:
$86,387
State:
$99,264
Salary/wage: $79,065 (reported on 83.3% of returns)
Here:
$79,065
State:
$80,347
(% of AGI for various income ranges: 1111.7% for AGIs below $25k, 3582.4% for AGIs $25k-50k, 6551.0% for AGIs $50k-75k, 9929.7% for AGIs $75k-100k, 19684.6% for AGIs $100k-200k, 73547.7% for AGIs over 200k)
Taxable interest for individuals: $1,016 (reported on 35.8% of returns)
This zip code:
$1,016
Washington:
$2,077
(% of AGI for various income ranges: 18.2% for AGIs below $25k, 17.7% for AGIs $25k-50k, 36.0% for AGIs $50k-75k, 60.3% for AGIs $75k-100k, 98.7% for AGIs $100k-200k, 379.7% for AGIs over 200k)
Ordinary dividends: $3,601 (reported on 23.7% of returns)
Here:
$3,601
State:
$10,013
(% of AGI for various income ranges: 32.5% for AGIs below $25k, 39.8% for AGIs $25k-50k, 97.3% for AGIs $50k-75k, 139.3% for AGIs $75k-100k, 229.9% for AGIs $100k-200k, 924.6% for AGIs over 200k)
Net capital gain/loss in AGI: +$17,094 (reported on 22.9% of returns)
Here:
+$17,094
State:
+$40,092
(% of AGI for various income ranges: 11.0% for AGIs below $25k, 42.5% for AGIs $25k-50k, 85.7% for AGIs $50k-75k, 252.4% for AGIs $75k-100k, 491.3% for AGIs $100k-200k, 10139.5% for AGIs over 200k)
Profit/loss from business: +$14,453 (reported on 14.5% of returns)
Here:
+$14,453
State:
+$18,312
(% of AGI for various income ranges: 164.9% for AGIs below $25k, 173.8% for AGIs $25k-50k, 239.5% for AGIs $50k-75k, 372.9% for AGIs $75k-100k, 572.6% for AGIs $100k-200k, 1223.8% for AGIs over 200k)
Taxable individual retirement arrangement distribution: $21,819 (reported on 7.5% of returns)
98036:
$21,819
Washington:
$24,221
(% of AGI for various income ranges: 56.5% for AGIs below $25k, 74.5% for AGIs $25k-50k, 192.1% for AGIs $50k-75k, 313.2% for AGIs $75k-100k, 557.1% for AGIs $100k-200k, 1261.5% for AGIs over 200k)
Self-employed (Keogh) retirement plans: $15,086 (reported on 0.3% of returns)
98036:
$15,086
Washington:
$24,166
(% of AGI for various income ranges: 16.8% for AGIs $100k-200k, 109.7% for AGIs over 200k)
Total itemized deductions: $31,979 (reported on 13.7% of returns)
Here:
$31,979
State:
$39,068
(% of AGI for various income ranges: 106.8% for AGIs below $25k, 154.4% for AGIs $25k-50k, 421.5% for AGIs $50k-75k, 729.5% for AGIs $75k-100k, 1397.0% for AGIs $100k-200k, 4834.9% for AGIs over 200k)
Charity contributions: $7,701 (reported on 9.9% of returns)
Here:
$7,701
State:
$15,331
(% of AGI for various income ranges: 3.4% for AGIs below $25k, 14.8% for AGIs $25k-50k, 46.9% for AGIs $50k-75k, 85.1% for AGIs $75k-100k, 224.7% for AGIs $100k-200k, 1253.1% for AGIs over 200k)
Taxes paid: $7,720 (reported on 13.6% of returns)
98036:
$7,720
State:
$7,774
(% of AGI for various income ranges: 15.4% for AGIs below $25k, 33.0% for AGIs $25k-50k, 104.4% for AGIs $50k-75k, 192.2% for AGIs $75k-100k, 359.3% for AGIs $100k-200k, 1083.6% for AGIs over 200k)
Earned income credit: $1,845 (reported on 8.7% of returns)
Here:
$1,845
State:
$2,020
(% of AGI for various income ranges: 55.8% for AGIs below $25k, 37.3% for AGIs $25k-50k, 0.6% for AGIs $50k-75k)
Percentage of individuals using paid preparers for their 2020 taxes: 91.7%
Here:
92%
State:
93%
(% for various income ranges: 90.1% for AGIs below $25k, 91.6% for AGIs $25k-50k, 91.3% for AGIs $50k-75k, 91.3% for AGIs $75k-100k, 92.8% for AGIs $100k-200k, 94.4% for AGIs over 200k)
Averages for the 2012 tax year for zip code 98036, filed in 2013:
Average Adjusted Gross Income (AGI) in 2012: $58,891 (Individual Income Tax Returns)
Here:
$58,891
State:
$69,533
Salary/wage: $54,444 (reported on 86.8% of returns)
Here:
$54,444
State:
$57,267
(% of AGI for various income ranges: 78.5% for AGIs below $25k, 82.8% for AGIs $25k-50k, 80.7% for AGIs $50k-75k, 83.7% for AGIs $75k-100k, 84.8% for AGIs $100k-200k, 61.4% for AGIs over 200k)
Taxable interest for individuals: $781 (reported on 39.6% of returns)
This zip code:
$781
Washington:
$1,816
(% of AGI for various income ranges: 1.0% for AGIs below $25k, 0.4% for AGIs $25k-50k, 0.5% for AGIs $50k-75k, 0.4% for AGIs $75k-100k, 0.4% for AGIs $100k-200k, 0.8% for AGIs over 200k)
Ordinary dividends: $2,949 (reported on 20.3% of returns)
Here:
$2,949
State:
$8,163
(% of AGI for various income ranges: 1.4% for AGIs below $25k, 0.8% for AGIs $25k-50k, 0.9% for AGIs $50k-75k, 0.8% for AGIs $75k-100k, 0.9% for AGIs $100k-200k, 1.7% for AGIs over 200k)
Net capital gain/loss in AGI: +$5,883 (reported on 15.7% of returns)
Here:
+$5,883
State:
+$21,568
(% of AGI for various income ranges: 0.2% for AGIs $25k-50k, 0.3% for AGIs $50k-75k, 0.2% for AGIs $75k-100k, 1.1% for AGIs $100k-200k, 8.6% for AGIs over 200k)
Profit/loss from business: +$13,465 (reported on 13.5% of returns)
Here:
+$13,465
State:
+$16,521
(% of AGI for various income ranges: 7.7% for AGIs below $25k, 4.1% for AGIs $25k-50k, 3.8% for AGIs $50k-75k, 2.7% for AGIs $75k-100k, 2.2% for AGIs $100k-200k, 1.5% for AGIs over 200k)
Taxable individual retirement arrangement distribution: $13,754 (reported on 8.4% of returns)
98036:
$13,754
Washington:
$18,648
(% of AGI for various income ranges: 2.8% for AGIs below $25k, 1.9% for AGIs $25k-50k, 2.2% for AGIs $50k-75k, 1.9% for AGIs $75k-100k, 2.0% for AGIs $100k-200k, 1.3% for AGIs over 200k)
Self-employment retirement plans: $12,600 (reported on 0.5% of returns)
98036:
$12,600
Washington:
$20,087
Total itemized deductions: $21,050 (21% of AGI, reported on 35.2% of returns)
Here:
$21,050
State:
$23,872
Here:
21.1% of AGI
State:
18.2% of AGI
(% of AGI for various income ranges: 9.6% for AGIs below $25k, 10.1% for AGIs $25k-50k, 13.6% for AGIs $50k-75k, 14.8% for AGIs $75k-100k, 13.9% for AGIs $100k-200k, 9.7% for AGIs over 200k)
Charity contributions: $3,275 (reported on 28.3% of returns)
Here:
$3,275
State:
$4,465
(% of AGI for various income ranges: 0.7% for AGIs below $25k, 0.8% for AGIs $25k-50k, 1.3% for AGIs $50k-75k, 1.6% for AGIs $75k-100k, 1.9% for AGIs $100k-200k, 2.3% for AGIs over 200k)
Taxes paid: $5,244 (reported on 34.9% of returns)
98036:
$5,244
State:
$6,400
(% of AGI for various income ranges: 1.8% for AGIs below $25k, 2.4% for AGIs $25k-50k, 3.2% for AGIs $50k-75k, 3.7% for AGIs $75k-100k, 3.6% for AGIs $100k-200k, 2.4% for AGIs over 200k)
Earned income credit: $1,920 (reported on 12.3% of returns)
Here:
$1,920
State:
$2,073
(% of AGI for various income ranges: 4.2% for AGIs below $25k, 0.7% for AGIs $25k-50k)
Percentage of individuals using paid preparers for their 2012 taxes: 40.8%
Here:
41%
State:
43%
(% for various income ranges: 37.0% for AGIs below $25k, 41.8% for AGIs $25k-50k, 42.5% for AGIs $50k-75k, 43.4% for AGIs $75k-100k, 41.7% for AGIs $100k-200k, 57.5% for AGIs over 200k)
Averages for the 2004 tax year for zip code 98036, filed in 2005:
Average Adjusted Gross Income (AGI) in 2004: $46,335 (Individual Income Tax Returns)
Here:
$46,335
State:
$54,331
Salary/wage: $43,201 (reported on 87.3% of returns)
Here:
$43,201
State:
$45,761
(% of AGI for various income ranges: 113.9% for AGIs below $10k, 78.5% for AGIs $10k-25k, 85.2% for AGIs $25k-50k, 84.3% for AGIs $50k-75k, 88.3% for AGIs $75k-100k, 71.9% for AGIs over 100k)
Taxable interest for individuals: $1,220 (reported on 44.6% of returns)
This zip code:
$1,220
Washington:
$2,110
(% of AGI for various income ranges: 4.6% for AGIs below $10k, 1.9% for AGIs $10k-25k, 0.9% for AGIs $25k-50k, 1.0% for AGIs $50k-75k, 0.7% for AGIs $75k-100k, 1.4% for AGIs over 100k)
Taxable dividends: $2,706 (reported on 25.2% of returns)
Here:
$2,706
State:
$5,879
(% of AGI for various income ranges: 3.4% for AGIs below $10k, 1.4% for AGIs $10k-25k, 1.0% for AGIs $25k-50k, 1.0% for AGIs $50k-75k, 1.0% for AGIs $75k-100k, 2.3% for AGIs over 100k)
Net capital gain/loss: +$6,511 (reported on 19.9% of returns)
Here:
+$6,511
State:
+$15,835
(% of AGI for various income ranges: -1.6% for AGIs below $10k, -0.1% for AGIs $10k-25k, 0.3% for AGIs $25k-50k, 0.7% for AGIs $50k-75k, 0.9% for AGIs $75k-100k, 8.0% for AGIs over 100k)
Profit/loss from business: +$12,645 (reported on 13.8% of returns)
Here:
+$12,645
State:
+$13,994
(% of AGI for various income ranges: 5.6% for AGIs below $10k, 5.8% for AGIs $10k-25k, 3.5% for AGIs $25k-50k, 3.7% for AGIs $50k-75k, 2.5% for AGIs $75k-100k, 4.1% for AGIs over 100k)
IRA payment deduction: $2,729 (reported on 2.8% of returns)
98036:
$2,729
Washington:
$3,001
(% of AGI for various income ranges: 0.3% for AGIs below $10k, 0.2% for AGIs $10k-25k, 0.2% for AGIs $25k-50k, 0.2% for AGIs $50k-75k, 0.1% for AGIs $75k-100k, 0.1% for AGIs over 100k)
Self-employed pension: $10,733 (reported on 0.8% of returns)
Here:
$10,733
Washington:
$14,244
(% of AGI for various income ranges: 0.3% for AGIs below $10k, 0.1% for AGIs $25k-50k, 0.1% for AGIs $50k-75k, 0.2% for AGIs $75k-100k, 0.4% for AGIs over 100k)
Total itemized deductions: $17,541 (24% of AGI, reported on 39.8% of returns)
Here:
$17,541
State:
$19,669
Here:
23.7% of AGI
State:
20.7% of AGI
(% of AGI for various income ranges: 17.8% for AGIs below $10k, 11.5% for AGIs $10k-25k, 14.0% for AGIs $25k-50k, 18.6% for AGIs $50k-75k, 17.0% for AGIs $75k-100k, 13.1% for AGIs over 100k)
Charity contributions deductions: $2,604 (3% of AGI, reported on 33.9% of returns)
Here:
$2,604
State:
$3,569
Here:
3.4% of AGI
State:
3.5% of AGI
(% of AGI for various income ranges: 0.6% for AGIs below $10k, 1.0% for AGIs $10k-25k, 1.3% for AGIs $25k-50k, 1.9% for AGIs $50k-75k, 2.1% for AGIs $75k-100k, 2.5% for AGIs over 100k)
Total tax: $6,172 (reported on 79.2% of returns)
98036:
$6,172
State:
$9,065
(% of AGI for various income ranges: 3.3% for AGIs below $10k, 4.7% for AGIs $10k-25k, 7.3% for AGIs $25k-50k, 8.7% for AGIs $50k-75k, 10.2% for AGIs $75k-100k, 16.1% for AGIs over 100k)
Earned income credit: $1,512 (reported on 10.8% of returns)
Here:
$1,512
State:
$1,607
Percentage of individuals using paid preparers for their 2004 taxes: 46.2%
Here:
46%
State:
49%
(% for various income ranges: 41.0% for AGIs below $10k, 48.3% for AGIs $10k-25k, 48.4% for AGIs $25k-50k, 46.3% for AGIs $50k-75k, 43.1% for AGIs $75k-100k, 47.5% for AGIs over 100k)
Likely homosexual households (counted as self-reported same-sex unmarried-partner households)
Lesbian couples: 0.3% of all households
Gay men: 0.0% of all households
Household received Food Stamps/SNAP in the past 12 months: 1,804 Household did not receive Food Stamps/SNAP in the past 12 months: 14,706
Women who had a birth in the past 12 months: 547 (392 now married, 150 unmarried) Women who did not have a birth in the past 12 months: 10,223 (4,585 now married, 5,637 unmarried)
Housing units in zip code 98036 with a mortgage: 7,095 (595 second mortgage, 10 home equity loan, 556 both second mortgage and home equity loan) Houses without a mortgage: 62
Median monthly owner costs for units with a mortgage: $2,613 Median monthly owner costs for units without a mortgage: $852
Residents with income below the poverty level in 2022:
This zip code:
9.0%
Whole state:
10.0%
Residents with income below 50% of the poverty level in 2022:
This zip code:
3.7%
Whole state:
4.6%
Median number of rooms in houses and condos:
Here:
6.4
State:
6.5
Median number of rooms in apartments:
Here:
3.6
State:
3.9
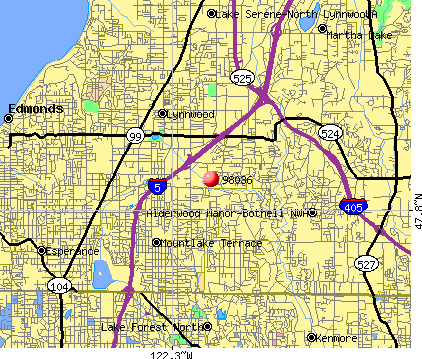
Notable locations in this zip code not listed on our city pages
Notable locations in zip code 98036: Lynnwood Transit Center (A), Alderwood Manor Substation (B), Brier Substation (C), North Alderwood Substation (D), Lynnwood Transit Center Park and Ride (E), Vaughns Village (F), Lynnwood Square (G), Fred Meyer Center (H), Alderwood Village (I), Alderwood Plaza (J), Lynnwood North Administration Building (K), Lynnwood Convention Center (L), Lynnwood Senior Center (M), Lynnwood Recreation Center (N), Fairwinds - Brighton Court Retirement Community (O), Lynnwood Police Department (P), Snohomish County Fire Protection District 1 Hilltop Station 22 (Q), City of Lynnwood Fire Department Station 15 Civic Center (R), Lynnwood City Hall (S), Lynnwood Library (T). Display/hide their locations on the map
Shopping Centers: Lynnwood Center Shopping Center (1), Scriber Square Shopping Center (2), Lynnwood Shopping Center (3), James Village Shopping Center (4). Display/hide their locations on the map
Churches in zip code 98036 include: Timber Ridge Community Church (A), Seattle Central Mission Church (B), Kingdom Hall of Jehovahs Witnesses (C), Harvest Time Church (D), Cypress Way Community Church (E), Christ Covenant Church (F), Calvary Apostolic Tabernacle (G), Evangelical Chinese Church (H), Redemption Lutheran Church (I). Display/hide their locations on the map
6,174 married couples with children.
1,570 single-parent households (206 men, 1,364 women).
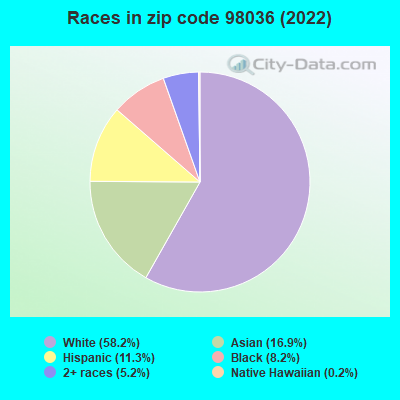
64.5% of residents of 98036 zip code speak English at home.
7.6% of residents speak Spanish at home (67% very well, 15% well, 13% not well, 5% not at all).
9.2% of residents speak other Indo-European language at home (70% very well, 16% well, 11% not well, 4% not at all).
12.2% of residents speak Asian or Pacific Island language at home (47% very well, 33% well, 17% not well, 3% not at all).
7.2% of residents speak other language at home (74% very well, 21% well, 6% not well).
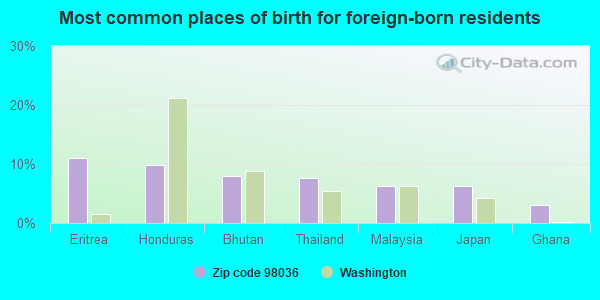
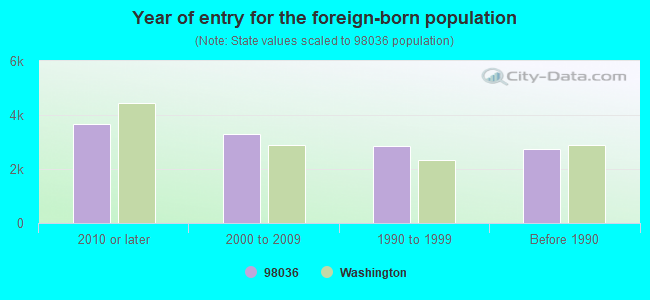
Foreign born population: 11,766 (27.6%) (62.2% of them are naturalized citizens)
Major facilities with environmental interests located in this zip code:
COLLEGE PLACE MIDDLE SCHOOL CPM (7501 208TH ST SW in LYNNWOOD, WA)
(National Center for Education Statistics) - STATE ID-3754 (Resource Conservation and Recovery Act (tracking hazardous waste)) STATE MASTER (Washington State Department of Ecology's Facility/Site identification system) - HAZWASTE-WAH000008540, HAZARDOUS WASTE PROGRAM, CESQG Business SIC classification: ELEMENTARY AND SECONDARY SCHOOLS Organizations: RAY MARQUES (CONTACT/OPERATOR)
, EDMONDS SCHOOL DIST (CONTACT/OWNER)
, EDMONDS SCHOOL DIST 15 (SCHOOL DISTRICT)
Alternative names: EDMONDS SCHOOL DIST COLLEGE PLACE
ALDERWOOD COLLISION (19704 37TH AVE W in LYNNWOOD, WA)
(Resource Conservation and Recovery Act (tracking hazardous waste)) STATE MASTER (Washington State Department of Ecology's Facility/Site identification system) - HAZWASTE-WAD980976195, HAZARDOUS WASTE PROGRAM Business SIC classification: TOP, BODY, AND UPHOLSTERY REPAIR SHOPS AND PAINT SHOPS Business NAICS classification: AUTOMOTIVE BODY, PAINT, AND INTERIOR REPAIR AND MAINTENANCE. Organizations: ROD MADER (CONTACT/OPERATOR)
, OLLINGER RENTALS (HAZARDOUS WASTE LAND OWNER)
ABBEY VIEW CEMETARY (3600 ALASKA RD in BRIER, WA)
(Resource Conservation and Recovery Act (tracking hazardous waste)) STATE MASTER (Washington State Department of Ecology's Facility/Site identification system) - TOXICS-2344, LEAKING STORAGE TANK, UNDERGROUND STORAGE TANK PROGRAM Business SIC classification: NONCLASSIFIABLE ESTABLISHMENTS Alternative names: ABBEY VIEW MEMORIAL PARK
CONNELLY SKIS INCORPORATED (20621 52ND AVE. W. in LYNNWOOD, WA)
CRITERIA AND HAZARDOUS AIR POLLUTANT INVENTORY (Inventory of air pollution sources) Conditionally Exempt Small Quantity Generators, less than 100 kg/month of hazardous waste (Resource Conservation and Recovery Act (tracking hazardous waste)) - notification TRI REPORTER (Tracking of toxic chemicals releasing facilities) STATE MASTER (Washington State Department of Ecology's Facility/Site identification system) - HAZWASTE-WAD045368206, TRI REPORTER, HAZARDOUS WASTE PROGRAM, CESQG Business SIC and NAICS classification: SPORTING AND ATHLETIC GOODS
BILLS AUTO PARTS INC (20907 HWY 99 in LYNNWOOD, WA)
(Resource Conservation and Recovery Act (tracking hazardous waste)) STATE MASTER (Washington State Department of Ecology's Facility/Site identification system) - HAZWASTE-WA0000072876, CESQG Business SIC classification: MOTOR VEHICLE SUPPLIES AND NEW PARTS
ACURA OF LYNNWOOD (21515 HWY 99 in LYNNWOOD, WA)
(Resource Conservation and Recovery Act (tracking hazardous waste)) STATE MASTER (Washington State Department of Ecology's Facility/Site identification system) - TOXICS-481495, LEAKING STORAGE TANK, UNDERGROUND STORAGE TANK PROGRAM Business SIC classification: MOTOR VEHICLE DEALERS (NEW AND USED); GENERAL AUTOMOTIVE REPAIR SHOPS Organizations: LYNNWOOD MOTOR CO INC (CONTACT/OWNER)
ALDERWOOD PKWY PLAZA (19329 28TH AVE W in LYNNWOOD, WA)
(Resource Conservation and Recovery Act (tracking hazardous waste)) STATE MASTER (Washington State Department of Ecology's Facility/Site identification system) - HAZWASTE-WAH000001297, HAZARDOUS WASTE PROGRAM Organizations: BRUCE VANDERWALL (CONTACT/OPERATOR)
ANACOMP COMSTOR (2100 196TH STREET SOUTHWEST in LYNNWOOD, WA)
(Resource Conservation and Recovery Act (tracking hazardous waste)) STATE MASTER (Washington State Department of Ecology's Facility/Site identification system) - HAZWASTE-WAH000003343, SQG Business SIC classification: PHOTOGRAPHIC EQUIPMENT AND SUPPLIES Organizations: ANACOMP INC (CONTACT/OPERATOR)
BF GOODRICH AEROSPACE SERVICE (2031 196TH STREET SOUTHWEST SUITE 4 AND 5 in LYNNWOOD, WA)
(Resource Conservation and Recovery Act (tracking hazardous waste)) STATE MASTER (Washington State Department of Ecology's Facility/Site identification system) - HAZWASTE-WA0000143917, CESQG Business SIC classification: FABRICATED RUBBER PRODUCTS Business NAICS classification: ALL OTHER RUBBER PRODUCT MANUFACTURING. Organizations: HARRY KUZMINSKY (CONTACT/OPERATOR)
, GOODRICH CORP AIP (CONTACT/OWNER)
ARCO 4005 (19612 US HWY 99 in LYNNWOOD, WA)
(Resource Conservation and Recovery Act (tracking hazardous waste)) STATE MASTER (Washington State Department of Ecology's Facility/Site identification system) - HAZWASTE-WAD988514600, HAZARDOUS WASTE PROGRAM, TOXICS-8745, LEAKING STORAGE TANK, UNDERGROUND STORAGE TANK PROGRAM, HAZWASTE-WAD988514600, EPCRA Business SIC classification: GASOLINE SERVICE STATIONS Organizations: SULAYMAN AMAN (CONTACT/OPERATOR)
, BP WEST COAST PRODUCTS LLC (CONTACT/OWNER)
Alternative names: ARCO 04005
ALDERWOOD OLDS CADILLAC (3909 - 196TH SW in LYNNWOOD, WA)
(Resource Conservation and Recovery Act (tracking hazardous waste)) STATE MASTER (Washington State Department of Ecology's Facility/Site identification system) - TOXICS-, UNDERGROUND STORAGE TANK PROGRAM, VOLUNTARY CLEAN UP PROGRAM, HAZWASTE-WAD075122143, HAZARDOUS WASTE PROGRAM Business SIC classification: MOTOR VEHICLE DEALERS (NEW AND USED) Organizations: SCOTT JOHNSON (CONTACT/OPERATOR)
, ALDERWOOD OLDSMOBILE CADILLAC (CONTACT/OWNER)
Alternative names: ALDERWOOD OLDSMOBILE CADILLAC, ALDERWOOD SALES & SERVICE
AT&T COMMUNICATION INC (17300 HWY 99 in LYNNWOOD, WA)
(Resource Conservation and Recovery Act (tracking hazardous waste)) STATE MASTER (Washington State Department of Ecology's Facility/Site identification system) - TOXICS-567036, UNDERGROUND STORAGE TANK PROGRAM, HAZWASTE-CRK000059710, EPCRA Business SIC classification: TELEPHONE COMMUNICATIONS, EXCEPT RADIOTELEPHONE; LUMBER AND OTHER BUILDING MATERIALS DEALERS Organizations: HOMEBASE (CONTACT/OWNER)
Alternative names: HOMEBASE 42
CARVER CORP (20121 48TH AVE W in LYNNWOOD, WA)
(Resource Conservation and Recovery Act (tracking hazardous waste)) STATE MASTER (Washington State Department of Ecology's Facility/Site identification system) - HAZWASTE-WAD988482055, EPCRA Business SIC classification: HOUSEHOLD AUDIO AND VIDEO EQUIPMENT
Housing units lacking complete kitchen facilities: 0.6%
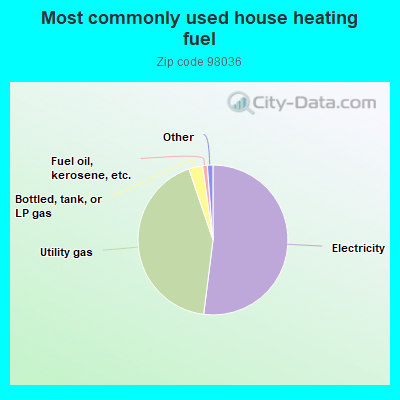
52.0%Electricity
42.8%Utility gas
3.0%Bottled, tank, or LP gas
1.0%Fuel oil, kerosene, etc.
0.7%No fuel used
0.6%Wood
Population in 1990: 28,602. Population change in the 1990s: +5,103 (+17.8%).
Place of birth for U.S.-born residents:
This state: 19,532
Northeast: 1,237
Midwest: 1,903
South: 1,972
West: 5,522
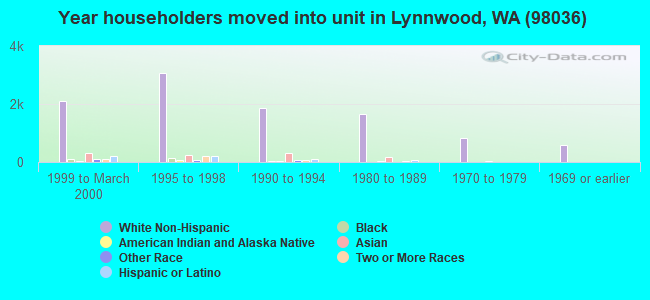
53% of the 98036 zip code residents lived in the same house 5 years ago. Out of people who lived in different houses, 48% lived in this county. Out of people who lived in different counties, 50% lived in Washington.
88% of the 98036 zip code residents lived in the same house 1 year ago. Out of people who lived in different houses, 49% moved from this county. Out of people who lived in different houses, 31% moved from different county within same state. Out of people who lived in different houses, 12% moved from different state. Out of people who lived in different houses, 10% moved from abroad.
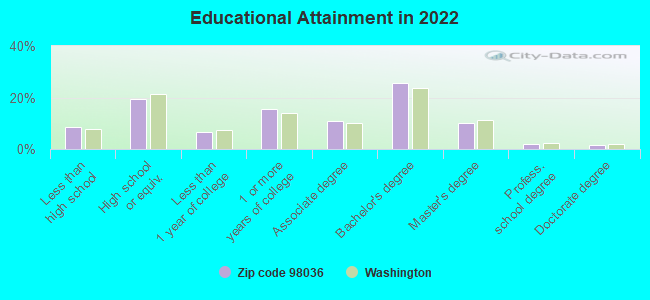
Private vs. public school enrollment:
Students in private schools in grades 1 to 8 (elementary and middle school): 196
Here:
5.6%
Washington:
12.4%
Students in private schools in grades 9 to 12 (high school): 283
Here:
15.5%
Washington:
9.2%
Students in private undergraduate colleges: 389
Here:
15.5%
Washington:
16.5%
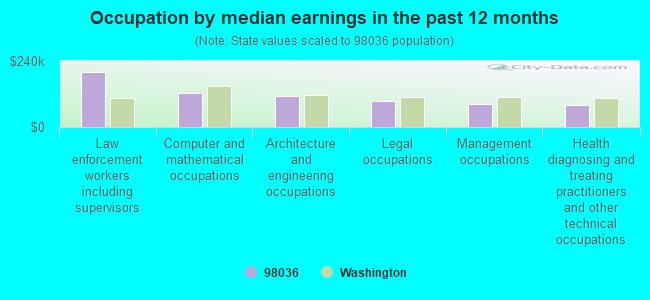
Occupation by median earnings in the past 12 months ($)
198,454Law enforcement workers including supervisors
122,754Computer and mathematical occupations
112,440Architecture and engineering occupations
92,993Legal occupations
84,912Management occupations
78,399Health diagnosing and treating practitioners and other technical occupations
Companies with biggest federal contracts located in this zip code (LYNNWOOD, WA):
KONGSBERG UNDERWATER TECHNOLOG (19210 33RD AVE WEST, STE A; small business) : $7,001,973 in 18 contractsfrom 2005 to 2006
Contracts for Underwater Sound Equipment, Navigational Instruments, ADP Software, Miscellaneous Ship and Marine Equipment, and moreby Navy, Federal Bureau of Investigation, National Oceanic and Atmospheric Administration/Under Secretary for Oceans and Atmosphere, U.S. Customs Service, and others Signed by year:2000: $0; 2001: $0; 2002: $0; 2003: $0; 2004: $0; 2005: $779,271; 2006: $6,222,702.
Biggest contracts:
$2,132,109 with Navy for Underwater Sound Equipment. Signed on 2006-03-03. Completion date: 2006-08-28.
$2,089,730, same as above.Signed on 2006-04-20. Completion date: 2007-09-29.
$1,294,146, same as above.Signed on 2006-05-05. Completion date: 2006-08-30.
$381,480 with Navy for Navigational Instruments. Signed on 2005-09-28. Completion date: 2005-12-30.
KONGSBERG MARITIME, INC (19210 33RD AVE W STE A) : $425,940 in 14 contractsfrom 2003 to 2006
Contracts for Underwater Sound Equipment, Radio Navigation Equipment, Airborne, Navigational Aid and Pilotage Services, ADP Components, and moreby Navy, U.S. Army Corps of Engineers - civil program financing only Signed by year:2000: $0; 2001: $0; 2002: $0; 2003: $130,308; 2004: $177,289; 2005: $111,103; 2006: $7,240.
Biggest contracts:
$87,243 with Navy for Underwater Sound Equipment. Signed on 2005-03-24. Completion date: 2005-05-16.
$78,104 with Navy for Radio Navigation Equipment, Airborne. Signed on 2004-08-30. Completion date: 2004-04-16.
$70,651 with Navy for Navigational Aid and Pilotage Services. Taking place in TX. Signed on 2003-06-17. Completion date: 2003-07-01.
$57,474 with Navy for ADP Components. Signed on 2004-09-10. Completion date: 2004-09-30.
OCULUS INC (2125 196TH ST SW UNIT 112; small business) : $212,741 in 4 contractsfrom 2005 to 2006
$149,472 with Army for Medical and Surgical Instruments, Equipment, and Supplies. Signed on 2005-07-20. Completion date: 2005-08-17.
$47,625 with Navy for Ophthalmic Instruments, Equipment, and Supplies. Signed on 2005-09-13. Completion date: 2005-09-15.
$8,435 with Air Force for Ophthalmic Instruments, Equipment, and Supplies. Taking place in CO. Signed on 2006-05-16. Completion date: 2006-06-15.
$7,209 with Navy for Ophthalmic Instruments, Equipment, and Supplies. Signed on 2006-05-02. Completion date: 2006-06-27.
AUTOMATIC LAUNDRY CO ,LTD (20420 56TH AVE W, STE 101; small business) : $107,844 in 3 contractsfrom 2003 to 2005
$55,680 with Navy for Lease or Rental of Equipment -- Service and Trade Equipment. Signed on 2003-12-05. Completion date: 2004-09-30.
$26,280, same as above.Signed on 2004-12-03. Completion date: 2004-09-30.
$25,884, same as above.Signed on 2005-02-15. Completion date: 2004-09-30.
PROCTOR SALES, INC (20715 50TH AVENUE WEST; small business) : $38,631 in 4 contractsfrom 2005 to 2006
$15,330 with Army for Maintenance, Repair and Rebuilding of Equipment -- Plumbing, Heating, and Waste Disposal Equipment. Signed on 2006-03-06. Completion date: 2006-04-14.
$14,775 with Navy for Miscellaneous Ship and Marine Equipment. Signed on 2005-09-30. Completion date: 2005-10-14.
$8,526 with Army for Maintenance, Repair and Rebuilding of Equipment -- Plumbing, Heating, and Waste Disposal Equipment. Signed on 2005-09-14. Completion date: 2005-10-14.
$0, same as above.Signed on 2006-03-06. Completion date: 2006-04-14.
E D P SYSTEM SERVICES INC (19905 SCRIBER LAKE RD # 20; small business) : $32,562 in 5 contractsfrom 2003 to 2005
Contracts for ADPE System Configuration, ADP Software, Equipment, and Telecommunications Training, ADP Support Equipment, Telephone and/or Communications Services (includes Telegraph, Telex, and Cablevision Services) by Navy, Army, Air Force Signed by year:2000: $0; 2001: $0; 2002: $0; 2003: $4,545; 2004: $24,923; 2005: $3,094; 2006: $0.
Biggest contracts:
$19,210 with Navy for ADPE System Configuration. Signed on 2004-01-28. Completion date: 2004-02-09.
$5,292 with Army for ADP Software, Equipment, and Telecommunications Training. Signed on 2004-03-03. Completion date: 2004-03-19.
$4,545 with Army for ADP Support Equipment. Signed on 2003-09-22. Completion date: 2003-11-21.
$3,094 with Air Force for ADPE System Configuration. Signed on 2005-09-23. Completion date: 2005-11-09.
INNOTECH, INC (2100 196TH ST SW, STE 11; small business) : $16,945 in 2 contractsfrom 2003 to 2004
$13,712 with Department of Defense for Radio and Television Communication Equipment, Except Airborne. Signed on 2003-09-05. Completion date: 2003-10-04.
$3,233 with Navy for ADP Components. Taking place in CA. Signed on 2004-09-17. Completion date: 2004-09-24.
MORGAN SOUND INC (2004 196TH ST SW #2; small business) : $14,950 in 2 contractsfrom 2003 to 2004
$10,028 with Army for Miscellaneous Electrical and Electronic Components. Signed on 2004-06-29. Completion date: 2004-06-28.
$4,922 with Navy for Miscellaneous Electrical and Electronic Components. Signed on 2003-12-03. Completion date: 2003-12-13.
AUTOMATIC ENTRIES INC (6720 210TH ST SW; small business)
$11,711 with Air Force for Maintenance, Repair or Alteration of Real Property -- Other Airfield Structures. Signed on 2005-09-20. Completion date: 2005-11-04.
COMPUSAVE INC (19804 HIGHWAY 99; small business)
$7,309 with Army for ADP Support Equipment. Signed on 2003-07-15. Completion date: 2003-07-27.
Top industries in this zip code by the number of employees in 2005:
2002 - 2018 National Fire Incident Reporting System (NFIRS) incidents
Based on the data from the years 2002 - 2018 the average number of fire incidents per year is 110. The highest number of fire incidents - 170 took place in 2006, and the least - 64 in 2018. The data has a decreasing trend.
When looking into fire subcategories, the most reports belonged to: Outside Fires (42.3%), and Structure Fires (39.8%).
Fire incident types reported to NFIRS in Zip Code 98036


 Nearest zip codes: 98037, 98043, 98087, 98155, 98026, 98028.
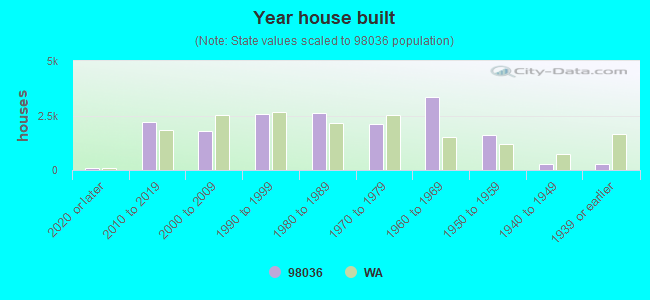


 Based on the data from the years 2002 - 2018 the average number of fire incidents per year is 110. The highest number of fire incidents - 170 took place in 2006, and the least - 64 in 2018. The data has a decreasing trend.
 When looking into fire subcategories, the most reports belonged to: Outside Fires (42.3%), and Structure Fires (39.8%).