Estimated zip code population in 2022: 21,616 Zip code population in 2010: 19,943 Zip code population in 2000: 20,333
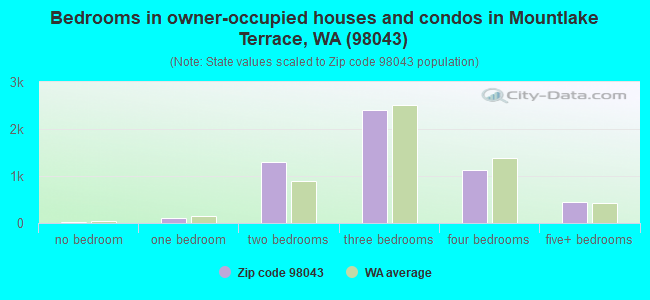
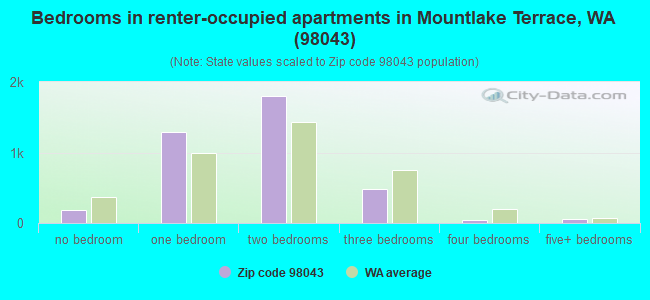
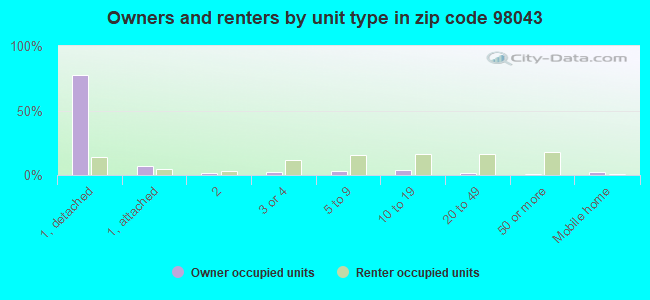
Houses and condos: 9,578 Renter-occupied apartments: 3,820
% of renters here:
41%
State:
36%
March 2022 cost of living index in zip code 98043: 113.1 (more than average, U.S. average is 100)
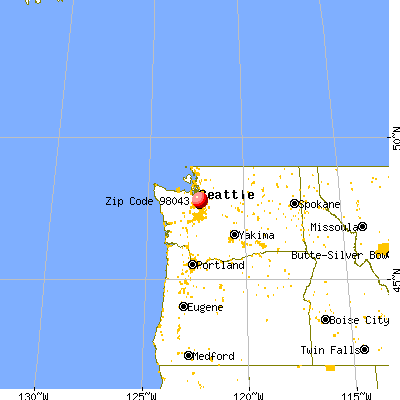
Land area: 4.1 sq. mi. Water area: 0.1 sq. mi.
Population density: 5,296 people per square mile
(average).
OSM Map
General Map
Google Map
MSN Map
OSM Map
General Map
Google Map
MSN Map
OSM Map
General Map
Google Map
MSN Map
OSM Map
General Map
Google Map
MSN Map
Please wait while loading the map...
Real estate property taxes paid for housing units in 2022:
This zip code:
0.7% ($4,421)
Washington:
0.8% ($4,283)
Median real estate property taxes paid for housing units with mortgages in 2022: $4,527 (0.6%) Median real estate property taxes paid for housing units with no mortgage in 2022: $3,997 (0.7%)
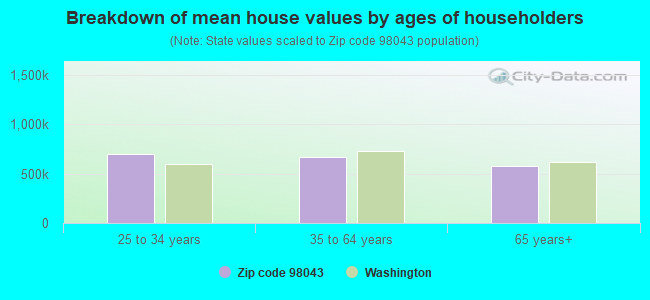
Estimated median house/condo value in 2022: $674,161
98043:
$674,161
Washington:
$569,500
According to our research of Washington and other state lists, there were 14 registered sex offenders living in 98043 zip code as of April 27, 2024. The ratio of all residents to sex offenders in zip code 98043 is 1,505 to 1. The ratio of registered sex offenders to all residents in this zip code is lower than the state average.
Median resident age:
This zip code:
39.0 years
Washington median age:
38.4 years
Average household size:
This zip code:
2.3 people
Washington:
2.5 people
Averages for the 2020 tax year for zip code 98043, filed in 2021:
Average Adjusted Gross Income (AGI) in 2020: $73,382 (Individual Income Tax Returns)
Here:
$73,382
State:
$99,264
Salary/wage: $67,767 (reported on 84.4% of returns)
Here:
$67,767
State:
$80,347
(% of AGI for various income ranges: 1139.4% for AGIs below $25k, 3628.9% for AGIs $25k-50k, 6712.7% for AGIs $50k-75k, 10203.2% for AGIs $75k-100k, 19109.1% for AGIs $100k-200k, 64891.2% for AGIs over 200k)
Taxable interest for individuals: $800 (reported on 32.9% of returns)
This zip code:
$800
Washington:
$2,077
(% of AGI for various income ranges: 15.0% for AGIs below $25k, 12.7% for AGIs $25k-50k, 41.5% for AGIs $50k-75k, 46.8% for AGIs $75k-100k, 71.2% for AGIs $100k-200k, 278.2% for AGIs over 200k)
Ordinary dividends: $3,018 (reported on 20.4% of returns)
Here:
$3,018
State:
$10,013
(% of AGI for various income ranges: 33.1% for AGIs below $25k, 28.1% for AGIs $25k-50k, 56.3% for AGIs $50k-75k, 82.2% for AGIs $75k-100k, 177.9% for AGIs $100k-200k, 1131.8% for AGIs over 200k)
Net capital gain/loss in AGI: +$10,583 (reported on 19.2% of returns)
Here:
+$10,583
State:
+$40,092
(% of AGI for various income ranges: 20.4% for AGIs below $25k, 33.6% for AGIs $25k-50k, 82.9% for AGIs $50k-75k, 118.2% for AGIs $75k-100k, 382.6% for AGIs $100k-200k, 8657.1% for AGIs over 200k)
Profit/loss from business: +$14,325 (reported on 13.4% of returns)
Here:
+$14,325
State:
+$18,312
(% of AGI for various income ranges: 144.2% for AGIs below $25k, 173.5% for AGIs $25k-50k, 199.4% for AGIs $50k-75k, 388.4% for AGIs $75k-100k, 418.9% for AGIs $100k-200k, 2002.9% for AGIs over 200k)
Taxable individual retirement arrangement distribution: $17,314 (reported on 6.9% of returns)
98043:
$17,314
Washington:
$24,221
(% of AGI for various income ranges: 61.7% for AGIs below $25k, 75.8% for AGIs $25k-50k, 164.9% for AGIs $50k-75k, 215.6% for AGIs $75k-100k, 364.7% for AGIs $100k-200k, 981.8% for AGIs over 200k)
Self-employed (Keogh) retirement plans: $13,033 (reported on 0.3% of returns)
98043:
$13,033
Washington:
$24,166
(% of AGI for various income ranges: 31.3% for AGIs $100k-200k)
Total itemized deductions: $27,366 (reported on 11.1% of returns)
Here:
$27,366
State:
$39,068
(% of AGI for various income ranges: 67.8% for AGIs below $25k, 137.0% for AGIs $25k-50k, 382.8% for AGIs $50k-75k, 521.5% for AGIs $75k-100k, 953.4% for AGIs $100k-200k, 4335.3% for AGIs over 200k)
Charity contributions: $5,652 (reported on 7.3% of returns)
Here:
$5,652
State:
$15,331
(% of AGI for various income ranges: 2.0% for AGIs below $25k, 12.2% for AGIs $25k-50k, 37.0% for AGIs $50k-75k, 46.0% for AGIs $75k-100k, 164.7% for AGIs $100k-200k, 784.7% for AGIs over 200k)
Taxes paid: $6,526 (reported on 10.9% of returns)
98043:
$6,526
State:
$7,774
(% of AGI for various income ranges: 12.0% for AGIs below $25k, 31.1% for AGIs $25k-50k, 93.4% for AGIs $50k-75k, 121.4% for AGIs $75k-100k, 242.7% for AGIs $100k-200k, 904.7% for AGIs over 200k)
Earned income credit: $1,716 (reported on 8.1% of returns)
Here:
$1,716
State:
$2,020
(% of AGI for various income ranges: 52.9% for AGIs below $25k, 30.0% for AGIs $25k-50k)
Percentage of individuals using paid preparers for their 2020 taxes: 91.7%
Here:
92%
State:
93%
(% for various income ranges: 89.6% for AGIs below $25k, 91.3% for AGIs $25k-50k, 91.0% for AGIs $50k-75k, 93.4% for AGIs $75k-100k, 93.3% for AGIs $100k-200k, 95.9% for AGIs over 200k)
Averages for the 2012 tax year for zip code 98043, filed in 2013:
Average Adjusted Gross Income (AGI) in 2012: $48,906 (Individual Income Tax Returns)
Here:
$48,906
State:
$69,533
Salary/wage: $45,973 (reported on 86.7% of returns)
Here:
$45,973
State:
$57,267
(% of AGI for various income ranges: 78.0% for AGIs below $25k, 84.0% for AGIs $25k-50k, 82.5% for AGIs $50k-75k, 84.4% for AGIs $75k-100k, 85.0% for AGIs $100k-200k, 46.5% for AGIs over 200k)
Taxable interest for individuals: $651 (reported on 34.6% of returns)
This zip code:
$651
Washington:
$1,816
(% of AGI for various income ranges: 0.8% for AGIs below $25k, 0.4% for AGIs $25k-50k, 0.4% for AGIs $50k-75k, 0.4% for AGIs $75k-100k, 0.3% for AGIs $100k-200k, 1.1% for AGIs over 200k)
Ordinary dividends: $2,702 (reported on 16.0% of returns)
Here:
$2,702
State:
$8,163
(% of AGI for various income ranges: 1.4% for AGIs below $25k, 0.6% for AGIs $25k-50k, 0.7% for AGIs $50k-75k, 0.6% for AGIs $75k-100k, 0.6% for AGIs $100k-200k, 4.0% for AGIs over 200k)
Net capital gain/loss in AGI: +$1,585 (reported on 11.6% of returns)
Here:
+$1,585
State:
+$21,568
(% of AGI for various income ranges: 0.1% for AGIs $25k-50k, 0.3% for AGIs $50k-75k, 0.4% for AGIs $75k-100k, 0.6% for AGIs $100k-200k, 2.0% for AGIs over 200k)
Profit/loss from business: +$12,355 (reported on 12.5% of returns)
Here:
+$12,355
State:
+$16,521
(% of AGI for various income ranges: 6.8% for AGIs below $25k, 3.0% for AGIs $25k-50k, 2.8% for AGIs $50k-75k, 2.3% for AGIs $75k-100k, 3.7% for AGIs $100k-200k)
Taxable individual retirement arrangement distribution: $12,988 (reported on 8.3% of returns)
98043:
$12,988
Washington:
$18,648
(% of AGI for various income ranges: 2.7% for AGIs below $25k, 1.9% for AGIs $25k-50k, 2.0% for AGIs $50k-75k, 1.8% for AGIs $75k-100k, 3.3% for AGIs $100k-200k)
Total itemized deductions: $17,802 (23% of AGI, reported on 30.8% of returns)
Here:
$17,802
State:
$23,872
Here:
23.2% of AGI
State:
18.2% of AGI
(% of AGI for various income ranges: 9.8% for AGIs below $25k, 9.3% for AGIs $25k-50k, 12.5% for AGIs $50k-75k, 12.4% for AGIs $75k-100k, 12.0% for AGIs $100k-200k, 8.3% for AGIs over 200k)
Charity contributions: $2,363 (reported on 23.3% of returns)
Here:
$2,363
State:
$4,465
(% of AGI for various income ranges: 0.6% for AGIs below $25k, 0.8% for AGIs $25k-50k, 1.0% for AGIs $50k-75k, 1.3% for AGIs $75k-100k, 1.5% for AGIs $100k-200k, 1.7% for AGIs over 200k)
Taxes paid: $4,109 (reported on 30.5% of returns)
98043:
$4,109
State:
$6,400
(% of AGI for various income ranges: 2.1% for AGIs below $25k, 1.9% for AGIs $25k-50k, 2.7% for AGIs $50k-75k, 2.8% for AGIs $75k-100k, 3.2% for AGIs $100k-200k, 1.9% for AGIs over 200k)
Earned income credit: $1,794 (reported on 12.9% of returns)
Here:
$1,794
State:
$2,073
(% of AGI for various income ranges: 3.8% for AGIs below $25k, 0.7% for AGIs $25k-50k)
Percentage of individuals using paid preparers for their 2012 taxes: 37.5%
Here:
38%
State:
43%
(% for various income ranges: 34.6% for AGIs below $25k, 35.9% for AGIs $25k-50k, 40.4% for AGIs $50k-75k, 41.1% for AGIs $75k-100k, 40.9% for AGIs $100k-200k, 66.7% for AGIs over 200k)
Averages for the 2004 tax year for zip code 98043, filed in 2005:
Average Adjusted Gross Income (AGI) in 2004: $39,956 (Individual Income Tax Returns)
Here:
$39,956
State:
$54,331
Salary/wage: $37,990 (reported on 87.9% of returns)
Here:
$37,990
State:
$45,761
(% of AGI for various income ranges: 97.3% for AGIs below $10k, 78.7% for AGIs $10k-25k, 87.3% for AGIs $25k-50k, 86.7% for AGIs $50k-75k, 86.0% for AGIs $75k-100k, 68.9% for AGIs over 100k)
Taxable interest for individuals: $1,017 (reported on 38.6% of returns)
This zip code:
$1,017
Washington:
$2,110
(% of AGI for various income ranges: 3.7% for AGIs below $10k, 1.6% for AGIs $10k-25k, 0.7% for AGIs $25k-50k, 0.7% for AGIs $50k-75k, 0.9% for AGIs $75k-100k, 1.4% for AGIs over 100k)
Taxable dividends: $2,245 (reported on 19.8% of returns)
Here:
$2,245
State:
$5,879
(% of AGI for various income ranges: 2.5% for AGIs below $10k, 1.3% for AGIs $10k-25k, 0.7% for AGIs $25k-50k, 0.8% for AGIs $50k-75k, 1.1% for AGIs $75k-100k, 2.4% for AGIs over 100k)
Net capital gain/loss: +$5,862 (reported on 15.6% of returns)
Here:
+$5,862
State:
+$15,835
(% of AGI for various income ranges: -0.8% for AGIs below $10k, -0.3% for AGIs $10k-25k, 0.1% for AGIs $25k-50k, 0.5% for AGIs $50k-75k, 1.6% for AGIs $75k-100k, 12.9% for AGIs over 100k)
Profit/loss from business: +$9,330 (reported on 12.3% of returns)
Here:
+$9,330
State:
+$13,994
(% of AGI for various income ranges: 8.9% for AGIs below $10k, 4.4% for AGIs $10k-25k, 2.8% for AGIs $25k-50k, 2.5% for AGIs $50k-75k, 2.2% for AGIs $75k-100k, 2.9% for AGIs over 100k)
IRA payment deduction: $2,573 (reported on 3.1% of returns)
98043:
$2,573
Washington:
$3,001
(% of AGI for various income ranges: 0.3% for AGIs $10k-25k, 0.3% for AGIs $25k-50k, 0.2% for AGIs $50k-75k, 0.1% for AGIs $75k-100k, 0.2% for AGIs over 100k)
Self-employed pension: $4,759 (reported on 0.3% of returns)
Here:
$4,759
Washington:
$14,244
Total itemized deductions: $15,185 (25% of AGI, reported on 36.7% of returns)
Here:
$15,185
State:
$19,669
Here:
25.4% of AGI
State:
20.7% of AGI
(% of AGI for various income ranges: 14.5% for AGIs below $10k, 10.5% for AGIs $10k-25k, 14.1% for AGIs $25k-50k, 15.4% for AGIs $50k-75k, 14.8% for AGIs $75k-100k, 12.2% for AGIs over 100k)
Charity contributions deductions: $2,056 (3% of AGI, reported on 30.1% of returns)
Here:
$2,056
State:
$3,569
Here:
3.3% of AGI
State:
3.5% of AGI
(% of AGI for various income ranges: 0.9% for AGIs below $10k, 0.9% for AGIs $10k-25k, 1.2% for AGIs $25k-50k, 1.7% for AGIs $50k-75k, 1.9% for AGIs $75k-100k, 2.1% for AGIs over 100k)
Total tax: $4,656 (reported on 80.1% of returns)
98043:
$4,656
State:
$9,065
(% of AGI for various income ranges: 2.9% for AGIs below $10k, 4.6% for AGIs $10k-25k, 7.4% for AGIs $25k-50k, 9.5% for AGIs $50k-75k, 10.9% for AGIs $75k-100k, 15.1% for AGIs over 100k)
Earned income credit: $1,411 (reported on 10.4% of returns)
Here:
$1,411
State:
$1,607
Percentage of individuals using paid preparers for their 2004 taxes: 44.7%
Here:
45%
State:
49%
(% for various income ranges: 40.5% for AGIs below $10k, 47.8% for AGIs $10k-25k, 44.4% for AGIs $25k-50k, 43.0% for AGIs $50k-75k, 45.4% for AGIs $75k-100k, 51.9% for AGIs over 100k)
Likely homosexual households (counted as self-reported same-sex unmarried-partner households)
Lesbian couples: 0.1% of all households
Gay men: 0.1% of all households
Household received Food Stamps/SNAP in the past 12 months: 692 Household did not receive Food Stamps/SNAP in the past 12 months: 8,523
Women who had a birth in the past 12 months: 127 (110 now married, 18 unmarried) Women who did not have a birth in the past 12 months: 5,428 (2,590 now married, 2,833 unmarried)
Housing units in zip code 98043 with a mortgage: 3,797 (438 second mortgage, 384 both second mortgage and home equity loan) Houses without a mortgage: 41
Median monthly owner costs for units with a mortgage: $2,210 Median monthly owner costs for units without a mortgage: $760
Residents with income below the poverty level in 2022:
This zip code:
7.4%
Whole state:
10.0%
Residents with income below 50% of the poverty level in 2022:
This zip code:
3.2%
Whole state:
4.6%
Median number of rooms in houses and condos:
Here:
6.1
State:
6.5
Median number of rooms in apartments:
Here:
3.7
State:
3.9
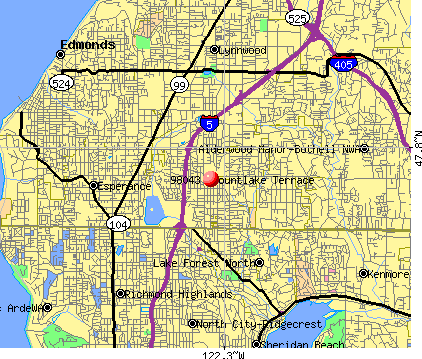
Notable locations in this zip code not listed on our city pages
Notable locations in zip code 98043: Nile Temple Country Club (A), Alderwood Towne Center (B), Halls Lake Substation (C), Ballinger Substation (D), Mountlake Substation (E), Mountlake Terrace Park and Ride (F), Nile Center and Golf Course (G), Ballinger Lake Golf Course (H), Mountlake Terrace Plaza (I), Highline Plaza (J), Rural Metro Ambulance (K), Merrill Gardens - Mountlake Terrace Plaza Retirement Community (L), Snohomish County Fire District 1 Station 19 (M), Snohomish County Fire District 1 Station 18 (N), Lynnwood - Mountlake Terrace Joint Public Works Facility (O), Mountlake Terrace Library (P). Display/hide their locations on the map
Churches in zip code 98043 include: The Great Love Church of Seattle (A), The Church of Jesus Christ of Latter Day Saints (B), Terrace View Presbyterian Church (C), Terrace Christian Life Center (D), Saint Pius X Church (E), Bethel Chapel (F), Muslim Association of the Northwest (G), First Baptist Church of Mountlake Terrace (H), Creekside Church (I). Display/hide their locations on the map
2,461 married couples with children.
1,188 single-parent households (385 men, 803 women).
76.0% of residents of 98043 zip code speak English at home.
8.7% of residents speak Spanish at home (65% very well, 17% well, 14% not well, 4% not at all).
4.6% of residents speak other Indo-European language at home (68% very well, 22% well, 8% not well, 2% not at all).
8.4% of residents speak Asian or Pacific Island language at home (62% very well, 20% well, 13% not well, 5% not at all).
2.5% of residents speak other language at home (73% very well, 5% well, 21% not well).
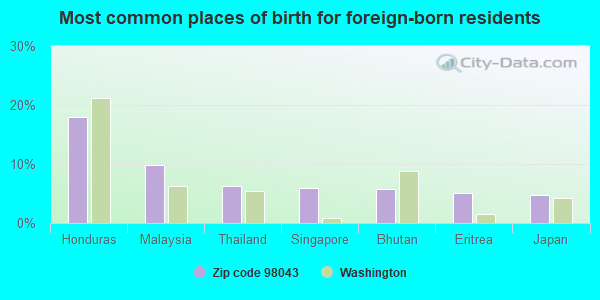
Foreign born population: 4,073 (18.8%) (54.5% of them are naturalized citizens)
This zip code:
18.8%
Whole state:
15.3%
18%Honduras
10%Malaysia
6%Thailand
6%Singapore
6%Bhutan
5%Eritrea
5%Japan
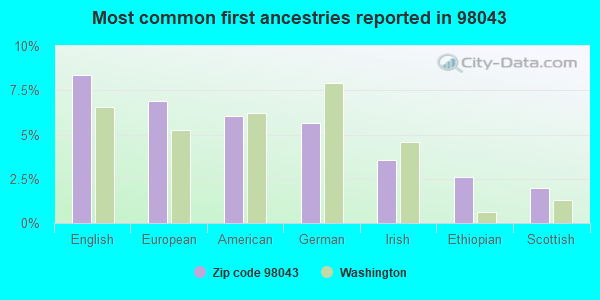
8%English
7%European
6%American
6%German
4%Irish
3%Ethiopian
2%Scottish
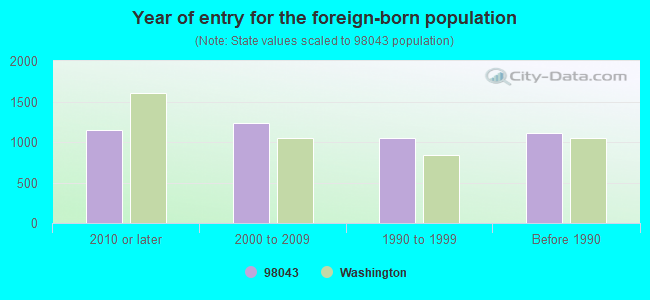
Year of entry for the foreign-born population
1,1502010 or later
1,2322000 to 2009
1,0531990 to 1999
1,108Before 1990
Public high school in in zip code 98043 not listed on the city page:
Facilities with environmental interests located in this zip code:
BLUE CROSS OF WASHINGTON (7003 220TH SW in MOUNTLAKE TERRACE, WA)
COMPLIANCE ACTIVITY (Tracking inspections of insecticide, fungicide, and rodenticide, and toxic substances) (Resource Conservation and Recovery Act (tracking hazardous waste)) STATE MASTER (Washington State Department of Ecology's Facility/Site identification system) - TOXICS-102133, UNDERGROUND STORAGE TANK PROGRAM Business SIC classification: ACCIDENT AND HEALTH INSURANCE Business NAICS classification: DIRECT HEALTH AND MEDICAL INSURANCE CARRIERS. Alternative names: BLUE CROSS OF WA & ALASKA
ALBERTSONS STORE 414 (21029 44TH AVENUE WEST in MOUNTLAKE TERRACE, WA)
(Resource Conservation and Recovery Act (tracking hazardous waste)) STATE MASTER (Washington State Department of Ecology's Facility/Site identification system) - HAZWASTE-WAH000002543, SQG Organizations: DEE GARDNER (CONTACT/OPERATOR)
, ALBERTSONS INC (CONTACT/OWNER)
Alternative names: RESIDENCE FORMER
ARCO 5525 PSI 5516 (21201 44TH AVE W in MOUNTLAKE TERRACE, WA)
Large Quantity Generators, more that 1000 kg of hazardous waste/month (Resource Conservation and Recovery Act (tracking hazardous waste)) STATE MASTER (Washington State Department of Ecology's Facility/Site identification system) - TOXICS-99025, UNDERGROUND STORAGE TANK PROGRAM, HAZWASTE-WAD988515045, EPCRA, LQG Business SIC classification: GASOLINE SERVICE STATIONS Organizations: JUMANI INC (CONTACT/OPERATOR)
, BP WEST COAST PRODUCTS LLC (CONTACT/OWNER)
Alternative names: ARCO 05525
CHEM TECK SVC SEATTLE AREA SPOKANE & POR (4404 230TH ST SW in MOUNTLAKE TERRACE, WA)
(Resource Conservation and Recovery Act (tracking hazardous waste)) STATE MASTER (Washington State Department of Ecology's Facility/Site identification system) - HAZWASTE-WAD988484374, HAZARDOUS WASTE PROGRAM Business SIC classification: ASPHALT PAVING MIXTURES AND BLOCKS; TRUCKING, EXCEPT LOCAL Business NAICS classification: ASPHALT PAVING MIXTURE AND BLOCK MANUFACTURING.; ASPHALT PAVING MIXTURE AND BLOCK MANUFACTURING. Organizations: JERRY SMITH (CONTACT/OPERATOR)
ALBERTSONS 0414 (4301 212TH ST SW in MOUNTLAKE TERRACE, WA)
Conditionally Exempt Small Quantity Generators, less than 100 kg/month of hazardous waste (Resource Conservation and Recovery Act (tracking hazardous waste)) STATE MASTER (Washington State Department of Ecology's Facility/Site identification system) - HAZWASTE-WAH000021931, CESQG Business NAICS classification: SUPERMARKETS AND OTHER GROCERY (EXCEPT CONVENIENCE) STORES. Organizations: STORE DIRECTOR (CONTACT/OPERATOR)
, ALBERTSONS INC (CONTACT/OWNER)
Alternative names: ALBERTSONS 414
CEDAR WAY ELEMENTARY CW (22222 39TH AVE W in MOUNTLAKE TERRACE, WA)
(National Center for Education Statistics) - STATE ID-3304 Organizations: EDMONDS SCHOOL DIST 15 (SCHOOL DISTRICT)
CHALLENGE ELEMENTARY (5409 228TH ST SW in MOUNTLAKE TERRACE, WA)
(National Center for Education Statistics) - STATE ID-1520 Organizations: EDMONDS SCHOOL DIST 15 (SCHOOL DISTRICT)
CHEMTECK SERVICES INC (212TH SW & 44TH W NE COR in LYNNWOOD, WA)
(Resource Conservation and Recovery Act (tracking hazardous waste)) Business NAICS classification: GENERAL AUTOMOTIVE REPAIR. Organizations: JERRY SMITH (CONTACT/OPERATOR)
23010 54TH W PICKUP (23010 54TH W in MOUNTLAKE TERRACE, WA)
(Resource Conservation and Recovery Act (tracking hazardous waste)) Organizations: WA ECY (CONTACT/OWNER)
CLEAN HARBOR (117 FRONTAGE RD in PACFIC, WA)
ENFORCEMENT/COMPLIANCE ACTIVITY (Integrated Compliance Information System)
Housing units lacking complete plumbing facilities: 1.6% Housing units lacking complete kitchen facilities: 1.4%
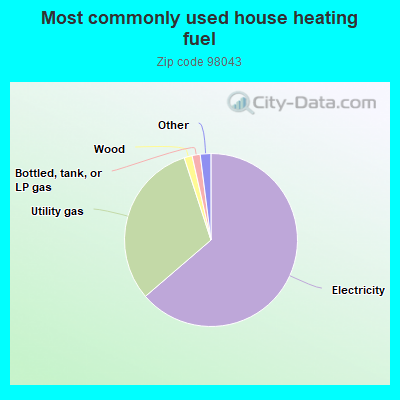
63.7%Electricity
31.3%Utility gas
1.5%Wood
1.5%Bottled, tank, or LP gas
1.0%Fuel oil, kerosene, etc.
0.6%No fuel used
Population in 1990: 20,059. Population change in the 1990s: +274 (+1.4%).
Place of birth for U.S.-born residents:
This state: 9,805
Northeast: 944
Midwest: 1,912
South: 1,058
West: 3,294
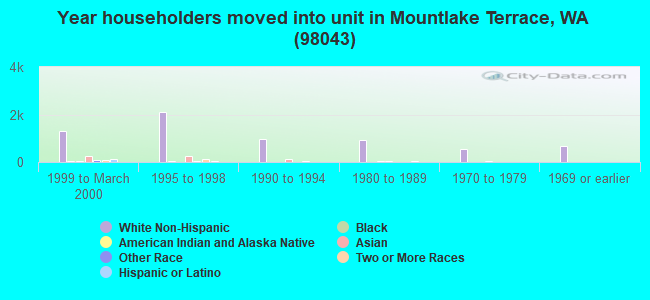
51% of the 98043 zip code residents lived in the same house 5 years ago. Out of people who lived in different houses, 38% lived in this county. Out of people who lived in different counties, 50% lived in Washington.
85% of the 98043 zip code residents lived in the same house 1 year ago. Out of people who lived in different houses, 26% moved from this county. Out of people who lived in different houses, 53% moved from different county within same state. Out of people who lived in different houses, 19% moved from different state. Out of people who lived in different houses, 4% moved from abroad.
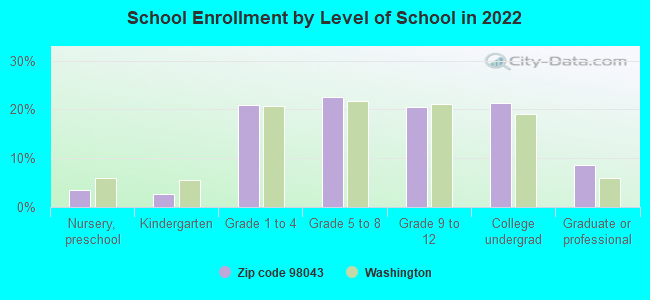
Private vs. public school enrollment:
Students in private schools in grades 1 to 8 (elementary and middle school): 98
Here:
5.0%
Washington:
12.4%
Students in private schools in grades 9 to 12 (high school): 90
Here:
9.6%
Washington:
9.2%
Students in private undergraduate colleges: 136
Here:
14.0%
Washington:
16.5%
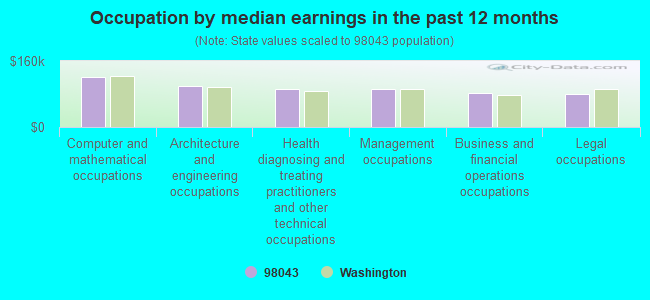
Occupation by median earnings in the past 12 months ($)
121,284Computer and mathematical occupations
100,175Architecture and engineering occupations
92,919Health diagnosing and treating practitioners and other technical occupations
92,543Management occupations
82,388Business and financial operations occupations
80,386Legal occupations
Companies with federal contracts located in this zip code (MOUNTLAKE TERR, WA):
TETRA TECH, INC (6100 219TH STREET SOUTHWES) : $2,298,868 in 45 contractsfrom 2000 to 2006
Contracts for Other Special Studies and Analyses, Architect - Engineer Services (including landscaping, interior layout, and designing), Other Professional Services, Other Architect and Engineering Services by Army, U.S. Army Corps of Engineers - civil program financing only, Forest Service (disused code: now 12C2) Signed by year:2000: $627,319; 2001: $114,611; 2002: $61,480; 2003: $146,466; 2004: $671,766; 2005: $572,951; 2006: $104,275.
Biggest contracts:
$263,097 with Army for Other Special Studies and Analyses. Taking place in AK. Signed on 2005-06-22. Completion date: 2005-06-21.
$216,368, same as above.Signed on 2005-08-04. Completion date: 2005-05-05.
$174,825 with U.S. Army Corps of Engineers - civil program financing only for Architect - Engineer Services (including landscaping, interior layout, and designing). Signed on 2000-10-17. Completion date: 2001-06-22.
$148,078 with U.S. Army Corps of Engineers - civil program financing only for Other Professional Services. Taking place in AK. Signed on 2000-05-08. Completion date: 2000-11-30.
FINANCIAL AND PERSONAL SUCCESS (22805 LAKEVIEW DR APT B1; small business) : $592,957 in 23 contractsfrom 2001 to 2006
Contracts for Educational Services by Army Signed by year:2000: $0; 2001: $103,000; 2002: $148,750; 2003: $72,512; 2004: $141,695; 2005: $169,750; 2006: -$42,750.
Biggest contracts:
$90,000 with Army for Educational Services. Signed on 2005-02-09. Completion date: 2005-04-30.
$90,000, same as above.Signed on 2004-03-30. Completion date: 2004-09-30.
$80,000, same as above.Signed on 2002-09-28. Completion date: 2003-09-30.
$68,750, same as above.Signed on 2002-09-30. Completion date: 2003-09-30.
HEALTHFIRST CORPORATION (22316 70TH AVE W STE A; small business) : $63,356 in 2 contractsin 2002
$36,876 with Navy for Medical and Surgical Instruments, Equipment, and Supplies. Signed on 2002-09-30. Completion date: 2002-10-22.
$26,480, same as above.Signed on 2002-07-31. Completion date: 2002-08-09.
WST, INC. (4226 212TH STREET SW; small business)
$60,299 with Air Force for ADP Input/Output and Storage Devices. Signed on 2000-03-20. Completion date: 2000-04-30.
LLOYD CONTROL INC (21414 66TH AVE W; small business)
$53,500 with Navy for Miscellaneous Items. Signed on 2005-07-01. Completion date: 2005-08-15.
AANNEX RENTS INC (6404 216TH ST SW; small business) : $13,841 in 4 contractsfrom 2004 to 2006
$5,481 with Army for Lease or Rental of Equipment -- Miscellaneous. Signed on 2006-06-30. Completion date: 2006-07-28.
$5,179 with U.S. Coast Guard for Lease or Rental of Equipment -- Miscellaneous. Signed on 2005-06-14. Completion date: 2005-06-30.
$3,144 with Army for Athletic and Sporting Equipment. Signed on 2004-06-23. Completion date: 2004-06-17.
$37 with U.S. Coast Guard for Lease or Rental of Equipment -- Miscellaneous. Signed on 2005-07-29. Completion date: 2005-06-30.
OLYMPIC MECHANICAL INC (21718 66TH AVE W STE 207; small business)
$4,480 with Army for Waste Disposal Equipment. Signed on 2004-09-14. Completion date: 2004-08-23.
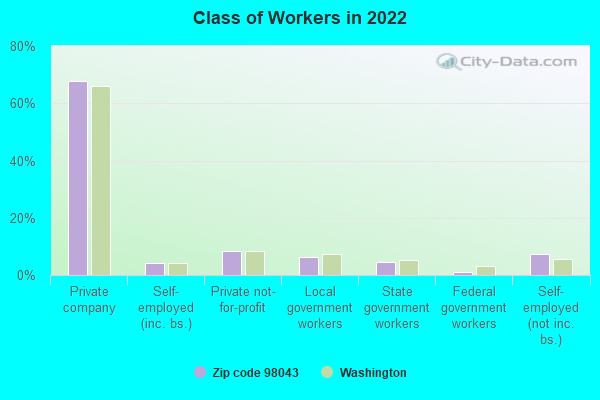
Top industries in this zip code by the number of employees in 2005:
Finance and Insurance: Direct Health and Medical Insurance Carriers (over 1000 employees: 1 establishment, 20-49 employees: 1 establishment)
Finance and Insurance: Real Estate Credit (500-999: 1, 20-49: 1, 10-19: 1, 5-9: 1, 1-4: 1)
Health Care and Social Assistance: Home Health Care Services (100-249: 2, 1-4: 1)
Arts, Entertainment, and Recreation: Casinos (except Casino Hotels) (100-249: 2)
Health Care and Social Assistance: Residential Mental Retardation Facilities (100-249: 1, 50-99: 1)
2002 - 2018 National Fire Incident Reporting System (NFIRS) incidents
According to the data from the years 2002 - 2018 the average number of fire incidents per year is 50. The highest number of reported fire incidents - 100 took place in 2006, and the least - 20 in 2014. The data has a dropping trend.
When looking into fire subcategories, the most reports belonged to: Structure Fires (40.6%), and Outside Fires (36.6%).
Fire incident types reported to NFIRS in Zip Code 98043


 Nearest zip codes: 98036, 98155, 98037, 98026, 98133, 98020.


 (Location: 21801 44TH AVE W, Grades: 9-12)
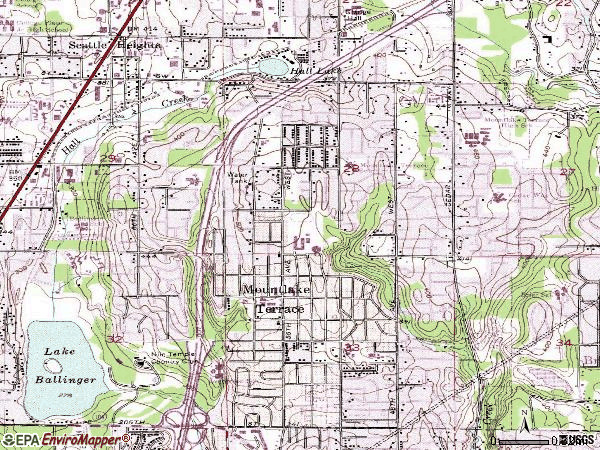

 According to the data from the years 2002 - 2018 the average number of fire incidents per year is 50. The highest number of reported fire incidents - 100 took place in 2006, and the least - 20 in 2014. The data has a dropping trend.
 When looking into fire subcategories, the most reports belonged to: Structure Fires (40.6%), and Outside Fires (36.6%).