Estimated zip code population in 2022: 39,528 Zip code population in 2010: 35,921 Zip code population in 2000: 34,456
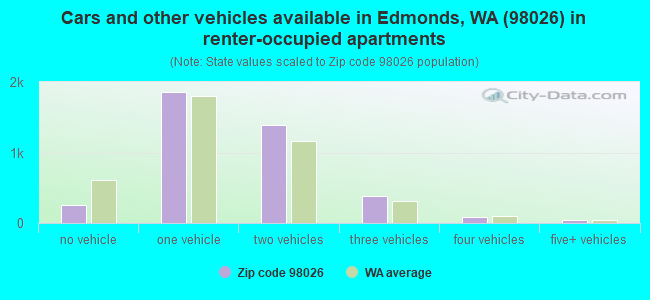
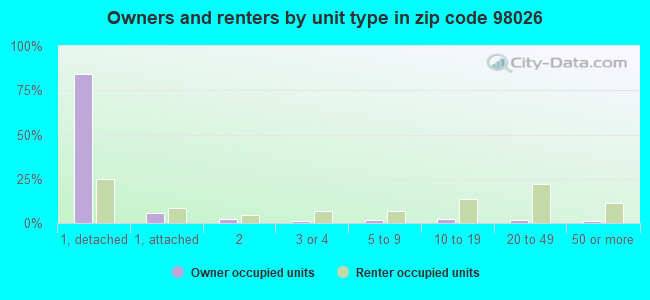
Houses and condos: 16,163 Renter-occupied apartments: 4,020
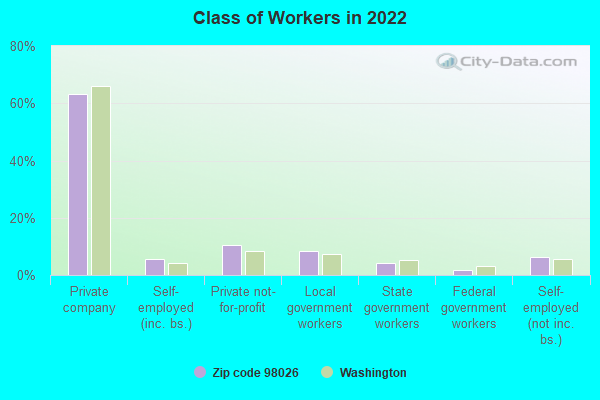
% of renters here:
26%
State:
36%
March 2022 cost of living index in zip code 98026: 113.1 (more than average, U.S. average is 100)
Land area: 9.3 sq. mi. Water area: 1.1 sq. mi.
Population density: 4,239 people per square mile
(average).
OSM Map
General Map
Google Map
MSN Map
OSM Map
General Map
Google Map
MSN Map
OSM Map
General Map
Google Map
MSN Map
OSM Map
General Map
Google Map
MSN Map
Please wait while loading the map...
Real estate property taxes paid for housing units in 2022:
This zip code:
0.7% ($5,848)
Washington:
0.8% ($4,283)
Median real estate property taxes paid for housing units with mortgages in 2022: $5,903 (0.7%) Median real estate property taxes paid for housing units with no mortgage in 2022: $5,720 (0.7%)
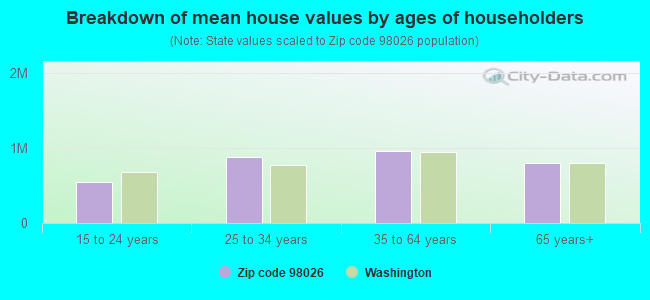
Estimated median house/condo value in 2022: $832,355
98026:
$832,355
Washington:
$569,500
According to our research of Washington and other state lists, there were 6 registered sex offenders living in 98026 zip code as of April 26, 2024. The ratio of all residents to sex offenders in zip code 98026 is 6,229 to 1. The ratio of registered sex offenders to all residents in this zip code is much lower than the state average.
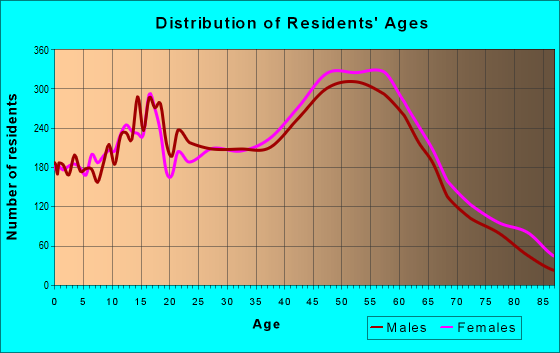
Median resident age:
This zip code:
43.8 years
Washington median age:
38.4 years
Average household size:
This zip code:
2.5 people
Washington:
2.5 people
Averages for the 2020 tax year for zip code 98026, filed in 2021:
Average Adjusted Gross Income (AGI) in 2020: $106,072 (Individual Income Tax Returns)
Here:
$106,072
State:
$99,264
Salary/wage: $86,399 (reported on 80.6% of returns)
Here:
$86,399
State:
$80,347
(% of AGI for various income ranges: 1117.4% for AGIs below $25k, 3460.5% for AGIs $25k-50k, 6358.6% for AGIs $50k-75k, 9069.6% for AGIs $75k-100k, 19079.4% for AGIs $100k-200k, 72468.8% for AGIs over 200k)
Taxable interest for individuals: $1,998 (reported on 43.6% of returns)
This zip code:
$1,998
Washington:
$2,077
(% of AGI for various income ranges: 27.1% for AGIs below $25k, 32.4% for AGIs $25k-50k, 49.3% for AGIs $50k-75k, 88.0% for AGIs $75k-100k, 133.8% for AGIs $100k-200k, 1424.1% for AGIs over 200k)
Ordinary dividends: $6,754 (reported on 30.9% of returns)
Here:
$6,754
State:
$10,013
(% of AGI for various income ranges: 62.4% for AGIs below $25k, 64.9% for AGIs $25k-50k, 140.7% for AGIs $50k-75k, 203.9% for AGIs $75k-100k, 397.2% for AGIs $100k-200k, 3149.1% for AGIs over 200k)
Net capital gain/loss in AGI: +$25,622 (reported on 28.8% of returns)
Here:
+$25,622
State:
+$40,092
(% of AGI for various income ranges: 30.2% for AGIs below $25k, 72.4% for AGIs $25k-50k, 158.7% for AGIs $50k-75k, 245.4% for AGIs $75k-100k, 680.2% for AGIs $100k-200k, 17164.6% for AGIs over 200k)
Profit/loss from business: +$22,016 (reported on 15.3% of returns)
Here:
+$22,016
State:
+$18,312
(% of AGI for various income ranges: 134.5% for AGIs below $25k, 218.1% for AGIs $25k-50k, 218.8% for AGIs $50k-75k, 407.9% for AGIs $75k-100k, 781.1% for AGIs $100k-200k, 3820.6% for AGIs over 200k)
Taxable individual retirement arrangement distribution: $26,869 (reported on 11.3% of returns)
98026:
$26,869
Washington:
$24,221
(% of AGI for various income ranges: 83.1% for AGIs below $25k, 137.5% for AGIs $25k-50k, 249.0% for AGIs $50k-75k, 493.1% for AGIs $75k-100k, 821.3% for AGIs $100k-200k, 3012.8% for AGIs over 200k)
Self-employed (Keogh) retirement plans: $21,660 (reported on 1.0% of returns)
98026:
$21,660
Washington:
$24,166
(% of AGI for various income ranges: 16.4% for AGIs $50k-75k, 45.7% for AGIs $100k-200k, 414.2% for AGIs over 200k)
Total itemized deductions: $33,121 (reported on 17.3% of returns)
Here:
$33,121
State:
$39,068
(% of AGI for various income ranges: 109.5% for AGIs below $25k, 194.3% for AGIs $25k-50k, 472.7% for AGIs $50k-75k, 763.2% for AGIs $75k-100k, 1520.2% for AGIs $100k-200k, 6547.0% for AGIs over 200k)
Charity contributions: $7,960 (reported on 13.2% of returns)
Here:
$7,960
State:
$15,331
(% of AGI for various income ranges: 5.5% for AGIs below $25k, 19.8% for AGIs $25k-50k, 51.7% for AGIs $50k-75k, 93.0% for AGIs $75k-100k, 227.8% for AGIs $100k-200k, 1715.5% for AGIs over 200k)
Taxes paid: $7,968 (reported on 17.1% of returns)
98026:
$7,968
State:
$7,774
(% of AGI for various income ranges: 26.3% for AGIs below $25k, 46.6% for AGIs $25k-50k, 117.0% for AGIs $50k-75k, 207.9% for AGIs $75k-100k, 389.7% for AGIs $100k-200k, 1394.6% for AGIs over 200k)
Earned income credit: $1,658 (reported on 5.9% of returns)
Here:
$1,658
State:
$2,020
(% of AGI for various income ranges: 40.4% for AGIs below $25k, 29.0% for AGIs $25k-50k)
Percentage of individuals using paid preparers for their 2020 taxes: 91.6%
Here:
92%
State:
93%
(% for various income ranges: 88.3% for AGIs below $25k, 91.1% for AGIs $25k-50k, 92.4% for AGIs $50k-75k, 92.6% for AGIs $75k-100k, 92.6% for AGIs $100k-200k, 94.1% for AGIs over 200k)
Averages for the 2012 tax year for zip code 98026, filed in 2013:
Average Adjusted Gross Income (AGI) in 2012: $70,512 (Individual Income Tax Returns)
Here:
$70,512
State:
$69,533
Salary/wage: $61,211 (reported on 82.9% of returns)
Here:
$61,211
State:
$57,267
(% of AGI for various income ranges: 72.1% for AGIs below $25k, 78.2% for AGIs $25k-50k, 75.0% for AGIs $50k-75k, 75.7% for AGIs $75k-100k, 78.2% for AGIs $100k-200k, 56.2% for AGIs over 200k)
Taxable interest for individuals: $1,361 (reported on 46.5% of returns)
This zip code:
$1,361
Washington:
$1,816
(% of AGI for various income ranges: 1.4% for AGIs below $25k, 0.7% for AGIs $25k-50k, 0.7% for AGIs $50k-75k, 0.7% for AGIs $75k-100k, 0.7% for AGIs $100k-200k, 1.4% for AGIs over 200k)
Ordinary dividends: $5,338 (reported on 28.2% of returns)
Here:
$5,338
State:
$8,163
(% of AGI for various income ranges: 3.0% for AGIs below $25k, 1.4% for AGIs $25k-50k, 1.6% for AGIs $50k-75k, 1.4% for AGIs $75k-100k, 1.6% for AGIs $100k-200k, 3.8% for AGIs over 200k)
Net capital gain/loss in AGI: +$10,423 (reported on 22.7% of returns)
Here:
+$10,423
State:
+$21,568
(% of AGI for various income ranges: 0.2% for AGIs $25k-50k, 0.6% for AGIs $50k-75k, 0.9% for AGIs $75k-100k, 1.7% for AGIs $100k-200k, 11.0% for AGIs over 200k)
Profit/loss from business: +$18,573 (reported on 15.1% of returns)
Here:
+$18,573
State:
+$16,521
(% of AGI for various income ranges: 7.1% for AGIs below $25k, 4.2% for AGIs $25k-50k, 3.1% for AGIs $50k-75k, 2.9% for AGIs $75k-100k, 3.8% for AGIs $100k-200k, 4.6% for AGIs over 200k)
Taxable individual retirement arrangement distribution: $19,350 (reported on 12.2% of returns)
98026:
$19,350
Washington:
$18,648
(% of AGI for various income ranges: 4.1% for AGIs below $25k, 2.9% for AGIs $25k-50k, 3.9% for AGIs $50k-75k, 3.7% for AGIs $75k-100k, 2.8% for AGIs $100k-200k, 3.6% for AGIs over 200k)
Self-employment retirement plans: $18,122 (reported on 1.0% of returns)
98026:
$18,122
Washington:
$20,087
(% of AGI for various income ranges: 0.1% for AGIs $25k-50k, 0.1% for AGIs $75k-100k, 0.3% for AGIs $100k-200k, 0.6% for AGIs over 200k)
Total itemized deductions: $22,783 (20% of AGI, reported on 40.9% of returns)
Here:
$22,783
State:
$23,872
Here:
19.8% of AGI
State:
18.2% of AGI
(% of AGI for various income ranges: 14.3% for AGIs below $25k, 11.6% for AGIs $25k-50k, 14.6% for AGIs $50k-75k, 15.3% for AGIs $75k-100k, 14.5% for AGIs $100k-200k, 10.0% for AGIs over 200k)
Charity contributions: $3,406 (reported on 33.8% of returns)
Here:
$3,406
State:
$4,465
(% of AGI for various income ranges: 0.8% for AGIs below $25k, 0.9% for AGIs $25k-50k, 1.3% for AGIs $50k-75k, 1.6% for AGIs $75k-100k, 1.7% for AGIs $100k-200k, 2.2% for AGIs over 200k)
Taxes paid: $6,221 (reported on 40.5% of returns)
98026:
$6,221
State:
$6,400
(% of AGI for various income ranges: 3.2% for AGIs below $25k, 2.8% for AGIs $25k-50k, 3.8% for AGIs $50k-75k, 4.0% for AGIs $75k-100k, 4.1% for AGIs $100k-200k, 3.0% for AGIs over 200k)
Earned income credit: $1,693 (reported on 9.3% of returns)
Here:
$1,693
State:
$2,073
(% of AGI for various income ranges: 3.1% for AGIs below $25k, 0.6% for AGIs $25k-50k)
Percentage of individuals using paid preparers for their 2012 taxes: 42.6%
Here:
43%
State:
43%
(% for various income ranges: 36.7% for AGIs below $25k, 38.9% for AGIs $25k-50k, 45.7% for AGIs $50k-75k, 45.5% for AGIs $75k-100k, 46.6% for AGIs $100k-200k, 68.4% for AGIs over 200k)
Averages for the 2004 tax year for zip code 98026, filed in 2005:
Average Adjusted Gross Income (AGI) in 2004: $57,027 (Individual Income Tax Returns)
Here:
$57,027
State:
$54,331
Salary/wage: $49,169 (reported on 83.2% of returns)
Here:
$49,169
State:
$45,761
(% of AGI for various income ranges: 199.0% for AGIs below $10k, 71.6% for AGIs $10k-25k, 79.4% for AGIs $25k-50k, 78.4% for AGIs $50k-75k, 81.7% for AGIs $75k-100k, 60.7% for AGIs over 100k)
Taxable interest for individuals: $1,740 (reported on 53.6% of returns)
This zip code:
$1,740
Washington:
$2,110
(% of AGI for various income ranges: 13.4% for AGIs below $10k, 2.5% for AGIs $10k-25k, 1.5% for AGIs $25k-50k, 1.2% for AGIs $50k-75k, 1.1% for AGIs $75k-100k, 1.8% for AGIs over 100k)
Taxable dividends: $4,422 (reported on 34.0% of returns)
Here:
$4,422
State:
$5,879
(% of AGI for various income ranges: 13.7% for AGIs below $10k, 2.4% for AGIs $10k-25k, 1.7% for AGIs $25k-50k, 1.6% for AGIs $50k-75k, 1.5% for AGIs $75k-100k, 3.7% for AGIs over 100k)
Net capital gain/loss: +$10,146 (reported on 27.6% of returns)
Here:
+$10,146
State:
+$15,835
(% of AGI for various income ranges: -2.7% for AGIs below $10k, 0.2% for AGIs $10k-25k, 0.6% for AGIs $25k-50k, 1.0% for AGIs $50k-75k, 1.2% for AGIs $75k-100k, 10.1% for AGIs over 100k)
Profit/loss from business: +$18,911 (reported on 15.4% of returns)
Here:
+$18,911
State:
+$13,994
(% of AGI for various income ranges: 22.6% for AGIs below $10k, 6.1% for AGIs $10k-25k, 4.2% for AGIs $25k-50k, 4.7% for AGIs $50k-75k, 3.4% for AGIs $75k-100k, 5.9% for AGIs over 100k)
IRA payment deduction: $3,200 (reported on 3.6% of returns)
98026:
$3,200
Washington:
$3,001
(% of AGI for various income ranges: 0.9% for AGIs below $10k, 0.3% for AGIs $10k-25k, 0.3% for AGIs $25k-50k, 0.3% for AGIs $50k-75k, 0.2% for AGIs $75k-100k, 0.1% for AGIs over 100k)
Self-employed pension: $13,768 (reported on 1.5% of returns)
Here:
$13,768
Washington:
$14,244
(% of AGI for various income ranges: 0.1% for AGIs $25k-50k, 0.1% for AGIs $50k-75k, 0.2% for AGIs $75k-100k, 0.6% for AGIs over 100k)
Total itemized deductions: $19,356 (22% of AGI, reported on 44.9% of returns)
Here:
$19,356
State:
$19,669
Here:
22.4% of AGI
State:
20.7% of AGI
(% of AGI for various income ranges: 45.3% for AGIs below $10k, 16.6% for AGIs $10k-25k, 15.2% for AGIs $25k-50k, 18.5% for AGIs $50k-75k, 17.5% for AGIs $75k-100k, 12.5% for AGIs over 100k)
Charity contributions deductions: $2,778 (3% of AGI, reported on 39.1% of returns)
Here:
$2,778
State:
$3,569
Here:
3.1% of AGI
State:
3.5% of AGI
(% of AGI for various income ranges: 1.8% for AGIs below $10k, 1.3% for AGIs $10k-25k, 1.4% for AGIs $25k-50k, 1.9% for AGIs $50k-75k, 2.1% for AGIs $75k-100k, 2.1% for AGIs over 100k)
Total tax: $8,987 (reported on 81.7% of returns)
98026:
$8,987
State:
$9,065
(% of AGI for various income ranges: 6.3% for AGIs below $10k, 4.8% for AGIs $10k-25k, 7.8% for AGIs $25k-50k, 9.4% for AGIs $50k-75k, 10.4% for AGIs $75k-100k, 18.2% for AGIs over 100k)
Earned income credit: $1,429 (reported on 7.4% of returns)
Here:
$1,429
State:
$1,607
Percentage of individuals using paid preparers for their 2004 taxes: 47.0%
Here:
47%
State:
49%
(% for various income ranges: 37.7% for AGIs below $10k, 47.7% for AGIs $10k-25k, 45.7% for AGIs $25k-50k, 48.3% for AGIs $50k-75k, 46.7% for AGIs $75k-100k, 58.2% for AGIs over 100k)
Likely homosexual households (counted as self-reported same-sex unmarried-partner households)
Lesbian couples: 0.3% of all households
Gay men: 0.1% of all households
Household received Food Stamps/SNAP in the past 12 months: 737 Household did not receive Food Stamps/SNAP in the past 12 months: 14,947
Women who had a birth in the past 12 months: 554 (484 now married, 76 unmarried) Women who did not have a birth in the past 12 months: 8,274 (3,977 now married, 4,288 unmarried)
Housing units in zip code 98026 with a mortgage: 8,080 (1,227 second mortgage, 60 home equity loan, 1,029 both second mortgage and home equity loan) Houses without a mortgage: 150
Median monthly owner costs for units with a mortgage: $2,700 Median monthly owner costs for units without a mortgage: $881
Residents with income below the poverty level in 2022:
This zip code:
5.8%
Whole state:
10.0%
Residents with income below 50% of the poverty level in 2022:
This zip code:
3.0%
Whole state:
4.6%
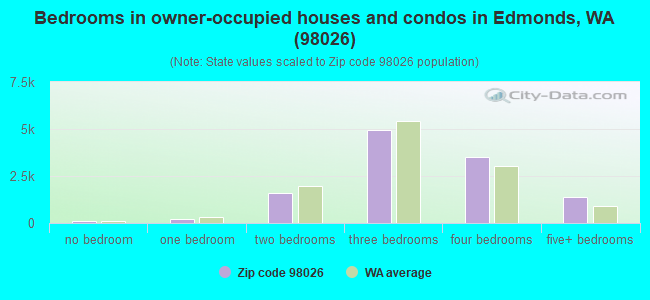
Median number of rooms in houses and condos:
Here:
7.0
State:
6.5
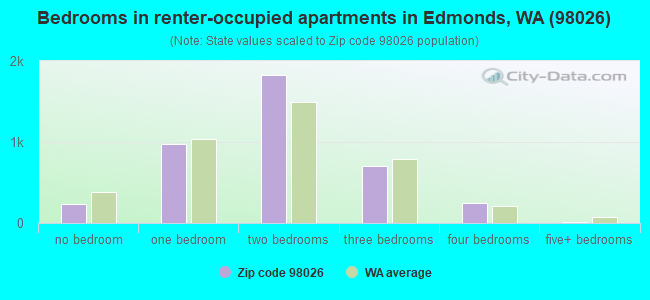
Median number of rooms in apartments:
Here:
4.0
State:
3.9
Notable locations in this zip code not listed on our city pages
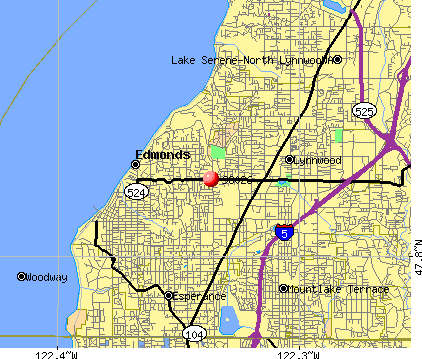
Notable locations in zip code 98026: Five Corners Substation (A), Maplewood Substation (B), Picnic Point Substation (C), Richmond Park Substation (D), Norma Beach (E), Edmonds Park and Ride (F), Seattle Heights Center (G), Meadowdale Marina (H), Alderwood Sewage Treatment Plant (I), Lynnwood Wastewater Treatment Plant (J), Edmonds Rehabilitation and Healthcare Center (K), Aldercrest Health and Rehabilitation Center (L), Aegis Senior Inn of Edmonds (M), City of Edmonds Fire Department Station 20 (N), City of Edmonds Fire Department Station 16 (O). Display/hide their locations on the map
Churches in zip code 98026 include: United Pentecostal Church (A), Korean United Presbyterian Church of Seattle (B), Edmonds Christian Church (C), Edmonds Church of God (D), Esperance Baptist Church (E), Edmonds Unitarian Universalist Church (F), Edgewood Baptist Church (G), Saint Timothy Lutheran Church (H), Seattle Baptist Church (I). Display/hide their locations on the map
5,835 married couples with children.
929 single-parent households (351 men, 578 women).
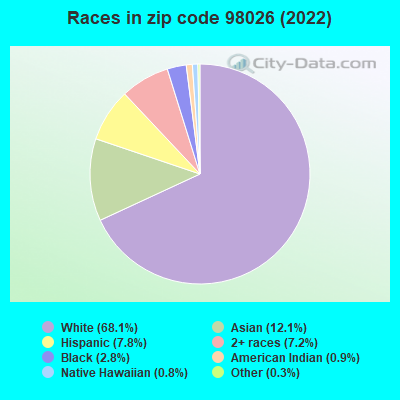
78.6% of residents of 98026 zip code speak English at home.
4.9% of residents speak Spanish at home (57% very well, 23% well, 12% not well, 8% not at all).
5.2% of residents speak other Indo-European language at home (68% very well, 19% well, 10% not well, 4% not at all).
9.3% of residents speak Asian or Pacific Island language at home (53% very well, 26% well, 19% not well, 2% not at all).
2.3% of residents speak other language at home (72% very well, 17% well, 6% not well, 5% not at all).
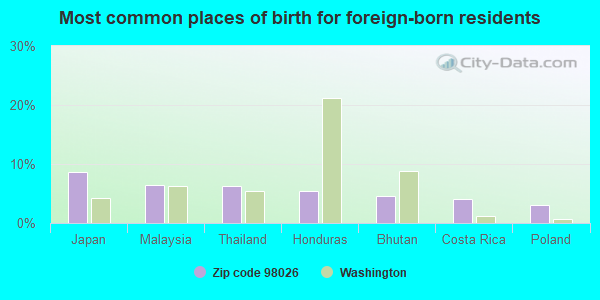
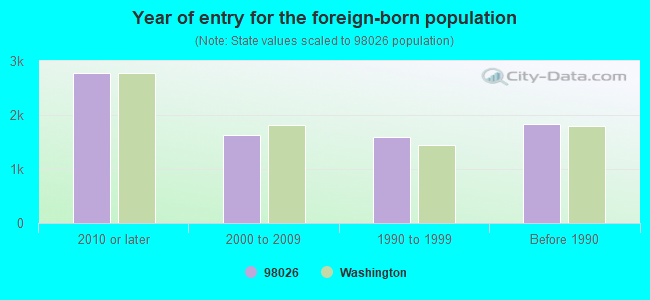
Foreign born population: 7,152 (18.1%) (57.6% of them are naturalized citizens)
(Resource Conservation and Recovery Act (tracking hazardous waste)) STATE MASTER (Washington State Department of Ecology's Facility/Site identification system) - HAZWASTE-WAD988484879, HAZARDOUS WASTE PROGRAM Business SIC classification: MOTOR VEHICLE DEALERS (NEW AND USED) Organizations: TOM MCDANIEL (CONTACT/OPERATOR)
Alternative names: ADZAM INC DBA DOUGS LYNNWOOD MAZDA, DOUG'S LYNNWOOD MAZDA
ALLIED BLDG PRODUCTS (7100 212TH ST SW in EDMONDS, WA)
(Resource Conservation and Recovery Act (tracking hazardous waste)) STATE MASTER (Washington State Department of Ecology's Facility/Site identification system) - HAZWASTE-WAR000006338, HAZARDOUS WASTE PROGRAM, EPCRA Business SIC classification: LUMBER, PLYWOOD, MILLWORK, AND WOOD PANELS Organizations: ROBBIE SHELTS (CONTACT/OPERATOR)
Alternative names: ALLIED BUILDING PRODUCTS CORP EDMONDS
CAMPBELL NELSON VW SAAB (24329 HWY 99 in EDMONDS, WA)
(Resource Conservation and Recovery Act (tracking hazardous waste)) STATE MASTER (Washington State Department of Ecology's Facility/Site identification system) - TOXICS-11533, LEAKING STORAGE TANK, UNDERGROUND STORAGE TANK PROGRAM, HAZWASTE-WAD076634179, HAZARDOUS WASTE PROGRAM Business SIC classification: TOP, BODY, AND UPHOLSTERY REPAIR SHOPS AND PAINT SHOPS Organizations: CRAIG CAMPBELL (CONTACT/OPERATOR)
, CAMPBELL NELSON INC (CONTACT/OWNER)
Alternative names: CAMPBELL NELSON VOLKSWAGEN
ALDERWOOD PICNIC POINT WASTEWATER TREATMENT PLANT (6315 PICNIC POINT ROAD in EDMONDS, WA)
National Pollutant Discharge Elimination System NON-MAJOR (Tracking pollutant discharge elimination systems) - permit STATE MASTER (Washington State Department of Ecology's Facility/Site identification system) - TOXICS-4830, UNDERGROUND STORAGE TANK PROGRAM, HAZWASTE-CRK000043810, EPCRA, WATQUAL-WA0020826, NPDES NON-MAJOR Business SIC classification: WATER SUPPLY; SEWERAGE SYSTEMS Organizations: ALDERWOOD WATER DISTRICT (CONTACT/OPERATOR)
Alternative names: ALDERWOOD STP, ALDERWOOD WASTEWATER TREATMENT PLANT, ALDERWOOD WATER DISTRICT, ALDERWOOD WATER DISTRICT UST 4830, ALDERWOOD WTP
AMERICAN PAINTING SYSTEMS (19116 83RD AVE W in EDMONDS, WA)
Conditionally Exempt Small Quantity Generators, less than 100 kg/month of hazardous waste (Resource Conservation and Recovery Act (tracking hazardous waste)) - notification STATE MASTER (Washington State Department of Ecology's Facility/Site identification system) - HAZWASTE-WA0000312934, CESQG Business SIC classification: PAINTING AND PAPER HANGING Organizations: GEORGE WESTENBERGER (CONTACT/OPERATOR)
AURORA NATIONAL AUTO PARTS (22912 HWY 99 in EDMONDS, WA)
Conditionally Exempt Small Quantity Generators, less than 100 kg/month of hazardous waste (Resource Conservation and Recovery Act (tracking hazardous waste)) - notification STATE MASTER (Washington State Department of Ecology's Facility/Site identification system) - HAZWASTE-WAD988486981, CESQG Business SIC classification: AUTO AND HOME SUPPLY STORES Organizations: CHARLES RUSSELL (CONTACT/OPERATOR)
COLLISION CLINIC INC EDMONDS (22327 HWY 99 in EDMONDS, WA)
Conditionally Exempt Small Quantity Generators, less than 100 kg/month of hazardous waste (Resource Conservation and Recovery Act (tracking hazardous waste)) STATE MASTER (Washington State Department of Ecology's Facility/Site identification system) - HAZWASTE-WAD980979348, CESQG Business SIC classification: TOP, BODY, AND UPHOLSTERY REPAIR SHOPS AND PAINT SHOPS Business NAICS classification: AUTOMOTIVE BODY, PAINT, AND INTERIOR REPAIR AND MAINTENANCE.; AUTOMOTIVE BODY, PAINT, AND INTERIOR REPAIR AND MAINTENANCE. Organizations: BRUCE LINGLE (CONTACT/OPERATOR)
Housing units lacking complete plumbing facilities: 0.3% Housing units lacking complete kitchen facilities: 0.7%
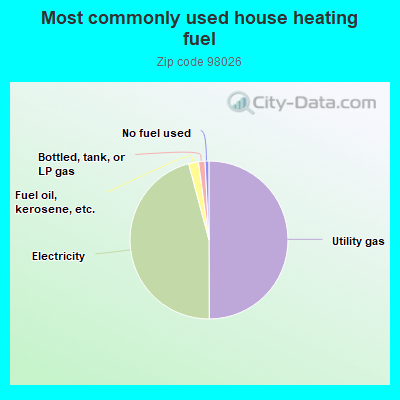
49.5%Utility gas
45.5%Electricity
2.0%Fuel oil, kerosene, etc.
1.3%Bottled, tank, or LP gas
0.8%No fuel used
Population in 1990: 33,385. Population change in the 1990s: +1,071 (+3.2%).
Place of birth for U.S.-born residents:
This state: 19,027
Northeast: 1,407
Midwest: 3,188
South: 1,653
West: 6,450
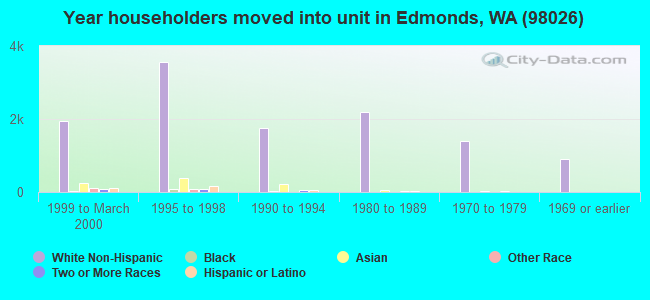
54% of the 98026 zip code residents lived in the same house 5 years ago. Out of people who lived in different houses, 44% lived in this county. Out of people who lived in different counties, 50% lived in Washington.
90% of the 98026 zip code residents lived in the same house 1 year ago. Out of people who lived in different houses, 42% moved from this county. Out of people who lived in different houses, 41% moved from different county within same state. Out of people who lived in different houses, 16% moved from different state. Out of people who lived in different houses, 5% moved from abroad.
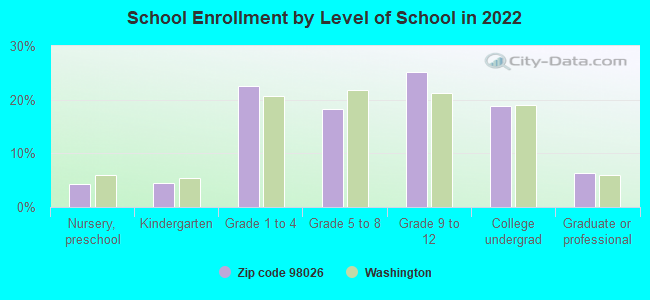
Private vs. public school enrollment:
Students in private schools in grades 1 to 8 (elementary and middle school): 330
Here:
10.1%
Washington:
12.4%
Students in private schools in grades 9 to 12 (high school): 230
Here:
11.3%
Washington:
9.2%
Students in private undergraduate colleges: 178
Here:
11.8%
Washington:
16.5%
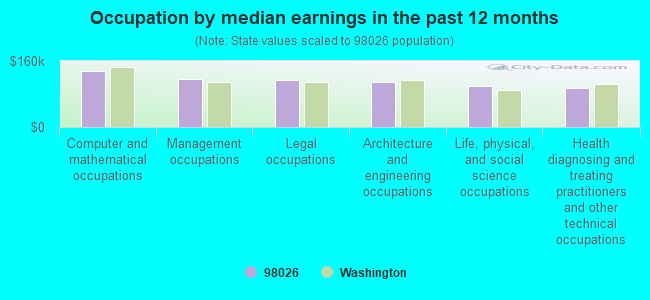
Occupation by median earnings in the past 12 months ($)
136,165Computer and mathematical occupations
115,716Management occupations
114,840Legal occupations
108,251Architecture and engineering occupations
100,208Life, physical, and social science occupations
95,137Health diagnosing and treating practitioners and other technical occupations
Companies with biggest federal contracts located in this zip code (EDMONDS, WA):
ECI GENERAL CONTRACTORS, INC (22727 HIGHWAY 99, SUITE 21; small business) : $22,094,239 in 33 contractsfrom 1999 to 2002
Contracts for Construction of Structures and Facilities -- Miscellaneous Buildings, Construction of Structures and Facilities -- Other Airfield Structures by Navy Signed by year:2000: $21,221,118; 2001: $711,582; 2002: $117,808; 2003: $0; 2004: $0; 2005: $0; 2006: $0.
Biggest contracts:
$10,500,000 with Navy for Construction of Structures and Facilities -- Miscellaneous Buildings. Signed on 2000-07-05. Completion date: 2002-11-30.
$10,500,000, same as above.Signed on 2000-04-24. Completion date: 2000-08-31.
$10,083,000, same as above.Signed on 2000-09-05. Completion date: 2002-11-30.
$355,344, same as above.Signed on 2001-01-12. Completion date: 2002-11-30.
SOUND & SEA TECHNOLOGY, INC (11931 MAPLEWOOD AVE , SW; small business) : $17,594,448 in 174 contractsfrom 2001 to 2006
Contracts for Oceanological Studies, Engineering and Technical Services, Engineering -- Engineering Development (R&D), Maintenance, Repair or Alteration of Real Property -- Electronic and Communications Facilities, and moreby Navy Signed by year:2000: $0; 2001: $8,500; 2002: $822,550; 2003: $5,425,369; 2004: $3,297,235; 2005: $5,095,503; 2006: $2,945,291.
Biggest contracts:
$1,286,653 with Navy for Oceanological Studies. Taking place in CA. Signed on 2003-06-24. Completion date: 2004-01-15.
$1,072,671, same as above.Signed on 2003-07-30. Completion date: 2003-09-30.
$999,648 with Navy for Oceanological Studies. Signed on 2005-05-23. Completion date: 2006-03-31.
$926,287 with Navy for Engineering and Technical Services. Signed on 2005-09-19. Completion date: 2006-09-30.
EGLOBE SOLUTIONS INC (22727 HWY 99 STE 102) : $1,099,015 in 23 contractsfrom 2003 to 2005
Contracts for ADP Components, Mini and Micro Computer Control Devices, ADP Supplies, ADP Software, and moreby Navy, Department of Defense, Federal Technology Service, Air Force, and others Signed by year:2000: $0; 2001: $0; 2002: $0; 2003: $122,508; 2004: $452,179; 2005: $524,328; 2006: $0.
Biggest contracts:
$200,877 with Navy for ADP Components. Taking place in RI. Signed on 2004-08-24. Completion date: 2004-09-06.
$195,950 with Navy for ADP Components. Signed on 2005-06-06. Completion date: 2005-07-04.
$97,669 with Department of Defense for Mini and Micro Computer Control Devices. Taking place in VA. Signed on 2005-09-22. Completion date: 2005-10-16.
$91,592 with Navy for ADP Supplies. Signed on 2004-09-15. Completion date: 2004-10-29.
CAE & ASSOCIATES, INC (7220 148TH ST SW; small business) : $904,572 in 22 contractsfrom 1999 to 2002
Contracts for Maintenance, Repair or Alteration of Real Property -- Office Buildings, Maintenance, Repair and Rebuilding of Equipment -- Medical, Dental, and Veterinary Equipment and Supplies, Miscellaneous Alarm, Signal and Security Detection Systems, Maintenance, Repair or Alteration of Real Property -- Other Non-Building Facilities by Public Buildings Service, Army, Navy Signed by year:2000: $615,662; 2001: $60,000; 2002: $42,910; 2003: $0; 2004: $0; 2005: $0; 2006: $0.
Biggest contracts:
$182,000 with Public Buildings Service for Maintenance, Repair or Alteration of Real Property -- Office Buildings. Signed on 2000-01-15. Completion date: 2000-09-15.
$129,000, same as above.Signed on 2000-04-15. Completion date: 2000-07-15.
$73,000, same as above.Signed on 1999-12-15. Completion date: 2000-06-15.
$73,000, same as above.Signed on 1999-12-15. Completion date: 2000-06-15.
INNOVATIVE VACUUM SERVICES INC (20909 70TH AVE W; small business) : $577,992 in 5 contractsfrom 2001 to 2006
Contracts for Air Quality Support Services, Maintenance, Repair or Alteration of Real Property -- Office Buildings by Bureau of Reclamation, Army Signed by year:2000: $0; 2001: $367,000; 2002: $3,000; 2003: $34,048; 2004: $0; 2005: $150,000; 2006: $23,944.
Biggest contracts:
$367,000 with Bureau of Reclamation for Air Quality Support Services. Signed on 2001-05-15. Completion date: 2002-02-15.
$150,000, same as above.Signed on 2005-09-20. Completion date: 2005-09-20.
$34,048, same as above.Signed on 2003-05-15. Completion date: 2002-02-15.
$23,944 with Army for Maintenance, Repair or Alteration of Real Property -- Office Buildings. Signed on 2006-02-24. Completion date: 2006-03-15.
ERIKSEN DIESEL REPAIR INC (7724 222ND ST SW; small business) 50 employees, $0 revenue. : $320,610 in 10 contractsfrom 2002 to 2004
Contracts for Non-nuclear Ship Repair (East) Ship repair (including overhauls and conversions) performed on non-nuclear propelled and nonpropelled ships east of the 108th meridian by Navy Signed by year:2000: $0; 2001: $0; 2002: $48,646; 2003: $0; 2004: $271,964; 2005: $0; 2006: $0.
Biggest contracts:
$87,025 with Navy for Non-nuclear Ship Repair (East) Ship repair (including overhauls and conversions) performed on non-nuclear propelled and nonpropelled ships east of the 108th meridian. Taking place in VA. Signed on 2004-03-18. Completion date: 2004-04-26.
$58,990, same as above.Signed on 2004-04-22. Completion date: 2004-06-17.
$50,000, same as above.Signed on 2004-07-15. Completion date: 2004-07-22.
$34,459, same as above.Signed on 2002-06-05. Completion date: 2002-08-15.
JAMES HAMPSON (23632 HIGHWAY 99 #505; small business) : $92,096 in 4 contractsfrom 2003 to 2005
$76,800 with Navy for Pressure, Temperature, and Humidity Measuring and Controlling Instruments. Signed on 2004-11-05. Completion date: 2005-03-30.
$7,195 with Navy for Inspection Gages and Precision Layout Tools. Signed on 2005-09-27. Completion date: 2005-11-09.
$5,341 with U.S. Army Corps of Engineers - civil program financing only for Electrical Hardware and Supplies. Taking place in OR. Signed on 2003-05-21. Completion date: 2003-07-02.
$2,760 with Navy for Pressure, Temperature, and Humidity Measuring and Controlling Instruments. Signed on 2005-04-18. Completion date: 2005-05-27.
CASCADE CLINICAL PERFUSION, LL (18418 HOMEVIEW DRIVE; small business) : $76,800 in 3 contractsfrom 2001 to 2002
$46,900 with Army for Cardio-Vascular Services. Signed on 2002-10-16. Completion date: 2003-09-30.
$29,900, same as above.Signed on 2001-11-30. Completion date: 2002-09-30.
$0, same as above.Signed on 2001-11-30. Completion date: 2002-09-30.
MANUFACTURERS MARKETING INC (14233 52ND AVE W; small business) : $64,638 in 2 contractsin 2005
$51,870 with Air Force for Radio and Television Communication Equipment, Except Airborne. Signed on 2005-09-21. Completion date: 2005-11-16.
$12,768, same as above.Signed on 2005-05-05. Completion date: 2005-06-27.
ABSCO ALARMS, INC (7833 196TH ST SW STE 101; small business)
$34,673 with Navy for Installation of Equipment -- Alarm, Signal, and Security Detection Systems. Signed on 2005-07-08. Completion date: 2005-09-22.
Top industries in this zip code by the number of employees in 2005:
Health Care and Social Assistance: General Medical and Surgical Hospitals (over 1000 employees: 1 establishment)
Health Care and Social Assistance: Offices of Physicians (except Mental Health Specialists) (250-499: 1, 20-49: 7, 10-19: 10, 5-9: 6, 1-4: 26)
2002 - 2018 National Fire Incident Reporting System (NFIRS) incidents
According to the data from the years 2002 - 2018 the average number of fires per year is 56. The highest number of fire incidents - 92 took place in 2006, and the least - 14 in 2015. The data has a decreasing trend.
When looking into fire subcategories, the most incidents belonged to: Structure Fires (47.7%), and Outside Fires (36.4%).
Fire incident types reported to NFIRS in Zip Code 98026


 Nearest zip codes: 98037, 98043, 98020, 98036, 98087, 98275.
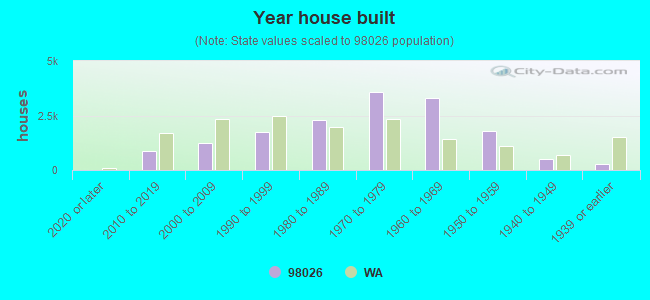


 According to the data from the years 2002 - 2018 the average number of fires per year is 56. The highest number of fire incidents - 92 took place in 2006, and the least - 14 in 2015. The data has a decreasing trend.
 When looking into fire subcategories, the most incidents belonged to: Structure Fires (47.7%), and Outside Fires (36.4%).