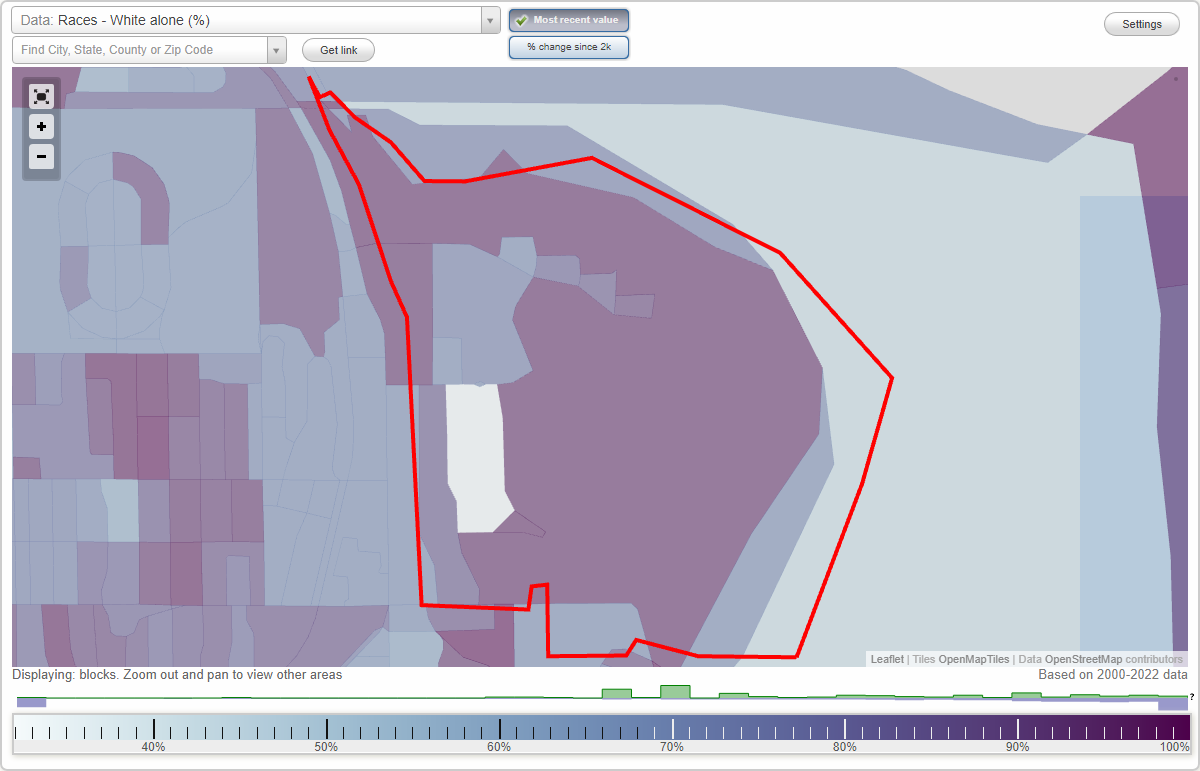
Sand Point neighborhood in Seattle, Washington (WA), 98115 detailed profile
Settings
X

Business Search - 14 Million verified businesses
Area: 0.787 square miles
Population: 689
Population density:
| Sand Point: | 875 people per square mile |
| Seattle: | 8,933 people per square mile |

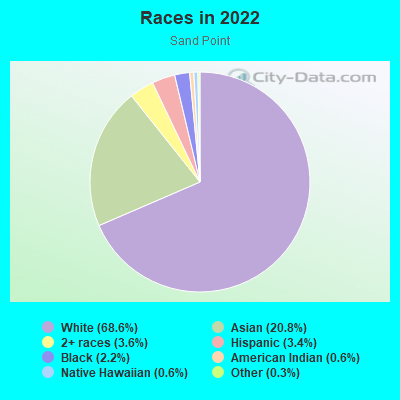
- 47868.6%White
- 14520.8%Asian
- 253.6%Two or more races
- 243.4%Hispanic or Latino
- 152.2%Black
- 40.6%American Indian
- 40.6%Native Hawaiian and Other
Pacific Islander - 20.3%Some other race
Median household income in 2022:
| Sand Point: | $109,890 |
| Seattle: | $115,409 |
Distribution of median household income
![Distribution of median household income]()
- 28Less than $10,000
- 14$10,000 to $19,999
- 4$20,000 to $29,999
- 22$30,000 to $39,999
- 11$40,000 to $49,999
- 13$50,000 to $59,999
- 29$60,000 to $74,999
- 43$75,000 to $99,999
- 27$100,000 to $124,999
- 9$125,000 to $149,999
- 25$150,000 to $199,999
- 117$200,000 or more

Distribution of owner-occupied house/condo value
![Distribution of owner-occupied house/condo value]()
- 4Less than $50,000
- 4$200,000 to $249,999
- 33$250,000 to $299,999
- 26$300,000 to $399,999
- 29$400,000 to $499,999
- 21$500,000 to $749,999
- 20$750,000 to $999,999
- 80$1,000,000 or more

Distribution of rent paid by renters
![Distribution of rent paid by renters]()
- 9$100 to $199
- 4$300 to $399
- 14$800 to $899
- 10$900 to $999
- 6$1,000 to $1,249
- 17$1,250 to $1,499
- 44$1,500 to $1,999
- 101$2,000 or more

Median rent in 2022:
| Sand Point: | $1,495 |
| Seattle: | $1,762 |
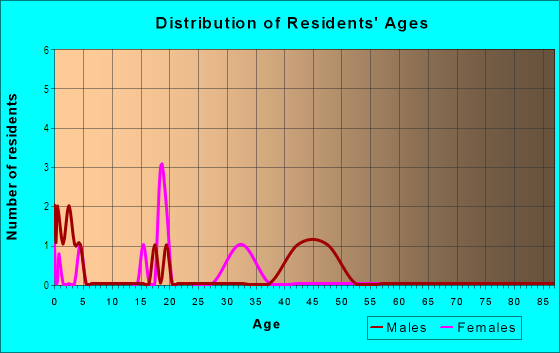
| Males: | 388 |
| Females: | 300 |
Males:
| This neighborhood: | 44.1 years |
| Whole city: | 35.7 years |
| This neighborhood: | 48.0 years |
| Whole city: | 36.2 years |
Average household size:
| Sand Point: | 2.0 people |
| Seattle: | 2.0 people |
Percentage of family households:
| Sand Point: | 32.5% |
| Seattle: | 30.9% |
| Here: | 25.7% |
| Seattle: | 33.2% |
Percentage of married-couple families with children (among all households):
| Sand Point: | 33.6% |
| Seattle: | 36.5% |
Percentage of single-mother households (among all households):
| Sand Point: | 9.3% |
| Seattle: | 9.3% |
Percentage of never married males 15 years old and over:
Percentage of never married females 15 years old and over:
| Sand Point: | 28.4% |
| Seattle: | 24.9% |
Percentage of never married females 15 years old and over:
| Sand Point: | 24.5% |
| city: | 22.3% |
Percentage of people that speak English not well or not at all:
| Sand Point: | 0.3% |
| Seattle: | 3.2% |
Percentage of people born in this state:
Percentage of people born in another U.S. state:
Percentage of native residents but born outside the U.S.:
Percentage of foreign born residents:
| Here: | 45.0% |
| Seattle: | 34.6% |
Percentage of people born in another U.S. state:
| Sand Point: | 37.4% |
| Seattle: | 42.9% |
Percentage of native residents but born outside the U.S.:
| Here: | 0.3% |
| city: | 2.2% |
Percentage of foreign born residents:
| Here: | 17.3% |
| Seattle: | 20.3% |
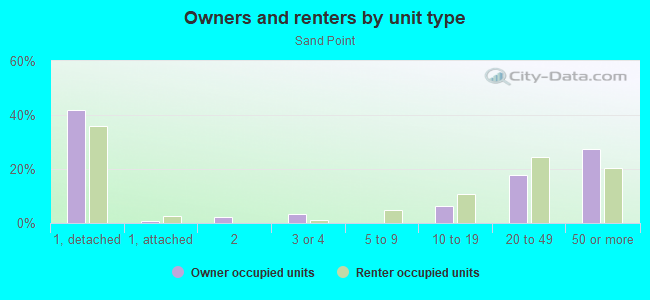
Owner-occupied
Renter-occupied

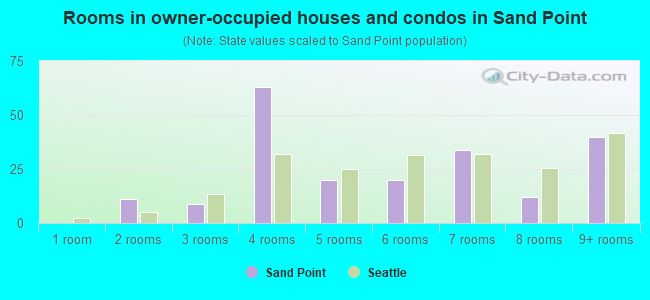
- Rooms in owner-occupied houses and condos in Sand Point
- 01 room
- 112 rooms
- 93 rooms
- 634 rooms
- 205 rooms
- 206 rooms
- 347 rooms
- 128 rooms
- 409+ rooms
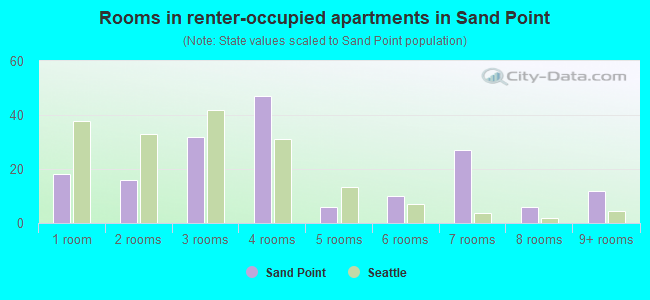
- Rooms in renter-occupied apartments in Sand Point
- 181 room
- 162 rooms
- 323 rooms
- 474 rooms
- 65 rooms
- 106 rooms
- 277 rooms
- 68 rooms
- 129+ rooms
Owner-occupied
Renter-occupied
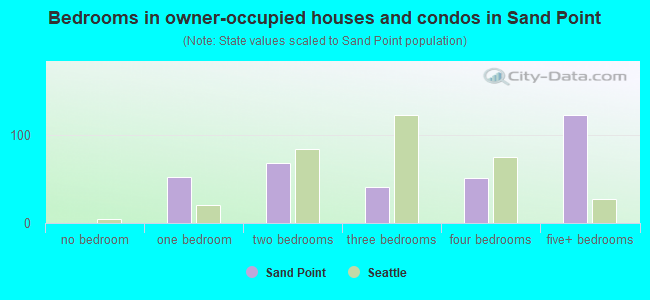
- Bedrooms in owner-occupied houses and condos in Sand Point
- 0no bedroom
- 521 bedroom
- 682 bedrooms
- 413 bedrooms
- 514 bedrooms
- 1235+ bedrooms
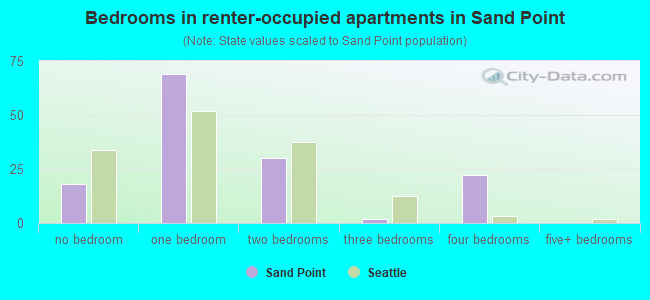
- Bedrooms in renter-occupied apartments in Sand Point
- 18no bedroom
- 691 bedroom
- 302 bedrooms
- 23 bedrooms
- 224 bedrooms
- 05+ bedrooms
Average number of cars or other vehicles available in houses/condos:
Average number of cars or other vehicles available in apartments:
| This neighborhood: | 1.4 |
| Seattle: | 1.7 |
Average number of cars or other vehicles available in apartments:
| Here: | 1.0 |
| city: | 0.9 |
Percentage of units with a mortgage:
| Sand Point: | 67.0% |
| Seattle: | 70.4% |
Housing prices:
- Average estimated value of detached houses in 2022 (25.5% of all units):
Sand Point: $1,765,868 Seattle: $1,274,185
- Average estimated '22 value of housing units in 5-or-more-unit structures (28.6% of all units):
Sand Point: $776,903 Seattle: $626,747
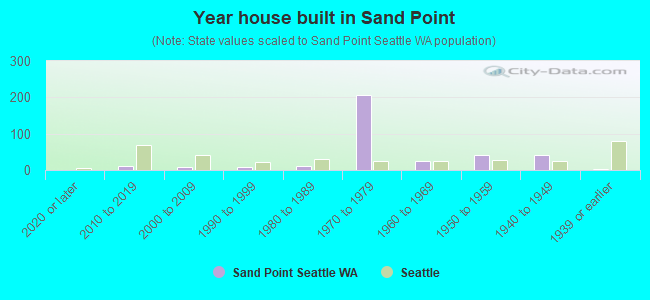
- Year house built in Sand Point
- 02020 or later
- 112010 to 2019
- 92000 to 2009
- 71990 to 1999
- 111980 to 1989
- 2061970 to 1979
- 251960 to 1969
- 401950 to 1959
- 411940 to 1949
- 21939 or earlier
City-data.com crime index for city in 2020 (higher means more crime):
| City: | 440.8 |
| U.S. average: | 219.5 |
Travel time to work (commute)
![Travel time to work (commute)]()
- 2Less than 5 minutes
- 285 to 9 minutes
- 2610 to 14 minutes
- 2115 to 19 minutes
- 3620 to 24 minutes
- 2025 to 29 minutes
- 2830 to 34 minutes
- 2135 to 39 minutes
- 1540 to 44 minutes
- 1445 to 59 minutes
- 1360 to 89 minutes
- 390 or more minutes

Means of transportation to work
![Means of transportation to work]()
- 47.8%146Drove a car alone
- 5.2%16Carpooled
- 9.5%29Bus
- 1.0%3Subway or elevated rail
- 1.6%5Light rail, streetcar or trolley
- 8.2%25Bicycle
- 1.0%3Walked
- 3.6%11Other means
- 27.2%83Worked at home

Time leaving home to go to work
![Time leaving home to go to work]()
- 212:00 a.m. to 4:59 a.m.
- 125:30 a.m. to 5:59 a.m.
- 436:00 a.m. to 6:29 a.m.
- 106:30 a.m. to 6:59 a.m.
- 297:00 a.m. to 7:29 a.m.
- 357:30 a.m. to 7:59 a.m.
- 368:00 a.m. to 8:29 a.m.
- 158:30 a.m. to 8:59 a.m.
- 269:00 a.m. to 9:59 a.m.
- 1910:00 a.m. to 10:59 a.m.
- 1811:00 a.m. to 11:59 a.m.
- 712:00 p.m. to 3:59 p.m.
- 24:00 p.m. to 11:59 p.m.

Occupations of males:
- Percentage of males in management occupations (except farmers):
Here: 24.0% city: 16.0%
- Percentage of males in computer and mathematical occupations:
Here: 24.1% city: 18.5%
- Percentage of males in architecture and engineering occupations:
Here: 1.7% city: 5.6%
- Percentage of males in life, physical, and social science occupations:
Here: 4.1% city: 2.5%
- Percentage of males in community and social services occupations:
Here: 1.0% city: 1.1%
- Percentage of males in legal occupations:
Here: 2.0% city: 2.0%
- Percentage of males in education, training, and library occupations:
Here: 10.4% city: 4.1%
- Percentage of males in arts, design, entertainment, sports, and media occupations:
Here: 9.0% city: 3.8%
- Percentage of males in healthcare practitioners and technical occupations:
Here: 8.5% city: 3.6%
- Percentage of males in service occupations:
Here: 3.6% city: 10.5%
- Percentage of males in sales and office occupations:
Here: 8.0% city: 12.0%
- Percentage of males in construction, extraction, and maintenance occupations:
Here: 2.1% city: 3.2%
- Percentage of males in production occupations:
Here: 1.5% city: 2.6%
- Percentage of males in transportation occupations:
Here: 2.4% city: 3.0%
- Percentage of males in material moving occupations:
Here: 2.1% city: 1.9%
Occupations of females:
- Percentage of females in management occupations (except farmers):
Here: 16.9% city: 14.2%
- Percentage of females in business and financial operations occupations:
Here: 5.2% city: 9.8%
- Percentage of females in computer and mathematical occupations:
Here: 9.3% city: 6.6%
- Percentage of females in community and social services occupations:
Here: 1.8% city: 3.2%
- Percentage of females in legal occupations:
Here: 8.3% city: 2.5%
- Percentage of females in education, training, and library occupations:
Here: 15.2% city: 8.7%
- Percentage of females in arts, design, entertainment, sports, and media occupations:
Here: 2.2% city: 5.0%
- Percentage of females in healthcare practitioners and technical occupations:
Here: 21.1% city: 9.6%
- Percentage of females in service occupations:
Here: 7.1% city: 13.7%
- Percentage of females in sales and office occupations:
Here: 14.7% city: 17.7%
- Percentage of females in production occupations:
Here: 1.8% city: 1.3%
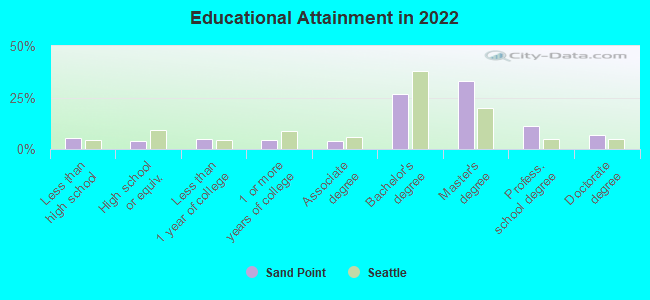
Education in this neighborhood (subdivision or community):
- Percentage of people 3 years and older in K-12 schools:
Sand Point: 22.1% Seattle: 9.8%
- Percentage of people 3 years and older in undergraduate colleges:
Sand Point: 6.5% Seattle: 6.3%
- Percentage of people 3 years and older in grad. or professional schools:
Sand Point: 6.6% Seattle: 3.0%
- Percentage of students K-12 enrolled in private schools:
Sand Point: 19.3% Seattle: 17.3%
Percentage of population below poverty level:
| Sand Point: | 11.8% |
| Seattle: | 10.1% |
Median year owner moved in (as recorded in 2022):
Median year renter moved in (as recorded in 2022):
| Sand Point: | 2008 |
| Seattle: | 2013 |
Median year renter moved in (as recorded in 2022):
| Sand Point: | 2016 |
| Seattle: | 2021 |
Percentage of married-couple families with both working:
| Sand Point: | 61.6% |
| Seattle: | 74.4% |
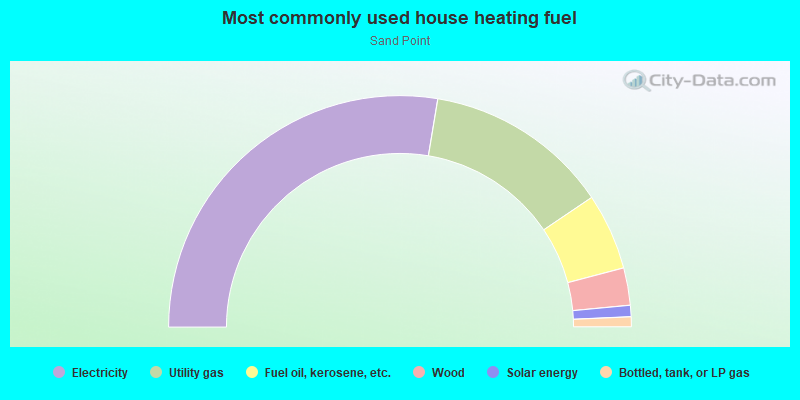
- 55.2%Electricity
- 25.8%Utility gas
- 10.7%Fuel oil, kerosene, etc.
- 5.2%Wood
- 1.6%Solar energy
- 1.4%Bottled, tank, or LP gas
Roads and streets:
NE Noaa Dr
Length: 0.68 miles
Directions: E-W, SE-NW
Directions: E-W, SE-NW
NE 65th St
Length: 0.59 miles
Direction: E-W
Address range: 6148 to 6599
Direction: E-W
Address range: 6148 to 6599
NE 74th St
Length: 0.27 miles
Directions: E-W, SE-NW, SW-NE
Directions: E-W, SE-NW, SW-NE
63rd Ave NE
Length: 0.19 miles
Direction: N-S
Direction: N-S