Seattle, Washington Neighborhood Map - Income, House Prices, Occupations, Boundaries
Settings
X

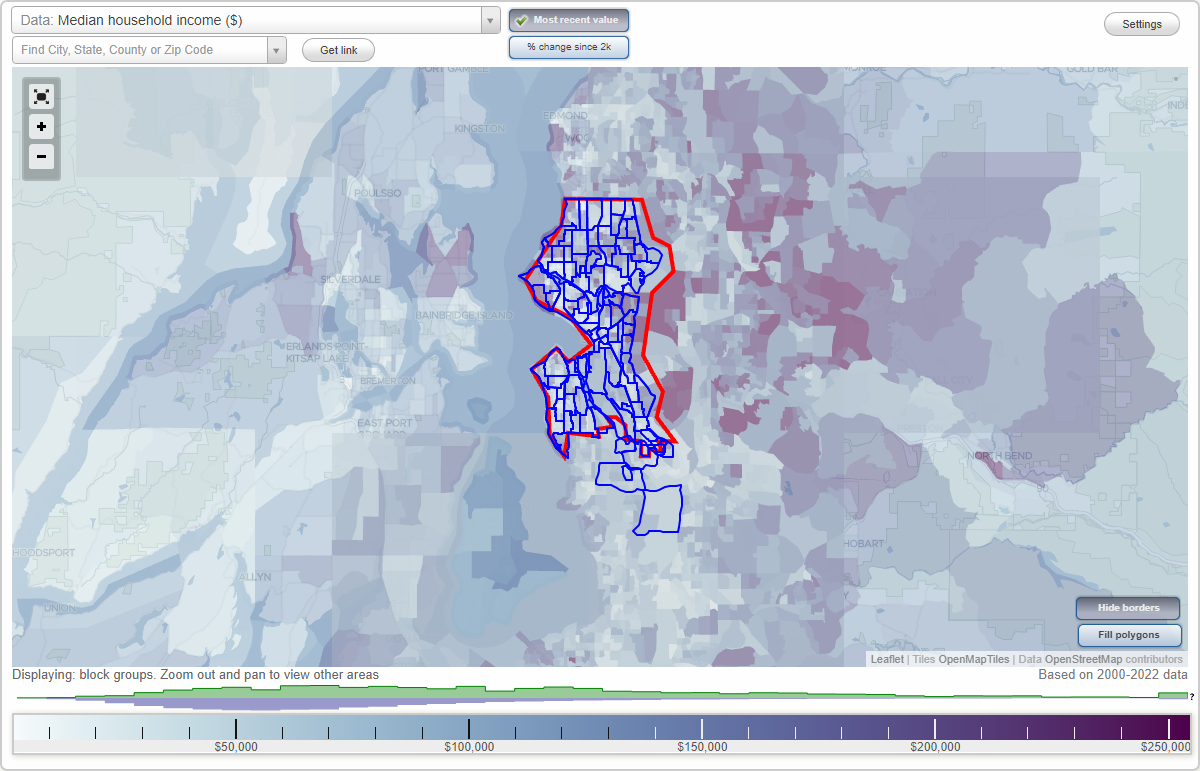
- City boundary
- Neighborhood boundaries
Business Search - 14 Million verified businesses
Neighborhoods:
Adams, Alki, Allentown, Arbor Heights, Atlantic, Ballard, Belltown, Bitter Lake, Briarcliff, Brighton, Broadview, Broadway, Bryant, Bryn Mawr, CBD, Capitol Hill, Cascade, Cedar Park, Central Area, Chinatown, Columbia City, Crown Hill, Delridge, Downtown, Dunlap, Duwamish, East Queen Anne, Eastlake, Fairmount Park, Fauntleroy, First Hill, Foster, Fremont, Gatewood, Genesee, Georgetown, Green Lake, Greenwood, Haller Lake, Harbor Island, Harrison, High Point, Highland Park, Holly Park, Industrial District, Interbay, Lake City, Lakeridge, Laurelhurst, Lawton Park, Leschi, Lower Queen Anne, Loyal Heights, Madison Park, Madrona, Magnolia, Mann, Maple Leaf, Matthews Beach, Meadowbrook, Mid Beacon Hill, Minor, Montlake, Mount Baker, North Admiral, North Beach, North Beacon Hill, North College Park, North Delridge, North Queen Anne, Northgate, Olympic Hills, Orillia, Phinney Ridge, Pike Place, Pinehurst, Portage Bay, Queen Anne, Rainier Valley, Ranier Beach, Ranier View, Ravenna, Riverton, Riverview, Roosevelt, Roxhill, Sand Point, Seaview, Seward Park, Skyway, SoDo, South Beacon Hill, South Delridge, South Lake Union, South Park, Southeast Magnolia, Stevens, Sunset Hill, University District, Victory Heights, View Ridge, Wallingford, Wedgwood, West Queen Anne, West Seattle, West Woodland, Westlake, Whittier Heights, Windermere, Woodland Park, Yesler TerraceAdams neighborhood in Seattle statistics: (Find on map)
Area: 0.891 square miles
Roads and streets: Burke Gilman Trail (Shilshole Ave NW, Shilshole Avenue NW, Burke Gilman Trl); 15th Ave NW; NW 60th St; NW 54th St; NW 62nd St; NW 63rd St; NW 64th St; NW 59th St; NW 58th St; NW 57th St; NW 56th St; NW Market St; NW 61st St; 17th Ave NW; 20th Ave NW; Ballard Ave NW; 22nd Ave NW; 24th Ave NW; 28th Ave NW; 26th Ave NW; Leary Ave NW; 30th Ave NW; Russell Ave NW; Tallman Ave NW; NW Ione Pl; NW Dock Pl; NW Leary Way; NW 50th St; NW Ballard Way; NW 49th St; NW Brygger Pl; NW 53rd St; NW 51st St; NW 52nd St; NW 46th St; NW Vernon Pl; Barnes Ave NW; NW 48th St; Seaview Ave NW; 34th Ave NW; NW Central Pl.
Railroad features: Ballard Terminal RR; Burlington Northern Santa Fe Rlwy.
Adams neighborhood detailed profile
Alki neighborhood in Seattle statistics: (Find on map)
Area: 0.839 square miles
Population: 5,097
Population density:
Median household income in 2021:
Median rent in in 2021:
Male vs Females
Median age
Housing prices:
Average estimated value of detached houses in 2021 (55.8% of all units):
Average estimated value of townhouses or other attached units in 2021 (7.8% of all units):
Average estimated '21 value of housing units in 5-or-more-unit structures (9.2% of all units):
Most popular occupations of males: computer and mathematical occupations (20.9%); sales and office occupations (20.4%); management occupations (except farmers) (19.7%); transportation occupations (8.1%); arts, design, entertainment, sports, and media occupations (6.6%); construction, extraction, and maintenance occupations (5.3%); education, training, and library occupations (4.1%)
Most popular occupations of females: management occupations (except farmers) (25.0%); sales and office occupations (15.1%); service occupations (13.6%); computer and mathematical occupations (10.2%); business and financial operations occupations (9.2%); education, training, and library occupations (5.4%); healthcare practitioners and technical occupations (4.9%)
Roads and streets: Alki Ave SW; Beach Dr SW; 59th Ave SW; SW Admiral Way; 56th Ave SW; 57th Ave SW; 60th Ave SW; 53rd Ave SW; SW Spokane St; SW Stevens St; 54th Ave SW; 61st Ave SW; SW Hinds St; 55th Ave SW; SW Andover St; Hillcrest Ave SW; 62nd Ave SW; 58th Ave SW; 52nd Ave SW; 63rd Ave SW; SW Orleans St; SW Dakota St; SW Genesee St; 64th Ave SW; SW Hanford St; Aikins Ave SW; SW Lander St; SW Charlestown St; SW Winthrop St; Chilberg Ave SW; 52nd Pl SW; SW Bradford St; SW Wilton Ct; 65th Ave SW; Frater Ave SW; SW Carroll St; SW Teig Pl; Chilberg Pl SW; 66th Ave SW; 58th Pl SW; Boyd Pl SW; SW Marguerite Ct; SW Horton St; 56th Pl SW; SW Manning St; Marine Ave SW; Benton Pl SW; 51st Pl SW (51st Ave SW); SW Douglas Pl; 57th Pl SW; SW Edmunds St; Point Pl SW; SW Stevens; Horton St; 64th Pl SW.
Alki neighborhood detailed profile
Area: 0.839 square miles
Population: 5,097
Population density:
| Alki: | 6,076 people per square mile |
| Seattle: | 8,750 people per square mile |
Median household income in 2021:
| Alki: | $127,532 |
| Seattle: | $110,781 |
Median rent in in 2021:
| Alki: | $1,929 |
| Seattle: | $1,670 |
Male vs Females
| Males: | 2,436 |
| Females: | 2,661 |
Median age
| Males: | 42.0 years |
| Females: | 45.5 years |
Housing prices:
Average estimated value of detached houses in 2021 (55.8% of all units):
| Alki: | $913,009 |
| Seattle: | $906,138 |
Average estimated value of townhouses or other attached units in 2021 (7.8% of all units):
| This neighborhood: | $850,000 |
| city: | $615,733 |
Average estimated '21 value of housing units in 5-or-more-unit structures (9.2% of all units):
| Alki: | $560,458 |
| Seattle: | $570,782 |
Most popular occupations of males: computer and mathematical occupations (20.9%); sales and office occupations (20.4%); management occupations (except farmers) (19.7%); transportation occupations (8.1%); arts, design, entertainment, sports, and media occupations (6.6%); construction, extraction, and maintenance occupations (5.3%); education, training, and library occupations (4.1%)
Most popular occupations of females: management occupations (except farmers) (25.0%); sales and office occupations (15.1%); service occupations (13.6%); computer and mathematical occupations (10.2%); business and financial operations occupations (9.2%); education, training, and library occupations (5.4%); healthcare practitioners and technical occupations (4.9%)
Roads and streets: Alki Ave SW; Beach Dr SW; 59th Ave SW; SW Admiral Way; 56th Ave SW; 57th Ave SW; 60th Ave SW; 53rd Ave SW; SW Spokane St; SW Stevens St; 54th Ave SW; 61st Ave SW; SW Hinds St; 55th Ave SW; SW Andover St; Hillcrest Ave SW; 62nd Ave SW; 58th Ave SW; 52nd Ave SW; 63rd Ave SW; SW Orleans St; SW Dakota St; SW Genesee St; 64th Ave SW; SW Hanford St; Aikins Ave SW; SW Lander St; SW Charlestown St; SW Winthrop St; Chilberg Ave SW; 52nd Pl SW; SW Bradford St; SW Wilton Ct; 65th Ave SW; Frater Ave SW; SW Carroll St; SW Teig Pl; Chilberg Pl SW; 66th Ave SW; 58th Pl SW; Boyd Pl SW; SW Marguerite Ct; SW Horton St; 56th Pl SW; SW Manning St; Marine Ave SW; Benton Pl SW; 51st Pl SW (51st Ave SW); SW Douglas Pl; 57th Pl SW; SW Edmunds St; Point Pl SW; SW Stevens; Horton St; 64th Pl SW.
Alki neighborhood detailed profile
Allentown neighborhood in Seattle statistics: (Find on map)
Area: 2.721 square miles
Population: 5,161
Population density:
Median household income in 2021:
Median rent in in 2021:
Male vs Females
Median age
Average estimated value of detached houses in 2021 (68.3% of all units):
Most popular occupations of males: sales and office occupations (16.3%); service occupations (15.4%); construction, extraction, and maintenance occupations (11.4%); production occupations (10.5%); material moving occupations (8.0%); management occupations (except farmers) (7.1%); computer and mathematical occupations (7.1%)
Most popular occupations of females: service occupations (28.9%); sales and office occupations (16.3%); business and financial operations occupations (9.8%); management occupations (except farmers) (8.3%); healthcare practitioners and technical occupations (6.1%); production occupations (6.1%); material moving occupations (5.5%)
Limited-access highways (interstate or state) in this neighborhood: I- 5.
Highways in this neighborhood: State Rte 599; Martin Luther King Way S (State Rte 900); State Rte 99; State Rte 99 (W Marginal Way S).
Roads and streets: Beacon Ave S; S 124th St; Interurban Ave S; S 120th St; E Marginal Way S; S 129th St; S 116th St; S 128th St; S Langston Rd; 42nd Ave S; S Avon St; S 122nd St; 64th Ave S; 56th Pl S; S Ryan Way; S Wallace St; 51st Ave S; S 130th St; 48th Ave S; S Leo St; S 126th St; 35th Ave S; 59th Ave S; Gateway Dr; 55th Ave S; S 133rd St; S 119th St; 60th Ave S; 49th Ave S; 56th Ave S; S 118th St; 44th Ave S; 37th Ave S; S 125th St; 53rd Ave S; S 114th St; S Fountain St; 44th Pl S; S Bangor St; S Augusta St; 68th Ave S; S 117th St; 57th Ave S; S 107th St; S Hazel St; Luther Ave S; 40th Ave S; S 127th Pl; 51st Pl S; S Creston St; 61st Ave S; S 120th Pl; 46th Ave S; 62nd Ave S; 47th Ave S; S 118th Pl; 50th Ave S; 38th Ave S; Railroad Ave; 50th Pl S; S Ruggles St; Pacific Hwy S; S 117th Pl; Macadam Rd S; S 109th St; 64th Pl S; 43rd Ave S; S 131st Pl; 67th Ave S; 41st Ave S; 66th Ave S; S 112th St; 54th Ave S; S 121st St; S 131st St; S Juniper St; S Moore St; 45th Ave S; S 111th St; 34th Ave S; Interurban Pl S; S 126th Pl; S 113th St; 58th Pl S; S 132nd St; 61st Pl S; S Prentice St; Langston Rd S; 43rd Pl S; 65th Ave S; 33rd Pl S; 60th Ln S; S 134th Pl; 39th Ave S; S 116th Way; Allenton Brg; S 115th St; 40th Pl S; S 104th Pl; Tukwila Intl Blvd.
Railroad features: Union Pacific RR (Burlington Northern Santa Fe Rlwy).
Other features: Duwamish Riv.
Allentown neighborhood detailed profile
Area: 2.721 square miles
Population: 5,161
Population density:
| Allentown: | 1,897 people per square mile |
| Seattle: | 8,750 people per square mile |
Median household income in 2021:
| Allentown: | $80,968 |
| Seattle: | $110,781 |
Median rent in in 2021:
| Allentown: | $1,567 |
| Seattle: | $1,670 |
Male vs Females
| Males: | 2,656 |
| Females: | 2,505 |
Median age
| Males: | 37.5 years |
| Females: | 41.2 years |
Average estimated value of detached houses in 2021 (68.3% of all units):
| Allentown: | $396,809 |
| Seattle: | $906,138 |
Most popular occupations of males: sales and office occupations (16.3%); service occupations (15.4%); construction, extraction, and maintenance occupations (11.4%); production occupations (10.5%); material moving occupations (8.0%); management occupations (except farmers) (7.1%); computer and mathematical occupations (7.1%)
Most popular occupations of females: service occupations (28.9%); sales and office occupations (16.3%); business and financial operations occupations (9.8%); management occupations (except farmers) (8.3%); healthcare practitioners and technical occupations (6.1%); production occupations (6.1%); material moving occupations (5.5%)
Limited-access highways (interstate or state) in this neighborhood: I- 5.
Highways in this neighborhood: State Rte 599; Martin Luther King Way S (State Rte 900); State Rte 99; State Rte 99 (W Marginal Way S).
Roads and streets: Beacon Ave S; S 124th St; Interurban Ave S; S 120th St; E Marginal Way S; S 129th St; S 116th St; S 128th St; S Langston Rd; 42nd Ave S; S Avon St; S 122nd St; 64th Ave S; 56th Pl S; S Ryan Way; S Wallace St; 51st Ave S; S 130th St; 48th Ave S; S Leo St; S 126th St; 35th Ave S; 59th Ave S; Gateway Dr; 55th Ave S; S 133rd St; S 119th St; 60th Ave S; 49th Ave S; 56th Ave S; S 118th St; 44th Ave S; 37th Ave S; S 125th St; 53rd Ave S; S 114th St; S Fountain St; 44th Pl S; S Bangor St; S Augusta St; 68th Ave S; S 117th St; 57th Ave S; S 107th St; S Hazel St; Luther Ave S; 40th Ave S; S 127th Pl; 51st Pl S; S Creston St; 61st Ave S; S 120th Pl; 46th Ave S; 62nd Ave S; 47th Ave S; S 118th Pl; 50th Ave S; 38th Ave S; Railroad Ave; 50th Pl S; S Ruggles St; Pacific Hwy S; S 117th Pl; Macadam Rd S; S 109th St; 64th Pl S; 43rd Ave S; S 131st Pl; 67th Ave S; 41st Ave S; 66th Ave S; S 112th St; 54th Ave S; S 121st St; S 131st St; S Juniper St; S Moore St; 45th Ave S; S 111th St; 34th Ave S; Interurban Pl S; S 126th Pl; S 113th St; 58th Pl S; S 132nd St; 61st Pl S; S Prentice St; Langston Rd S; 43rd Pl S; 65th Ave S; 33rd Pl S; 60th Ln S; S 134th Pl; 39th Ave S; S 116th Way; Allenton Brg; S 115th St; 40th Pl S; S 104th Pl; Tukwila Intl Blvd.
Railroad features: Union Pacific RR (Burlington Northern Santa Fe Rlwy).
Other features: Duwamish Riv.
Allentown neighborhood detailed profile
Arbor Heights neighborhood in Seattle statistics: (Find on map)
Area: 1.021 square miles
Population: 9,782
Population density:
Median household income in 2021:
Median rent in in 2021:
Male vs Females
Median age
Average estimated value of detached houses in 2021 (94.2% of all units):
Most popular occupations of males: management occupations (except farmers) (24.7%); sales and office occupations (14.7%); business and financial operations occupations (11.9%); computer and mathematical occupations (8.9%); construction, extraction, and maintenance occupations (8.5%); architecture and engineering occupations (7.1%); service occupations (6.5%)
Most popular occupations of females: sales and office occupations (18.5%); management occupations (except farmers) (16.5%); education, training, and library occupations (14.8%); healthcare practitioners and technical occupations (9.7%); business and financial operations occupations (9.5%); service occupations (8.5%); community and social services occupations (7.1%)
Roads and streets: SW 100th St; 35th Ave SW; SW 106th St; SW 104th St; SW 102nd St; 34th Ave SW; SW 108th St; 37th Ave SW; Seola Beach Dr SW; 31st Ave SW; 32nd Ave SW; SW 107th St; SW 98th St; SW 110th St; 39th Ave SW; 41st Ave SW; 30th Ave SW; Marine View Dr SW; California Ave SW; SW 105th St; 40th Ave SW; 42nd Ave SW; 44th Ave SW; 33rd Ave SW; SW 99th St; 36th Ave SW; SW 112th St; SW 97th St; SW Ocean View Dr; Arroyo Beach Pl SW; 45th Ave SW; 37th Pl SW; 38th Ave SW; SW 114th St; 43rd Pl SW; SW 109th St; SW 111th St; SW Seola Ln; SW 103rd St; 32nd Pl SW; SW 113th St; Marine View Pl SW; 30th Pl SW; SW Roxbury Pl; SW 112th Pl; 34th Pl SW.
Arbor Heights neighborhood detailed profile
Area: 1.021 square miles
Population: 9,782
Population density:
| Arbor Heights: | 9,584 people per square mile |
| Seattle: | 8,750 people per square mile |
Median household income in 2021:
| Arbor Heights: | $139,608 |
| Seattle: | $110,781 |
Median rent in in 2021:
| Arbor Heights: | $1,589 |
| Seattle: | $1,670 |
Male vs Females
| Males: | 4,437 |
| Females: | 5,344 |
Median age
| Males: | 44.2 years |
| Females: | 45.3 years |
Average estimated value of detached houses in 2021 (94.2% of all units):
| Arbor Heights: | $611,582 |
| Seattle: | $906,138 |
Most popular occupations of males: management occupations (except farmers) (24.7%); sales and office occupations (14.7%); business and financial operations occupations (11.9%); computer and mathematical occupations (8.9%); construction, extraction, and maintenance occupations (8.5%); architecture and engineering occupations (7.1%); service occupations (6.5%)
Most popular occupations of females: sales and office occupations (18.5%); management occupations (except farmers) (16.5%); education, training, and library occupations (14.8%); healthcare practitioners and technical occupations (9.7%); business and financial operations occupations (9.5%); service occupations (8.5%); community and social services occupations (7.1%)
Roads and streets: SW 100th St; 35th Ave SW; SW 106th St; SW 104th St; SW 102nd St; 34th Ave SW; SW 108th St; 37th Ave SW; Seola Beach Dr SW; 31st Ave SW; 32nd Ave SW; SW 107th St; SW 98th St; SW 110th St; 39th Ave SW; 41st Ave SW; 30th Ave SW; Marine View Dr SW; California Ave SW; SW 105th St; 40th Ave SW; 42nd Ave SW; 44th Ave SW; 33rd Ave SW; SW 99th St; 36th Ave SW; SW 112th St; SW 97th St; SW Ocean View Dr; Arroyo Beach Pl SW; 45th Ave SW; 37th Pl SW; 38th Ave SW; SW 114th St; 43rd Pl SW; SW 109th St; SW 111th St; SW Seola Ln; SW 103rd St; 32nd Pl SW; SW 113th St; Marine View Pl SW; 30th Pl SW; SW Roxbury Pl; SW 112th Pl; 34th Pl SW.
Arbor Heights neighborhood detailed profile
Atlantic neighborhood in Seattle statistics: (Find on map)
Area: 0.753 square miles
Population: 8,846
Population density:
Median household income in 2021:
Median rent in in 2021:
Male vs Females
Median age
Housing prices:
Average estimated value of detached houses in 2021 (30.1% of all units):
Average estimated value of townhouses or other attached units in 2021 (14.1% of all units):
Average estimated value of housing units in 2-unit structures in 2021 (5.4% of all units):
Average estimated '21 value of housing units in 3-to-4-unit structures (3.5% of all units):
Average estimated '21 value of housing units in 5-or-more-unit structures (35.8% of all units):
Most popular occupations of males: computer and mathematical occupations (22.8%); service occupations (17.2%); sales and office occupations (16.7%); management occupations (except farmers) (10.5%); architecture and engineering occupations (7.5%); business and financial operations occupations (6.4%); community and social services occupations (3.2%)
Most popular occupations of females: sales and office occupations (22.3%); management occupations (except farmers) (18.6%); business and financial operations occupations (15.5%); service occupations (13.7%); healthcare practitioners and technical occupations (7.9%); education, training, and library occupations (6.0%); arts, design, entertainment, sports, and media occupations (3.9%)
Limited-access highways (interstate or state) in this neighborhood: I- 90.
Roads and streets: Martin Luther King Way S; 26th Ave S; 23rd Ave S; S Jackson St; 24th Ave S; 25th Ave S; S Main St; S Washington St; E Yesler Way; S Lane St; S Dearborn St; 20th Ave S; S King St; S Charles St; 22nd Ave S; Rainier Ave; S Judkins St; 21st Ave S; S Jackson Pl; S Massachusetts St; S Norman St; S Weller St; S Grand St; 18th Ave S; 16th Ave S; Hiawatha Pl S; S Atlantic St; S Plum St; S Holgate St; 19th Ave S; Davis Pl S; S Walker St; 20th Pl S; S Wadsworth Pl; S Irving St; 17th Ave S; S College St; S Hill St; S Bush Pl; S Bayview St; Boren Ave S; S Nye Pl; S Ingersoll Pl; 14th Ave S; S State St; 27th Ave S; 13th Ave S; S Oxford Ct; S Mc Clellan St.
Atlantic neighborhood detailed profile
Area: 0.753 square miles
Population: 8,846
Population density:
| Atlantic: | 11,754 people per square mile |
| Seattle: | 8,750 people per square mile |
Median household income in 2021:
| Atlantic: | $101,788 |
| Seattle: | $110,781 |
Median rent in in 2021:
| Atlantic: | $1,471 |
| Seattle: | $1,670 |
Male vs Females
| Males: | 4,484 |
| Females: | 4,361 |
Median age
| Males: | 37.5 years |
| Females: | 37.4 years |
Housing prices:
Average estimated value of detached houses in 2021 (30.1% of all units):
| Atlantic: | $959,936 |
| Seattle: | $906,138 |
Average estimated value of townhouses or other attached units in 2021 (14.1% of all units):
| This neighborhood: | $711,404 |
| city: | $615,733 |
Average estimated value of housing units in 2-unit structures in 2021 (5.4% of all units):
| This neighborhood: | $816,333 |
| Seattle: | $793,396 |
Average estimated '21 value of housing units in 3-to-4-unit structures (3.5% of all units):
| Atlantic: | $739,384 |
| city: | $599,472 |
Average estimated '21 value of housing units in 5-or-more-unit structures (35.8% of all units):
| Atlantic: | $301,246 |
| Seattle: | $570,782 |
Most popular occupations of males: computer and mathematical occupations (22.8%); service occupations (17.2%); sales and office occupations (16.7%); management occupations (except farmers) (10.5%); architecture and engineering occupations (7.5%); business and financial operations occupations (6.4%); community and social services occupations (3.2%)
Most popular occupations of females: sales and office occupations (22.3%); management occupations (except farmers) (18.6%); business and financial operations occupations (15.5%); service occupations (13.7%); healthcare practitioners and technical occupations (7.9%); education, training, and library occupations (6.0%); arts, design, entertainment, sports, and media occupations (3.9%)
Limited-access highways (interstate or state) in this neighborhood: I- 90.
Roads and streets: Martin Luther King Way S; 26th Ave S; 23rd Ave S; S Jackson St; 24th Ave S; 25th Ave S; S Main St; S Washington St; E Yesler Way; S Lane St; S Dearborn St; 20th Ave S; S King St; S Charles St; 22nd Ave S; Rainier Ave; S Judkins St; 21st Ave S; S Jackson Pl; S Massachusetts St; S Norman St; S Weller St; S Grand St; 18th Ave S; 16th Ave S; Hiawatha Pl S; S Atlantic St; S Plum St; S Holgate St; 19th Ave S; Davis Pl S; S Walker St; 20th Pl S; S Wadsworth Pl; S Irving St; 17th Ave S; S College St; S Hill St; S Bush Pl; S Bayview St; Boren Ave S; S Nye Pl; S Ingersoll Pl; 14th Ave S; S State St; 27th Ave S; 13th Ave S; S Oxford Ct; S Mc Clellan St.
Atlantic neighborhood detailed profile
Ballard neighborhood in Seattle statistics: (Find on map)
Area: 4.030 square miles
Population: 65,785
Population density:
Median household income in 2021:
Median rent in in 2021:
Male vs Females
Median age
Housing prices:
Average estimated value of detached houses in 2021 (75.7% of all units):
Average estimated value of townhouses or other attached units in 2021 (5.3% of all units):
Average estimated '21 value of housing units in 5-or-more-unit structures (24.7% of all units):
Most popular occupations of males: management occupations (except farmers) (21.4%); computer and mathematical occupations (16.7%); sales and office occupations (12.2%); service occupations (9.0%); construction, extraction, and maintenance occupations (6.7%); arts, design, entertainment, sports, and media occupations (6.2%); business and financial operations occupations (5.9%)
Most popular occupations of females: sales and office occupations (19.7%); management occupations (except farmers) (18.3%); education, training, and library occupations (12.3%); business and financial operations occupations (11.9%); service occupations (11.1%); healthcare practitioners and technical occupations (7.5%); arts, design, entertainment, sports, and media occupations (6.1%)
Roads and streets: NW 60th St; NW 62nd St; NW Market St; 8th Ave NW; NW 56th St; NW 54th St; 14th Ave NW; NW 65th St; NW 64th St; NW 58th St; NW 67th St; NW 57th St; NW 59th St; 15th Ave NW; NW 61st St; NW 73rd St; NW 70th St; NW 75th St; NW 77th St; NW 80th St; NW 63rd St; Seaview Ave NW; 9th Ave NW; Burke Gilman Trail (Shilshole Ave NW, Shilshole Avenue NW, Burke Gilman Trl); NW 83rd St; 11th Ave NW; 17th Ave NW; 20th Ave NW; 32nd Ave NW; 22nd Ave NW; 24th Ave NW; 28th Ave NW; 26th Ave NW; 30th Ave NW; 34th Ave NW; NW 50th St; NW 51st St; NW 52nd St; NW 46th St; NW 53rd St; NW 49th St; Dibble Ave NW; Earl Ave NW; 27th Ave NW; 25th Ave NW; 10th Ave NW; 12th Ave NW; 16th Ave NW; Jones Ave NW; 23rd Ave NW; 18th Ave NW; 19th Ave NW; 3rd Ave NW; 6th Ave NW; NW 68th St; 13th Ave NW; 21st Ave NW; Mary Ave NW; NW Leary Way; NW Ballard Way; Burke Gilman Trl (NW 45th St); Golden Gardens Dr NW; NW 71st St; Ballard Ave NW; NW 48th St; 36th Ave NW; NW 72nd St; 33rd Ave NW; NW 47th St; NW 74th St; NW 66th St; Leary Ave NW; NW 69th St; Loyal Way NW; Burke Gilman Trl; 31st Ave NW; 7th Ave NW; 29th Ave NW; Russell Ave NW; 35th Ave NW; 4th Ave NW; Alonzo Ave NW; Leary Way NW; 37th Ave NW; 5th Ave NW; Tallman Ave NW; Division Ave NW; NW Ione Pl; NW Dock Pl; Overflow Parking Lot; Seaview Pl NW; Golden Gardens Park Rd; NW 57th Pl; NW Brygger Pl; NW 43rd St; NW 42nd St; NW Canoe Pl; NW Sloop Pl; NW Vernon Pl; Barnes Ave NW; 35th Pl NW; NW Fern Pl; View Ave NW; NW 55th St; NW 55th Pl; NW Central Pl; NW Golden Pl; NW Bright St; 38th Ave NW; 33rd Pl NW; Stanton Pl NW; NW 41st St; Parker Ct NW.
Railroad features: Ballard Terminal RR; Burlington Northern Santa Fe Rlwy.
Ballard neighborhood detailed profile
Area: 4.030 square miles
Population: 65,785
Population density:
| Ballard: | 16,325 people per square mile |
| Seattle: | 8,750 people per square mile |
Median household income in 2021:
| Ballard: | $144,548 |
| Seattle: | $110,781 |
Median rent in in 2021:
| Ballard: | $2,023 |
| Seattle: | $1,670 |
Male vs Females
| Males: | 32,296 |
| Females: | 33,488 |
Median age
| Males: | 37.5 years |
| Females: | 40.6 years |
Housing prices:
Average estimated value of detached houses in 2021 (75.7% of all units):
| Ballard: | $819,885 |
| Seattle: | $906,138 |
Average estimated value of townhouses or other attached units in 2021 (5.3% of all units):
| This neighborhood: | $807,046 |
| city: | $615,733 |
Average estimated '21 value of housing units in 5-or-more-unit structures (24.7% of all units):
| Ballard: | $380,000 |
| Seattle: | $570,782 |
Most popular occupations of males: management occupations (except farmers) (21.4%); computer and mathematical occupations (16.7%); sales and office occupations (12.2%); service occupations (9.0%); construction, extraction, and maintenance occupations (6.7%); arts, design, entertainment, sports, and media occupations (6.2%); business and financial operations occupations (5.9%)
Most popular occupations of females: sales and office occupations (19.7%); management occupations (except farmers) (18.3%); education, training, and library occupations (12.3%); business and financial operations occupations (11.9%); service occupations (11.1%); healthcare practitioners and technical occupations (7.5%); arts, design, entertainment, sports, and media occupations (6.1%)
Roads and streets: NW 60th St; NW 62nd St; NW Market St; 8th Ave NW; NW 56th St; NW 54th St; 14th Ave NW; NW 65th St; NW 64th St; NW 58th St; NW 67th St; NW 57th St; NW 59th St; 15th Ave NW; NW 61st St; NW 73rd St; NW 70th St; NW 75th St; NW 77th St; NW 80th St; NW 63rd St; Seaview Ave NW; 9th Ave NW; Burke Gilman Trail (Shilshole Ave NW, Shilshole Avenue NW, Burke Gilman Trl); NW 83rd St; 11th Ave NW; 17th Ave NW; 20th Ave NW; 32nd Ave NW; 22nd Ave NW; 24th Ave NW; 28th Ave NW; 26th Ave NW; 30th Ave NW; 34th Ave NW; NW 50th St; NW 51st St; NW 52nd St; NW 46th St; NW 53rd St; NW 49th St; Dibble Ave NW; Earl Ave NW; 27th Ave NW; 25th Ave NW; 10th Ave NW; 12th Ave NW; 16th Ave NW; Jones Ave NW; 23rd Ave NW; 18th Ave NW; 19th Ave NW; 3rd Ave NW; 6th Ave NW; NW 68th St; 13th Ave NW; 21st Ave NW; Mary Ave NW; NW Leary Way; NW Ballard Way; Burke Gilman Trl (NW 45th St); Golden Gardens Dr NW; NW 71st St; Ballard Ave NW; NW 48th St; 36th Ave NW; NW 72nd St; 33rd Ave NW; NW 47th St; NW 74th St; NW 66th St; Leary Ave NW; NW 69th St; Loyal Way NW; Burke Gilman Trl; 31st Ave NW; 7th Ave NW; 29th Ave NW; Russell Ave NW; 35th Ave NW; 4th Ave NW; Alonzo Ave NW; Leary Way NW; 37th Ave NW; 5th Ave NW; Tallman Ave NW; Division Ave NW; NW Ione Pl; NW Dock Pl; Overflow Parking Lot; Seaview Pl NW; Golden Gardens Park Rd; NW 57th Pl; NW Brygger Pl; NW 43rd St; NW 42nd St; NW Canoe Pl; NW Sloop Pl; NW Vernon Pl; Barnes Ave NW; 35th Pl NW; NW Fern Pl; View Ave NW; NW 55th St; NW 55th Pl; NW Central Pl; NW Golden Pl; NW Bright St; 38th Ave NW; 33rd Pl NW; Stanton Pl NW; NW 41st St; Parker Ct NW.
Railroad features: Ballard Terminal RR; Burlington Northern Santa Fe Rlwy.
Ballard neighborhood detailed profile
Belltown neighborhood in Seattle statistics: (Find on map)
Area: 0.510 square miles
Population: 13,136
Population density:
Median household income in 2021:
Median rent in in 2021:
Male vs Females
Median age
Average estimated '21 value of housing units in 5-or-more-unit structures (72.2% of all units):
Most popular occupations of males: computer and mathematical occupations (24.9%); arts, design, entertainment, sports, and media occupations (12.8%); architecture and engineering occupations (12.0%); management occupations (except farmers) (11.7%); sales and office occupations (11.5%); business and financial operations occupations (8.5%); service occupations (8.2%)
Most popular occupations of females: computer and mathematical occupations (28.8%); management occupations (except farmers) (24.2%); service occupations (15.6%); sales and office occupations (8.6%); business and financial operations occupations (5.9%); arts, design, entertainment, sports, and media occupations (3.7%); legal occupations (3.3%)
Highways in this neighborhood: State Rte 99 (Battery Street Tunl); State Rte 99 (Alaska Fwy, Alaskan Way Viaduct).
Roads and streets: Denny Way; Western Ave; 3rd Ave; Elliott Ave; 1st Ave; Lenora St; 2nd Ave; 4th Ave; 5th Ave (Monorail); Stewart St; Bell St; 6th Ave; Blanchard St; Virginia St; 7th Ave; Battery St; 8th Ave; Wall St; 9th Ave; Olive Way; Vine St; Terry Ave; Cedar St; Howell St; Westlake Ave; Clay St; Broad St; Boren Ave; Minor Ave; Bay St; Eagle St; Yale Ave; Battery St W; Fairview Ave; Court Pl; Dexter Ave; Warren Pl; Taylor Ave; E Denny Way; Eastlake Ave; Lenora Street Walk.
Railroad features: Burlington Northern Santa Fe Rlwy.
Belltown neighborhood detailed profile
Area: 0.510 square miles
Population: 13,136
Population density:
| Belltown (Denny Triangle): | 25,764 people per square mile |
| Seattle: | 8,750 people per square mile |
Median household income in 2021:
| Belltown (Denny Triangle): | $93,746 |
| Seattle: | $110,781 |
Median rent in in 2021:
| Belltown (Denny Triangle): | $1,593 |
| Seattle: | $1,670 |
Male vs Females
| Males: | 6,686 |
| Females: | 6,449 |
Median age
| Males: | 36.5 years |
| Females: | 38.2 years |
Average estimated '21 value of housing units in 5-or-more-unit structures (72.2% of all units):
| Belltown (Denny Triangle): | $1,352,500 |
| Seattle: | $570,782 |
Most popular occupations of males: computer and mathematical occupations (24.9%); arts, design, entertainment, sports, and media occupations (12.8%); architecture and engineering occupations (12.0%); management occupations (except farmers) (11.7%); sales and office occupations (11.5%); business and financial operations occupations (8.5%); service occupations (8.2%)
Most popular occupations of females: computer and mathematical occupations (28.8%); management occupations (except farmers) (24.2%); service occupations (15.6%); sales and office occupations (8.6%); business and financial operations occupations (5.9%); arts, design, entertainment, sports, and media occupations (3.7%); legal occupations (3.3%)
Highways in this neighborhood: State Rte 99 (Battery Street Tunl); State Rte 99 (Alaska Fwy, Alaskan Way Viaduct).
Roads and streets: Denny Way; Western Ave; 3rd Ave; Elliott Ave; 1st Ave; Lenora St; 2nd Ave; 4th Ave; 5th Ave (Monorail); Stewart St; Bell St; 6th Ave; Blanchard St; Virginia St; 7th Ave; Battery St; 8th Ave; Wall St; 9th Ave; Olive Way; Vine St; Terry Ave; Cedar St; Howell St; Westlake Ave; Clay St; Broad St; Boren Ave; Minor Ave; Bay St; Eagle St; Yale Ave; Battery St W; Fairview Ave; Court Pl; Dexter Ave; Warren Pl; Taylor Ave; E Denny Way; Eastlake Ave; Lenora Street Walk.
Railroad features: Burlington Northern Santa Fe Rlwy.
Belltown neighborhood detailed profile
Bitter Lake neighborhood in Seattle statistics: (Find on map)
Area: 0.986 square miles
Population: 8,355
Population density:
Median household income in 2021:
Median rent in in 2021:
Male vs Females
Median age
Average estimated value of detached houses in 2021 (50.1% of all units):
Most popular occupations of males: management occupations (except farmers) (15.5%); service occupations (12.4%); sales and office occupations (12.1%); business and financial operations occupations (10.3%); production occupations (6.7%); computer and mathematical occupations (6.2%); construction, extraction, and maintenance occupations (5.9%)
Most popular occupations of females: sales and office occupations (25.9%); service occupations (19.2%); business and financial operations occupations (13.8%); education, training, and library occupations (8.9%); management occupations (except farmers) (8.7%); healthcare practitioners and technical occupations (8.2%); community and social services occupations (5.2%)
Highways in this neighborhood: State Rte 99 (Aurora Ave N).
Roads and streets: Linden Ave N; Fremont Ave N; Evanston Ave N; Phinney Ave N; Dayton Ave N; N Park Ave N; N 137th St; N 143rd St; N 107th St; N 125th St; N 127th St; N 130th St; N 138th St; N 117th St; N 115th St; N 120th St; N 109th St; N 128th St; N 110th St; N 122nd St; Greenwood Ave N; N 112th St; N 135th St; N 141st St; Whitman Ave N; Bitter Pl N; N 142nd St; Wingard Ct N; N 141st Ct; N 134th St.
Bitter Lake neighborhood detailed profile
Area: 0.986 square miles
Population: 8,355
Population density:
| Bitter Lake: | 8,476 people per square mile |
| Seattle: | 8,750 people per square mile |
Median household income in 2021:
| Bitter Lake: | $93,263 |
| Seattle: | $110,781 |
Median rent in in 2021:
| Bitter Lake: | $1,402 |
| Seattle: | $1,670 |
Male vs Females
| Males: | 3,826 |
| Females: | 4,529 |
Median age
| Males: | 39.2 years |
| Females: | 51.0 years |
Average estimated value of detached houses in 2021 (50.1% of all units):
| Bitter Lake: | $736,284 |
| Seattle: | $906,138 |
Most popular occupations of males: management occupations (except farmers) (15.5%); service occupations (12.4%); sales and office occupations (12.1%); business and financial operations occupations (10.3%); production occupations (6.7%); computer and mathematical occupations (6.2%); construction, extraction, and maintenance occupations (5.9%)
Most popular occupations of females: sales and office occupations (25.9%); service occupations (19.2%); business and financial operations occupations (13.8%); education, training, and library occupations (8.9%); management occupations (except farmers) (8.7%); healthcare practitioners and technical occupations (8.2%); community and social services occupations (5.2%)
Highways in this neighborhood: State Rte 99 (Aurora Ave N).
Roads and streets: Linden Ave N; Fremont Ave N; Evanston Ave N; Phinney Ave N; Dayton Ave N; N Park Ave N; N 137th St; N 143rd St; N 107th St; N 125th St; N 127th St; N 130th St; N 138th St; N 117th St; N 115th St; N 120th St; N 109th St; N 128th St; N 110th St; N 122nd St; Greenwood Ave N; N 112th St; N 135th St; N 141st St; Whitman Ave N; Bitter Pl N; N 142nd St; Wingard Ct N; N 141st Ct; N 134th St.
Bitter Lake neighborhood detailed profile
Briarcliff neighborhood in Seattle statistics: (Find on map)
Area: 1.015 square miles
Population: 5,077
Population density:
Median household income in 2021:
Median rent in in 2021:
Male vs Females
Median age
Average estimated value of detached houses in 2021 (97.6% of all units):
Most popular occupations of males: management occupations (except farmers) (14.8%); education, training, and library occupations (11.7%); business and financial operations occupations (11.4%); computer and mathematical occupations (11.1%); sales and office occupations (10.5%); arts, design, entertainment, sports, and media occupations (7.7%); architecture and engineering occupations (7.4%)
Most popular occupations of females: sales and office occupations (17.0%); management occupations (except farmers) (16.7%); business and financial operations occupations (16.5%); computer and mathematical occupations (12.7%); legal occupations (10.5%); arts, design, entertainment, sports, and media occupations (5.9%); service occupations (5.2%)
Roads and streets: Magnolia Blvd W; Perkins Ln W; W Viewmont Way W; 36th Ave W; W Ruffner St; W Armour St; 43rd Ave W; Constance Dr W; W Bertona St; 42nd Ave W; 37th Ave W; W Dravus St; 38th Ave W; 35th Ave W; 39th Ave W; W Barrett St; W Howe St; Montavista Pl W; Westmont Way W; W Parkmont Pl; 40th Ave W; W Raye St; 44th Ave W; Crestmont Pl W; Rosemont Pl W; 32nd Ave W; Altavista Pl W; W Prosper St; 45th Ave W; W Blaine St; Mountain Dr W; W Mc Graw St; W Mc Laren St; Piedmont Pl W; Edgemont Pl W; Viewmont Way W; Crane Dr W; Eyers Pl W; Morley Pl W; W Fulton St; Arapahoe Pl W; Eastmont Way W; Ellinor Dr W; W Montfort Pl; 46th Ave W; Logan Ave W; W Glenmont Ln; 34th Ave W; W Smith St; Bishop Pl W; Montvale Pl W; W Tilden St; W Crockett St; Montvale Ct W; 33rd Ave W; W Galer St; W Armour Pl; Soundview Dr W; W Clise Ct; Magnolia Ln W; 34th Ct W; W Barrett Ln.
Briarcliff neighborhood detailed profile
Area: 1.015 square miles
Population: 5,077
Population density:
| Briarcliff: | 5,000 people per square mile |
| Seattle: | 8,750 people per square mile |
Median household income in 2021:
| Briarcliff: | $169,665 |
| Seattle: | $110,781 |
Median rent in in 2021:
| Briarcliff: | $2,248 |
| Seattle: | $1,670 |
Male vs Females
| Males: | 2,562 |
| Females: | 2,514 |
Median age
| Males: | 45.8 years |
| Females: | 45.0 years |
Average estimated value of detached houses in 2021 (97.6% of all units):
| Briarcliff: | $1,066,711 |
| Seattle: | $906,138 |
Most popular occupations of males: management occupations (except farmers) (14.8%); education, training, and library occupations (11.7%); business and financial operations occupations (11.4%); computer and mathematical occupations (11.1%); sales and office occupations (10.5%); arts, design, entertainment, sports, and media occupations (7.7%); architecture and engineering occupations (7.4%)
Most popular occupations of females: sales and office occupations (17.0%); management occupations (except farmers) (16.7%); business and financial operations occupations (16.5%); computer and mathematical occupations (12.7%); legal occupations (10.5%); arts, design, entertainment, sports, and media occupations (5.9%); service occupations (5.2%)
Roads and streets: Magnolia Blvd W; Perkins Ln W; W Viewmont Way W; 36th Ave W; W Ruffner St; W Armour St; 43rd Ave W; Constance Dr W; W Bertona St; 42nd Ave W; 37th Ave W; W Dravus St; 38th Ave W; 35th Ave W; 39th Ave W; W Barrett St; W Howe St; Montavista Pl W; Westmont Way W; W Parkmont Pl; 40th Ave W; W Raye St; 44th Ave W; Crestmont Pl W; Rosemont Pl W; 32nd Ave W; Altavista Pl W; W Prosper St; 45th Ave W; W Blaine St; Mountain Dr W; W Mc Graw St; W Mc Laren St; Piedmont Pl W; Edgemont Pl W; Viewmont Way W; Crane Dr W; Eyers Pl W; Morley Pl W; W Fulton St; Arapahoe Pl W; Eastmont Way W; Ellinor Dr W; W Montfort Pl; 46th Ave W; Logan Ave W; W Glenmont Ln; 34th Ave W; W Smith St; Bishop Pl W; Montvale Pl W; W Tilden St; W Crockett St; Montvale Ct W; 33rd Ave W; W Galer St; W Armour Pl; Soundview Dr W; W Clise Ct; Magnolia Ln W; 34th Ct W; W Barrett Ln.
Briarcliff neighborhood detailed profile
Brighton neighborhood in Seattle statistics: (Find on map)
Area: 0.661 square miles
Population: 9,688
Population density:
Median household income in 2021:
Median rent in in 2021:
Male vs Females
Median age
Average estimated value of detached houses in 2021 (51.5% of all units):
Most popular occupations of males: service occupations (24.2%); sales and office occupations (13.7%); computer and mathematical occupations (8.7%); production occupations (7.8%); construction, extraction, and maintenance occupations (5.8%); material moving occupations (5.6%); management occupations (except farmers) (5.5%)
Most popular occupations of females: service occupations (25.9%); sales and office occupations (22.0%); healthcare practitioners and technical occupations (10.3%); education, training, and library occupations (10.0%); management occupations (except farmers) (8.7%); production occupations (4.6%); community and social services occupations (3.3%)
Roads and streets: Rainier Ave; Martin Luther King Way S; S Graham St; 46th Ave S; S Morgan St; S Holly St; S Willow St; S Myrtle St; S Othello St; S Warsaw St; S Eddy St; 44th Ave S; 42nd Ave S; S Holden St; S Frontenac St; 48th Ave S; 45th Ave S; S Chicago St; 43rd Ave S; S Garden St; S Orchard St; S Austin St; S Fontanelle St; S Webster St; Renton Ave S; S Angel Pl; S Brighton St; 39th Ave S; S Bozeman St; S Wildwood Ln; 52nd Ave S; 47th Ave S; 40th Ave S; S Medley Ct; 38th Ave S; 49th Ave S; Orchard Pl S; Morgan St.
Brighton neighborhood detailed profile
Area: 0.661 square miles
Population: 9,688
Population density:
| Brighton: | 14,661 people per square mile |
| Seattle: | 8,750 people per square mile |
Median household income in 2021:
| Brighton: | $97,514 |
| Seattle: | $110,781 |
Median rent in in 2021:
| Brighton: | $1,465 |
| Seattle: | $1,670 |
Male vs Females
| Males: | 4,772 |
| Females: | 4,915 |
Median age
| Males: | 36.4 years |
| Females: | 38.5 years |
Average estimated value of detached houses in 2021 (51.5% of all units):
| Brighton: | $529,108 |
| Seattle: | $906,138 |
Most popular occupations of males: service occupations (24.2%); sales and office occupations (13.7%); computer and mathematical occupations (8.7%); production occupations (7.8%); construction, extraction, and maintenance occupations (5.8%); material moving occupations (5.6%); management occupations (except farmers) (5.5%)
Most popular occupations of females: service occupations (25.9%); sales and office occupations (22.0%); healthcare practitioners and technical occupations (10.3%); education, training, and library occupations (10.0%); management occupations (except farmers) (8.7%); production occupations (4.6%); community and social services occupations (3.3%)
Roads and streets: Rainier Ave; Martin Luther King Way S; S Graham St; 46th Ave S; S Morgan St; S Holly St; S Willow St; S Myrtle St; S Othello St; S Warsaw St; S Eddy St; 44th Ave S; 42nd Ave S; S Holden St; S Frontenac St; 48th Ave S; 45th Ave S; S Chicago St; 43rd Ave S; S Garden St; S Orchard St; S Austin St; S Fontanelle St; S Webster St; Renton Ave S; S Angel Pl; S Brighton St; 39th Ave S; S Bozeman St; S Wildwood Ln; 52nd Ave S; 47th Ave S; 40th Ave S; S Medley Ct; 38th Ave S; 49th Ave S; Orchard Pl S; Morgan St.
Brighton neighborhood detailed profile
Broadview neighborhood in Seattle statistics: (Find on map)
Area: 1.716 square miles
Population: 7,536
Population density:
Median household income in 2021:
Median rent in in 2021:
Male vs Females
Median age
Average estimated value of detached houses in 2021 (59.4% of all units):
Most popular occupations of males: sales and office occupations (13.3%); management occupations (except farmers) (13.2%); service occupations (10.8%); architecture and engineering occupations (9.0%); arts, design, entertainment, sports, and media occupations (8.7%); business and financial operations occupations (6.9%); computer and mathematical occupations (6.4%)
Most popular occupations of females: sales and office occupations (28.6%); service occupations (17.0%); management occupations (except farmers) (12.2%); healthcare practitioners and technical occupations (9.1%); business and financial operations occupations (7.5%); education, training, and library occupations (5.7%); community and social services occupations (5.2%)
Roads and streets: 1st Ave NW; 3rd Ave NW; 2nd Ave NW; Palatine Ave N; NW 125th St; 4th Ave NW; 8th Ave NW; Greenwood Ave N; NW 120th St; 9th Ave NW; NW 130th St; NW 122nd St; NW 127th St; 12th Ave NW; 6th Ave NW; NW 132nd St; NW Carkeek Park Rd; NW Elford Dr; 7th Ave NW; NW 116th St; 10th Ave NW; NW Northwood Rd; 11th Ave NW; NW 137th St; NW 117th St; NW Culbertson Dr; NW 112th St; Sherwood Rd NW; NW 134th St; Northwood Rd NW; NW Blakely Ct; NW 118th St; N 122nd St; N 125th St; N 127th St; N 130th St; N 132nd St; N 120th St; NW 135th Pl; NW 136th St; N 117th St; NW 140th St; NW 143rd St; NW 115th St; N 115th St; N 112th St; N 110th St; N 107th St; NW 144th St; Blakely Pl NW; NW 113th Pl; NW 137th Pl; Sherman Rd NW; NW 126th St; NW 114th Pl; NW 119th St; Northshire Rd NW; Hilltop Ln NW; Merrill Ln NW; Ridgemont Way N; NW 135th St; NW 131st St; N 137th St; N 140th St; NW 110th St; NW 107th St; Frazier Pl NW; NW 121st St; Alpine Way NW; 3rd Pl NW; Shoreline Park Dr NW; NW 126th Pl; Northwood Pl NW; N 143rd St; 13th Ave NW; NW 113th St; 11th Pl NW.
Railroad features: Burlington Northern Santa Fe Rlwy.
Broadview neighborhood detailed profile
Area: 1.716 square miles
Population: 7,536
Population density:
| Broadview: | 4,392 people per square mile |
| Seattle: | 8,750 people per square mile |
Median household income in 2021:
| Broadview: | $130,316 |
| Seattle: | $110,781 |
Median rent in in 2021:
| Broadview: | $1,744 |
| Seattle: | $1,670 |
Male vs Females
| Males: | 3,530 |
| Females: | 4,006 |
Median age
| Males: | 41.4 years |
| Females: | 48.7 years |
Average estimated value of detached houses in 2021 (59.4% of all units):
| Broadview: | $922,221 |
| Seattle: | $906,138 |
Most popular occupations of males: sales and office occupations (13.3%); management occupations (except farmers) (13.2%); service occupations (10.8%); architecture and engineering occupations (9.0%); arts, design, entertainment, sports, and media occupations (8.7%); business and financial operations occupations (6.9%); computer and mathematical occupations (6.4%)
Most popular occupations of females: sales and office occupations (28.6%); service occupations (17.0%); management occupations (except farmers) (12.2%); healthcare practitioners and technical occupations (9.1%); business and financial operations occupations (7.5%); education, training, and library occupations (5.7%); community and social services occupations (5.2%)
Roads and streets: 1st Ave NW; 3rd Ave NW; 2nd Ave NW; Palatine Ave N; NW 125th St; 4th Ave NW; 8th Ave NW; Greenwood Ave N; NW 120th St; 9th Ave NW; NW 130th St; NW 122nd St; NW 127th St; 12th Ave NW; 6th Ave NW; NW 132nd St; NW Carkeek Park Rd; NW Elford Dr; 7th Ave NW; NW 116th St; 10th Ave NW; NW Northwood Rd; 11th Ave NW; NW 137th St; NW 117th St; NW Culbertson Dr; NW 112th St; Sherwood Rd NW; NW 134th St; Northwood Rd NW; NW Blakely Ct; NW 118th St; N 122nd St; N 125th St; N 127th St; N 130th St; N 132nd St; N 120th St; NW 135th Pl; NW 136th St; N 117th St; NW 140th St; NW 143rd St; NW 115th St; N 115th St; N 112th St; N 110th St; N 107th St; NW 144th St; Blakely Pl NW; NW 113th Pl; NW 137th Pl; Sherman Rd NW; NW 126th St; NW 114th Pl; NW 119th St; Northshire Rd NW; Hilltop Ln NW; Merrill Ln NW; Ridgemont Way N; NW 135th St; NW 131st St; N 137th St; N 140th St; NW 110th St; NW 107th St; Frazier Pl NW; NW 121st St; Alpine Way NW; 3rd Pl NW; Shoreline Park Dr NW; NW 126th Pl; Northwood Pl NW; N 143rd St; 13th Ave NW; NW 113th St; 11th Pl NW.
Railroad features: Burlington Northern Santa Fe Rlwy.
Broadview neighborhood detailed profile
Broadway neighborhood in Seattle statistics: (Find on map)
Area: 1.067 square miles
Population: 11,837
Population density:
Median household income in 2021:
Median rent in in 2021:
Male vs Females
Median age
Housing prices:
Average estimated value of detached houses in 2021 (13.6% of all units):
Average estimated value of townhouses or other attached units in 2021 (11.8% of all units):
Average estimated '21 value of housing units in 5-or-more-unit structures (32.8% of all units):
Most popular occupations of males: management occupations (except farmers) (24.9%); computer and mathematical occupations (18.8%); sales and office occupations (9.7%); service occupations (7.1%); business and financial operations occupations (6.9%); architecture and engineering occupations (6.3%); arts, design, entertainment, sports, and media occupations (4.3%)
Most popular occupations of females: computer and mathematical occupations (16.6%); healthcare practitioners and technical occupations (16.3%); sales and office occupations (11.2%); management occupations (except farmers) (11.1%); business and financial operations occupations (10.4%); arts, design, entertainment, sports, and media occupations (8.2%); life, physical, and social science occupations (7.0%)
Limited-access highways (interstate or state) in this neighborhood: I- 5.
Roads and streets: Broadway E; 15th Ave E; 10th Ave E; E Denny Way; Harvard Ave E; E Mercer St; E Thomas St; E Republican St; E Harrison St; E Pine St; Federal Ave E; E Roy St; E John St; E Prospect St; E Howell St; Boylston Ave E; E Highland Dr; Volunteer Park Rd; E Aloha St; Belmont Ave E; Summit Ave E; 11th Ave E; Lakeview Blvd E; E Olive St; 13th Ave E; 12th Ave E; 14th Ave E; Bellevue Ave E; E Olive Way; Melrose Ave E; E Howe St; Bellevue Pl E; 12th Ave; 13th Ave; 14th Ave; 11th Ave; Melrose Ave; E Blaine St; Malden Ave E; Belmont Pl E; E Pike St; Harvard Ave; Nagle Pl; Broadway Ave; Boylston Ave; Bellevue Ave; Summit Ave; 15th Ave; Crawford Pl; Belmont Ave; Olive Way; E Galer St; E Valley St; E Ward St; Pine St; Bellevue Ct E; E Loretta Pl; Minor Ave; E Olive Pl; E Boston St; E Lynn St; Yale Ave; E Garfield St; Broadway Ave E; Boren Ave.
Broadway neighborhood detailed profile
Area: 1.067 square miles
Population: 11,837
Population density:
| Broadway: | 11,097 people per square mile |
| Seattle: | 8,750 people per square mile |
Median household income in 2021:
| Broadway: | $139,561 |
| Seattle: | $110,781 |
Median rent in in 2021:
| Broadway: | $1,784 |
| Seattle: | $1,670 |
Male vs Females
| Males: | 6,583 |
| Females: | 5,254 |
Median age
| Males: | 37.6 years |
| Females: | 37.4 years |
Housing prices:
Average estimated value of detached houses in 2021 (13.6% of all units):
| Broadway: | $1,258,748 |
| Seattle: | $906,138 |
Average estimated value of townhouses or other attached units in 2021 (11.8% of all units):
| This neighborhood: | $1,748,244 |
| city: | $615,733 |
Average estimated '21 value of housing units in 5-or-more-unit structures (32.8% of all units):
| Broadway: | $802,500 |
| Seattle: | $570,782 |
Most popular occupations of males: management occupations (except farmers) (24.9%); computer and mathematical occupations (18.8%); sales and office occupations (9.7%); service occupations (7.1%); business and financial operations occupations (6.9%); architecture and engineering occupations (6.3%); arts, design, entertainment, sports, and media occupations (4.3%)
Most popular occupations of females: computer and mathematical occupations (16.6%); healthcare practitioners and technical occupations (16.3%); sales and office occupations (11.2%); management occupations (except farmers) (11.1%); business and financial operations occupations (10.4%); arts, design, entertainment, sports, and media occupations (8.2%); life, physical, and social science occupations (7.0%)
Limited-access highways (interstate or state) in this neighborhood: I- 5.
Roads and streets: Broadway E; 15th Ave E; 10th Ave E; E Denny Way; Harvard Ave E; E Mercer St; E Thomas St; E Republican St; E Harrison St; E Pine St; Federal Ave E; E Roy St; E John St; E Prospect St; E Howell St; Boylston Ave E; E Highland Dr; Volunteer Park Rd; E Aloha St; Belmont Ave E; Summit Ave E; 11th Ave E; Lakeview Blvd E; E Olive St; 13th Ave E; 12th Ave E; 14th Ave E; Bellevue Ave E; E Olive Way; Melrose Ave E; E Howe St; Bellevue Pl E; 12th Ave; 13th Ave; 14th Ave; 11th Ave; Melrose Ave; E Blaine St; Malden Ave E; Belmont Pl E; E Pike St; Harvard Ave; Nagle Pl; Broadway Ave; Boylston Ave; Bellevue Ave; Summit Ave; 15th Ave; Crawford Pl; Belmont Ave; Olive Way; E Galer St; E Valley St; E Ward St; Pine St; Bellevue Ct E; E Loretta Pl; Minor Ave; E Olive Pl; E Boston St; E Lynn St; Yale Ave; E Garfield St; Broadway Ave E; Boren Ave.
Broadway neighborhood detailed profile
Bryant neighborhood in Seattle statistics: (Find on map)
Area: 0.532 square miles
Population: 10,539
Population density:
Median household income in 2021:
Median rent in in 2021:
Male vs Females
Median age
Average estimated value of detached houses in 2021 (100.0% of all units):
Most popular occupations of males: architecture and engineering occupations (35.3%); sales and office occupations (28.5%); management occupations (except farmers) (18.2%); computer and mathematical occupations (14.9%); arts, design, entertainment, sports, and media occupations (14.1%); education, training, and library occupations (9.6%); transportation occupations (9.6%)
Most popular occupations of females: education, training, and library occupations (27.7%); material moving occupations (14.8%); healthcare practitioners and technical occupations (14.6%); service occupations (14.2%); sales and office occupations (9.2%); architecture and engineering occupations (8.8%); arts, design, entertainment, sports, and media occupations (8.8%)
Highways in this neighborhood: State Rte 513 (Sand Point Way NE).
Roads and streets: 38th Ave NE; 40th Ave NE; 39th Ave NE; 37th Ave NE; NE 62nd St; NE 55th St; NE 60th St; NE 65th St; Burke Gilman Trl; NE 57th St; 45th Ave NE; 43rd Ave NE; Mithun Pl NE; NE 50th St; NE 58th St; NE 56th St; 42nd Ave NE; NE 68th St; NE 70th St; 44th Ave NE; 41st Ave NE; NE 73rd St; Sand Point Pl NE; NE 52nd St; Vassar Ave NE; NE Tulane Pl; Terrace Dr NE; Oberlin Ave NE; NE 47th St; NE 51st St; NE 52nd Pl; NE 72nd St; NE 74th Pl; NE 48th St; NE 67th St.
Bryant neighborhood detailed profile
Area: 0.532 square miles
Population: 10,539
Population density:
| Bryant: | 19,807 people per square mile |
| Seattle: | 8,750 people per square mile |
Median household income in 2021:
| Bryant: | $172,895 |
| Seattle: | $110,781 |
Median rent in in 2021:
| Bryant: | $3,083 |
| Seattle: | $1,670 |
Male vs Females
| Males: | 5,182 |
| Females: | 5,356 |
Median age
| Males: | 41.3 years |
| Females: | 43.3 years |
Average estimated value of detached houses in 2021 (100.0% of all units):
| Bryant: | $964,456 |
| Seattle: | $906,138 |
Most popular occupations of males: architecture and engineering occupations (35.3%); sales and office occupations (28.5%); management occupations (except farmers) (18.2%); computer and mathematical occupations (14.9%); arts, design, entertainment, sports, and media occupations (14.1%); education, training, and library occupations (9.6%); transportation occupations (9.6%)
Most popular occupations of females: education, training, and library occupations (27.7%); material moving occupations (14.8%); healthcare practitioners and technical occupations (14.6%); service occupations (14.2%); sales and office occupations (9.2%); architecture and engineering occupations (8.8%); arts, design, entertainment, sports, and media occupations (8.8%)
Highways in this neighborhood: State Rte 513 (Sand Point Way NE).
Roads and streets: 38th Ave NE; 40th Ave NE; 39th Ave NE; 37th Ave NE; NE 62nd St; NE 55th St; NE 60th St; NE 65th St; Burke Gilman Trl; NE 57th St; 45th Ave NE; 43rd Ave NE; Mithun Pl NE; NE 50th St; NE 58th St; NE 56th St; 42nd Ave NE; NE 68th St; NE 70th St; 44th Ave NE; 41st Ave NE; NE 73rd St; Sand Point Pl NE; NE 52nd St; Vassar Ave NE; NE Tulane Pl; Terrace Dr NE; Oberlin Ave NE; NE 47th St; NE 51st St; NE 52nd Pl; NE 72nd St; NE 74th Pl; NE 48th St; NE 67th St.
Bryant neighborhood detailed profile
Bryn Mawr neighborhood in Seattle statistics: (Find on map)
Area: 0.544 square miles
Population: 4,267
Population density:
Median household income in 2021:
Median rent in in 2021:
Male vs Females
Median age
Average estimated value of detached houses in 2021 (92.0% of all units):
Most popular occupations of males: sales and office occupations (14.6%); service occupations (14.3%); computer and mathematical occupations (13.9%); business and financial operations occupations (8.1%); management occupations (except farmers) (7.7%); construction, extraction, and maintenance occupations (6.7%); transportation occupations (6.3%)
Most popular occupations of females: management occupations (except farmers) (23.5%); service occupations (21.5%); education, training, and library occupations (9.5%); sales and office occupations (9.3%); production occupations (8.5%); business and financial operations occupations (7.7%); healthcare practitioners and technical occupations (6.4%)
Roads and streets: S 120th St; S 114th St; 84th Ave S; S 112th St; S 116th St; Rainier Ave; S Lake Ridge Dr; S 118th St; 82nd Ave S; 78th Ave S; 80th Ave S; Dixon Dr S; S 113th St; Forest Ave S; 76th Ave S; Rowan Rd S; S 115th St; Garden Pl S; S 121st St; S 117th St; S Sunnycrest Rd; 77th Ave S; Laurel Ln S; S 115th Pl; S 106th St; Mission Dr S; Lotus Pl S; Oakwood Ave S; Woodward Ave S; S Forest Pl; S 115th Ln; 79th Pl S; 81st Pl S; 79th Ave S; 83rd Ave S; Auburn Ave S; 81st Ave S; S 110th Ct.
Bryn Mawr neighborhood detailed profile
Area: 0.544 square miles
Population: 4,267
Population density:
| Bryn Mawr: | 7,849 people per square mile |
| Seattle: | 8,750 people per square mile |
Median household income in 2021:
| Bryn Mawr: | $92,660 |
| Seattle: | $110,781 |
Median rent in in 2021:
| Bryn Mawr: | $1,335 |
| Seattle: | $1,670 |
Male vs Females
| Males: | 1,832 |
| Females: | 2,435 |
Median age
| Males: | 43.4 years |
| Females: | 45.3 years |
Average estimated value of detached houses in 2021 (92.0% of all units):
| Bryn Mawr: | $577,826 |
| Seattle: | $906,138 |
Most popular occupations of males: sales and office occupations (14.6%); service occupations (14.3%); computer and mathematical occupations (13.9%); business and financial operations occupations (8.1%); management occupations (except farmers) (7.7%); construction, extraction, and maintenance occupations (6.7%); transportation occupations (6.3%)
Most popular occupations of females: management occupations (except farmers) (23.5%); service occupations (21.5%); education, training, and library occupations (9.5%); sales and office occupations (9.3%); production occupations (8.5%); business and financial operations occupations (7.7%); healthcare practitioners and technical occupations (6.4%)
Roads and streets: S 120th St; S 114th St; 84th Ave S; S 112th St; S 116th St; Rainier Ave; S Lake Ridge Dr; S 118th St; 82nd Ave S; 78th Ave S; 80th Ave S; Dixon Dr S; S 113th St; Forest Ave S; 76th Ave S; Rowan Rd S; S 115th St; Garden Pl S; S 121st St; S 117th St; S Sunnycrest Rd; 77th Ave S; Laurel Ln S; S 115th Pl; S 106th St; Mission Dr S; Lotus Pl S; Oakwood Ave S; Woodward Ave S; S Forest Pl; S 115th Ln; 79th Pl S; 81st Pl S; 79th Ave S; 83rd Ave S; Auburn Ave S; 81st Ave S; S 110th Ct.
Bryn Mawr neighborhood detailed profile
CBD neighborhood in Seattle statistics: (Find on map)
Area: 0.314 square miles
Population: 8,285
Population density:
Median household income in 2021:
Median rent in in 2021:
Male vs Females
Median age
Average estimated '21 value of housing units in 5-or-more-unit structures (86.1% of all units):
Most popular occupations of males: computer and mathematical occupations (35.2%); management occupations (except farmers) (15.1%); business and financial operations occupations (12.1%); service occupations (10.6%); sales and office occupations (9.5%); healthcare practitioners and technical occupations (3.3%); education, training, and library occupations (2.9%)
Most popular occupations of females: management occupations (except farmers) (21.1%); sales and office occupations (19.0%); computer and mathematical occupations (14.0%); healthcare practitioners and technical occupations (11.0%); business and financial operations occupations (7.5%); architecture and engineering occupations (7.0%); arts, design, entertainment, sports, and media occupations (5.7%)
Limited-access highways (interstate or state) in this neighborhood: I- 5.
Highways in this neighborhood: State Rte 99 (Alaskan Way Viaduct, Alaska Fwy).
Roads and streets: 5th Ave; 4th Ave; 3rd Ave; Pine St; 6th Ave; University St; Seneca St; Spring St; Madison St; Pike St; Marion St; Union St; 2nd Ave; Columbia St; 1st Ave; Western Ave; 7th Ave; 8th Ave; Cherry St; 9th Ave; Olive Way; Convention Pl; Post Ave; Boren Ave; Westlake Ave; Times Ct; Cobb Aly; Terry Ave.
CBD neighborhood detailed profile
Area: 0.314 square miles
Population: 8,285
Population density:
| CBD: | 26,398 people per square mile |
| Seattle: | 8,750 people per square mile |
Median household income in 2021:
| CBD: | $93,299 |
| Seattle: | $110,781 |
Median rent in in 2021:
| CBD: | $1,974 |
| Seattle: | $1,670 |
Male vs Females
| Males: | 4,638 |
| Females: | 3,646 |
Median age
| Males: | 35.2 years |
| Females: | 47.9 years |
Average estimated '21 value of housing units in 5-or-more-unit structures (86.1% of all units):
| CBD: | $471,511 |
| Seattle: | $570,782 |
Most popular occupations of males: computer and mathematical occupations (35.2%); management occupations (except farmers) (15.1%); business and financial operations occupations (12.1%); service occupations (10.6%); sales and office occupations (9.5%); healthcare practitioners and technical occupations (3.3%); education, training, and library occupations (2.9%)
Most popular occupations of females: management occupations (except farmers) (21.1%); sales and office occupations (19.0%); computer and mathematical occupations (14.0%); healthcare practitioners and technical occupations (11.0%); business and financial operations occupations (7.5%); architecture and engineering occupations (7.0%); arts, design, entertainment, sports, and media occupations (5.7%)
Limited-access highways (interstate or state) in this neighborhood: I- 5.
Highways in this neighborhood: State Rte 99 (Alaskan Way Viaduct, Alaska Fwy).
Roads and streets: 5th Ave; 4th Ave; 3rd Ave; Pine St; 6th Ave; University St; Seneca St; Spring St; Madison St; Pike St; Marion St; Union St; 2nd Ave; Columbia St; 1st Ave; Western Ave; 7th Ave; 8th Ave; Cherry St; 9th Ave; Olive Way; Convention Pl; Post Ave; Boren Ave; Westlake Ave; Times Ct; Cobb Aly; Terry Ave.
CBD neighborhood detailed profile
Capitol Hill neighborhood in Seattle statistics: (Find on map)
Area: 3.969 square miles
Population: 36,124
Population density:
Median household income in 2021:
Median rent in in 2021:
Male vs Females
Median age
Housing prices:
Average estimated value of detached houses in 2021 (42.7% of all units):
Average estimated value of townhouses or other attached units in 2021 (11.1% of all units):
Average estimated '21 value of housing units in 5-or-more-unit structures (17.4% of all units):
Most popular occupations of males: management occupations (except farmers) (20.0%); computer and mathematical occupations (18.1%); sales and office occupations (11.6%); healthcare practitioners and technical occupations (7.7%); business and financial operations occupations (6.9%); service occupations (5.5%); education, training, and library occupations (5.2%)
Most popular occupations of females: management occupations (except farmers) (14.8%); healthcare practitioners and technical occupations (14.6%); sales and office occupations (14.2%); business and financial operations occupations (10.9%); arts, design, entertainment, sports, and media occupations (7.9%); computer and mathematical occupations (7.8%); service occupations (7.0%)
Limited-access highways (interstate or state) in this neighborhood: I- 5.
Highways in this neighborhood: State Rte 520; Evergreen Point Floating Brg (State Rte 520).
Roads and streets: E Madison St; E Roy St; E Mercer St; E Interlaken Blvd; E Aloha St; 10th Ave E; E Thomas St; E Highland Dr; 24th Ave E; E Lynn St; Broadway E; E Republican St; Boyer Ave E; E Prospect St; E Denny Way; E John St; 22nd Ave E; Lake Washington Blvd E; Harvard Ave E; E Galer St; E Harrison St; Federal Ave E; 11th Ave E; 15th Ave E; 26th Ave E; E Newton St; 19th Ave E; E Howe St; 16th Ave E; 18th Ave E; 25th Ave E; 23rd Ave E; E Howell St; 21st Ave E; Broadmoor Dr E; 20th Ave E; E Pine St; E Mc Graw St; E Blaine St; 17th Ave E; Arboretum Dr E; 12th Ave E; E Boston St; E Olive St; 14th Ave E; E Miller St; E Garfield St; E Shelby St; E Hamlin St; 13th Ave E; 42nd Ave E; E Roanoke St; 41st Ave E; E Calhoun St; Azalea Way E; E Ward St; Boylston Ave E; Volunteer Park Rd; Belmont Ave E; E Lee St; Parkside Dr E; Summit Ave E; 38th Ave E; Shenandoah Dr E; McGilvra Blvd E; Lakeview Blvd E; E Valley St; 39th Ave E; Bellevue Ave E; Interlaken Dr E; E Mc Gilvra St; 43rd Ave E; 28th Ave E; Interlaken Pl E; E Olive Way; Delmar Dr E; Melrose Ave E; Everett Ave E; Fuhrman Ave E; 40th Ave E; E Crescent Dr; Bellevue Pl E; E Louisa St; 12th Ave; 13th Ave; 37th Ave E; E Edgar St; E Helen St; Montlake Blvd E; E Lake Washington Blvd; 14th Ave; 11th Ave; E Boston Ter; Melrose Ave; E Gwinn Pl; Malden Ave E; E Allison St; Belmont Pl E; E Pike St; E Crockett St; E Foster Island Rd; 16th Ave; Harvard Ave; Nagle Pl; Broadway Ave; E Shore Dr; Boylston Ave; Bellevue Ave; Summit Ave; 15th Ave; Blenheim Dr E; 17th Ave; E St Andrews Way; E University Blvd; Park Trl; W Montlake Pl E; 27th Ave E; 29th Ave E; 31st Ave E; Franklin Ave E; E Montlake Pl E; Crawford Pl; Belmont Ave; Waverly Way E; 32nd Ave E; Olive Way; 37th Pl E; 18th Ave; Lexington Dr E; Woodrow Pl E; 38th Pl E; Windermere Dr E; E Olin Pl; Grandview Pl E; Auburn Pl E; 19th Ave; Pine St; E Morley Way; E North St; Eaton Pl (E Eaton Pl); Bellevue Ct E; 33rd Ave E; Portage Bay Pl E; Washington Pl E; E Glen St; Peach Ct E; E Loretta Pl; 20th Ave; Royal Ct E; Minor Ave; Canterbury Ln E; E Olive Pl; Turner Way E; Yale Ave; Coryell Ct E; E Edgewater Pl; E Park Dr E; W Park Dr E; E Jansen Ct; E Lousia St; E Martin St; Broadway Ave E; E Saint Andrews Way; Knox Pl E; Glenwild Pl E; Glenwilde Pl E.
Capitol Hill neighborhood detailed profile
Area: 3.969 square miles
Population: 36,124
Population density:
| Capitol Hill: | 9,101 people per square mile |
| Seattle: | 8,750 people per square mile |
Median household income in 2021:
| Capitol Hill: | $144,111 |
| Seattle: | $110,781 |
Median rent in in 2021:
| Capitol Hill: | $1,885 |
| Seattle: | $1,670 |
Male vs Females
| Males: | 18,299 |
| Females: | 17,824 |
Median age
| Males: | 38.0 years |
| Females: | 39.0 years |
Housing prices:
Average estimated value of detached houses in 2021 (42.7% of all units):
| Capitol Hill: | $1,671,504 |
| Seattle: | $906,138 |
Average estimated value of townhouses or other attached units in 2021 (11.1% of all units):
| This neighborhood: | $1,007,143 |
| city: | $615,733 |
Average estimated '21 value of housing units in 5-or-more-unit structures (17.4% of all units):
| Capitol Hill: | $636,847 |
| Seattle: | $570,782 |
Most popular occupations of males: management occupations (except farmers) (20.0%); computer and mathematical occupations (18.1%); sales and office occupations (11.6%); healthcare practitioners and technical occupations (7.7%); business and financial operations occupations (6.9%); service occupations (5.5%); education, training, and library occupations (5.2%)
Most popular occupations of females: management occupations (except farmers) (14.8%); healthcare practitioners and technical occupations (14.6%); sales and office occupations (14.2%); business and financial operations occupations (10.9%); arts, design, entertainment, sports, and media occupations (7.9%); computer and mathematical occupations (7.8%); service occupations (7.0%)
Limited-access highways (interstate or state) in this neighborhood: I- 5.
Highways in this neighborhood: State Rte 520; Evergreen Point Floating Brg (State Rte 520).
Roads and streets: E Madison St; E Roy St; E Mercer St; E Interlaken Blvd; E Aloha St; 10th Ave E; E Thomas St; E Highland Dr; 24th Ave E; E Lynn St; Broadway E; E Republican St; Boyer Ave E; E Prospect St; E Denny Way; E John St; 22nd Ave E; Lake Washington Blvd E; Harvard Ave E; E Galer St; E Harrison St; Federal Ave E; 11th Ave E; 15th Ave E; 26th Ave E; E Newton St; 19th Ave E; E Howe St; 16th Ave E; 18th Ave E; 25th Ave E; 23rd Ave E; E Howell St; 21st Ave E; Broadmoor Dr E; 20th Ave E; E Pine St; E Mc Graw St; E Blaine St; 17th Ave E; Arboretum Dr E; 12th Ave E; E Boston St; E Olive St; 14th Ave E; E Miller St; E Garfield St; E Shelby St; E Hamlin St; 13th Ave E; 42nd Ave E; E Roanoke St; 41st Ave E; E Calhoun St; Azalea Way E; E Ward St; Boylston Ave E; Volunteer Park Rd; Belmont Ave E; E Lee St; Parkside Dr E; Summit Ave E; 38th Ave E; Shenandoah Dr E; McGilvra Blvd E; Lakeview Blvd E; E Valley St; 39th Ave E; Bellevue Ave E; Interlaken Dr E; E Mc Gilvra St; 43rd Ave E; 28th Ave E; Interlaken Pl E; E Olive Way; Delmar Dr E; Melrose Ave E; Everett Ave E; Fuhrman Ave E; 40th Ave E; E Crescent Dr; Bellevue Pl E; E Louisa St; 12th Ave; 13th Ave; 37th Ave E; E Edgar St; E Helen St; Montlake Blvd E; E Lake Washington Blvd; 14th Ave; 11th Ave; E Boston Ter; Melrose Ave; E Gwinn Pl; Malden Ave E; E Allison St; Belmont Pl E; E Pike St; E Crockett St; E Foster Island Rd; 16th Ave; Harvard Ave; Nagle Pl; Broadway Ave; E Shore Dr; Boylston Ave; Bellevue Ave; Summit Ave; 15th Ave; Blenheim Dr E; 17th Ave; E St Andrews Way; E University Blvd; Park Trl; W Montlake Pl E; 27th Ave E; 29th Ave E; 31st Ave E; Franklin Ave E; E Montlake Pl E; Crawford Pl; Belmont Ave; Waverly Way E; 32nd Ave E; Olive Way; 37th Pl E; 18th Ave; Lexington Dr E; Woodrow Pl E; 38th Pl E; Windermere Dr E; E Olin Pl; Grandview Pl E; Auburn Pl E; 19th Ave; Pine St; E Morley Way; E North St; Eaton Pl (E Eaton Pl); Bellevue Ct E; 33rd Ave E; Portage Bay Pl E; Washington Pl E; E Glen St; Peach Ct E; E Loretta Pl; 20th Ave; Royal Ct E; Minor Ave; Canterbury Ln E; E Olive Pl; Turner Way E; Yale Ave; Coryell Ct E; E Edgewater Pl; E Park Dr E; W Park Dr E; E Jansen Ct; E Lousia St; E Martin St; Broadway Ave E; E Saint Andrews Way; Knox Pl E; Glenwild Pl E; Glenwilde Pl E.
Capitol Hill neighborhood detailed profile
Cascade neighborhood in Seattle statistics: (Find on map)
Area: 1.136 square miles
Population: 7,649
Population density:
Median household income in 2021:
Median rent in in 2021:
Male vs Females
Median age
Most popular occupations of males: computer and mathematical occupations (21.7%); management occupations (except farmers) (15.5%); sales and office occupations (11.6%); business and financial operations occupations (9.9%); architecture and engineering occupations (8.6%); arts, design, entertainment, sports, and media occupations (6.7%); education, training, and library occupations (5.5%)
Most popular occupations of females: sales and office occupations (18.7%); management occupations (except farmers) (17.5%); healthcare practitioners and technical occupations (14.7%); business and financial operations occupations (11.6%); education, training, and library occupations (11.5%); service occupations (8.2%); arts, design, entertainment, sports, and media occupations (4.9%)
Limited-access highways (interstate or state) in this neighborhood: I- 5.
Highways in this neighborhood: State Rte 99 (Battery Street Tunl).
Roads and streets: Eastlake Ave E; Fairview Ave E; John St; Thomas St; Westlake Ave N; Franklin Ave E; Dexter Ave N; Harrison St; Mercer St; Fairview Ave N; Republican St; 8th Ave N; Boylston Ave E; Valley St; Broad St; Yale Ave N; Aurora Ave N; 9th Ave N; Yale Ave E; Minor Ave N; Terry Ave N; Minor Ave E; Boren Ave N; E Lynn St; E Boston St; E Roanoke St; Aloha St; 6th Ave N; E Newton St; Roy St; Pontius Ave N; Lakeview Blvd E; E Louisa St; E Galer St; E Hamlin St; E Edgar St; Ward St; E Blaine St; E Allison St; Yale Ter E; E Garfield St; Newton St; Monorail (5th Ave N); Highland Dr; E Howe St; Franklin Pl E; Yale Pl E; Garfield St; Taylor Ave N; Hayes St; Fuhrman Ave E; University Brg; Howe St; Lee St; Fairview Pl N; Galer St; E Nelson Pl; Comstock St; Portage Bay Pl E; Dexter Ct N; Red Ave E; E Shelby St.
Railroad features: Abandoned RR.
Cascade neighborhood detailed profile
Area: 1.136 square miles
Population: 7,649
Population density:
| Cascade: | 6,732 people per square mile |
| Seattle: | 8,750 people per square mile |
Median household income in 2021:
| Cascade: | $124,887 |
| Seattle: | $110,781 |
Median rent in in 2021:
| Cascade: | $1,896 |
| Seattle: | $1,670 |
Male vs Females
| Males: | 3,596 |
| Females: | 4,052 |
Median age
| Males: | 32.8 years |
| Females: | 33.4 years |
Most popular occupations of males: computer and mathematical occupations (21.7%); management occupations (except farmers) (15.5%); sales and office occupations (11.6%); business and financial operations occupations (9.9%); architecture and engineering occupations (8.6%); arts, design, entertainment, sports, and media occupations (6.7%); education, training, and library occupations (5.5%)
Most popular occupations of females: sales and office occupations (18.7%); management occupations (except farmers) (17.5%); healthcare practitioners and technical occupations (14.7%); business and financial operations occupations (11.6%); education, training, and library occupations (11.5%); service occupations (8.2%); arts, design, entertainment, sports, and media occupations (4.9%)
Limited-access highways (interstate or state) in this neighborhood: I- 5.
Highways in this neighborhood: State Rte 99 (Battery Street Tunl).
Roads and streets: Eastlake Ave E; Fairview Ave E; John St; Thomas St; Westlake Ave N; Franklin Ave E; Dexter Ave N; Harrison St; Mercer St; Fairview Ave N; Republican St; 8th Ave N; Boylston Ave E; Valley St; Broad St; Yale Ave N; Aurora Ave N; 9th Ave N; Yale Ave E; Minor Ave N; Terry Ave N; Minor Ave E; Boren Ave N; E Lynn St; E Boston St; E Roanoke St; Aloha St; 6th Ave N; E Newton St; Roy St; Pontius Ave N; Lakeview Blvd E; E Louisa St; E Galer St; E Hamlin St; E Edgar St; Ward St; E Blaine St; E Allison St; Yale Ter E; E Garfield St; Newton St; Monorail (5th Ave N); Highland Dr; E Howe St; Franklin Pl E; Yale Pl E; Garfield St; Taylor Ave N; Hayes St; Fuhrman Ave E; University Brg; Howe St; Lee St; Fairview Pl N; Galer St; E Nelson Pl; Comstock St; Portage Bay Pl E; Dexter Ct N; Red Ave E; E Shelby St.
Railroad features: Abandoned RR.
Cascade neighborhood detailed profile
Cedar Park neighborhood in Seattle statistics: (Find on map)
Area: 0.721 square miles
Population: 10,134
Population density:
Median household income in 2021:
Median rent in in 2021:
Male vs Females
Median age
Average estimated value of detached houses in 2021 (67.4% of all units):
Most popular occupations of males: service occupations (19.0%); sales and office occupations (9.9%); management occupations (except farmers) (9.2%); computer and mathematical occupations (9.2%); architecture and engineering occupations (9.1%); life, physical, and social science occupations (6.9%); production occupations (6.0%)
Most popular occupations of females: business and financial operations occupations (21.4%); education, training, and library occupations (15.7%); healthcare practitioners and technical occupations (9.9%); sales and office occupations (9.1%); transportation occupations (9.1%); computer and mathematical occupations (8.8%); management occupations (except farmers) (6.9%)
Highways in this neighborhood: Lake City Way NE (State Rte 522).
Roads and streets: 42nd Ave NE; 35th Ave NE; NE 123rd St; NE 125th St; 37th Ave NE; NE 120th St; 39th Ave NE; Riviera Pl NE; 41st Ave NE; 36th Ave NE; NE 135th St; 40th Ave NE; 33rd Ave NE; NE 140th St; 38th Ave NE; NE 130th St; NE 137th St; 32nd Ave NE; Sand Point Way NE; NE 143rd St; NE 142nd St; NE 124th St; Erickson Pl NE; 42nd Pl NE; 31st Ave NE; Bartlett Ave NE; Westwood Pl NE; NE 126th St; NE 127th St; NE 134th St; 30th Ave NE; 41st Pl NE; Lakeside Pl NE.
Cedar Park neighborhood detailed profile
Area: 0.721 square miles
Population: 10,134
Population density:
| Cedar Park: | 14,049 people per square mile |
| Seattle: | 8,750 people per square mile |
Median household income in 2021:
| Cedar Park: | $108,947 |
| Seattle: | $110,781 |
Median rent in in 2021:
| Cedar Park: | $1,556 |
| Seattle: | $1,670 |
Male vs Females
| Males: | 5,141 |
| Females: | 4,993 |
Median age
| Males: | 40.6 years |
| Females: | 45.9 years |
Average estimated value of detached houses in 2021 (67.4% of all units):
| Cedar Park: | $689,046 |
| Seattle: | $906,138 |
Most popular occupations of males: service occupations (19.0%); sales and office occupations (9.9%); management occupations (except farmers) (9.2%); computer and mathematical occupations (9.2%); architecture and engineering occupations (9.1%); life, physical, and social science occupations (6.9%); production occupations (6.0%)
Most popular occupations of females: business and financial operations occupations (21.4%); education, training, and library occupations (15.7%); healthcare practitioners and technical occupations (9.9%); sales and office occupations (9.1%); transportation occupations (9.1%); computer and mathematical occupations (8.8%); management occupations (except farmers) (6.9%)
Highways in this neighborhood: Lake City Way NE (State Rte 522).
Roads and streets: 42nd Ave NE; 35th Ave NE; NE 123rd St; NE 125th St; 37th Ave NE; NE 120th St; 39th Ave NE; Riviera Pl NE; 41st Ave NE; 36th Ave NE; NE 135th St; 40th Ave NE; 33rd Ave NE; NE 140th St; 38th Ave NE; NE 130th St; NE 137th St; 32nd Ave NE; Sand Point Way NE; NE 143rd St; NE 142nd St; NE 124th St; Erickson Pl NE; 42nd Pl NE; 31st Ave NE; Bartlett Ave NE; Westwood Pl NE; NE 126th St; NE 127th St; NE 134th St; 30th Ave NE; 41st Pl NE; Lakeside Pl NE.
Cedar Park neighborhood detailed profile
Central Area neighborhood in Seattle statistics: (Find on map)
Area: 3.558 square miles
Population: 47,603
Population density:
Median household income in 2021:
Median rent in in 2021:
Male vs Females
Median age
Housing prices:
Average estimated value of detached houses in 2021 (47.3% of all units):
Average estimated value of townhouses or other attached units in 2021 (15.8% of all units):
Average estimated value of housing units in 2-unit structures in 2021 (5.8% of all units):
Average estimated '21 value of housing units in 3-to-4-unit structures (8.4% of all units):
Average estimated '21 value of housing units in 5-or-more-unit structures (20.7% of all units):
Most popular occupations of males: management occupations (except farmers) (18.9%); computer and mathematical occupations (16.2%); service occupations (13.9%); sales and office occupations (12.6%); business and financial operations occupations (7.0%); healthcare practitioners and technical occupations (5.3%); arts, design, entertainment, sports, and media occupations (4.2%)
Most popular occupations of females: service occupations (16.6%); sales and office occupations (15.7%); management occupations (except farmers) (14.7%); healthcare practitioners and technical occupations (10.4%); education, training, and library occupations (10.1%); business and financial operations occupations (9.9%); arts, design, entertainment, sports, and media occupations (5.7%)
Limited-access highways (interstate or state) in this neighborhood: I- 90.
Roads and streets: Martin Luther King Way S; E Union St; E Columbia St; E Cherry St; E Alder St; E Marion St; E Yesler Way; E Spruce St; E Pine St; E Pike St; E Spring St; E Jefferson St; E Olive St; S Jackson St; S King St; S Dearborn St; Lake Washington Blvd E; S Washington St; S Lane St; S Main St; 30th Ave; Lake Washington Blvd; 26th Ave S; E Fir St; E Howell St; 26th Ave; Lake Washington Blvd S; 23rd Ave; 25th Ave; 27th Ave; 23rd Ave S; E Denny Way; 29th Ave; 31st Ave; S Charles St; E John St; S Judkins St; 32nd Ave; 24th Ave S; 20th Ave; 22nd Ave; 21st Ave; 25th Ave S; Lakeside Ave S; McGilvra Blvd E; 33rd Ave; S Norman St; 24th Ave; 18th Ave; 19th Ave; E Terrace St; S Irving St; 34th Ave; 36th Ave; 15th Ave; 16th Ave; 31st Ave S; 37th Ave; 39th Ave E; 14th Ave; 17th Ave; 38th Ave; 35th Ave; E Harrison St; 20th Ave S; 32nd Ave S; 36th Ave E; 29th Ave S; 30th Ave S; 22nd Ave S; 13th Ave; Rainier Ave; E James St; 28th Ave S; E Thomas St; E Republican St; 34th Ave E; 21st Ave S; Madrona Dr; S Jackson Pl; 37th Ave E; S Massachusetts St; Grand Ave; S Weller St; Hillside Dr E; 33rd Ave S; 35th Ave S; E Mercer St; 32nd Ave E; 30th Ave E; S Grand St; 18th Ave S; E Prospect St; 31st Ave E; Lake Dell Ave; 16th Ave S; Hiawatha Pl S; Erie Ave; S Atlantic St; 29th Ave E; 35th Ave E; S Plum St; S Holgate St; Dorffel Dr E; E Superior St; Yakima Ave S; 28th Ave; Newport Way; E Valley St; 19th Ave S; Davis Pl S; Maiden Ln E; S Walker St; 27th Ave E; 39th Ave; 33rd Ave E; Dewey Pl E; 20th Pl S; Wellington Ave; Randolph Ave; S Frink Pl; S Wadsworth Pl; E Highland Dr; E Ford Pl; E Ward St; Randolph Pl; E Florence Ct; Evergreen Pl; 14th Ave S; E Huron St; 26th Ave E; 17th Ave S; E Arthur Pl; S Leschi Pl; S College St; S Hill St; E Arlington Pl; S Bush Pl; 27th Ave S; S Bayview St; 38th Ave E; Fullerton Ave; Euclid Ave; Boren Ave S; S Nye Pl; Madrona Pl E; S Ingersoll Pl; E High Ln; E Howell Pl; Bradner Pl S; Yakima Pl S; E Madison St; Temple Pl; 40th Ave; 34th Ave S; S State St; S Elmwood Pl; Lakeside Ave; E Remington Ct; 25th Ave E; E Denny Blaine Pl; E Conover Ct; S Parkland Pl; E Olive Ln; Blaine Pl; E Schubert Pl; 40th Ave E; Norwood Pl; 13th Ave S; 15th Ave S; Power Ave; S Oxford Ct; Madrona Park; S Mc Clellan St.
Central Area neighborhood detailed profile
Area: 3.558 square miles
Population: 47,603
Population density:
| Central Area: | 13,378 people per square mile |
| Seattle: | 8,750 people per square mile |
Median household income in 2021:
| Central Area: | $134,322 |
| Seattle: | $110,781 |
Median rent in in 2021:
| Central Area: | $1,851 |
| Seattle: | $1,670 |
Male vs Females
| Males: | 23,856 |
| Females: | 23,747 |
Median age
| Males: | 38.0 years |
| Females: | 38.7 years |
Housing prices:
Average estimated value of detached houses in 2021 (47.3% of all units):
| Central Area: | $1,178,788 |
| Seattle: | $906,138 |
Average estimated value of townhouses or other attached units in 2021 (15.8% of all units):
| This neighborhood: | $812,879 |
| city: | $615,733 |
Average estimated value of housing units in 2-unit structures in 2021 (5.8% of all units):
| This neighborhood: | $806,250 |
| Seattle: | $793,396 |
Average estimated '21 value of housing units in 3-to-4-unit structures (8.4% of all units):
| Central Area: | $739,384 |
| city: | $599,472 |
Average estimated '21 value of housing units in 5-or-more-unit structures (20.7% of all units):
| Central Area: | $703,784 |
| Seattle: | $570,782 |
Most popular occupations of males: management occupations (except farmers) (18.9%); computer and mathematical occupations (16.2%); service occupations (13.9%); sales and office occupations (12.6%); business and financial operations occupations (7.0%); healthcare practitioners and technical occupations (5.3%); arts, design, entertainment, sports, and media occupations (4.2%)
Most popular occupations of females: service occupations (16.6%); sales and office occupations (15.7%); management occupations (except farmers) (14.7%); healthcare practitioners and technical occupations (10.4%); education, training, and library occupations (10.1%); business and financial operations occupations (9.9%); arts, design, entertainment, sports, and media occupations (5.7%)
Limited-access highways (interstate or state) in this neighborhood: I- 90.
Roads and streets: Martin Luther King Way S; E Union St; E Columbia St; E Cherry St; E Alder St; E Marion St; E Yesler Way; E Spruce St; E Pine St; E Pike St; E Spring St; E Jefferson St; E Olive St; S Jackson St; S King St; S Dearborn St; Lake Washington Blvd E; S Washington St; S Lane St; S Main St; 30th Ave; Lake Washington Blvd; 26th Ave S; E Fir St; E Howell St; 26th Ave; Lake Washington Blvd S; 23rd Ave; 25th Ave; 27th Ave; 23rd Ave S; E Denny Way; 29th Ave; 31st Ave; S Charles St; E John St; S Judkins St; 32nd Ave; 24th Ave S; 20th Ave; 22nd Ave; 21st Ave; 25th Ave S; Lakeside Ave S; McGilvra Blvd E; 33rd Ave; S Norman St; 24th Ave; 18th Ave; 19th Ave; E Terrace St; S Irving St; 34th Ave; 36th Ave; 15th Ave; 16th Ave; 31st Ave S; 37th Ave; 39th Ave E; 14th Ave; 17th Ave; 38th Ave; 35th Ave; E Harrison St; 20th Ave S; 32nd Ave S; 36th Ave E; 29th Ave S; 30th Ave S; 22nd Ave S; 13th Ave; Rainier Ave; E James St; 28th Ave S; E Thomas St; E Republican St; 34th Ave E; 21st Ave S; Madrona Dr; S Jackson Pl; 37th Ave E; S Massachusetts St; Grand Ave; S Weller St; Hillside Dr E; 33rd Ave S; 35th Ave S; E Mercer St; 32nd Ave E; 30th Ave E; S Grand St; 18th Ave S; E Prospect St; 31st Ave E; Lake Dell Ave; 16th Ave S; Hiawatha Pl S; Erie Ave; S Atlantic St; 29th Ave E; 35th Ave E; S Plum St; S Holgate St; Dorffel Dr E; E Superior St; Yakima Ave S; 28th Ave; Newport Way; E Valley St; 19th Ave S; Davis Pl S; Maiden Ln E; S Walker St; 27th Ave E; 39th Ave; 33rd Ave E; Dewey Pl E; 20th Pl S; Wellington Ave; Randolph Ave; S Frink Pl; S Wadsworth Pl; E Highland Dr; E Ford Pl; E Ward St; Randolph Pl; E Florence Ct; Evergreen Pl; 14th Ave S; E Huron St; 26th Ave E; 17th Ave S; E Arthur Pl; S Leschi Pl; S College St; S Hill St; E Arlington Pl; S Bush Pl; 27th Ave S; S Bayview St; 38th Ave E; Fullerton Ave; Euclid Ave; Boren Ave S; S Nye Pl; Madrona Pl E; S Ingersoll Pl; E High Ln; E Howell Pl; Bradner Pl S; Yakima Pl S; E Madison St; Temple Pl; 40th Ave; 34th Ave S; S State St; S Elmwood Pl; Lakeside Ave; E Remington Ct; 25th Ave E; E Denny Blaine Pl; E Conover Ct; S Parkland Pl; E Olive Ln; Blaine Pl; E Schubert Pl; 40th Ave E; Norwood Pl; 13th Ave S; 15th Ave S; Power Ave; S Oxford Ct; Madrona Park; S Mc Clellan St.
Central Area neighborhood detailed profile
Chinatown neighborhood in Seattle statistics: (Find on map)
Area: 0.221 square miles
Population: 4,587
Population density:
Median household income in 2021:
Median rent in in 2021:
Male vs Females
Median age
Housing prices:
Average estimated value of detached houses in 2021 (6.6% of all units):
Average estimated '21 value of housing units in 5-or-more-unit structures (63.6% of all units):
Most popular occupations of males: service occupations (16.8%); computer and mathematical occupations (14.7%); sales and office occupations (13.2%); transportation occupations (11.3%); management occupations (except farmers) (7.3%); architecture and engineering occupations (6.4%); business and financial operations occupations (5.5%)
Most popular occupations of females: service occupations (24.7%); sales and office occupations (16.1%); business and financial operations occupations (13.9%); computer and mathematical occupations (9.7%); education, training, and library occupations (8.8%); arts, design, entertainment, sports, and media occupations (5.5%); management occupations (except farmers) (5.4%)
Limited-access highways (interstate or state) in this neighborhood: I- 5.
Roads and streets: S King St; S Weller St; S Lane St; S Dearborn St; S Jackson St; 6th Ave S; 5th Ave S; S Main St; 7th Ave S; Maynard Ave S; 8th Ave S; Yesler Way; S Washington St; 12th Ave S; 10th Ave S; Canton Aly S; Rainier Ave; Dearborn Pl S; Maynard Aly S; Corwin Pl S; Weller St Walk.
Chinatown neighborhood detailed profile
Area: 0.221 square miles
Population: 4,587
Population density:
| Chinatown: | 20,724 people per square mile |
| Seattle: | 8,750 people per square mile |
Median household income in 2021:
| Chinatown: | $52,666 |
| Seattle: | $110,781 |
Median rent in in 2021:
| Chinatown: | $1,020 |
| Seattle: | $1,670 |
Male vs Females
| Males: | 2,543 |
| Females: | 2,043 |
Median age
| Males: | 37.5 years |
| Females: | 45.6 years |
Housing prices:
Average estimated value of detached houses in 2021 (6.6% of all units):
| Chinatown: | $744,421 |
| Seattle: | $906,138 |
Average estimated '21 value of housing units in 5-or-more-unit structures (63.6% of all units):
| Chinatown: | $316,438 |
| Seattle: | $570,782 |
Most popular occupations of males: service occupations (16.8%); computer and mathematical occupations (14.7%); sales and office occupations (13.2%); transportation occupations (11.3%); management occupations (except farmers) (7.3%); architecture and engineering occupations (6.4%); business and financial operations occupations (5.5%)
Most popular occupations of females: service occupations (24.7%); sales and office occupations (16.1%); business and financial operations occupations (13.9%); computer and mathematical occupations (9.7%); education, training, and library occupations (8.8%); arts, design, entertainment, sports, and media occupations (5.5%); management occupations (except farmers) (5.4%)
Limited-access highways (interstate or state) in this neighborhood: I- 5.
Roads and streets: S King St; S Weller St; S Lane St; S Dearborn St; S Jackson St; 6th Ave S; 5th Ave S; S Main St; 7th Ave S; Maynard Ave S; 8th Ave S; Yesler Way; S Washington St; 12th Ave S; 10th Ave S; Canton Aly S; Rainier Ave; Dearborn Pl S; Maynard Aly S; Corwin Pl S; Weller St Walk.
Chinatown neighborhood detailed profile
Columbia City neighborhood in Seattle statistics: (Find on map)
Area: 1.259 square miles
Population: 15,464
Population density:
Median household income in 2021:
Median rent in in 2021:
Male vs Females
Median age
Housing prices:
Average estimated value of detached houses in 2021 (93.6% of all units):
Average estimated value of townhouses or other attached units in 2021 (1.8% of all units):
Most popular occupations of males: sales and office occupations (16.6%); service occupations (16.2%); management occupations (except farmers) (14.2%); computer and mathematical occupations (10.2%); construction, extraction, and maintenance occupations (8.4%); architecture and engineering occupations (5.4%); business and financial operations occupations (5.0%)
Most popular occupations of females: service occupations (18.6%); legal occupations (14.1%); arts, design, entertainment, sports, and media occupations (9.8%); sales and office occupations (9.3%); business and financial operations occupations (8.4%); material moving occupations (7.7%); education, training, and library occupations (6.6%)
Roads and streets: Rainier Ave; Martin Luther King Way S; Renton Ave S; S Alaska St; 42nd Ave S; S Oregon St; 39th Ave S; S Brandon St; S Hudson St; S Dawson St; S Juneau St; S Lucile St; S Orcas St; S Findlay St; S Ferdinand St; S Angeline St; S Edmunds St; 37th Ave S; S Mead St; 35th Ave S; 46th Ave S; 44th Ave S; S Genesee St; 34th Ave S; Letitia Ave S; 43rd Ave S; S Columbian Way; 45th Ave S; Sears Dr S; South Dakota St; S Kenny St; Tamarack Dr S; Lexington Pl S; S Bennett St; S Spencer St; S Conover Way; Chestnut Ct S; S Walden St; 31st Ave S; 33rd Ave S; S Bateman St; S Andover St; Escallonia Ct S; 38th Ave S; Claremont Ave S; S Hanford St; 27th Ave S; S Americus St; S Bradford St; S Pearl St; S Raymond St; Juneau Ter S; Abelia Ct S; S Charlestown St; S Byron St; Sumac Ct S; 32nd Ave S; 36th Ave S; Locust Ct S; Barberry Ct S; Morse Ave S; 47th Ave S; Bowen Pl S; Viburnum Ct S; 30th Ave S; Beacon Ave S; 41st Ave S; S Bradford Pl; S Snoqualmie St; S Lilac St; S Adams St; Anthony Pl S; Cascadia Ave S; la Fern Pl S; S Horton St; S Delappe Pl; Goodell Pl S; Renton Pl S; S Farrar St; 29th Ave S; S Hinds St; S Raymond Pl; Kinnikinick Pl S; S Heather Pl; S Andover Ct; Juneau Ter; Mc Coy Pl S.
Columbia City neighborhood detailed profile
Area: 1.259 square miles
Population: 15,464
Population density:
| Columbia City: | 12,284 people per square mile |
| Seattle: | 8,750 people per square mile |
Median household income in 2021:
| Columbia City: | $151,752 |
| Seattle: | $110,781 |
Median rent in in 2021:
| Columbia City: | $2,261 |
| Seattle: | $1,670 |
Male vs Females
| Males: | 8,531 |
| Females: | 6,932 |
Median age
| Males: | 36.5 years |
| Females: | 38.5 years |
Housing prices:
Average estimated value of detached houses in 2021 (93.6% of all units):
| Columbia City: | $673,656 |
| Seattle: | $906,138 |
Average estimated value of townhouses or other attached units in 2021 (1.8% of all units):
| This neighborhood: | $600,533 |
| city: | $615,733 |
Most popular occupations of males: sales and office occupations (16.6%); service occupations (16.2%); management occupations (except farmers) (14.2%); computer and mathematical occupations (10.2%); construction, extraction, and maintenance occupations (8.4%); architecture and engineering occupations (5.4%); business and financial operations occupations (5.0%)
Most popular occupations of females: service occupations (18.6%); legal occupations (14.1%); arts, design, entertainment, sports, and media occupations (9.8%); sales and office occupations (9.3%); business and financial operations occupations (8.4%); material moving occupations (7.7%); education, training, and library occupations (6.6%)
Roads and streets: Rainier Ave; Martin Luther King Way S; Renton Ave S; S Alaska St; 42nd Ave S; S Oregon St; 39th Ave S; S Brandon St; S Hudson St; S Dawson St; S Juneau St; S Lucile St; S Orcas St; S Findlay St; S Ferdinand St; S Angeline St; S Edmunds St; 37th Ave S; S Mead St; 35th Ave S; 46th Ave S; 44th Ave S; S Genesee St; 34th Ave S; Letitia Ave S; 43rd Ave S; S Columbian Way; 45th Ave S; Sears Dr S; South Dakota St; S Kenny St; Tamarack Dr S; Lexington Pl S; S Bennett St; S Spencer St; S Conover Way; Chestnut Ct S; S Walden St; 31st Ave S; 33rd Ave S; S Bateman St; S Andover St; Escallonia Ct S; 38th Ave S; Claremont Ave S; S Hanford St; 27th Ave S; S Americus St; S Bradford St; S Pearl St; S Raymond St; Juneau Ter S; Abelia Ct S; S Charlestown St; S Byron St; Sumac Ct S; 32nd Ave S; 36th Ave S; Locust Ct S; Barberry Ct S; Morse Ave S; 47th Ave S; Bowen Pl S; Viburnum Ct S; 30th Ave S; Beacon Ave S; 41st Ave S; S Bradford Pl; S Snoqualmie St; S Lilac St; S Adams St; Anthony Pl S; Cascadia Ave S; la Fern Pl S; S Horton St; S Delappe Pl; Goodell Pl S; Renton Pl S; S Farrar St; 29th Ave S; S Hinds St; S Raymond Pl; Kinnikinick Pl S; S Heather Pl; S Andover Ct; Juneau Ter; Mc Coy Pl S.
Columbia City neighborhood detailed profile
Crown Hill neighborhood in Seattle statistics: (Find on map)
Area: 0.574 square miles
Population: 6,656
Population density:
Median household income in 2021:
Median rent in in 2021:
Male vs Females
Median age
Average estimated value of detached houses in 2021 (66.2% of all units):
Most popular occupations of males: management occupations (except farmers) (16.6%); business and financial operations occupations (13.9%); sales and office occupations (13.5%); computer and mathematical occupations (7.9%); architecture and engineering occupations (7.1%); healthcare practitioners and technical occupations (7.0%); material moving occupations (6.2%)
Most popular occupations of females: management occupations (except farmers) (16.7%); sales and office occupations (15.7%); arts, design, entertainment, sports, and media occupations (14.3%); healthcare practitioners and technical occupations (11.4%); community and social services occupations (10.6%); computer and mathematical occupations (6.9%); business and financial operations occupations (5.5%)
Roads and streets: NW 90th St; 8th Ave NW; 9th Ave NW; 14th Ave NW; 12th Ave NW; Holman Rd NW; 13th Ave NW; NW 87th St; Mary Ave NW; NW 100th St; 11th Ave NW; NW 95th St; Dibble Ave NW; NW 92nd St; NW 85th St; NW 103rd St; NW 97th St; 15th Ave NW; NW 96th St; NW 89th St; 17th Ave NW; 16th Ave NW; 19th Ave NW; 18th Ave NW; 20th Ave NW; NW 88th St; Access Rd; 10th Ave NW; 16th Ave NE.
Crown Hill neighborhood detailed profile
Area: 0.574 square miles
Population: 6,656
Population density:
| Crown Hill: | 11,597 people per square mile |
| Seattle: | 8,750 people per square mile |
Median household income in 2021:
| Crown Hill: | $168,731 |
| Seattle: | $110,781 |
Median rent in in 2021:
| Crown Hill: | $1,803 |
| Seattle: | $1,670 |
Male vs Females
| Males: | 3,267 |
| Females: | 3,389 |
Median age
| Males: | 42.3 years |
| Females: | 41.5 years |
Average estimated value of detached houses in 2021 (66.2% of all units):
| Crown Hill: | $989,739 |
| Seattle: | $906,138 |
Most popular occupations of males: management occupations (except farmers) (16.6%); business and financial operations occupations (13.9%); sales and office occupations (13.5%); computer and mathematical occupations (7.9%); architecture and engineering occupations (7.1%); healthcare practitioners and technical occupations (7.0%); material moving occupations (6.2%)
Most popular occupations of females: management occupations (except farmers) (16.7%); sales and office occupations (15.7%); arts, design, entertainment, sports, and media occupations (14.3%); healthcare practitioners and technical occupations (11.4%); community and social services occupations (10.6%); computer and mathematical occupations (6.9%); business and financial operations occupations (5.5%)
Roads and streets: NW 90th St; 8th Ave NW; 9th Ave NW; 14th Ave NW; 12th Ave NW; Holman Rd NW; 13th Ave NW; NW 87th St; Mary Ave NW; NW 100th St; 11th Ave NW; NW 95th St; Dibble Ave NW; NW 92nd St; NW 85th St; NW 103rd St; NW 97th St; 15th Ave NW; NW 96th St; NW 89th St; 17th Ave NW; 16th Ave NW; 19th Ave NW; 18th Ave NW; 20th Ave NW; NW 88th St; Access Rd; 10th Ave NW; 16th Ave NE.
Crown Hill neighborhood detailed profile
Delridge neighborhood in Seattle statistics: (Find on map)
Area: 5.716 square miles
Population: 27,137
Population density:
Median household income in 2021:
Median rent in in 2021:
Male vs Females
Median age
Housing prices:
Average estimated value of detached houses in 2021 (64.9% of all units):
Average estimated value of townhouses or other attached units in 2021 (5.9% of all units):
Average estimated '21 value of housing units in 5-or-more-unit structures (33.6% of all units):
Most popular occupations of males: sales and office occupations (15.2%); management occupations (except farmers) (13.1%); service occupations (11.7%); business and financial operations occupations (9.0%); computer and mathematical occupations (7.1%); architecture and engineering occupations (5.8%); construction, extraction, and maintenance occupations (5.1%)
Most popular occupations of females: sales and office occupations (21.6%); service occupations (17.1%); business and financial operations occupations (14.2%); management occupations (except farmers) (11.9%); healthcare practitioners and technical occupations (10.6%); education, training, and library occupations (6.2%); computer and mathematical occupations (3.0%)
Highways in this neighborhood: State Rte 509.
Roads and streets: Delridge Way SW; 16th Ave SW; 21st Ave SW; 18th Ave SW; 31st Ave SW; 34th Ave SW; SW Roxbury St; 17th Ave SW; 32nd Ave SW; 26th Ave SW; SW Thistle St; 23rd Ave SW; SW Cambridge St; SW Kenyon St; SW Barton St; SW Trenton St; SW Cloverdale St; SW Holden St; 25th Ave SW; 30th Ave SW; 20th Ave SW; 12th Ave SW; SW Elmgrove St; 14th Ave SW; SW Henderson St; 24th Ave SW; SW Webster St; 22nd Ave SW; 13th Ave SW; SW Myrtle St; 29th Ave SW; 15th Ave SW; SW Brandon St; 28th Ave SW; 9th Ave SW; 10th Ave SW; 11th Ave SW; 8th Ave SW; SW Othello St; SW Graham St; SW Genesee St; Sylvan Way SW; Detroit Ave SW; SW Juneau St; 19th Ave SW; SW Andover St; SW Orchard St; Olson Pl SW; SW Holly St; 7th Ave SW; W Marginal Way SW; Myers Way S; High Point Dr SW; 27th Ave SW; SW Hudson St; 4th Ave SW; SW Findlay St; SW Charlestown St; 5th Ave SW; SW Edmunds St; Henderson Pl SW; 6th Ave SW; Cycle Ln SW; SW Raymond St; SW Dawson St; SW Austin St; 1st Ave S; SW Alaska St; SW Dakota St; SW Nevada St; Croft Pl SW; SW Morgan St; Dumar Way SW; S 100th St; SW Lanham Way; 2nd Ave SW; Puget Blvd SW; 3rd Ave SW; Macarthur Ct SW; SW Barton Pl; Kelsey Ln SW; 31st Pl SW; SW Adams St; SW Kenny St; Highland Park Way SW; 26th Pl SW; Bataan Pl SW; SW 100th St; SW Snow Ct; SW Portland St; SW Willow St; Marginal Pl SW; Shinkle Pl SW; SW Sullivan St; SW Austin Pl; 7th Pl SW; SW Yancy St; Holden Pl SW; Cottage Pl SW; SW Donovan St; SW Portland Ct; S 99th St; Elmgrove St SW; SW Chicago Ct; 4th Ave S; SW Roxbury Pl; SW Oregon St; Westwood Village Mall SW; Westwood Village Ct SW; Westwood Village Pl SW; 2nd Ave S; Olson-Myers Way P&R Acrd; 1st Pl S; Occidental Ave S; S Myrtle St; SW Marginal Pl.
Railroad features: Burlington Northern Santa Fe Rlwy.
Delridge neighborhood detailed profile
Area: 5.716 square miles
Population: 27,137
Population density:
| Delridge: | 4,748 people per square mile |
| Seattle: | 8,750 people per square mile |
Median household income in 2021:
| Delridge: | $92,299 |
| Seattle: | $110,781 |
Median rent in in 2021:
| Delridge: | $1,701 |
| Seattle: | $1,670 |
Male vs Females
| Males: | 12,762 |
| Females: | 14,375 |
Median age
| Males: | 38.0 years |
| Females: | 39.9 years |
Housing prices:
Average estimated value of detached houses in 2021 (64.9% of all units):
| Delridge: | $625,188 |
| Seattle: | $906,138 |
Average estimated value of townhouses or other attached units in 2021 (5.9% of all units):
| This neighborhood: | $516,663 |
| city: | $615,733 |
Average estimated '21 value of housing units in 5-or-more-unit structures (33.6% of all units):
| Delridge: | $360,091 |
| Seattle: | $570,782 |
Most popular occupations of males: sales and office occupations (15.2%); management occupations (except farmers) (13.1%); service occupations (11.7%); business and financial operations occupations (9.0%); computer and mathematical occupations (7.1%); architecture and engineering occupations (5.8%); construction, extraction, and maintenance occupations (5.1%)
Most popular occupations of females: sales and office occupations (21.6%); service occupations (17.1%); business and financial operations occupations (14.2%); management occupations (except farmers) (11.9%); healthcare practitioners and technical occupations (10.6%); education, training, and library occupations (6.2%); computer and mathematical occupations (3.0%)
Highways in this neighborhood: State Rte 509.
Roads and streets: Delridge Way SW; 16th Ave SW; 21st Ave SW; 18th Ave SW; 31st Ave SW; 34th Ave SW; SW Roxbury St; 17th Ave SW; 32nd Ave SW; 26th Ave SW; SW Thistle St; 23rd Ave SW; SW Cambridge St; SW Kenyon St; SW Barton St; SW Trenton St; SW Cloverdale St; SW Holden St; 25th Ave SW; 30th Ave SW; 20th Ave SW; 12th Ave SW; SW Elmgrove St; 14th Ave SW; SW Henderson St; 24th Ave SW; SW Webster St; 22nd Ave SW; 13th Ave SW; SW Myrtle St; 29th Ave SW; 15th Ave SW; SW Brandon St; 28th Ave SW; 9th Ave SW; 10th Ave SW; 11th Ave SW; 8th Ave SW; SW Othello St; SW Graham St; SW Genesee St; Sylvan Way SW; Detroit Ave SW; SW Juneau St; 19th Ave SW; SW Andover St; SW Orchard St; Olson Pl SW; SW Holly St; 7th Ave SW; W Marginal Way SW; Myers Way S; High Point Dr SW; 27th Ave SW; SW Hudson St; 4th Ave SW; SW Findlay St; SW Charlestown St; 5th Ave SW; SW Edmunds St; Henderson Pl SW; 6th Ave SW; Cycle Ln SW; SW Raymond St; SW Dawson St; SW Austin St; 1st Ave S; SW Alaska St; SW Dakota St; SW Nevada St; Croft Pl SW; SW Morgan St; Dumar Way SW; S 100th St; SW Lanham Way; 2nd Ave SW; Puget Blvd SW; 3rd Ave SW; Macarthur Ct SW; SW Barton Pl; Kelsey Ln SW; 31st Pl SW; SW Adams St; SW Kenny St; Highland Park Way SW; 26th Pl SW; Bataan Pl SW; SW 100th St; SW Snow Ct; SW Portland St; SW Willow St; Marginal Pl SW; Shinkle Pl SW; SW Sullivan St; SW Austin Pl; 7th Pl SW; SW Yancy St; Holden Pl SW; Cottage Pl SW; SW Donovan St; SW Portland Ct; S 99th St; Elmgrove St SW; SW Chicago Ct; 4th Ave S; SW Roxbury Pl; SW Oregon St; Westwood Village Mall SW; Westwood Village Ct SW; Westwood Village Pl SW; 2nd Ave S; Olson-Myers Way P&R Acrd; 1st Pl S; Occidental Ave S; S Myrtle St; SW Marginal Pl.
Railroad features: Burlington Northern Santa Fe Rlwy.
Delridge neighborhood detailed profile
Downtown neighborhood in Seattle statistics: (Find on map)
Area: 1.930 square miles
Population: 39,717
Population density:
Median household income in 2021:
Median rent in in 2021:
Male vs Females
Median age
Housing prices:
Average estimated value of detached houses in 2021 (3.7% of all units):
Average estimated '21 value of housing units in 5-or-more-unit structures (71.4% of all units):
Most popular occupations of males: computer and mathematical occupations (26.3%); service occupations (13.6%); management occupations (except farmers) (12.1%); sales and office occupations (10.2%); business and financial operations occupations (7.7%); architecture and engineering occupations (5.7%); healthcare practitioners and technical occupations (4.1%)
Most popular occupations of females: sales and office occupations (18.4%); management occupations (except farmers) (15.0%); service occupations (14.0%); computer and mathematical occupations (12.8%); business and financial operations occupations (8.2%); healthcare practitioners and technical occupations (6.2%); education, training, and library occupations (5.1%)
Limited-access highways (interstate or state) in this neighborhood: I- 5; I- 90.
Highways in this neighborhood: State Rte 99 (Alaska Fwy, Alaskan Way Viaduct); State Rte 99 (Battery Street Tunl).
Roads and streets: Western Ave; Denny Way; 2nd Ave; 1st Ave; 3rd Ave; 5th Ave (Monorail); 4th Ave; 6th Ave; 8th Ave; 9th Ave; 7th Ave; Boren Ave; Terry Ave; Seneca St; S King St; Spring St; Madison St; S Jackson St; Marion St; S Main St; Columbia St; University St; Yesler Way; Stewart St; Cherry St; James St; S Washington St; Elliott Ave; Minor Ave; Virginia St; Union St; Pine St; Pike St; S Weller St; Lenora St; Broadway Ave; S Dearborn St; 12th Ave; Olive Way; Bell St; 4th Ave S; Blanchard St; E Union St; S Lane St; 1st Ave S; Occidental Ave S; Battery St; Westlake Ave; Wall St; Vine St; Jefferson St; E Pike St; 11th Ave; Cedar St; 10th Ave; Summit Ave; Howell St; 12th Ave S; 6th Ave S; Clay St; Boylston Ave; 5th Ave S; Broad St; Post Ave; 2nd Avenue Extended S; E Madison St; 7th Ave S; Maynard Ave S; 8th Ave S; Hubbell Pl; E Jefferson St; E Terrace St; E Yesler Way; Alder St; 2nd Ave S; E Alder St; E Fir St; E Spruce St; Terrace St; E James St (E James Way); Spu Campus Walk; Pike Pl; Harvard Ave; S Railroad Way; Post Aly; 10th Ave S; Bay St; News Ln; Weller St Walk; 3rd Ave S; E Cherry St; E Columbia St; Eagle St; Convention Pl; Yale Ave; Prefontaine Pl S; E Seneca St; Spruce St; Broadway Ct; Canton Aly S; Boren Ave S; Bellevue Ave; Belmont Ave; Crawford Pl; Battery St W; Fairview Ave; Rainier Ave; Dearborn Pl S; Court Pl; Times Ct; Dexter Ave; Maynard Aly S; Corwin Pl S; Dilling Way; E Spring St; Warren Pl; Taylor Ave; E Denny Way; Eastlake Ave; Railroad Way S; Lenora Street Walk; Cobb Aly; Madison Ct.
Railroad features: Burlington Northern Santa Fe Rlwy; Amtrak (Burlington Northern Santa Fe Rlwy).
Downtown neighborhood detailed profile
Area: 1.930 square miles
Population: 39,717
Population density:
| Downtown: | 20,582 people per square mile |
| Seattle: | 8,750 people per square mile |
Median household income in 2021:
| Downtown: | $72,402 |
| Seattle: | $110,781 |
Median rent in in 2021:
| Downtown: | $1,459 |
| Seattle: | $1,670 |
Male vs Females
| Males: | 23,018 |
| Females: | 16,698 |
Median age
| Males: | 34.3 years |
| Females: | 39.6 years |
Housing prices:
Average estimated value of detached houses in 2021 (3.7% of all units):
| Downtown: | $753,906 |
| Seattle: | $906,138 |
Average estimated '21 value of housing units in 5-or-more-unit structures (71.4% of all units):
| Downtown: | $445,423 |
| Seattle: | $570,782 |
Most popular occupations of males: computer and mathematical occupations (26.3%); service occupations (13.6%); management occupations (except farmers) (12.1%); sales and office occupations (10.2%); business and financial operations occupations (7.7%); architecture and engineering occupations (5.7%); healthcare practitioners and technical occupations (4.1%)
Most popular occupations of females: sales and office occupations (18.4%); management occupations (except farmers) (15.0%); service occupations (14.0%); computer and mathematical occupations (12.8%); business and financial operations occupations (8.2%); healthcare practitioners and technical occupations (6.2%); education, training, and library occupations (5.1%)
Limited-access highways (interstate or state) in this neighborhood: I- 5; I- 90.
Highways in this neighborhood: State Rte 99 (Alaska Fwy, Alaskan Way Viaduct); State Rte 99 (Battery Street Tunl).
Roads and streets: Western Ave; Denny Way; 2nd Ave; 1st Ave; 3rd Ave; 5th Ave (Monorail); 4th Ave; 6th Ave; 8th Ave; 9th Ave; 7th Ave; Boren Ave; Terry Ave; Seneca St; S King St; Spring St; Madison St; S Jackson St; Marion St; S Main St; Columbia St; University St; Yesler Way; Stewart St; Cherry St; James St; S Washington St; Elliott Ave; Minor Ave; Virginia St; Union St; Pine St; Pike St; S Weller St; Lenora St; Broadway Ave; S Dearborn St; 12th Ave; Olive Way; Bell St; 4th Ave S; Blanchard St; E Union St; S Lane St; 1st Ave S; Occidental Ave S; Battery St; Westlake Ave; Wall St; Vine St; Jefferson St; E Pike St; 11th Ave; Cedar St; 10th Ave; Summit Ave; Howell St; 12th Ave S; 6th Ave S; Clay St; Boylston Ave; 5th Ave S; Broad St; Post Ave; 2nd Avenue Extended S; E Madison St; 7th Ave S; Maynard Ave S; 8th Ave S; Hubbell Pl; E Jefferson St; E Terrace St; E Yesler Way; Alder St; 2nd Ave S; E Alder St; E Fir St; E Spruce St; Terrace St; E James St (E James Way); Spu Campus Walk; Pike Pl; Harvard Ave; S Railroad Way; Post Aly; 10th Ave S; Bay St; News Ln; Weller St Walk; 3rd Ave S; E Cherry St; E Columbia St; Eagle St; Convention Pl; Yale Ave; Prefontaine Pl S; E Seneca St; Spruce St; Broadway Ct; Canton Aly S; Boren Ave S; Bellevue Ave; Belmont Ave; Crawford Pl; Battery St W; Fairview Ave; Rainier Ave; Dearborn Pl S; Court Pl; Times Ct; Dexter Ave; Maynard Aly S; Corwin Pl S; Dilling Way; E Spring St; Warren Pl; Taylor Ave; E Denny Way; Eastlake Ave; Railroad Way S; Lenora Street Walk; Cobb Aly; Madison Ct.
Railroad features: Burlington Northern Santa Fe Rlwy; Amtrak (Burlington Northern Santa Fe Rlwy).
Downtown neighborhood detailed profile
Dunlap neighborhood in Seattle statistics: (Find on map)
Area: 0.708 square miles
Population: 6,059
Population density:
Median household income in 2021:
Median rent in in 2021:
Male vs Females
Median age
Average estimated value of detached houses in 2021 (86.2% of all units):
Most popular occupations of males: service occupations (40.8%); sales and office occupations (28.2%); material moving occupations (4.8%); production occupations (4.7%); business and financial operations occupations (3.7%); architecture and engineering occupations (3.2%); construction, extraction, and maintenance occupations (3.1%)
Most popular occupations of females: sales and office occupations (39.5%); service occupations (26.2%); transportation occupations (10.9%); business and financial operations occupations (5.0%); arts, design, entertainment, sports, and media occupations (4.7%); production occupations (4.2%); education, training, and library occupations (3.2%)
Roads and streets: S Cloverdale St; S Henderson St; Renton Ave S; Rainier Ave; S Rose St; Martin Luther King Way S; S Kenyon St; Seward Park Ave S; 46th Ave S; S Thistle St; Wabash Ave S; 50th Ave S; 48th Ave S; S Director St; Island Dr S; 45th Ave S; 44th Ave S; S Fisher Pl; 47th Ave S; Beacon Ave S; S Trenton St; 52nd Ave S; Grattan Pl S; 49th Ave S; 55th Ave S; 53rd Ave S; Valdez Ave S; Spear Pl S; 54th Ave S; Wolcott Ave S; S Elmgrove St; S Grattan St; S Seward Park Ave; Hamlet Ave S; Duncan Ave S; S Camano Pl; S Barton St; Park Dr S; 44th Pl S; S Budd Ct; Rainier Pl S; S Rose Ct; S Lake Dell Ln; Barton Pl S; S Fletcher St; Yukon Ave S; 42nd Pl S; 43rd Ave S; 51st Ave S.
Dunlap neighborhood detailed profile
Area: 0.708 square miles
Population: 6,059
Population density:
| Dunlap: | 8,557 people per square mile |
| Seattle: | 8,750 people per square mile |
Median household income in 2021:
| Dunlap: | $83,899 |
| Seattle: | $110,781 |
Median rent in in 2021:
| Dunlap: | $1,480 |
| Seattle: | $1,670 |
Male vs Females
| Males: | 3,180 |
| Females: | 2,878 |
Median age
| Males: | 37.7 years |
| Females: | 46.0 years |
Average estimated value of detached houses in 2021 (86.2% of all units):
| Dunlap: | $551,588 |
| Seattle: | $906,138 |
Most popular occupations of males: service occupations (40.8%); sales and office occupations (28.2%); material moving occupations (4.8%); production occupations (4.7%); business and financial operations occupations (3.7%); architecture and engineering occupations (3.2%); construction, extraction, and maintenance occupations (3.1%)
Most popular occupations of females: sales and office occupations (39.5%); service occupations (26.2%); transportation occupations (10.9%); business and financial operations occupations (5.0%); arts, design, entertainment, sports, and media occupations (4.7%); production occupations (4.2%); education, training, and library occupations (3.2%)
Roads and streets: S Cloverdale St; S Henderson St; Renton Ave S; Rainier Ave; S Rose St; Martin Luther King Way S; S Kenyon St; Seward Park Ave S; 46th Ave S; S Thistle St; Wabash Ave S; 50th Ave S; 48th Ave S; S Director St; Island Dr S; 45th Ave S; 44th Ave S; S Fisher Pl; 47th Ave S; Beacon Ave S; S Trenton St; 52nd Ave S; Grattan Pl S; 49th Ave S; 55th Ave S; 53rd Ave S; Valdez Ave S; Spear Pl S; 54th Ave S; Wolcott Ave S; S Elmgrove St; S Grattan St; S Seward Park Ave; Hamlet Ave S; Duncan Ave S; S Camano Pl; S Barton St; Park Dr S; 44th Pl S; S Budd Ct; Rainier Pl S; S Rose Ct; S Lake Dell Ln; Barton Pl S; S Fletcher St; Yukon Ave S; 42nd Pl S; 43rd Ave S; 51st Ave S.
Dunlap neighborhood detailed profile
Duwamish neighborhood in Seattle statistics: (Find on map)
Area: 1.066 square miles
Population: 1,874
Population density:
Median household income in 2021:
Median rent in in 2021:
Male vs Females
Median age
Housing prices:
Average estimated value of detached houses in 2021 (51.1% of all units):
Average estimated '21 value of housing units in 5-or-more-unit structures (12.2% of all units):
Most popular occupations of males: service occupations (19.8%); sales and office occupations (11.8%); production occupations (11.8%); construction, extraction, and maintenance occupations (11.0%); transportation occupations (8.4%); computer and mathematical occupations (6.0%); material moving occupations (4.3%)
Most popular occupations of females: service occupations (30.7%); sales and office occupations (21.8%); material moving occupations (13.1%); management occupations (except farmers) (6.3%); production occupations (6.2%); healthcare practitioners and technical occupations (5.3%); education, training, and library occupations (4.3%)
Limited-access highways (interstate or state) in this neighborhood: I- 5.
Highways in this neighborhood: W Marginal Way S (State Rte 99); State Rte 900 (Martin Luther King Way S).
Roads and streets: S 112th St; E Marginal Way S; Des Moines Way S (Des Moines Memorial Dr); Tukwila International Blvd (Pacific Hwy S); S 102nd St; Roseberg Ave S; S 115th St; W Marginal Pl S; 26th Ave S; Airport Way S; S Norfolk St; S 116th St; S 116th Way; 24th Ave S; S 104th St; 22nd Pl S; Military Rd S; S 114th St; S 111th Pl; S 113th St; S 110th St; 30th Ave S; 27th Ave; 40th Ave S; S 103rd St; 102nd St; 42nd Ave S; 41st Ave S; Pacific Hwy Brg (Tukwila International Blvd); Tukwila Intl Blvd.
Railroad features: Burlington Northern Santa Fe Rlwy (Union Pacific RR).
Other features: Duwamish Riv.
Duwamish neighborhood detailed profile
Area: 1.066 square miles
Population: 1,874
Population density:
| Duwamish: | 1,758 people per square mile |
| Seattle: | 8,750 people per square mile |
Median household income in 2021:
| Duwamish: | $64,925 |
| Seattle: | $110,781 |
Median rent in in 2021:
| Duwamish: | $1,464 |
| Seattle: | $1,670 |
Male vs Females
| Males: | 1,020 |
| Females: | 854 |
Median age
| Males: | 39.8 years |
| Females: | 39.9 years |
Housing prices:
Average estimated value of detached houses in 2021 (51.1% of all units):
| Duwamish: | $453,032 |
| Seattle: | $906,138 |
Average estimated '21 value of housing units in 5-or-more-unit structures (12.2% of all units):
| Duwamish: | $136,406 |
| Seattle: | $570,782 |
Most popular occupations of males: service occupations (19.8%); sales and office occupations (11.8%); production occupations (11.8%); construction, extraction, and maintenance occupations (11.0%); transportation occupations (8.4%); computer and mathematical occupations (6.0%); material moving occupations (4.3%)
Most popular occupations of females: service occupations (30.7%); sales and office occupations (21.8%); material moving occupations (13.1%); management occupations (except farmers) (6.3%); production occupations (6.2%); healthcare practitioners and technical occupations (5.3%); education, training, and library occupations (4.3%)
Limited-access highways (interstate or state) in this neighborhood: I- 5.
Highways in this neighborhood: W Marginal Way S (State Rte 99); State Rte 900 (Martin Luther King Way S).
Roads and streets: S 112th St; E Marginal Way S; Des Moines Way S (Des Moines Memorial Dr); Tukwila International Blvd (Pacific Hwy S); S 102nd St; Roseberg Ave S; S 115th St; W Marginal Pl S; 26th Ave S; Airport Way S; S Norfolk St; S 116th St; S 116th Way; 24th Ave S; S 104th St; 22nd Pl S; Military Rd S; S 114th St; S 111th Pl; S 113th St; S 110th St; 30th Ave S; 27th Ave; 40th Ave S; S 103rd St; 102nd St; 42nd Ave S; 41st Ave S; Pacific Hwy Brg (Tukwila International Blvd); Tukwila Intl Blvd.
Railroad features: Burlington Northern Santa Fe Rlwy (Union Pacific RR).
Other features: Duwamish Riv.
Duwamish neighborhood detailed profile
East Queen Anne neighborhood in Seattle statistics: (Find on map)
Area: 0.654 square miles
Population: 10,566
Population density:
Median household income in 2021:
Median rent in in 2021:
Male vs Females
Median age
Average estimated value of detached houses in 2021 (40.8% of all units):
Most popular occupations of males: management occupations (except farmers) (19.1%); computer and mathematical occupations (13.9%); sales and office occupations (13.9%); business and financial operations occupations (12.2%); architecture and engineering occupations (11.2%); service occupations (10.4%); education, training, and library occupations (5.5%)
Most popular occupations of females: sales and office occupations (17.7%); management occupations (except farmers) (15.0%); service occupations (13.8%); legal occupations (7.9%); arts, design, entertainment, sports, and media occupations (7.7%); business and financial operations occupations (7.6%); computer and mathematical occupations (5.8%)
Highways in this neighborhood: State Rte 99 (Aurora Ave N); Aurora Ave N (Aurora Brg, State Rte 99).
Roads and streets: Bigelow Ave N; Highland Dr; Warren Ave N; Nob Hill Ave N; 1st Ave N; 4th Ave N; 5th Ave N; 2nd Ave N; Prospect St; Lee St; Dexter Ave N; Newton St; McGraw St; Taylor Ave N; Galer St; Garfield St; Crockett St; 3rd Ave N; 6th Ave N; Boston St; Howe St; Lynn St; Hayes St; Blaine St; Wheeler St; Ward St; Halladay St; Dexter Way N; Westlake Ave N; 8th Ave N; Waverly Pl N; Queen Anne Dr; Smith St; McGraw Pl; Lorentz Pl N; McGraw Street Brg; Comstock St; Orange Pl N; Queen Anne Drive Brg; Birch Ave N; Comstock Pl; Tower Pl; Nob Hill Pl N; Warren Pl; W Prospect St; Galer Pl N; Smith Pl; Taylor Pl N; Raye St.
East Queen Anne neighborhood detailed profile
Area: 0.654 square miles
Population: 10,566
Population density:
| East Queen Anne: | 16,148 people per square mile |
| Seattle: | 8,750 people per square mile |
Median household income in 2021:
| East Queen Anne: | $138,559 |
| Seattle: | $110,781 |
Median rent in in 2021:
| East Queen Anne: | $1,962 |
| Seattle: | $1,670 |
Male vs Females
| Males: | 5,133 |
| Females: | 5,432 |
Median age
| Males: | 36.0 years |
| Females: | 35.8 years |
Average estimated value of detached houses in 2021 (40.8% of all units):
| East Queen Anne: | $1,204,879 |
| Seattle: | $906,138 |
Most popular occupations of males: management occupations (except farmers) (19.1%); computer and mathematical occupations (13.9%); sales and office occupations (13.9%); business and financial operations occupations (12.2%); architecture and engineering occupations (11.2%); service occupations (10.4%); education, training, and library occupations (5.5%)
Most popular occupations of females: sales and office occupations (17.7%); management occupations (except farmers) (15.0%); service occupations (13.8%); legal occupations (7.9%); arts, design, entertainment, sports, and media occupations (7.7%); business and financial operations occupations (7.6%); computer and mathematical occupations (5.8%)
Highways in this neighborhood: State Rte 99 (Aurora Ave N); Aurora Ave N (Aurora Brg, State Rte 99).
Roads and streets: Bigelow Ave N; Highland Dr; Warren Ave N; Nob Hill Ave N; 1st Ave N; 4th Ave N; 5th Ave N; 2nd Ave N; Prospect St; Lee St; Dexter Ave N; Newton St; McGraw St; Taylor Ave N; Galer St; Garfield St; Crockett St; 3rd Ave N; 6th Ave N; Boston St; Howe St; Lynn St; Hayes St; Blaine St; Wheeler St; Ward St; Halladay St; Dexter Way N; Westlake Ave N; 8th Ave N; Waverly Pl N; Queen Anne Dr; Smith St; McGraw Pl; Lorentz Pl N; McGraw Street Brg; Comstock St; Orange Pl N; Queen Anne Drive Brg; Birch Ave N; Comstock Pl; Tower Pl; Nob Hill Pl N; Warren Pl; W Prospect St; Galer Pl N; Smith Pl; Taylor Pl N; Raye St.
East Queen Anne neighborhood detailed profile
Eastlake neighborhood in Seattle statistics: (Find on map)
Area: 0.331 square miles
Population: 2,568
Population density:
Median household income in 2021:
Median rent in in 2021:
Male vs Females
Median age
Most popular occupations of males: computer and mathematical occupations (17.8%); management occupations (except farmers) (15.5%); business and financial operations occupations (10.2%); architecture and engineering occupations (8.0%); arts, design, entertainment, sports, and media occupations (7.6%); education, training, and library occupations (7.5%); sales and office occupations (7.4%)
Most popular occupations of females: sales and office occupations (19.5%); healthcare practitioners and technical occupations (17.0%); management occupations (except farmers) (15.8%); education, training, and library occupations (12.3%); business and financial operations occupations (9.6%); service occupations (7.0%); legal occupations (5.0%)
Limited-access highways (interstate or state) in this neighborhood: I- 5.
Roads and streets: Eastlake Ave E; Fairview Ave E; Franklin Ave E; Boylston Ave E; Yale Ave E; Minor Ave E; E Lynn St; E Boston St; E Roanoke St; E Newton St; E Louisa St; E Hamlin St; E Edgar St; E Allison St; Yale Ter E; E Howe St; Franklin Pl E; Yale Pl E; Fuhrman Ave E; University Brg; Lakeview Blvd E; Portage Bay Pl E; Red Ave E; Harvard Ave E; E Shelby St.
Eastlake neighborhood detailed profile
Area: 0.331 square miles
Population: 2,568
Population density:
| Eastlake: | 7,761 people per square mile |
| Seattle: | 8,750 people per square mile |
Median household income in 2021:
| Eastlake: | $126,436 |
| Seattle: | $110,781 |
Median rent in in 2021:
| Eastlake: | $1,835 |
| Seattle: | $1,670 |
Male vs Females
| Males: | 1,185 |
| Females: | 1,383 |
Median age
| Males: | 33.4 years |
| Females: | 33.6 years |
Most popular occupations of males: computer and mathematical occupations (17.8%); management occupations (except farmers) (15.5%); business and financial operations occupations (10.2%); architecture and engineering occupations (8.0%); arts, design, entertainment, sports, and media occupations (7.6%); education, training, and library occupations (7.5%); sales and office occupations (7.4%)
Most popular occupations of females: sales and office occupations (19.5%); healthcare practitioners and technical occupations (17.0%); management occupations (except farmers) (15.8%); education, training, and library occupations (12.3%); business and financial operations occupations (9.6%); service occupations (7.0%); legal occupations (5.0%)
Limited-access highways (interstate or state) in this neighborhood: I- 5.
Roads and streets: Eastlake Ave E; Fairview Ave E; Franklin Ave E; Boylston Ave E; Yale Ave E; Minor Ave E; E Lynn St; E Boston St; E Roanoke St; E Newton St; E Louisa St; E Hamlin St; E Edgar St; E Allison St; Yale Ter E; E Howe St; Franklin Pl E; Yale Pl E; Fuhrman Ave E; University Brg; Lakeview Blvd E; Portage Bay Pl E; Red Ave E; Harvard Ave E; E Shelby St.
Eastlake neighborhood detailed profile
Fairmount Park neighborhood in Seattle statistics: (Find on map)
Area: 0.503 square miles
Population: 2,726
Population density:
Median household income in 2021:
Median rent in in 2021:
Male vs Females
Median age
Average estimated value of detached houses in 2021 (64.3% of all units):
Most popular occupations of males: computer and mathematical occupations (18.5%); service occupations (17.7%); business and financial operations occupations (12.8%); production occupations (8.5%); material moving occupations (7.5%); management occupations (except farmers) (7.3%); legal occupations (7.2%)
Most popular occupations of females: sales and office occupations (30.8%); business and financial operations occupations (22.5%); service occupations (12.3%); management occupations (except farmers) (10.4%); education, training, and library occupations (5.5%); healthcare practitioners and technical occupations (5.3%); computer and mathematical occupations (4.4%)
Roads and streets: 38th Ave SW; 35th Ave SW; 37th Ave SW; 36th Ave SW; Fauntleroy Way SW; 40th Ave SW; SW Juneau St; SW Hudson St; 41st Ave SW; 42nd Ave SW; SW Avalon Way; SW Findlay St; SW Raymond St; SW Dawson St; SW Brandon St; SW Edmunds St; SW Alaska St; 32nd Ave SW; 39th Ave SW; SW Snoqualmie St; SW Oregon St; SW Bradford St; SW Andover St; SW Genesee St; 30th Ave SW.
Fairmount Park neighborhood detailed profile
Area: 0.503 square miles
Population: 2,726
Population density:
| Fairmount Park: | 5,418 people per square mile |
| Seattle: | 8,750 people per square mile |
Median household income in 2021:
| Fairmount Park: | $116,379 |
| Seattle: | $110,781 |
Median rent in in 2021:
| Fairmount Park: | $1,627 |
| Seattle: | $1,670 |
Male vs Females
| Males: | 1,158 |
| Females: | 1,567 |
Median age
| Males: | 40.6 years |
| Females: | 39.7 years |
Average estimated value of detached houses in 2021 (64.3% of all units):
| Fairmount Park: | $766,741 |
| Seattle: | $906,138 |
Most popular occupations of males: computer and mathematical occupations (18.5%); service occupations (17.7%); business and financial operations occupations (12.8%); production occupations (8.5%); material moving occupations (7.5%); management occupations (except farmers) (7.3%); legal occupations (7.2%)
Most popular occupations of females: sales and office occupations (30.8%); business and financial operations occupations (22.5%); service occupations (12.3%); management occupations (except farmers) (10.4%); education, training, and library occupations (5.5%); healthcare practitioners and technical occupations (5.3%); computer and mathematical occupations (4.4%)
Roads and streets: 38th Ave SW; 35th Ave SW; 37th Ave SW; 36th Ave SW; Fauntleroy Way SW; 40th Ave SW; SW Juneau St; SW Hudson St; 41st Ave SW; 42nd Ave SW; SW Avalon Way; SW Findlay St; SW Raymond St; SW Dawson St; SW Brandon St; SW Edmunds St; SW Alaska St; 32nd Ave SW; 39th Ave SW; SW Snoqualmie St; SW Oregon St; SW Bradford St; SW Andover St; SW Genesee St; 30th Ave SW.
Fairmount Park neighborhood detailed profile
Fauntleroy neighborhood in Seattle statistics: (Find on map)
Area: 1.491 square miles
Population: 2,093
Population density:
Median household income in 2021:
Median rent in in 2021:
Male vs Females
Median age
Average estimated value of detached houses in 2021 (84.8% of all units):
Most popular occupations of males: management occupations (except farmers) (25.0%); sales and office occupations (20.6%); service occupations (13.0%); computer and mathematical occupations (9.2%); arts, design, entertainment, sports, and media occupations (7.9%); business and financial operations occupations (7.6%); architecture and engineering occupations (6.2%)
Most popular occupations of females: business and financial operations occupations (23.7%); sales and office occupations (20.2%); education, training, and library occupations (11.1%); healthcare practitioners and technical occupations (8.1%); service occupations (7.3%); management occupations (except farmers) (5.4%); computer and mathematical occupations (5.2%)
Roads and streets: Fauntleroy Way SW; 47th Ave SW; 44th Ave SW; 45th Ave SW; 46th Ave SW; California Ave SW; SW Henderson St; SW Barton St; SW Trenton St; SW Cloverdale St; 35th Ave SW; 37th Ave SW; 39th Ave SW; Marine View Dr SW; SW Roxbury St; 36th Ave SW; SW Donovan St; SW Othello St; SW Concord St; SW Brace Point Dr; SW Director St; 42nd Ave SW; SW Cambridge St; SW 97th St; Fauntleroy Pl SW; 50th Ave SW; 38th Ave SW; SW 109th St; Fauntlee Crst SW; Tillicum Rd SW; SW Wildwood Pl; 41st Ave SW; SW Sullivan St; 51st Ave SW; Maplewood Pl SW; SW Fletcher St; 40th Ave SW; SW Myrtle St; SW 98th St; SW Fontanelle St; Beach Dr SW; SW Austin St; SW Rose St; Lincoln Park Way SW; SW Tillman St; SW Thistle St; Forest Ct SW; SW Kenyon Pl; SW Webster St; Northrop Pl SW; Farwell Pl SW; California Dr SW; Arroyo Ct SW; Wright Ave SW; Ledroit Ct SW; SW Kenyon St; Vashon View Pl SW; 43rd Pl SW; SW Southern St; 48th Ave SW; SW Portland St; Kilbourne Ct SW; SW Hemlock Way; SW Bernice Pl; Vashon Vw SW; SW Monroe St; Vashon Pl SW; Blake Pl SW; SW Ledroit Pl; Sylvan Ln SW; 44th Pl SW; 49th Ave SW; Bainbridge Pl SW; SW Director Pl; Fauntlee Cres SW; Woodside Pl SW; Marine View Dr; 46th Pl SW; View Ln SW.
Other features: Ferry Dock; Seattle-Vashon-Southworth Ferry Crossing.
Fauntleroy neighborhood detailed profile
Area: 1.491 square miles
Population: 2,093
Population density:
| Fauntleroy: | 1,404 people per square mile |
| Seattle: | 8,750 people per square mile |
Median household income in 2021:
| Fauntleroy: | $136,426 |
| Seattle: | $110,781 |
Median rent in in 2021:
| Fauntleroy: | $1,597 |
| Seattle: | $1,670 |
Male vs Females
| Males: | 1,008 |
| Females: | 1,084 |
Median age
| Males: | 43.9 years |
| Females: | 47.4 years |
Average estimated value of detached houses in 2021 (84.8% of all units):
| Fauntleroy: | $627,911 |
| Seattle: | $906,138 |
Most popular occupations of males: management occupations (except farmers) (25.0%); sales and office occupations (20.6%); service occupations (13.0%); computer and mathematical occupations (9.2%); arts, design, entertainment, sports, and media occupations (7.9%); business and financial operations occupations (7.6%); architecture and engineering occupations (6.2%)
Most popular occupations of females: business and financial operations occupations (23.7%); sales and office occupations (20.2%); education, training, and library occupations (11.1%); healthcare practitioners and technical occupations (8.1%); service occupations (7.3%); management occupations (except farmers) (5.4%); computer and mathematical occupations (5.2%)
Roads and streets: Fauntleroy Way SW; 47th Ave SW; 44th Ave SW; 45th Ave SW; 46th Ave SW; California Ave SW; SW Henderson St; SW Barton St; SW Trenton St; SW Cloverdale St; 35th Ave SW; 37th Ave SW; 39th Ave SW; Marine View Dr SW; SW Roxbury St; 36th Ave SW; SW Donovan St; SW Othello St; SW Concord St; SW Brace Point Dr; SW Director St; 42nd Ave SW; SW Cambridge St; SW 97th St; Fauntleroy Pl SW; 50th Ave SW; 38th Ave SW; SW 109th St; Fauntlee Crst SW; Tillicum Rd SW; SW Wildwood Pl; 41st Ave SW; SW Sullivan St; 51st Ave SW; Maplewood Pl SW; SW Fletcher St; 40th Ave SW; SW Myrtle St; SW 98th St; SW Fontanelle St; Beach Dr SW; SW Austin St; SW Rose St; Lincoln Park Way SW; SW Tillman St; SW Thistle St; Forest Ct SW; SW Kenyon Pl; SW Webster St; Northrop Pl SW; Farwell Pl SW; California Dr SW; Arroyo Ct SW; Wright Ave SW; Ledroit Ct SW; SW Kenyon St; Vashon View Pl SW; 43rd Pl SW; SW Southern St; 48th Ave SW; SW Portland St; Kilbourne Ct SW; SW Hemlock Way; SW Bernice Pl; Vashon Vw SW; SW Monroe St; Vashon Pl SW; Blake Pl SW; SW Ledroit Pl; Sylvan Ln SW; 44th Pl SW; 49th Ave SW; Bainbridge Pl SW; SW Director Pl; Fauntlee Cres SW; Woodside Pl SW; Marine View Dr; 46th Pl SW; View Ln SW.
Other features: Ferry Dock; Seattle-Vashon-Southworth Ferry Crossing.
Fauntleroy neighborhood detailed profile
First Hill neighborhood in Seattle statistics: (Find on map)
Area: 0.334 square miles
Population: 10,799
Population density:
Median household income in 2021:
Median rent in in 2021:
Male vs Females
Median age
Average estimated '21 value of housing units in 5-or-more-unit structures (73.4% of all units):
Most popular occupations of males: computer and mathematical occupations (31.9%); service occupations (13.4%); management occupations (except farmers) (13.2%); sales and office occupations (8.9%); business and financial operations occupations (5.8%); architecture and engineering occupations (4.7%); healthcare practitioners and technical occupations (4.5%)
Most popular occupations of females: sales and office occupations (19.8%); management occupations (except farmers) (16.0%); computer and mathematical occupations (13.5%); service occupations (8.9%); healthcare practitioners and technical occupations (7.9%); business and financial operations occupations (7.0%); production occupations (5.9%)
Roads and streets: Seneca St; E Union St; Madison St; Spring St; Minor Ave; Marion St; Boren Ave; E Pike St; Cherry St; Terry Ave; Broadway Ave; 9th Ave; 8th Ave; Summit Ave; University St; 12th Ave; Columbia St; Boylston Ave; 7th Ave; E Madison St; Hubbell Pl; Union St; Spu Campus Walk; Harvard Ave; Pike St; E Columbia St; 10th Ave; E James St (E James Way); E Seneca St; Broadway Ct; 11th Ave; E Cherry St; Bellevue Ave; Belmont Ave; Crawford Pl; E Spring St; James St; Madison Ct.
First Hill neighborhood detailed profile
Area: 0.334 square miles
Population: 10,799
Population density:
| First Hill: | 32,351 people per square mile |
| Seattle: | 8,750 people per square mile |
Median household income in 2021:
| First Hill: | $84,056 |
| Seattle: | $110,781 |
Median rent in in 2021:
| First Hill: | $1,719 |
| Seattle: | $1,670 |
Male vs Females
| Males: | 6,246 |
| Females: | 4,552 |
Median age
| Males: | 31.8 years |
| Females: | 37.6 years |
Average estimated '21 value of housing units in 5-or-more-unit structures (73.4% of all units):
| First Hill: | $474,022 |
| Seattle: | $570,782 |
Most popular occupations of males: computer and mathematical occupations (31.9%); service occupations (13.4%); management occupations (except farmers) (13.2%); sales and office occupations (8.9%); business and financial operations occupations (5.8%); architecture and engineering occupations (4.7%); healthcare practitioners and technical occupations (4.5%)
Most popular occupations of females: sales and office occupations (19.8%); management occupations (except farmers) (16.0%); computer and mathematical occupations (13.5%); service occupations (8.9%); healthcare practitioners and technical occupations (7.9%); business and financial operations occupations (7.0%); production occupations (5.9%)
Roads and streets: Seneca St; E Union St; Madison St; Spring St; Minor Ave; Marion St; Boren Ave; E Pike St; Cherry St; Terry Ave; Broadway Ave; 9th Ave; 8th Ave; Summit Ave; University St; 12th Ave; Columbia St; Boylston Ave; 7th Ave; E Madison St; Hubbell Pl; Union St; Spu Campus Walk; Harvard Ave; Pike St; E Columbia St; 10th Ave; E James St (E James Way); E Seneca St; Broadway Ct; 11th Ave; E Cherry St; Bellevue Ave; Belmont Ave; Crawford Pl; E Spring St; James St; Madison Ct.
First Hill neighborhood detailed profile
Foster neighborhood in Seattle statistics: (Find on map)
Area: 4.381 square miles
Population: 20,987
Population density:
Median household income in 2021:
Median rent in in 2021:
Male vs Females
Median age
Housing prices:
Average estimated value of detached houses in 2021 (57.5% of all units):
Average estimated value of townhouses or other attached units in 2021 (3.7% of all units):
Average estimated '21 value of housing units in 5-or-more-unit structures (11.7% of all units):
Most popular occupations of males: service occupations (18.0%); construction, extraction, and maintenance occupations (14.5%); sales and office occupations (14.1%); transportation occupations (11.9%); production occupations (9.5%); material moving occupations (7.6%); management occupations (except farmers) (6.8%)
Most popular occupations of females: sales and office occupations (27.4%); service occupations (27.3%); education, training, and library occupations (8.6%); management occupations (except farmers) (8.0%); material moving occupations (5.8%); business and financial operations occupations (5.1%); production occupations (5.0%)
Limited-access highways (interstate or state) in this neighborhood: I- 5.
Highways in this neighborhood: State Rte 518; State Rte 509; State Rte 99; State Rte 599; State Rte 99 (Pacific Hwy S, International Blvd).
Roads and streets: S 146th St; S 144th St; S 140th St; S 148th St; S 150th St; S 136th St; S 128th St; S 138th St; S 133rd St; Military Rd S; 24th Ave S; S 132nd St; S 142nd St; S 152nd St; Des Moines Memorial Dr (Des Moines Way S); 42nd Ave S; Macadam Rd S; S 135th St; S 154th St (Southcenter Blvd); 8th Ave S; S 134th St; Southcenter Blvd; 20th Ave S; S 137th St; 51st Ave S; 34th Ave S; 22nd Ave S; 6th Ave S; S 130th St; 29th Ave S; S 130th Pl; 35th Ave S; 18th Ave S; S 139th St; 37th Ave S; 10th Ave S; 32nd Ave S; S 129th St; 12th Ave S; 26th Ave S; S 131st St (S 131th Pl); 28th Ave S; 21st Ave S; 14th Ave S; 46th Ave S; 7th Ave S; 23rd Ave S; S 141st St; 30th Ave S; 28th Ln S; 31st Ave S; 26th Ln S; S 142nd Pl; 33rd Ave S; 16th Ave S; S 145th St; 27th Ave S; 43rd Ave S; S 151st St; 5th Ave S; 4th Ave S; 25th Pl S; S 143rd Pl; 48th Ave S; S 134th Pl; 26th Pl S; 40th Ave S; 19th Ave S; S 147th St; 44th Ave S; 27th Pl S; 25th Ave S; S 147th Pl; 43rd Pl S; S 137th Pl; 29th Ln S; 38th Ave S; 41st Ave S; 45th Ave S; 32nd Pl S; 15th Ave S; 52nd Ave S; 4th Ct S; S 144th Way; 33rd Pl S; 38th Ter S; 38th Ln S; 11th Ave S; 9th Pl S; S 142nd Ln; 48th Pl S; 12th Pl S; 5th Pl S; S 143rd St; S 154th Ln; 16th Pl S; 133rd St; 28th Pl S; 31st Pl S; 30th Pl S; 22nd Ln S; 28th Ct S; 34th Pl S; S 131st Pl; 23rd Pl S; 6th Pl S; 32nd Ln S; Perimeter Rd (Air Cargo Rd); 7th Pl S; 9th Ave S; 27th Ln S; 3rd Ave S; 25th Ct S; S 138th Pl; 39th Ln S; S 129th Pl; 47th Ave S; 41st Pl S; 10th Pl S; 26th Ct S; 37th Pl S; 45th Pl S; 40th Ln S; S 141st Pl; S 149th Pl; 11th Pl S; 13th Pl S; 24th Pl S; 29th Pl S; 53rd Ave S.
Foster neighborhood detailed profile
Area: 4.381 square miles
Population: 20,987
Population density:
| Foster: | 4,790 people per square mile |
| Seattle: | 8,750 people per square mile |
Median household income in 2021:
| Foster: | $73,995 |
| Seattle: | $110,781 |
Median rent in in 2021:
| Foster: | $1,350 |
| Seattle: | $1,670 |
Male vs Females
| Males: | 10,733 |
| Females: | 10,254 |
Median age
| Males: | 37.3 years |
| Females: | 36.1 years |
Housing prices:
Average estimated value of detached houses in 2021 (57.5% of all units):
| Foster: | $386,398 |
| Seattle: | $906,138 |
Average estimated value of townhouses or other attached units in 2021 (3.7% of all units):
| This neighborhood: | $423,810 |
| city: | $615,733 |
Average estimated '21 value of housing units in 5-or-more-unit structures (11.7% of all units):
| Foster: | $184,971 |
| Seattle: | $570,782 |
Most popular occupations of males: service occupations (18.0%); construction, extraction, and maintenance occupations (14.5%); sales and office occupations (14.1%); transportation occupations (11.9%); production occupations (9.5%); material moving occupations (7.6%); management occupations (except farmers) (6.8%)
Most popular occupations of females: sales and office occupations (27.4%); service occupations (27.3%); education, training, and library occupations (8.6%); management occupations (except farmers) (8.0%); material moving occupations (5.8%); business and financial operations occupations (5.1%); production occupations (5.0%)
Limited-access highways (interstate or state) in this neighborhood: I- 5.
Highways in this neighborhood: State Rte 518; State Rte 509; State Rte 99; State Rte 599; State Rte 99 (Pacific Hwy S, International Blvd).
Roads and streets: S 146th St; S 144th St; S 140th St; S 148th St; S 150th St; S 136th St; S 128th St; S 138th St; S 133rd St; Military Rd S; 24th Ave S; S 132nd St; S 142nd St; S 152nd St; Des Moines Memorial Dr (Des Moines Way S); 42nd Ave S; Macadam Rd S; S 135th St; S 154th St (Southcenter Blvd); 8th Ave S; S 134th St; Southcenter Blvd; 20th Ave S; S 137th St; 51st Ave S; 34th Ave S; 22nd Ave S; 6th Ave S; S 130th St; 29th Ave S; S 130th Pl; 35th Ave S; 18th Ave S; S 139th St; 37th Ave S; 10th Ave S; 32nd Ave S; S 129th St; 12th Ave S; 26th Ave S; S 131st St (S 131th Pl); 28th Ave S; 21st Ave S; 14th Ave S; 46th Ave S; 7th Ave S; 23rd Ave S; S 141st St; 30th Ave S; 28th Ln S; 31st Ave S; 26th Ln S; S 142nd Pl; 33rd Ave S; 16th Ave S; S 145th St; 27th Ave S; 43rd Ave S; S 151st St; 5th Ave S; 4th Ave S; 25th Pl S; S 143rd Pl; 48th Ave S; S 134th Pl; 26th Pl S; 40th Ave S; 19th Ave S; S 147th St; 44th Ave S; 27th Pl S; 25th Ave S; S 147th Pl; 43rd Pl S; S 137th Pl; 29th Ln S; 38th Ave S; 41st Ave S; 45th Ave S; 32nd Pl S; 15th Ave S; 52nd Ave S; 4th Ct S; S 144th Way; 33rd Pl S; 38th Ter S; 38th Ln S; 11th Ave S; 9th Pl S; S 142nd Ln; 48th Pl S; 12th Pl S; 5th Pl S; S 143rd St; S 154th Ln; 16th Pl S; 133rd St; 28th Pl S; 31st Pl S; 30th Pl S; 22nd Ln S; 28th Ct S; 34th Pl S; S 131st Pl; 23rd Pl S; 6th Pl S; 32nd Ln S; Perimeter Rd (Air Cargo Rd); 7th Pl S; 9th Ave S; 27th Ln S; 3rd Ave S; 25th Ct S; S 138th Pl; 39th Ln S; S 129th Pl; 47th Ave S; 41st Pl S; 10th Pl S; 26th Ct S; 37th Pl S; 45th Pl S; 40th Ln S; S 141st Pl; S 149th Pl; 11th Pl S; 13th Pl S; 24th Pl S; 29th Pl S; 53rd Ave S.
Foster neighborhood detailed profile
Fremont neighborhood in Seattle statistics: (Find on map)
Area: 0.958 square miles
Population: 11,399
Population density:
Median household income in 2021:
Median rent in in 2021:
Male vs Females
Median age
Average estimated value of detached houses in 2021 (31.6% of all units):
Most popular occupations of males: management occupations (except farmers) (24.8%); computer and mathematical occupations (21.7%); sales and office occupations (13.3%); service occupations (8.5%); architecture and engineering occupations (5.5%); business and financial operations occupations (5.2%); education, training, and library occupations (4.9%)
Most popular occupations of females: management occupations (except farmers) (17.6%); sales and office occupations (15.2%); service occupations (13.5%); healthcare practitioners and technical occupations (11.5%); education, training, and library occupations (10.8%); business and financial operations occupations (9.7%); computer and mathematical occupations (8.5%)
Highways in this neighborhood: State Rte 99 (Aurora Ave N, Aurora Brg).
Roads and streets: Aurora Ave N; Fremont Ave N; N 43rd St; N 36th St; N 35th St; N 42nd St; Evanston Ave N; N 40th St; N 39th St; Linden Ave N; N 45th St; Stone Way N; Phinney Ave N; 1st Ave NW; N 41st St; Woodland Park Ave N; Dayton Ave N; N 38th St; 2nd Ave NW; N 46th St; Whitman Ave N; Greenwood Ave N; Leary Way NW; N 44th St; N 34th St; NW 40th St; NW 43rd St; 3rd Ave NW; Francis Ave N; N Allen Pl; Midvale Ave N; Palatine Ave N; NW 42nd St; NW 44th St; 6th Ave NW; NW 45th St; N 47th St; N 48th St; N 49th St; Winslow Pl N; NW 41st St; Baker Ave NW; NW Bowdoin Pl; Burke Gilman Trl; Bridge Way N; N Bowdoin Pl; N Motor Pl; NW 39th St; Albion Pl N; N 50th St; 5th Ave NW; 4th Ave NW; Fremont Way N; NW 36th St; NW Bright St; NW Market St; N Northlake Way; N Phinney Way; N Market St; NW 47th St; NW 46th St; Fremont Ln N; Fremont Pl N; NW 48th St; Green Lake Way N; N Lucas Pl.
Railroad features: Ballard Terminal RR.
Fremont neighborhood detailed profile
Area: 0.958 square miles
Population: 11,399
Population density:
| Fremont: | 11,897 people per square mile |
| Seattle: | 8,750 people per square mile |
Median household income in 2021:
| Fremont: | $119,022 |
| Seattle: | $110,781 |
Median rent in in 2021:
| Fremont: | $1,750 |
| Seattle: | $1,670 |
Male vs Females
| Males: | 5,210 |
| Females: | 6,189 |
Median age
| Males: | 35.5 years |
| Females: | 34.2 years |
Average estimated value of detached houses in 2021 (31.6% of all units):
| Fremont: | $1,125,687 |
| Seattle: | $906,138 |
Most popular occupations of males: management occupations (except farmers) (24.8%); computer and mathematical occupations (21.7%); sales and office occupations (13.3%); service occupations (8.5%); architecture and engineering occupations (5.5%); business and financial operations occupations (5.2%); education, training, and library occupations (4.9%)
Most popular occupations of females: management occupations (except farmers) (17.6%); sales and office occupations (15.2%); service occupations (13.5%); healthcare practitioners and technical occupations (11.5%); education, training, and library occupations (10.8%); business and financial operations occupations (9.7%); computer and mathematical occupations (8.5%)
Highways in this neighborhood: State Rte 99 (Aurora Ave N, Aurora Brg).
Roads and streets: Aurora Ave N; Fremont Ave N; N 43rd St; N 36th St; N 35th St; N 42nd St; Evanston Ave N; N 40th St; N 39th St; Linden Ave N; N 45th St; Stone Way N; Phinney Ave N; 1st Ave NW; N 41st St; Woodland Park Ave N; Dayton Ave N; N 38th St; 2nd Ave NW; N 46th St; Whitman Ave N; Greenwood Ave N; Leary Way NW; N 44th St; N 34th St; NW 40th St; NW 43rd St; 3rd Ave NW; Francis Ave N; N Allen Pl; Midvale Ave N; Palatine Ave N; NW 42nd St; NW 44th St; 6th Ave NW; NW 45th St; N 47th St; N 48th St; N 49th St; Winslow Pl N; NW 41st St; Baker Ave NW; NW Bowdoin Pl; Burke Gilman Trl; Bridge Way N; N Bowdoin Pl; N Motor Pl; NW 39th St; Albion Pl N; N 50th St; 5th Ave NW; 4th Ave NW; Fremont Way N; NW 36th St; NW Bright St; NW Market St; N Northlake Way; N Phinney Way; N Market St; NW 47th St; NW 46th St; Fremont Ln N; Fremont Pl N; NW 48th St; Green Lake Way N; N Lucas Pl.
Railroad features: Ballard Terminal RR.
Fremont neighborhood detailed profile
Gatewood neighborhood in Seattle statistics: (Find on map)
Area: 0.764 square miles
Population: 18,015
Population density:
Median household income in 2021:
Median rent in in 2021:
Male vs Females
Median age
Most popular occupations of males: management occupations (except farmers) (23.2%); sales and office occupations (13.2%); service occupations (11.8%); business and financial operations occupations (9.8%); arts, design, entertainment, sports, and media occupations (8.5%); education, training, and library occupations (5.9%); computer and mathematical occupations (5.4%)
Most popular occupations of females: sales and office occupations (20.9%); business and financial operations occupations (19.0%); service occupations (17.5%); healthcare practitioners and technical occupations (10.0%); management occupations (except farmers) (9.4%); education, training, and library occupations (6.4%); arts, design, entertainment, sports, and media occupations (3.6%)
Roads and streets: 35th Ave SW; 39th Ave SW; 37th Ave SW; 41st Ave SW; SW Holden St; SW Ida St; 36th Ave SW; SW Othello St; SW Austin St; SW Morgan St; SW Myrtle St; SW Webster St; California Ave SW; 38th Ave SW; SW Graham St; SW Holly St; SW Frontenac St; SW Orchard St; 40th Ave SW; SW Rose St; SW Southern St; SW Elmgrove St; SW Monroe St; SW Kenyon St; SW Willow St; SW Thistle St; Glenridge Way SW; 42nd Ave SW; Fauntleroy Way SW; SW Warsaw St; Gatewood Rd SW; SW Mills St; SW Portland St; Parshall Pl SW; Heights Ave SW; SW Fontanelle St; Heights Pl SW; 39th Ave S.
Gatewood neighborhood detailed profile
Area: 0.764 square miles
Population: 18,015
Population density:
| Gatewood: | 23,567 people per square mile |
| Seattle: | 8,750 people per square mile |
Median household income in 2021:
| Gatewood: | $99,719 |
| Seattle: | $110,781 |
Median rent in in 2021:
| Gatewood: | $1,588 |
| Seattle: | $1,670 |
Male vs Females
| Males: | 8,034 |
| Females: | 9,980 |
Median age
| Males: | 40.8 years |
| Females: | 43.4 years |
Most popular occupations of males: management occupations (except farmers) (23.2%); sales and office occupations (13.2%); service occupations (11.8%); business and financial operations occupations (9.8%); arts, design, entertainment, sports, and media occupations (8.5%); education, training, and library occupations (5.9%); computer and mathematical occupations (5.4%)
Most popular occupations of females: sales and office occupations (20.9%); business and financial operations occupations (19.0%); service occupations (17.5%); healthcare practitioners and technical occupations (10.0%); management occupations (except farmers) (9.4%); education, training, and library occupations (6.4%); arts, design, entertainment, sports, and media occupations (3.6%)
Roads and streets: 35th Ave SW; 39th Ave SW; 37th Ave SW; 41st Ave SW; SW Holden St; SW Ida St; 36th Ave SW; SW Othello St; SW Austin St; SW Morgan St; SW Myrtle St; SW Webster St; California Ave SW; 38th Ave SW; SW Graham St; SW Holly St; SW Frontenac St; SW Orchard St; 40th Ave SW; SW Rose St; SW Southern St; SW Elmgrove St; SW Monroe St; SW Kenyon St; SW Willow St; SW Thistle St; Glenridge Way SW; 42nd Ave SW; Fauntleroy Way SW; SW Warsaw St; Gatewood Rd SW; SW Mills St; SW Portland St; Parshall Pl SW; Heights Ave SW; SW Fontanelle St; Heights Pl SW; 39th Ave S.
Gatewood neighborhood detailed profile
Genesee neighborhood in Seattle statistics: (Find on map)
Area: 0.758 square miles
Population: 8,075
Population density:
Median household income in 2021:
Median rent in in 2021:
Male vs Females
Median age
Housing prices:
Average estimated value of detached houses in 2021 (79.7% of all units):
Average estimated value of townhouses or other attached units in 2021 (5.6% of all units):
Most popular occupations of males: management occupations (except farmers) (31.0%); sales and office occupations (13.5%); computer and mathematical occupations (10.3%); material moving occupations (6.7%); business and financial operations occupations (6.5%); education, training, and library occupations (5.7%); construction, extraction, and maintenance occupations (5.1%)
Most popular occupations of females: management occupations (except farmers) (21.9%); service occupations (13.2%); business and financial operations occupations (11.4%); sales and office occupations (10.2%); education, training, and library occupations (10.1%); community and social services occupations (8.5%); computer and mathematical occupations (5.9%)
Limited-access highways (interstate or state) in this neighborhood: W Seattle Fwy.
Roads and streets: SW Andover St; SW Dakota St; SW Genesee St; SW Oregon St; SW Alaska St; 39th Ave SW; 44th Ave SW; California Ave SW; 42nd Ave SW; 41st Ave SW; Fauntleroy Way SW; 45th Ave SW; 40th Ave SW; SW Charlestown St; 48th Ave SW; 47th Ave SW; 46th Ave SW; 49th Ave SW; 38th Ave SW; 51st Ave SW; 50th Ave SW; SW Bradford St; 37th Ave SW; Glenn Way SW; 36th Ave SW; 35th Ave SW; Belvidere Ave SW; 34th Ave SW; Fauntleroy Ave SW; 35th Ave SE; SW Avalon Way.
Genesee neighborhood detailed profile
Area: 0.758 square miles
Population: 8,075
Population density:
| Genesee: | 10,650 people per square mile |
| Seattle: | 8,750 people per square mile |
Median household income in 2021:
| Genesee: | $136,991 |
| Seattle: | $110,781 |
Median rent in in 2021:
| Genesee: | $2,164 |
| Seattle: | $1,670 |
Male vs Females
| Males: | 4,248 |
| Females: | 3,827 |
Median age
| Males: | 40.3 years |
| Females: | 41.2 years |
Housing prices:
Average estimated value of detached houses in 2021 (79.7% of all units):
| Genesee: | $802,092 |
| Seattle: | $906,138 |
Average estimated value of townhouses or other attached units in 2021 (5.6% of all units):
| This neighborhood: | $592,320 |
| city: | $615,733 |
Most popular occupations of males: management occupations (except farmers) (31.0%); sales and office occupations (13.5%); computer and mathematical occupations (10.3%); material moving occupations (6.7%); business and financial operations occupations (6.5%); education, training, and library occupations (5.7%); construction, extraction, and maintenance occupations (5.1%)
Most popular occupations of females: management occupations (except farmers) (21.9%); service occupations (13.2%); business and financial operations occupations (11.4%); sales and office occupations (10.2%); education, training, and library occupations (10.1%); community and social services occupations (8.5%); computer and mathematical occupations (5.9%)
Limited-access highways (interstate or state) in this neighborhood: W Seattle Fwy.
Roads and streets: SW Andover St; SW Dakota St; SW Genesee St; SW Oregon St; SW Alaska St; 39th Ave SW; 44th Ave SW; California Ave SW; 42nd Ave SW; 41st Ave SW; Fauntleroy Way SW; 45th Ave SW; 40th Ave SW; SW Charlestown St; 48th Ave SW; 47th Ave SW; 46th Ave SW; 49th Ave SW; 38th Ave SW; 51st Ave SW; 50th Ave SW; SW Bradford St; 37th Ave SW; Glenn Way SW; 36th Ave SW; 35th Ave SW; Belvidere Ave SW; 34th Ave SW; Fauntleroy Ave SW; 35th Ave SE; SW Avalon Way.
Genesee neighborhood detailed profile
Georgetown neighborhood in Seattle statistics: (Find on map)
Area: 2.694 square miles
Population: 1,484
Population density:
Median household income in 2021:
Median rent in in 2021:
Male vs Females
Median age
Housing prices:
Average estimated value of detached houses in 2021 (55.2% of all units):
Average estimated value of townhouses or other attached units in 2021 (13.5% of all units):
Most popular occupations of males: architecture and engineering occupations (10.4%); computer and mathematical occupations (10.0%); sales and office occupations (9.6%); service occupations (9.1%); arts, design, entertainment, sports, and media occupations (8.9%); management occupations (except farmers) (8.3%); construction, extraction, and maintenance occupations (8.2%)
Most popular occupations of females: service occupations (28.9%); sales and office occupations (19.4%); management occupations (except farmers) (12.7%); education, training, and library occupations (11.8%); business and financial operations occupations (11.4%); healthcare practitioners and technical occupations (4.0%); community and social services occupations (3.8%)
Highways in this neighborhood: State Rte 99 (1st Avenue S Brg, State Rte 509).
Roads and streets: E Marginal Way S; Perimeter Rd S; S Fidalgo St; S Orcas St; Corson Ave S; S Lucile St; S Findlay St; S Michigan St; S Brandon St; 1st Ave S; 6th Ave S; Perimeter Rd; 4th Ave S; S River St; Ellis Ave S; S Mead St; Flora Ave S; Carleton Ave S; Airport Way S; S Myrtle St; S Front St; S Willow St; S 87th Pl; S Homer St; S Warsaw St; 5th Ave S; 3rd Ave S; 7th Ave S; S Othello St; S Garden St; 14th Ave S; S 104th St; 8th Ave S; S Bailey St; 2nd Ave S; S Albro Pl; Fox Ave S; 10th Ave S; S 96th Pl; Ohio Ave S; S 102nd St; S Vale St; 16th Ave S; S Harney St; S Norfolk St; S Hardy St; S Eddy St; S Nebraska St; S Brighton St; S Doris St; Stanley Ave S; S Webster St; S Orchard St; S 81st Pl; Maynard Ave S; S 94th Pl; S Austin St; 5th Pl S; 12th Ave S; 13th Ave S; Padilla Pl S; S Angelo St; S Carstens Pl; Utah Ave S; S Elizabeth St; 30th Ave S; S 90th St; Occidental Ave S; Pacific Hwy S (Tukwila International Blvd); 15th Ave S; 27th Ave S; S 103rd St.
Railroad features: Burlington Northern Santa Fe Rlwy.
Georgetown neighborhood detailed profile
Area: 2.694 square miles
Population: 1,484
Population density:
| Georgetown: | 551 people per square mile |
| Seattle: | 8,750 people per square mile |
Median household income in 2021:
| Georgetown: | $74,788 |
| Seattle: | $110,781 |
Median rent in in 2021:
| Georgetown: | $1,276 |
| Seattle: | $1,670 |
Male vs Females
| Males: | 825 |
| Females: | 659 |
Median age
| Males: | 44.4 years |
| Females: | 44.1 years |
Housing prices:
Average estimated value of detached houses in 2021 (55.2% of all units):
| Georgetown: | $502,392 |
| Seattle: | $906,138 |
Average estimated value of townhouses or other attached units in 2021 (13.5% of all units):
| This neighborhood: | $607,063 |
| city: | $615,733 |
Most popular occupations of males: architecture and engineering occupations (10.4%); computer and mathematical occupations (10.0%); sales and office occupations (9.6%); service occupations (9.1%); arts, design, entertainment, sports, and media occupations (8.9%); management occupations (except farmers) (8.3%); construction, extraction, and maintenance occupations (8.2%)
Most popular occupations of females: service occupations (28.9%); sales and office occupations (19.4%); management occupations (except farmers) (12.7%); education, training, and library occupations (11.8%); business and financial operations occupations (11.4%); healthcare practitioners and technical occupations (4.0%); community and social services occupations (3.8%)
Highways in this neighborhood: State Rte 99 (1st Avenue S Brg, State Rte 509).
Roads and streets: E Marginal Way S; Perimeter Rd S; S Fidalgo St; S Orcas St; Corson Ave S; S Lucile St; S Findlay St; S Michigan St; S Brandon St; 1st Ave S; 6th Ave S; Perimeter Rd; 4th Ave S; S River St; Ellis Ave S; S Mead St; Flora Ave S; Carleton Ave S; Airport Way S; S Myrtle St; S Front St; S Willow St; S 87th Pl; S Homer St; S Warsaw St; 5th Ave S; 3rd Ave S; 7th Ave S; S Othello St; S Garden St; 14th Ave S; S 104th St; 8th Ave S; S Bailey St; 2nd Ave S; S Albro Pl; Fox Ave S; 10th Ave S; S 96th Pl; Ohio Ave S; S 102nd St; S Vale St; 16th Ave S; S Harney St; S Norfolk St; S Hardy St; S Eddy St; S Nebraska St; S Brighton St; S Doris St; Stanley Ave S; S Webster St; S Orchard St; S 81st Pl; Maynard Ave S; S 94th Pl; S Austin St; 5th Pl S; 12th Ave S; 13th Ave S; Padilla Pl S; S Angelo St; S Carstens Pl; Utah Ave S; S Elizabeth St; 30th Ave S; S 90th St; Occidental Ave S; Pacific Hwy S (Tukwila International Blvd); 15th Ave S; 27th Ave S; S 103rd St.
Railroad features: Burlington Northern Santa Fe Rlwy.
Georgetown neighborhood detailed profile
Green Lake neighborhood in Seattle statistics: (Find on map)
Area: 1.692 square miles
Population: 8,393
Population density:
Median household income in 2021:
Median rent in in 2021:
Male vs Females
Median age
Average estimated value of detached houses in 2021 (75.4% of all units):
Most popular occupations of males: management occupations (except farmers) (21.9%); computer and mathematical occupations (15.7%); business and financial operations occupations (10.3%); service occupations (8.6%); education, training, and library occupations (8.5%); healthcare practitioners and technical occupations (7.2%); sales and office occupations (7.2%)
Most popular occupations of females: management occupations (except farmers) (16.3%); healthcare practitioners and technical occupations (13.8%); education, training, and library occupations (12.8%); sales and office occupations (11.5%); business and financial operations occupations (10.4%); computer and mathematical occupations (6.7%); service occupations (5.9%)
Limited-access highways (interstate or state) in this neighborhood: I- 5.
Roads and streets: E Green Lake Way N; NE Ravenna Blvd; E Green Lake Dr N; N 82nd St; N 80th St; Woodlawn Ave N; 5th Ave NE; 4th Ave NE; Latona Ave NE; Woodlawn Ave NE; 1st Ave NE; Corliss Ave N; N 77th St; Sunnyside Ave N; N 50th St; NE 65th St; W Green Lake Way N; N 63rd St; 8th Ave NE; Meridian Ave N; Stone Ave N; 2nd Ave NE; NE 63rd St; Bagley Ave N; Green Lake Dr N; Ashworth Ave N; 6th Ave NE; N 78th St; W Green Lake Dr N; N 64th St; N 62nd St; N 61st St; NE 75th St; NE 70th St; Weedin Pl NE; N 65th St; N 60th St; NE 72nd St; NE Maple Leaf Pl; Stroud Ave N; NE 71st St; Winona Ave N; Green Lake Way N; Hillman Pl NE; Wallingford Ave N; NE 60th St; McKinley Pl N; NE 73rd St; NE 77th St; Densmore Ave N; N 75th St; NE 76th St; NE 61st St; NE 62nd St; NE 64th St; N 79th St; NE 80th St; NE 68th St; NE 74th St; Fremont Ave N; Phinney Ave N; 7th Ave NE; Kenwood Pl N; Orin Ct N; N 57th St; Kirkwood Pl N; Oswego Pl NE; Interlake Ave N; Burke Ave N; N 76th St; Chapin Pl N; Keen Way N; Corliss Way N; NE Longwood Pl; N 66th St; NE 69th St.
Green Lake neighborhood detailed profile
Area: 1.692 square miles
Population: 8,393
Population density:
| Green Lake: | 4,959 people per square mile |
| Seattle: | 8,750 people per square mile |
Median household income in 2021:
| Green Lake: | $166,425 |
| Seattle: | $110,781 |
Median rent in in 2021:
| Green Lake: | $1,925 |
| Seattle: | $1,670 |
Male vs Females
| Males: | 4,287 |
| Females: | 4,106 |
Median age
| Males: | 37.7 years |
| Females: | 35.4 years |
Average estimated value of detached houses in 2021 (75.4% of all units):
| Green Lake: | $1,007,529 |
| Seattle: | $906,138 |
Most popular occupations of males: management occupations (except farmers) (21.9%); computer and mathematical occupations (15.7%); business and financial operations occupations (10.3%); service occupations (8.6%); education, training, and library occupations (8.5%); healthcare practitioners and technical occupations (7.2%); sales and office occupations (7.2%)
Most popular occupations of females: management occupations (except farmers) (16.3%); healthcare practitioners and technical occupations (13.8%); education, training, and library occupations (12.8%); sales and office occupations (11.5%); business and financial operations occupations (10.4%); computer and mathematical occupations (6.7%); service occupations (5.9%)
Limited-access highways (interstate or state) in this neighborhood: I- 5.
Roads and streets: E Green Lake Way N; NE Ravenna Blvd; E Green Lake Dr N; N 82nd St; N 80th St; Woodlawn Ave N; 5th Ave NE; 4th Ave NE; Latona Ave NE; Woodlawn Ave NE; 1st Ave NE; Corliss Ave N; N 77th St; Sunnyside Ave N; N 50th St; NE 65th St; W Green Lake Way N; N 63rd St; 8th Ave NE; Meridian Ave N; Stone Ave N; 2nd Ave NE; NE 63rd St; Bagley Ave N; Green Lake Dr N; Ashworth Ave N; 6th Ave NE; N 78th St; W Green Lake Dr N; N 64th St; N 62nd St; N 61st St; NE 75th St; NE 70th St; Weedin Pl NE; N 65th St; N 60th St; NE 72nd St; NE Maple Leaf Pl; Stroud Ave N; NE 71st St; Winona Ave N; Green Lake Way N; Hillman Pl NE; Wallingford Ave N; NE 60th St; McKinley Pl N; NE 73rd St; NE 77th St; Densmore Ave N; N 75th St; NE 76th St; NE 61st St; NE 62nd St; NE 64th St; N 79th St; NE 80th St; NE 68th St; NE 74th St; Fremont Ave N; Phinney Ave N; 7th Ave NE; Kenwood Pl N; Orin Ct N; N 57th St; Kirkwood Pl N; Oswego Pl NE; Interlake Ave N; Burke Ave N; N 76th St; Chapin Pl N; Keen Way N; Corliss Way N; NE Longwood Pl; N 66th St; NE 69th St.
Green Lake neighborhood detailed profile
Greenwood neighborhood in Seattle statistics: (Find on map)
Area: 1.498 square miles
Population: 22,440
Population density:
Median household income in 2021:
Median rent in in 2021:
Male vs Females
Median age
Housing prices:
Average estimated value of detached houses in 2021 (51.3% of all units):
Average estimated value of townhouses or other attached units in 2021 (16.4% of all units):
Average estimated '21 value of housing units in 5-or-more-unit structures (7.1% of all units):
Most popular occupations of males: management occupations (except farmers) (22.0%); computer and mathematical occupations (13.8%); sales and office occupations (10.3%); service occupations (9.3%); business and financial operations occupations (7.1%); construction, extraction, and maintenance occupations (6.5%); architecture and engineering occupations (6.3%)
Most popular occupations of females: healthcare practitioners and technical occupations (15.5%); sales and office occupations (15.2%); management occupations (except farmers) (12.8%); service occupations (12.1%); education, training, and library occupations (10.3%); business and financial operations occupations (6.9%); community and social services occupations (6.5%)
Highways in this neighborhood: Aurora Ave N (State Rte 99).
Roads and streets: Linden Ave N; Greenwood Ave N; Dayton Ave N; Fremont Ave N; 3rd Ave NW; 1st Ave NW; 6th Ave NW; Evanston Ave N; N 76th St; N 77th St; N 78th St; N 79th St; N 80th St; N 81st St; N 82nd St; N 83rd St; N 85th St; N 84th St; N 87th St; N 90th St; N 92nd St; N 95th St; N 100th St; N 101st St; N 103rd St; N 97th St; N 104th St; N 75th St; Phinney Ave N; Palatine Ave N; 2nd Ave NW; N 102nd St; N 105th St; 4th Ave NW; 7th Ave NW; Holman Rd NW; N 86th St; NW 90th St; NW 92nd St; NW 95th St; NW 97th St; N 88th St; N 96th St; N 98th St; N 91st St; N 89th St; NW 75th St; NW 76th St; NW 77th St; NW 78th St; NW 79th St; NW 80th St; NW 81st St; NW 82nd St; NW 83rd St; NW 84th St; NW 85th St; NW 87th St; NW 100th St; NW 100th Pl; NW 103rd St; NW 101st St; Holman Rd N; N 93rd St; N 94th St; NW 86th St; NW 88th St; NW 89th St; NW 104th St; N Greenwood Cir; 104th St N; Olympic View Pl N; 103rd St.
Greenwood neighborhood detailed profile
Area: 1.498 square miles
Population: 22,440
Population density:
| Greenwood: | 14,979 people per square mile |
| Seattle: | 8,750 people per square mile |
Median household income in 2021:
| Greenwood: | $109,660 |
| Seattle: | $110,781 |
Median rent in in 2021:
| Greenwood: | $1,590 |
| Seattle: | $1,670 |
Male vs Females
| Males: | 11,202 |
| Females: | 11,238 |
Median age
| Males: | 37.5 years |
| Females: | 38.1 years |
Housing prices:
Average estimated value of detached houses in 2021 (51.3% of all units):
| Greenwood: | $919,374 |
| Seattle: | $906,138 |
Average estimated value of townhouses or other attached units in 2021 (16.4% of all units):
| This neighborhood: | $685,395 |
| city: | $615,733 |
Average estimated '21 value of housing units in 5-or-more-unit structures (7.1% of all units):
| Greenwood: | $380,000 |
| Seattle: | $570,782 |
Most popular occupations of males: management occupations (except farmers) (22.0%); computer and mathematical occupations (13.8%); sales and office occupations (10.3%); service occupations (9.3%); business and financial operations occupations (7.1%); construction, extraction, and maintenance occupations (6.5%); architecture and engineering occupations (6.3%)
Most popular occupations of females: healthcare practitioners and technical occupations (15.5%); sales and office occupations (15.2%); management occupations (except farmers) (12.8%); service occupations (12.1%); education, training, and library occupations (10.3%); business and financial operations occupations (6.9%); community and social services occupations (6.5%)
Highways in this neighborhood: Aurora Ave N (State Rte 99).
Roads and streets: Linden Ave N; Greenwood Ave N; Dayton Ave N; Fremont Ave N; 3rd Ave NW; 1st Ave NW; 6th Ave NW; Evanston Ave N; N 76th St; N 77th St; N 78th St; N 79th St; N 80th St; N 81st St; N 82nd St; N 83rd St; N 85th St; N 84th St; N 87th St; N 90th St; N 92nd St; N 95th St; N 100th St; N 101st St; N 103rd St; N 97th St; N 104th St; N 75th St; Phinney Ave N; Palatine Ave N; 2nd Ave NW; N 102nd St; N 105th St; 4th Ave NW; 7th Ave NW; Holman Rd NW; N 86th St; NW 90th St; NW 92nd St; NW 95th St; NW 97th St; N 88th St; N 96th St; N 98th St; N 91st St; N 89th St; NW 75th St; NW 76th St; NW 77th St; NW 78th St; NW 79th St; NW 80th St; NW 81st St; NW 82nd St; NW 83rd St; NW 84th St; NW 85th St; NW 87th St; NW 100th St; NW 100th Pl; NW 103rd St; NW 101st St; Holman Rd N; N 93rd St; N 94th St; NW 86th St; NW 88th St; NW 89th St; NW 104th St; N Greenwood Cir; 104th St N; Olympic View Pl N; 103rd St.
Greenwood neighborhood detailed profile
Haller Lake neighborhood in Seattle statistics: (Find on map)
Area: 1.677 square miles
Population: 13,636
Population density:
Median household income in 2021:
Median rent in in 2021:
Male vs Females
Median age
Most popular occupations of males: sales and office occupations (15.5%); service occupations (13.7%); management occupations (except farmers) (13.5%); business and financial operations occupations (7.1%); architecture and engineering occupations (6.3%); computer and mathematical occupations (6.2%); transportation occupations (5.0%)
Most popular occupations of females: sales and office occupations (24.0%); service occupations (19.9%); education, training, and library occupations (10.0%); healthcare practitioners and technical occupations (8.5%); computer and mathematical occupations (6.8%); life, physical, and social science occupations (6.3%); management occupations (except farmers) (5.8%)
Limited-access highways (interstate or state) in this neighborhood: I- 5.
Highways in this neighborhood: Aurora Ave N (State Rte 99).
Roads and streets: Corliss Ave N; Meridian Ave N; Stone Ave N; 1st Ave NE; Ashworth Ave N; Roosevelt Way N; N 143rd St; N 137th St; Densmore Ave N; N 130th St; N 128th St; N 115th St; N 122nd St; 3rd Ave NE; N 140th St; N 135th St; N 120th St; N 125th St; Burke Ave N; N 107th St; N 133rd St; 2nd Ave NE; Midvale Ave N; Wallingford Ave N; N 117th St; Interlake Ave N; N Northgate Way; NE 130th St; Roosevelt Way NE; NE 125th St; NE 133rd St; NE 140th St; 4th Ave NE; N 110th St; Sunnyside Ave N; N 121st St; Stendall Dr N; Stendall Pl N; N 116th St; Bagley Ave N; N 113th St; N 131st St; NE 120th St; NE 135th St; NE 139th St; Lenora Pl N; Par Pl NE; NE 123rd St; N 122nd Pl; N 112th St; N 136th St; L St NE; Courtland Pl N; N 134th St; Roslyn Pl N; NE 137th St; Wayne Pl N; NE 136th St; N 132nd St; N 114th St; N 113th Pl; N 135th Pl; N 104th St.
Haller Lake neighborhood detailed profile
Area: 1.677 square miles
Population: 13,636
Population density:
| Haller Lake: | 8,129 people per square mile |
| Seattle: | 8,750 people per square mile |
Median household income in 2021:
| Haller Lake: | $100,720 |
| Seattle: | $110,781 |
Median rent in in 2021:
| Haller Lake: | $1,706 |
| Seattle: | $1,670 |
Male vs Females
| Males: | 7,110 |
| Females: | 6,526 |
Median age
| Males: | 40.1 years |
| Females: | 40.5 years |
Most popular occupations of males: sales and office occupations (15.5%); service occupations (13.7%); management occupations (except farmers) (13.5%); business and financial operations occupations (7.1%); architecture and engineering occupations (6.3%); computer and mathematical occupations (6.2%); transportation occupations (5.0%)
Most popular occupations of females: sales and office occupations (24.0%); service occupations (19.9%); education, training, and library occupations (10.0%); healthcare practitioners and technical occupations (8.5%); computer and mathematical occupations (6.8%); life, physical, and social science occupations (6.3%); management occupations (except farmers) (5.8%)
Limited-access highways (interstate or state) in this neighborhood: I- 5.
Highways in this neighborhood: Aurora Ave N (State Rte 99).
Roads and streets: Corliss Ave N; Meridian Ave N; Stone Ave N; 1st Ave NE; Ashworth Ave N; Roosevelt Way N; N 143rd St; N 137th St; Densmore Ave N; N 130th St; N 128th St; N 115th St; N 122nd St; 3rd Ave NE; N 140th St; N 135th St; N 120th St; N 125th St; Burke Ave N; N 107th St; N 133rd St; 2nd Ave NE; Midvale Ave N; Wallingford Ave N; N 117th St; Interlake Ave N; N Northgate Way; NE 130th St; Roosevelt Way NE; NE 125th St; NE 133rd St; NE 140th St; 4th Ave NE; N 110th St; Sunnyside Ave N; N 121st St; Stendall Dr N; Stendall Pl N; N 116th St; Bagley Ave N; N 113th St; N 131st St; NE 120th St; NE 135th St; NE 139th St; Lenora Pl N; Par Pl NE; NE 123rd St; N 122nd Pl; N 112th St; N 136th St; L St NE; Courtland Pl N; N 134th St; Roslyn Pl N; NE 137th St; Wayne Pl N; NE 136th St; N 132nd St; N 114th St; N 113th Pl; N 135th Pl; N 104th St.
Haller Lake neighborhood detailed profile
Harbor Island neighborhood in Seattle statistics: (Find on map)
Area: 0.638 square miles
Population: 271
Population density:
Median household income in 2021:
Median rent in in 2021:
Male vs Females
Median age
Most popular occupations of males: management occupations (except farmers) (26.4%); computer and mathematical occupations (17.3%); sales and office occupations (17.3%); arts, design, entertainment, sports, and media occupations (15.2%); business and financial operations occupations (8.5%); architecture and engineering occupations (5.0%); healthcare practitioners and technical occupations (4.8%)
Most popular occupations of females: management occupations (except farmers) (32.4%); sales and office occupations (24.6%); business and financial operations occupations (13.0%); service occupations (8.3%); life, physical, and social science occupations (6.9%); healthcare practitioners and technical occupations (5.5%); community and social services occupations (4.1%)
Limited-access highways (interstate or state) in this neighborhood: W Seattle Fwy.
Roads and streets: 16th Ave SW; 11th Ave SW; SW Manning St; Klickitat Ave Brg; 13th Ave SW; SW Hanford St; SW Florida St; SW Spokane St; Klickitat Ave SW; SW Lander St; SW Klickitat Way; SW Klickitat Ave; SW Massachusetts St; SW Spokane Pl; 12th Ave SW.
Railroad features: Burlington Northern Santa Fe Rlwy.
Harbor Island neighborhood detailed profile
Area: 0.638 square miles
Population: 271
Population density:
| Harbor Island: | 425 people per square mile |
| Seattle: | 8,750 people per square mile |
Median household income in 2021:
| Harbor Island: | $110,405 |
| Seattle: | $110,781 |
Median rent in in 2021:
| Harbor Island: | $1,795 |
| Seattle: | $1,670 |
Male vs Females
| Males: | 135 |
| Females: | 135 |
Median age
| Males: | 41.5 years |
| Females: | 39.6 years |
Most popular occupations of males: management occupations (except farmers) (26.4%); computer and mathematical occupations (17.3%); sales and office occupations (17.3%); arts, design, entertainment, sports, and media occupations (15.2%); business and financial operations occupations (8.5%); architecture and engineering occupations (5.0%); healthcare practitioners and technical occupations (4.8%)
Most popular occupations of females: management occupations (except farmers) (32.4%); sales and office occupations (24.6%); business and financial operations occupations (13.0%); service occupations (8.3%); life, physical, and social science occupations (6.9%); healthcare practitioners and technical occupations (5.5%); community and social services occupations (4.1%)
Limited-access highways (interstate or state) in this neighborhood: W Seattle Fwy.
Roads and streets: 16th Ave SW; 11th Ave SW; SW Manning St; Klickitat Ave Brg; 13th Ave SW; SW Hanford St; SW Florida St; SW Spokane St; Klickitat Ave SW; SW Lander St; SW Klickitat Way; SW Klickitat Ave; SW Massachusetts St; SW Spokane Pl; 12th Ave SW.
Railroad features: Burlington Northern Santa Fe Rlwy.
Harbor Island neighborhood detailed profile
Harrison neighborhood in Seattle statistics: (Find on map)
Area: 0.524 square miles
Population: 4,733
Population density:
Median household income in 2021:
Median rent in in 2021:
Male vs Females
Median age
Housing prices:
Average estimated value of detached houses in 2021 (57.2% of all units):
Average estimated value of townhouses or other attached units in 2021 (4.9% of all units):
Average estimated '21 value of housing units in 5-or-more-unit structures (11.3% of all units):
Most popular occupations of males: management occupations (except farmers) (26.0%); service occupations (12.5%); computer and mathematical occupations (11.9%); healthcare practitioners and technical occupations (10.6%); business and financial operations occupations (8.5%); transportation occupations (6.8%); education, training, and library occupations (5.1%)
Most popular occupations of females: management occupations (except farmers) (15.6%); service occupations (14.6%); healthcare practitioners and technical occupations (14.1%); sales and office occupations (13.4%); education, training, and library occupations (9.7%); business and financial operations occupations (6.6%); life, physical, and social science occupations (5.7%)
Roads and streets: Lake Washington Blvd E; McGilvra Blvd E; 39th Ave E; E John St; 36th Ave E; E Harrison St; E Republican St; 34th Ave E; Hillside Dr E; 37th Ave E; E Mercer St; 32nd Ave E; 30th Ave E; E Prospect St; 31st Ave E; 29th Ave E; E Denny Way; 35th Ave E; Dorffel Dr E; E Thomas St; E Valley St; Maiden Ln E; 33rd Ave E; Dewey Pl E; E Highland Dr; E Ford Pl; E Ward St; E Florence Ct; 38th Ave E; Madrona Pl E; E High Ln; E Denny Blaine Pl; Blaine Pl; 40th Ave E; Madrona Dr; E Howell St; 32nd Ave.
Harrison neighborhood detailed profile
Area: 0.524 square miles
Population: 4,733
Population density:
| Harrison (Denny Blane): | 9,032 people per square mile |
| Seattle: | 8,750 people per square mile |
Median household income in 2021:
| Harrison (Denny Blane): | $164,753 |
| Seattle: | $110,781 |
Median rent in in 2021:
| Harrison (Denny Blane): | $2,042 |
| Seattle: | $1,670 |
Male vs Females
| Males: | 2,401 |
| Females: | 2,331 |
Median age
| Males: | 44.0 years |
| Females: | 49.7 years |
Housing prices:
Average estimated value of detached houses in 2021 (57.2% of all units):
| Harrison (Denny Blane): | $1,263,938 |
| Seattle: | $906,138 |
Average estimated value of townhouses or other attached units in 2021 (4.9% of all units):
| This neighborhood: | $1,007,143 |
| city: | $615,733 |
Average estimated '21 value of housing units in 5-or-more-unit structures (11.3% of all units):
| Harrison (Denny Blane): | $703,397 |
| Seattle: | $570,782 |
Most popular occupations of males: management occupations (except farmers) (26.0%); service occupations (12.5%); computer and mathematical occupations (11.9%); healthcare practitioners and technical occupations (10.6%); business and financial operations occupations (8.5%); transportation occupations (6.8%); education, training, and library occupations (5.1%)
Most popular occupations of females: management occupations (except farmers) (15.6%); service occupations (14.6%); healthcare practitioners and technical occupations (14.1%); sales and office occupations (13.4%); education, training, and library occupations (9.7%); business and financial operations occupations (6.6%); life, physical, and social science occupations (5.7%)
Roads and streets: Lake Washington Blvd E; McGilvra Blvd E; 39th Ave E; E John St; 36th Ave E; E Harrison St; E Republican St; 34th Ave E; Hillside Dr E; 37th Ave E; E Mercer St; 32nd Ave E; 30th Ave E; E Prospect St; 31st Ave E; 29th Ave E; E Denny Way; 35th Ave E; Dorffel Dr E; E Thomas St; E Valley St; Maiden Ln E; 33rd Ave E; Dewey Pl E; E Highland Dr; E Ford Pl; E Ward St; E Florence Ct; 38th Ave E; Madrona Pl E; E High Ln; E Denny Blaine Pl; Blaine Pl; 40th Ave E; Madrona Dr; E Howell St; 32nd Ave.
Harrison neighborhood detailed profile
High Point neighborhood in Seattle statistics: (Find on map)
Area: 0.835 square miles
Population: 10,417
Population density:
Median household income in 2021:
Median rent in in 2021:
Male vs Females
Median age
Housing prices:
Average estimated value of detached houses in 2021 (98.9% of all units):
Average estimated value of townhouses or other attached units in 2021 (1.5% of all units):
Most popular occupations of males: management occupations (except farmers) (35.4%); service occupations (11.8%); construction, extraction, and maintenance occupations (10.8%); business and financial operations occupations (10.0%); sales and office occupations (8.1%); arts, design, entertainment, sports, and media occupations (6.4%); architecture and engineering occupations (4.0%)
Most popular occupations of females: service occupations (30.0%); sales and office occupations (21.8%); management occupations (except farmers) (10.6%); business and financial operations occupations (9.9%); healthcare practitioners and technical occupations (6.8%); education, training, and library occupations (6.2%); arts, design, entertainment, sports, and media occupations (4.3%)
Roads and streets: Delridge Way SW; 31st Ave SW; 34th Ave SW; Sylvan Way SW; 32nd Ave SW; SW Graham St; SW Myrtle St; 24th Ave SW; High Point Dr SW; 25th Ave SW; SW Othello St; 23rd Ave SW; SW Holden St; 26th Ave SW; Cycle Ln SW; SW Raymond St; SW Juneau St; SW Findlay St; 30th Ave SW; SW Holly St; SW Lanham Way; Macarthur Ct SW; SW Morgan St; SW Kenny St; 29th Ave SW; Bataan Pl SW; SW Snow Ct; SW Willow St; SW Orchard St; Shinkle Pl SW; SW Webster St; 28th Ave SW; 26th Pl SW.
High Point neighborhood detailed profile
Area: 0.835 square miles
Population: 10,417
Population density:
| High Point: | 12,473 people per square mile |
| Seattle: | 8,750 people per square mile |
Median household income in 2021:
| High Point: | $95,817 |
| Seattle: | $110,781 |
Median rent in in 2021:
| High Point: | $2,061 |
| Seattle: | $1,670 |
Male vs Females
| Males: | 4,669 |
| Females: | 5,748 |
Median age
| Males: | 35.6 years |
| Females: | 35.5 years |
Housing prices:
Average estimated value of detached houses in 2021 (98.9% of all units):
| High Point: | $682,422 |
| Seattle: | $906,138 |
Average estimated value of townhouses or other attached units in 2021 (1.5% of all units):
| This neighborhood: | $611,365 |
| city: | $615,733 |
Most popular occupations of males: management occupations (except farmers) (35.4%); service occupations (11.8%); construction, extraction, and maintenance occupations (10.8%); business and financial operations occupations (10.0%); sales and office occupations (8.1%); arts, design, entertainment, sports, and media occupations (6.4%); architecture and engineering occupations (4.0%)
Most popular occupations of females: service occupations (30.0%); sales and office occupations (21.8%); management occupations (except farmers) (10.6%); business and financial operations occupations (9.9%); healthcare practitioners and technical occupations (6.8%); education, training, and library occupations (6.2%); arts, design, entertainment, sports, and media occupations (4.3%)
Roads and streets: Delridge Way SW; 31st Ave SW; 34th Ave SW; Sylvan Way SW; 32nd Ave SW; SW Graham St; SW Myrtle St; 24th Ave SW; High Point Dr SW; 25th Ave SW; SW Othello St; 23rd Ave SW; SW Holden St; 26th Ave SW; Cycle Ln SW; SW Raymond St; SW Juneau St; SW Findlay St; 30th Ave SW; SW Holly St; SW Lanham Way; Macarthur Ct SW; SW Morgan St; SW Kenny St; 29th Ave SW; Bataan Pl SW; SW Snow Ct; SW Willow St; SW Orchard St; Shinkle Pl SW; SW Webster St; 28th Ave SW; 26th Pl SW.
High Point neighborhood detailed profile
Highland Park neighborhood in Seattle statistics: (Find on map)
Area: 1.419 square miles
Population: 6,884
Population density:
Median household income in 2021:
Median rent in in 2021:
Male vs Females
Median age
Housing prices:
Average estimated value of detached houses in 2021 (61.1% of all units):
Average estimated value of townhouses or other attached units in 2021 (5.8% of all units):
Most popular occupations of males: business and financial operations occupations (10.2%); sales and office occupations (9.2%); material moving occupations (8.6%); production occupations (8.4%); architecture and engineering occupations (8.2%); service occupations (7.3%); construction, extraction, and maintenance occupations (7.0%)
Most popular occupations of females: sales and office occupations (22.0%); service occupations (20.7%); management occupations (except farmers) (11.9%); business and financial operations occupations (11.5%); healthcare practitioners and technical occupations (6.5%); community and social services occupations (4.5%); education, training, and library occupations (3.9%)
Highways in this neighborhood: State Rte 509.
Roads and streets: 12th Ave SW; 9th Ave SW; 10th Ave SW; 8th Ave SW; SW Cambridge St; 13th Ave SW; 14th Ave SW; SW Roxbury St; 11th Ave SW; Detroit Ave SW; 15th Ave SW; SW Kenyon St; SW Cloverdale St; SW Thistle St; Olson Pl SW; 7th Ave SW; Myers Way S; SW Barton St; SW Trenton St; SW Henderson St; SW Elmgrove St; 4th Ave SW; 5th Ave SW; Henderson Pl SW; 6th Ave SW; 1st Ave S; S 100th St; 2nd Ave SW; 3rd Ave SW; SW 100th St; SW Portland St; SW Othello St; SW Austin Pl; 7th Pl SW; SW Holden St; S 99th St; Elmgrove St SW; 4th Ave S; SW Roxbury Pl; 2nd Ave S; SW Austin St; Olson-Myers Way P&R Acrd; 1st Pl S; Occidental Ave S; S Myrtle St; W Marginal Way SW.
Highland Park neighborhood detailed profile
Area: 1.419 square miles
Population: 6,884
Population density:
| Highland Park: | 4,850 people per square mile |
| Seattle: | 8,750 people per square mile |
Median household income in 2021:
| Highland Park: | $83,373 |
| Seattle: | $110,781 |
Median rent in in 2021:
| Highland Park: | $1,526 |
| Seattle: | $1,670 |
Male vs Females
| Males: | 3,287 |
| Females: | 3,597 |
Median age
| Males: | 37.4 years |
| Females: | 41.3 years |
Housing prices:
Average estimated value of detached houses in 2021 (61.1% of all units):
| Highland Park: | $544,952 |
| Seattle: | $906,138 |
Average estimated value of townhouses or other attached units in 2021 (5.8% of all units):
| This neighborhood: | $307,516 |
| city: | $615,733 |
Most popular occupations of males: business and financial operations occupations (10.2%); sales and office occupations (9.2%); material moving occupations (8.6%); production occupations (8.4%); architecture and engineering occupations (8.2%); service occupations (7.3%); construction, extraction, and maintenance occupations (7.0%)
Most popular occupations of females: sales and office occupations (22.0%); service occupations (20.7%); management occupations (except farmers) (11.9%); business and financial operations occupations (11.5%); healthcare practitioners and technical occupations (6.5%); community and social services occupations (4.5%); education, training, and library occupations (3.9%)
Highways in this neighborhood: State Rte 509.
Roads and streets: 12th Ave SW; 9th Ave SW; 10th Ave SW; 8th Ave SW; SW Cambridge St; 13th Ave SW; 14th Ave SW; SW Roxbury St; 11th Ave SW; Detroit Ave SW; 15th Ave SW; SW Kenyon St; SW Cloverdale St; SW Thistle St; Olson Pl SW; 7th Ave SW; Myers Way S; SW Barton St; SW Trenton St; SW Henderson St; SW Elmgrove St; 4th Ave SW; 5th Ave SW; Henderson Pl SW; 6th Ave SW; 1st Ave S; S 100th St; 2nd Ave SW; 3rd Ave SW; SW 100th St; SW Portland St; SW Othello St; SW Austin Pl; 7th Pl SW; SW Holden St; S 99th St; Elmgrove St SW; 4th Ave S; SW Roxbury Pl; 2nd Ave S; SW Austin St; Olson-Myers Way P&R Acrd; 1st Pl S; Occidental Ave S; S Myrtle St; W Marginal Way SW.
Highland Park neighborhood detailed profile
Holly Park neighborhood in Seattle statistics: (Find on map)
Area: 0.296 square miles
Roads and streets: S Holly St; Holly Park Dr S; S Willow St; 38th Ave S; 30th Ave S; S Myrtle St; 32nd Ave S; S Brighton St; 40th Ave S; S Holly Pl; 37th Ave S; S Frontenac St; S Morgan St; S Willow Street Aly (S Frontenac Street Aly); 29th Ave S; Shaffer Ave S; 39th Ave S; Rockery Dr S; S Warsaw St; 28th Ave S; S Othello St; S Holly Place Aly (S Holly Street Aly); 31st Pl S (S Willow Street Aly); S Holly Street Aly (S Brighton Street Aly); 35th Ave S; S Holden St; S Chicago St; 33rd Ave S; S Warsaw Pl; S Van Asselt Ct; 34th Pl S; 31st Ave S; S Webster Ct; S Myrtle Pl; Iago Pl S; Chicago Ct S; 33rd Pl S; S Holly Park Dr.
Holly Park neighborhood detailed profile
Industrial District neighborhood in Seattle statistics: (Find on map)
Area: 4.529 square miles
Population: 1,952
Population density:
Median household income in 2021:
Median rent in in 2021:
Male vs Females
Median age
Housing prices:
Average estimated value of detached houses in 2021 (30.4% of all units):
Average estimated value of townhouses or other attached units in 2021 (2.5% of all units):
Average estimated '21 value of housing units in 5-or-more-unit structures (128.9% of all units):
Most popular occupations of males: management occupations (except farmers) (24.5%); sales and office occupations (15.6%); computer and mathematical occupations (12.7%); arts, design, entertainment, sports, and media occupations (10.7%); service occupations (8.1%); healthcare practitioners and technical occupations (6.0%); legal occupations (4.3%)
Most popular occupations of females: management occupations (except farmers) (24.3%); service occupations (24.1%); healthcare practitioners and technical occupations (17.8%); sales and office occupations (11.0%); business and financial operations occupations (6.3%); arts, design, entertainment, sports, and media occupations (5.8%); community and social services occupations (4.0%)
Limited-access highways (interstate or state) in this neighborhood: W Seattle Fwy; I- 5; I- 90.
Highways in this neighborhood: Alaska Fwy (Alaskan Way Viaduct, State Rte 99); E Marginal Way S (State Rte 99); State Rte 519 (S Royal Brougham Way).
Roads and streets: Airport Way S; 4th Ave S; S Spokane St; 6th Ave S; 1st Ave S; Colorado Ave S; W Marginal Way SW; 16th Ave SW; S Holgate St; SW Spokane St; Utah Ave S; 3rd Ave S; S Lander St; S Horton St; 26th Ave SW; S Hinds St; S Industrial Way; 11th Ave SW; SW Florida St; Occidental Ave S; 7th Ave S; 2nd Ave S; S Hanford St; S Massachusetts St; S Stacy St; S Dawson St; S Walker St; 8th Ave S; S Forest St; S Atlantic St; Denver Ave S; SW Manning St; Klickitat Ave Brg; 13th Ave SW; S Andover St; SW Hanford St; S Hudson St; S Alaska St; S Bennett St; South Dakota St; Ohio Ave S; Chelan Ave SW; S Nevada St; Summerville Pl S; S Bradford St; Klickitat Ave SW; Alaskan Way S; S Charlestown St; Duwamish Ave S; 9th Ave S; S Idaho St; SW Lander St; S Snoqualmie St; SW Front St; S Dearborn St; SW Klickitat Way; Maynard Ave S; Diagonal Ave S; S Plummer St; SW Idaho St; S Charles St; Edgar Martinez Dr S; S Lucile St Ovp; S Edmunds St; SW Klickitat Ave; S Adams St; Royal Brougham Way; SW Tronsen Pl; S Bayview St; 6th Pl S; 7th Pl S; S Stevens St; S Court St; SW Massachusetts St; S Oregon St; SW Peninsula Pl; Overpass Brg; 5th Pl S; S Vermont St; SW Spokane Pl; S College St; S Hill St; S Pearl St; 5th Ave S; S Plum St; SW Michigan St; Holgate Street Brg; 12th Ave SW; Beacon Avenue Brg S; Swift Ave S; Bennett St; 10th Ave S; Harbor Ave SW; Adams St; SW Marginal Pl.
Railroad features: Burlington Northern Santa Fe Rlwy; Union Pacific RR.
Industrial District neighborhood detailed profile
Area: 4.529 square miles
Population: 1,952
Population density:
| Industrial District: | 431 people per square mile |
| Seattle: | 8,750 people per square mile |
Median household income in 2021:
| Industrial District: | $106,544 |
| Seattle: | $110,781 |
Median rent in in 2021:
| Industrial District: | $2,294 |
| Seattle: | $1,670 |
Male vs Females
| Males: | 1,191 |
| Females: | 760 |
Median age
| Males: | 56.9 years |
| Females: | 57.9 years |
Housing prices:
Average estimated value of detached houses in 2021 (30.4% of all units):
| Industrial District: | $681,556 |
| Seattle: | $906,138 |
Average estimated value of townhouses or other attached units in 2021 (2.5% of all units):
| This neighborhood: | $1,758,279 |
| city: | $615,733 |
Average estimated '21 value of housing units in 5-or-more-unit structures (128.9% of all units):
| Industrial District: | $294,008 |
| Seattle: | $570,782 |
Most popular occupations of males: management occupations (except farmers) (24.5%); sales and office occupations (15.6%); computer and mathematical occupations (12.7%); arts, design, entertainment, sports, and media occupations (10.7%); service occupations (8.1%); healthcare practitioners and technical occupations (6.0%); legal occupations (4.3%)
Most popular occupations of females: management occupations (except farmers) (24.3%); service occupations (24.1%); healthcare practitioners and technical occupations (17.8%); sales and office occupations (11.0%); business and financial operations occupations (6.3%); arts, design, entertainment, sports, and media occupations (5.8%); community and social services occupations (4.0%)
Limited-access highways (interstate or state) in this neighborhood: W Seattle Fwy; I- 5; I- 90.
Highways in this neighborhood: Alaska Fwy (Alaskan Way Viaduct, State Rte 99); E Marginal Way S (State Rte 99); State Rte 519 (S Royal Brougham Way).
Roads and streets: Airport Way S; 4th Ave S; S Spokane St; 6th Ave S; 1st Ave S; Colorado Ave S; W Marginal Way SW; 16th Ave SW; S Holgate St; SW Spokane St; Utah Ave S; 3rd Ave S; S Lander St; S Horton St; 26th Ave SW; S Hinds St; S Industrial Way; 11th Ave SW; SW Florida St; Occidental Ave S; 7th Ave S; 2nd Ave S; S Hanford St; S Massachusetts St; S Stacy St; S Dawson St; S Walker St; 8th Ave S; S Forest St; S Atlantic St; Denver Ave S; SW Manning St; Klickitat Ave Brg; 13th Ave SW; S Andover St; SW Hanford St; S Hudson St; S Alaska St; S Bennett St; South Dakota St; Ohio Ave S; Chelan Ave SW; S Nevada St; Summerville Pl S; S Bradford St; Klickitat Ave SW; Alaskan Way S; S Charlestown St; Duwamish Ave S; 9th Ave S; S Idaho St; SW Lander St; S Snoqualmie St; SW Front St; S Dearborn St; SW Klickitat Way; Maynard Ave S; Diagonal Ave S; S Plummer St; SW Idaho St; S Charles St; Edgar Martinez Dr S; S Lucile St Ovp; S Edmunds St; SW Klickitat Ave; S Adams St; Royal Brougham Way; SW Tronsen Pl; S Bayview St; 6th Pl S; 7th Pl S; S Stevens St; S Court St; SW Massachusetts St; S Oregon St; SW Peninsula Pl; Overpass Brg; 5th Pl S; S Vermont St; SW Spokane Pl; S College St; S Hill St; S Pearl St; 5th Ave S; S Plum St; SW Michigan St; Holgate Street Brg; 12th Ave SW; Beacon Avenue Brg S; Swift Ave S; Bennett St; 10th Ave S; Harbor Ave SW; Adams St; SW Marginal Pl.
Railroad features: Burlington Northern Santa Fe Rlwy; Union Pacific RR.
Industrial District neighborhood detailed profile
Interbay neighborhood in Seattle statistics: (Find on map)
Area: 1.382 square miles
Population: 4,172
Population density:
Median household income in 2021:
Median rent in in 2021:
Male vs Females
Median age
Housing prices:
Average estimated value of detached houses in 2021 (40.7% of all units):
Average estimated value of townhouses or other attached units in 2021 (6.9% of all units):
Average estimated '21 value of housing units in 5-or-more-unit structures (23.1% of all units):
Most popular occupations of males: computer and mathematical occupations (20.7%); management occupations (except farmers) (11.5%); life, physical, and social science occupations (11.4%); sales and office occupations (10.8%); service occupations (9.3%); education, training, and library occupations (8.6%); business and financial operations occupations (7.8%)
Most popular occupations of females: business and financial operations occupations (16.7%); sales and office occupations (16.3%); life, physical, and social science occupations (12.8%); management occupations (except farmers) (12.0%); arts, design, entertainment, sports, and media occupations (9.8%); computer and mathematical occupations (9.1%); architecture and engineering occupations (5.4%)
Roads and streets: 15th Ave W; Magnolia Brg (W Garfield St); Elliott Ave W; Alaskan Way W; Thorndyke Ave W; 21st Ave W; 16th Ave W; W Commodore Way; Gilman Ave W; 23rd Ave W; W Emerson Pl; W Emerson St; 20th Ave W; W Marina Pl; W Dravus St; Gilman Pl W; Magnolia Way W; W Elmore St; 22nd Ave W; W Jameson St; Magnolia Brg; 24th Ave W; W Government Way; 17th Ave W; W Nickerson St; W Thurman St; W Lawton Way (W Armory Way); W Plymouth St; W Galer St; 25th Ave W; W Newton St; W Bertona St; W Crockett St; 26th Ave W; W Fort St; 27th Ave W; W Boston St; W Harley St; Western Ave W; W Barrett St; W Howe St; Amherst Pl W; W Prospect St; W Harrison St; W Wheeler St; 18th Ave W; 31st Ave W; W Raye St; Dartmouth Ave W; 4th Ave W; W Lee St; W Roy St; W Lynn St; W John St; 15th Pl W; 30th Ave W; W Halladay St; W Denny Way; Elliott Ave; Gay Ave W.
Railroad features: Burlington Northern Santa Fe Rlwy.
Interbay neighborhood detailed profile
Area: 1.382 square miles
Population: 4,172
Population density:
| Interbay: | 3,018 people per square mile |
| Seattle: | 8,750 people per square mile |
Median household income in 2021:
| Interbay: | $163,878 |
| Seattle: | $110,781 |
Median rent in in 2021:
| Interbay: | $1,995 |
| Seattle: | $1,670 |
Male vs Females
| Males: | 2,418 |
| Females: | 1,754 |
Median age
| Males: | 39.5 years |
| Females: | 45.2 years |
Housing prices:
Average estimated value of detached houses in 2021 (40.7% of all units):
| Interbay: | $1,014,839 |
| Seattle: | $906,138 |
Average estimated value of townhouses or other attached units in 2021 (6.9% of all units):
| This neighborhood: | $609,813 |
| city: | $615,733 |
Average estimated '21 value of housing units in 5-or-more-unit structures (23.1% of all units):
| Interbay: | $310,394 |
| Seattle: | $570,782 |
Most popular occupations of males: computer and mathematical occupations (20.7%); management occupations (except farmers) (11.5%); life, physical, and social science occupations (11.4%); sales and office occupations (10.8%); service occupations (9.3%); education, training, and library occupations (8.6%); business and financial operations occupations (7.8%)
Most popular occupations of females: business and financial operations occupations (16.7%); sales and office occupations (16.3%); life, physical, and social science occupations (12.8%); management occupations (except farmers) (12.0%); arts, design, entertainment, sports, and media occupations (9.8%); computer and mathematical occupations (9.1%); architecture and engineering occupations (5.4%)
Roads and streets: 15th Ave W; Magnolia Brg (W Garfield St); Elliott Ave W; Alaskan Way W; Thorndyke Ave W; 21st Ave W; 16th Ave W; W Commodore Way; Gilman Ave W; 23rd Ave W; W Emerson Pl; W Emerson St; 20th Ave W; W Marina Pl; W Dravus St; Gilman Pl W; Magnolia Way W; W Elmore St; 22nd Ave W; W Jameson St; Magnolia Brg; 24th Ave W; W Government Way; 17th Ave W; W Nickerson St; W Thurman St; W Lawton Way (W Armory Way); W Plymouth St; W Galer St; 25th Ave W; W Newton St; W Bertona St; W Crockett St; 26th Ave W; W Fort St; 27th Ave W; W Boston St; W Harley St; Western Ave W; W Barrett St; W Howe St; Amherst Pl W; W Prospect St; W Harrison St; W Wheeler St; 18th Ave W; 31st Ave W; W Raye St; Dartmouth Ave W; 4th Ave W; W Lee St; W Roy St; W Lynn St; W John St; 15th Pl W; 30th Ave W; W Halladay St; W Denny Way; Elliott Ave; Gay Ave W.
Railroad features: Burlington Northern Santa Fe Rlwy.
Interbay neighborhood detailed profile
Lake City neighborhood in Seattle statistics: (Find on map)
Area: 4.106 square miles
Population: 34,065
Population density:
Median household income in 2021:
Median rent in in 2021:
Male vs Females
Median age
Housing prices:
Average estimated value of detached houses in 2021 (74.4% of all units):
Average estimated '21 value of housing units in 5-or-more-unit structures (13.3% of all units):
Most popular occupations of males: sales and office occupations (15.7%); service occupations (13.2%); management occupations (except farmers) (13.0%); computer and mathematical occupations (8.7%); education, training, and library occupations (7.0%); architecture and engineering occupations (6.8%); construction, extraction, and maintenance occupations (6.0%)
Most popular occupations of females: sales and office occupations (16.6%); healthcare practitioners and technical occupations (14.3%); business and financial operations occupations (13.8%); management occupations (except farmers) (12.4%); education, training, and library occupations (12.4%); service occupations (12.2%); computer and mathematical occupations (3.8%)
Highways in this neighborhood: State Rte 522 (Lake City Way NE).
Roads and streets: Riviera Pl NE; Sand Point Way NE; 35th Ave NE; NE 105th St; NE 115th St; NE 125th St; 20th Ave NE; NE 135th St; NE 100th St; NE 113th St; 23rd Ave NE; 17th Ave NE; NE 95th St; NE 120th St; NE 98th St; NE 123rd St; 30th Ave NE; NE 137th St; NE 140th St; NE 110th St; 19th Ave NE; 25th Ave NE; 40th Ave NE; 39th Ave NE; NE 97th St; 28th Ave NE; 27th Ave NE; 42nd Ave NE; NE 117th St; NE 130th St; NE 103rd St; NE 143rd St; 36th Ave NE; 38th Ave NE; 32nd Ave NE; NE 107th St; 22nd Ave NE; 24th Ave NE; 26th Ave NE; NE 96th St; Burke Gilman Trl; NE 127th St; 31st Ave NE; Exeter Ave NE; 41st Ave NE; NE 133rd St; 37th Ave NE; NE 104th St; Lakeside Ave NE; Bartlett Ave NE; Ravenna Ave NE; 23rd Pl NE; Alton Ave NE; NE Northgate Way; 33rd Ave NE; Durland Ave NE; 49th Ave NE; Lake Shore Blvd NE; 46th Ave NE; 16th Ave NE; 45th Ave NE; NE 106th St; 48th Ave NE; 44th Ave NE; NE 102nd St; 34th Ave NE; Hiram Pl NE; 43rd Pl NE; NE 89th St; NE 136th St; NE 134th St; Mathews Ave NE; NE 124th St; NE 130th Pl; 41st Pl NE; Fischer Pl NE; Lakeside Pl NE; Goodwin Way NE; NE 93rd St; Durland Pl NE; NE 109th St; NE 104th Pl; Inverness Dr NE; Pinehurst Way NE; Victory Ln NE; NE 103rd Pl; NE 88th Pl; NE 128th St; NE 104th Way; NE 142nd St; NE 118th St; Erickson Pl NE; NE 106th Pl; 42nd Pl NE; 31st Pl NE; 51st Ave NE; NE Brockman Pl; Daniel Pl NE; NE Elshin Pl; 15th Pl NE; NE 135th Pl; Westwood Pl NE; NE 105th Pl; NE 126th St; NE 138th St; Alton Pl NE; NE 143rd Pl; 46th Pl NE; 29th Ave NE; NE 108th Pl; Mathews Pl NE; 33rd Pl NE; NE 108th St; NE 90th Pl; NE 122nd St; 21st Ave NE; NE 144th St; Seward Pl NE; NE 112th St; Lake View Ln NE; 18th Ave NE; Inverness Ct NE.
Other features: Thornton Crk.
Lake City neighborhood detailed profile
Area: 4.106 square miles
Population: 34,065
Population density:
| Lake City: | 8,295 people per square mile |
| Seattle: | 8,750 people per square mile |
Median household income in 2021:
| Lake City: | $119,139 |
| Seattle: | $110,781 |
Median rent in in 2021:
| Lake City: | $1,665 |
| Seattle: | $1,670 |
Male vs Females
| Males: | 17,508 |
| Females: | 16,556 |
Median age
| Males: | 41.2 years |
| Females: | 43.3 years |
Housing prices:
Average estimated value of detached houses in 2021 (74.4% of all units):
| Lake City: | $829,907 |
| Seattle: | $906,138 |
Average estimated '21 value of housing units in 5-or-more-unit structures (13.3% of all units):
| Lake City: | $397,905 |
| Seattle: | $570,782 |
Most popular occupations of males: sales and office occupations (15.7%); service occupations (13.2%); management occupations (except farmers) (13.0%); computer and mathematical occupations (8.7%); education, training, and library occupations (7.0%); architecture and engineering occupations (6.8%); construction, extraction, and maintenance occupations (6.0%)
Most popular occupations of females: sales and office occupations (16.6%); healthcare practitioners and technical occupations (14.3%); business and financial operations occupations (13.8%); management occupations (except farmers) (12.4%); education, training, and library occupations (12.4%); service occupations (12.2%); computer and mathematical occupations (3.8%)
Highways in this neighborhood: State Rte 522 (Lake City Way NE).
Roads and streets: Riviera Pl NE; Sand Point Way NE; 35th Ave NE; NE 105th St; NE 115th St; NE 125th St; 20th Ave NE; NE 135th St; NE 100th St; NE 113th St; 23rd Ave NE; 17th Ave NE; NE 95th St; NE 120th St; NE 98th St; NE 123rd St; 30th Ave NE; NE 137th St; NE 140th St; NE 110th St; 19th Ave NE; 25th Ave NE; 40th Ave NE; 39th Ave NE; NE 97th St; 28th Ave NE; 27th Ave NE; 42nd Ave NE; NE 117th St; NE 130th St; NE 103rd St; NE 143rd St; 36th Ave NE; 38th Ave NE; 32nd Ave NE; NE 107th St; 22nd Ave NE; 24th Ave NE; 26th Ave NE; NE 96th St; Burke Gilman Trl; NE 127th St; 31st Ave NE; Exeter Ave NE; 41st Ave NE; NE 133rd St; 37th Ave NE; NE 104th St; Lakeside Ave NE; Bartlett Ave NE; Ravenna Ave NE; 23rd Pl NE; Alton Ave NE; NE Northgate Way; 33rd Ave NE; Durland Ave NE; 49th Ave NE; Lake Shore Blvd NE; 46th Ave NE; 16th Ave NE; 45th Ave NE; NE 106th St; 48th Ave NE; 44th Ave NE; NE 102nd St; 34th Ave NE; Hiram Pl NE; 43rd Pl NE; NE 89th St; NE 136th St; NE 134th St; Mathews Ave NE; NE 124th St; NE 130th Pl; 41st Pl NE; Fischer Pl NE; Lakeside Pl NE; Goodwin Way NE; NE 93rd St; Durland Pl NE; NE 109th St; NE 104th Pl; Inverness Dr NE; Pinehurst Way NE; Victory Ln NE; NE 103rd Pl; NE 88th Pl; NE 128th St; NE 104th Way; NE 142nd St; NE 118th St; Erickson Pl NE; NE 106th Pl; 42nd Pl NE; 31st Pl NE; 51st Ave NE; NE Brockman Pl; Daniel Pl NE; NE Elshin Pl; 15th Pl NE; NE 135th Pl; Westwood Pl NE; NE 105th Pl; NE 126th St; NE 138th St; Alton Pl NE; NE 143rd Pl; 46th Pl NE; 29th Ave NE; NE 108th Pl; Mathews Pl NE; 33rd Pl NE; NE 108th St; NE 90th Pl; NE 122nd St; 21st Ave NE; NE 144th St; Seward Pl NE; NE 112th St; Lake View Ln NE; 18th Ave NE; Inverness Ct NE.
Other features: Thornton Crk.
Lake City neighborhood detailed profile
Lakeridge neighborhood in Seattle statistics: (Find on map)
Area: 0.697 square miles
Population: 4,445
Population density:
Median household income in 2021:
Median rent in in 2021:
Male vs Females
Median age
Housing prices:
Average estimated value of detached houses in 2021 (99.9% of all units):
Most popular occupations of males: sales and office occupations (22.7%); management occupations (except farmers) (20.7%); business and financial operations occupations (20.6%); computer and mathematical occupations (11.3%); service occupations (6.9%); production occupations (5.1%); construction, extraction, and maintenance occupations (3.9%)
Most popular occupations of females: sales and office occupations (30.5%); healthcare practitioners and technical occupations (26.5%); management occupations (except farmers) (11.8%); business and financial operations occupations (9.0%); service occupations (7.7%); production occupations (5.1%); computer and mathematical occupations (4.8%)
Roads and streets: Renton Ave S; Cornell Ave S; S Ryan St; Crestwood Dr S; Rainier Ave; Woodley Ave S; S 116th Pl; Rustic Rd S; S 115th St; S Sunnycrest Rd; S Prentice St; 68th Ave S; S Taft St; 66th Ave S; Lake Ridge Dr S; S Bangor St; S Lake Ridge Dr; Auburn Ave S; S Laurel St; 65th Ave S; Forest Ave S; S 116th St; Waters Ave S; 68th Pl S; 64th Ave S; 63rd Ave S; 69th Pl S; 71st Pl S; Parkview Ave S; 72nd Ave S; 70th Pl S; 74th Ave S; S Hazel St; 62nd Ave S; S Rustic Rd; S 120th St; 67th Ave S; S 112th Pl; 76th Ave S; S 118th Pl; Garden Pl S; S Bangor Ct; Lake Ridge Pl S; Woodward Ave S; S Fountain Pl; 72nd Pl S; 75th Ave S; S 114th St.
Lakeridge neighborhood detailed profile
Area: 0.697 square miles
Population: 4,445
Population density:
| Lakeridge: | 6,378 people per square mile |
| Seattle: | 8,750 people per square mile |
Median household income in 2021:
| Lakeridge: | $108,591 |
| Seattle: | $110,781 |
Median rent in in 2021:
| Lakeridge: | $2,902 |
| Seattle: | $1,670 |
Male vs Females
| Males: | 2,213 |
| Females: | 2,231 |
Median age
| Males: | 41.6 years |
| Females: | 52.9 years |
Housing prices:
Average estimated value of detached houses in 2021 (99.9% of all units):
| Lakeridge: | $585,027 |
| Seattle: | $906,138 |
Most popular occupations of males: sales and office occupations (22.7%); management occupations (except farmers) (20.7%); business and financial operations occupations (20.6%); computer and mathematical occupations (11.3%); service occupations (6.9%); production occupations (5.1%); construction, extraction, and maintenance occupations (3.9%)
Most popular occupations of females: sales and office occupations (30.5%); healthcare practitioners and technical occupations (26.5%); management occupations (except farmers) (11.8%); business and financial operations occupations (9.0%); service occupations (7.7%); production occupations (5.1%); computer and mathematical occupations (4.8%)
Roads and streets: Renton Ave S; Cornell Ave S; S Ryan St; Crestwood Dr S; Rainier Ave; Woodley Ave S; S 116th Pl; Rustic Rd S; S 115th St; S Sunnycrest Rd; S Prentice St; 68th Ave S; S Taft St; 66th Ave S; Lake Ridge Dr S; S Bangor St; S Lake Ridge Dr; Auburn Ave S; S Laurel St; 65th Ave S; Forest Ave S; S 116th St; Waters Ave S; 68th Pl S; 64th Ave S; 63rd Ave S; 69th Pl S; 71st Pl S; Parkview Ave S; 72nd Ave S; 70th Pl S; 74th Ave S; S Hazel St; 62nd Ave S; S Rustic Rd; S 120th St; 67th Ave S; S 112th Pl; 76th Ave S; S 118th Pl; Garden Pl S; S Bangor Ct; Lake Ridge Pl S; Woodward Ave S; S Fountain Pl; 72nd Pl S; 75th Ave S; S 114th St.
Lakeridge neighborhood detailed profile
Laurelhurst neighborhood in Seattle statistics: (Find on map)
Area: 0.845 square miles
Population: 1,899
Population density:
Median household income in 2021:
Median rent in in 2021:
Male vs Females
Median age
Housing prices:
Average estimated value of detached houses in 2021 (65.1% of all units):
Average estimated value of townhouses or other attached units in 2021 (4.8% of all units):
Average estimated '21 value of housing units in 5-or-more-unit structures (12.0% of all units):
Most popular occupations of males: management occupations (except farmers) (45.7%); business and financial operations occupations (21.3%); transportation occupations (16.4%); construction, extraction, and maintenance occupations (13.9%); computer and mathematical occupations (11.7%); education, training, and library occupations (11.2%); legal occupations (8.9%)
Most popular occupations of females: management occupations (except farmers) (16.1%); healthcare practitioners and technical occupations (15.2%); sales and office occupations (14.9%); arts, design, entertainment, sports, and media occupations (14.0%); business and financial operations occupations (9.2%); community and social services occupations (8.9%); life, physical, and social science occupations (7.7%)
Highways in this neighborhood: Sand Point Way NE (State Rte 513).
Roads and streets: NE 45th St; 43rd Ave NE; NE 41st St; 48th Ave NE; 46th Ave NE; 47th Ave NE; 45th Ave NE; 50th Ave NE; W Laurelhurst Dr NE; 42nd Ave NE; NE 44th St; NE 50th St; E Laurelhurst Dr NE; 49th Ave NE; NE 38th St; 51st Ave NE; NE 47th St; NE 43rd St; NE 40th St; NE 54th St; NE 39th St; 44th Ave NE; NE 42nd St; NE 33rd St; NE 35th St; NE Laurelcrest Ln; 41st Ave NE; Ivanhoe Pl NE; 55th Ave NE; 54th Ave NE; 53rd Ave NE; NE 52nd St; 52nd Ave NE; NE 55th St; 47th Pl NE; 38th Ave NE; NE 36th St; NE Belvoir Pl; Surber Dr NE; Webster Point Rd NE; 40th Ave NE; NE 32nd St; NE 46th St; E Laurel Dr NE; 39th Pl NE; 48th Pl NE; NE 31st St; Princeton Ave NE; W Laurel Dr NE.
Laurelhurst neighborhood detailed profile
Area: 0.845 square miles
Population: 1,899
Population density:
| Laurelhurst (Sandpoint): | 2,246 people per square mile |
| Seattle: | 8,750 people per square mile |
Median household income in 2021:
| Laurelhurst (Sandpoint): | $220,625 |
| Seattle: | $110,781 |
Median rent in in 2021:
| Laurelhurst (Sandpoint): | $1,852 |
| Seattle: | $1,670 |
Male vs Females
| Males: | 910 |
| Females: | 988 |
Median age
| Males: | 18.0 years |
| Females: | 44.0 years |
Housing prices:
Average estimated value of detached houses in 2021 (65.1% of all units):
| Laurelhurst (Sandpoint): | $5,337,026 |
| Seattle: | $906,138 |
Average estimated value of townhouses or other attached units in 2021 (4.8% of all units):
| This neighborhood: | $1,007,143 |
| city: | $615,733 |
Average estimated '21 value of housing units in 5-or-more-unit structures (12.0% of all units):
| Laurelhurst (Sandpoint): | $1,439,301 |
| Seattle: | $570,782 |
Most popular occupations of males: management occupations (except farmers) (45.7%); business and financial operations occupations (21.3%); transportation occupations (16.4%); construction, extraction, and maintenance occupations (13.9%); computer and mathematical occupations (11.7%); education, training, and library occupations (11.2%); legal occupations (8.9%)
Most popular occupations of females: management occupations (except farmers) (16.1%); healthcare practitioners and technical occupations (15.2%); sales and office occupations (14.9%); arts, design, entertainment, sports, and media occupations (14.0%); business and financial operations occupations (9.2%); community and social services occupations (8.9%); life, physical, and social science occupations (7.7%)
Highways in this neighborhood: Sand Point Way NE (State Rte 513).
Roads and streets: NE 45th St; 43rd Ave NE; NE 41st St; 48th Ave NE; 46th Ave NE; 47th Ave NE; 45th Ave NE; 50th Ave NE; W Laurelhurst Dr NE; 42nd Ave NE; NE 44th St; NE 50th St; E Laurelhurst Dr NE; 49th Ave NE; NE 38th St; 51st Ave NE; NE 47th St; NE 43rd St; NE 40th St; NE 54th St; NE 39th St; 44th Ave NE; NE 42nd St; NE 33rd St; NE 35th St; NE Laurelcrest Ln; 41st Ave NE; Ivanhoe Pl NE; 55th Ave NE; 54th Ave NE; 53rd Ave NE; NE 52nd St; 52nd Ave NE; NE 55th St; 47th Pl NE; 38th Ave NE; NE 36th St; NE Belvoir Pl; Surber Dr NE; Webster Point Rd NE; 40th Ave NE; NE 32nd St; NE 46th St; E Laurel Dr NE; 39th Pl NE; 48th Pl NE; NE 31st St; Princeton Ave NE; W Laurel Dr NE.
Laurelhurst neighborhood detailed profile
Lawton Park neighborhood in Seattle statistics: (Find on map)
Area: 2.110 square miles
Population: 8,301
Population density:
Median household income in 2021:
Median rent in in 2021:
Male vs Females
Median age
Housing prices:
Average estimated value of detached houses in 2021 (36.8% of all units):
Average estimated value of townhouses or other attached units in 2021 (15.1% of all units):
Average estimated '21 value of housing units in 5-or-more-unit structures (28.9% of all units):
Most popular occupations of males: computer and mathematical occupations (25.3%); management occupations (except farmers) (20.6%); sales and office occupations (9.6%); life, physical, and social science occupations (9.0%); service occupations (6.0%); business and financial operations occupations (5.8%); architecture and engineering occupations (4.0%)
Most popular occupations of females: management occupations (except farmers) (17.8%); sales and office occupations (15.1%); computer and mathematical occupations (13.1%); business and financial operations occupations (11.4%); education, training, and library occupations (9.5%); arts, design, entertainment, sports, and media occupations (8.8%); service occupations (8.4%)
Roads and streets: W Emerson St; Utah Ave; Washington Ave; W Bertona St; 32nd Ave W; 30th Ave W; 35th Ave W; 34th Ave W; W Thurman St; 33rd Ave W; W Ruffner St; W Dravus St; 31st Ave W; W Elmore St; 36th Ave W; Washington Ave (W Government Way); Texas Way; 29th Ave W; W Cramer St; W Commodore Way; 28th Ave W; 24th Ave W; Oregon Ave; W Lawton St; W Sheridan St; 40th Ave W; W Barrett St; W Jameson St; 42nd Ave W; Hawaii Cir; 23rd Ave W; 25th Ave W; W Manor Pl; Williams Ave W; 26th Ave W; W Grover St; Illinois Ave; 27th Ave W; 39th Ave W; 22nd Ave W; W Tilden St; Alaska Ave; Lighthouse and Sewer Plant Parking; 45th Ave W; W Mansell St; 26th Pl W; 28th Pl W; W Fort St; 27th Pl W; Burton Pl W; W McCord Pl; Colorado Ave; W Brygger Dr; Whalley Pl W; 21st Ave W; 25th Pl W; Gay Ave W; 24th Pl W; 46th Ave W; W Elmore Pl; W View Pl; 47th Ave W; Montana Cir; Lawton Ln W; 43rd Ave W; Gilman Ave N; Gilman Ave W; W Parry Way; W Semple St; Lawtonwood Rd; W Ohman Pl; W Hooker St; 41st Ave W; Brygger Dr; Lawtonwood Rd W; Elmore St Stairs.
Railroad features: Burlington Northern Santa Fe Rlwy.
Lawton Park neighborhood detailed profile
Area: 2.110 square miles
Population: 8,301
Population density:
| Lawton Park: | 3,933 people per square mile |
| Seattle: | 8,750 people per square mile |
Median household income in 2021:
| Lawton Park: | $147,449 |
| Seattle: | $110,781 |
Median rent in in 2021:
| Lawton Park: | $1,947 |
| Seattle: | $1,670 |
Male vs Females
| Males: | 4,644 |
| Females: | 3,656 |
Median age
| Males: | 39.1 years |
| Females: | 41.1 years |
Housing prices:
Average estimated value of detached houses in 2021 (36.8% of all units):
| Lawton Park: | $972,755 |
| Seattle: | $906,138 |
Average estimated value of townhouses or other attached units in 2021 (15.1% of all units):
| This neighborhood: | $609,813 |
| city: | $615,733 |
Average estimated '21 value of housing units in 5-or-more-unit structures (28.9% of all units):
| Lawton Park: | $260,102 |
| Seattle: | $570,782 |
Most popular occupations of males: computer and mathematical occupations (25.3%); management occupations (except farmers) (20.6%); sales and office occupations (9.6%); life, physical, and social science occupations (9.0%); service occupations (6.0%); business and financial operations occupations (5.8%); architecture and engineering occupations (4.0%)
Most popular occupations of females: management occupations (except farmers) (17.8%); sales and office occupations (15.1%); computer and mathematical occupations (13.1%); business and financial operations occupations (11.4%); education, training, and library occupations (9.5%); arts, design, entertainment, sports, and media occupations (8.8%); service occupations (8.4%)
Roads and streets: W Emerson St; Utah Ave; Washington Ave; W Bertona St; 32nd Ave W; 30th Ave W; 35th Ave W; 34th Ave W; W Thurman St; 33rd Ave W; W Ruffner St; W Dravus St; 31st Ave W; W Elmore St; 36th Ave W; Washington Ave (W Government Way); Texas Way; 29th Ave W; W Cramer St; W Commodore Way; 28th Ave W; 24th Ave W; Oregon Ave; W Lawton St; W Sheridan St; 40th Ave W; W Barrett St; W Jameson St; 42nd Ave W; Hawaii Cir; 23rd Ave W; 25th Ave W; W Manor Pl; Williams Ave W; 26th Ave W; W Grover St; Illinois Ave; 27th Ave W; 39th Ave W; 22nd Ave W; W Tilden St; Alaska Ave; Lighthouse and Sewer Plant Parking; 45th Ave W; W Mansell St; 26th Pl W; 28th Pl W; W Fort St; 27th Pl W; Burton Pl W; W McCord Pl; Colorado Ave; W Brygger Dr; Whalley Pl W; 21st Ave W; 25th Pl W; Gay Ave W; 24th Pl W; 46th Ave W; W Elmore Pl; W View Pl; 47th Ave W; Montana Cir; Lawton Ln W; 43rd Ave W; Gilman Ave N; Gilman Ave W; W Parry Way; W Semple St; Lawtonwood Rd; W Ohman Pl; W Hooker St; 41st Ave W; Brygger Dr; Lawtonwood Rd W; Elmore St Stairs.
Railroad features: Burlington Northern Santa Fe Rlwy.
Lawton Park neighborhood detailed profile
Leschi neighborhood in Seattle statistics: (Find on map)
Area: 0.714 square miles
Population: 7,931
Population density:
Median household income in 2021:
Median rent in in 2021:
Male vs Females
Median age
Housing prices:
Average estimated value of detached houses in 2021 (62.1% of all units):
Average estimated value of townhouses or other attached units in 2021 (21.7% of all units):
Most popular occupations of males: management occupations (except farmers) (24.4%); service occupations (16.3%); sales and office occupations (13.8%); computer and mathematical occupations (12.1%); arts, design, entertainment, sports, and media occupations (6.1%); legal occupations (4.9%); healthcare practitioners and technical occupations (3.7%)
Most popular occupations of females: service occupations (18.4%); sales and office occupations (14.4%); management occupations (except farmers) (12.2%); education, training, and library occupations (12.0%); business and financial operations occupations (10.4%); healthcare practitioners and technical occupations (9.2%); arts, design, entertainment, sports, and media occupations (6.7%)
Roads and streets: Lake Washington Blvd S; Lakeside Ave S; 31st Ave S; 32nd Ave S; 29th Ave S; 30th Ave S; E Terrace St; E Alder St; E Spruce St; S King St; S Irving St; 28th Ave S; S Dearborn St; E Yesler Way; Lake Washington Blvd; S Charles St; S Judkins St; 33rd Ave S; S Lane St; 35th Ave S; E Jefferson St; S Norman St; S Washington St; Lake Dell Ave; E James St; Erie Ave; S Main St; E Superior St; Yakima Ave S; S Jackson St; 30th Ave; 29th Ave; 31st Ave; 32nd Ave; S Frink Pl; 28th Ave; E Huron St; S Leschi Pl; 33rd Ave; Randolph Ave; Euclid Ave; Bradner Pl S; Yakima Pl S; 34th Ave; 34th Ave S; Randolph Pl; S Elmwood Pl; Wellington Ave; Lakeside Ave; 37th Ave; E Conover Ct; S Parkland Pl; 35th Ave; Power Ave; 36th Ave; Martin Luther King Way S.
Leschi neighborhood detailed profile
Area: 0.714 square miles
Population: 7,931
Population density:
| Leschi: | 11,102 people per square mile |
| Seattle: | 8,750 people per square mile |
Median household income in 2021:
| Leschi: | $154,696 |
| Seattle: | $110,781 |
Median rent in in 2021:
| Leschi: | $2,048 |
| Seattle: | $1,670 |
Male vs Females
| Males: | 4,135 |
| Females: | 3,796 |
Median age
| Males: | 40.2 years |
| Females: | 41.0 years |
Housing prices:
Average estimated value of detached houses in 2021 (62.1% of all units):
| Leschi: | $964,998 |
| Seattle: | $906,138 |
Average estimated value of townhouses or other attached units in 2021 (21.7% of all units):
| This neighborhood: | $711,404 |
| city: | $615,733 |
Most popular occupations of males: management occupations (except farmers) (24.4%); service occupations (16.3%); sales and office occupations (13.8%); computer and mathematical occupations (12.1%); arts, design, entertainment, sports, and media occupations (6.1%); legal occupations (4.9%); healthcare practitioners and technical occupations (3.7%)
Most popular occupations of females: service occupations (18.4%); sales and office occupations (14.4%); management occupations (except farmers) (12.2%); education, training, and library occupations (12.0%); business and financial operations occupations (10.4%); healthcare practitioners and technical occupations (9.2%); arts, design, entertainment, sports, and media occupations (6.7%)
Roads and streets: Lake Washington Blvd S; Lakeside Ave S; 31st Ave S; 32nd Ave S; 29th Ave S; 30th Ave S; E Terrace St; E Alder St; E Spruce St; S King St; S Irving St; 28th Ave S; S Dearborn St; E Yesler Way; Lake Washington Blvd; S Charles St; S Judkins St; 33rd Ave S; S Lane St; 35th Ave S; E Jefferson St; S Norman St; S Washington St; Lake Dell Ave; E James St; Erie Ave; S Main St; E Superior St; Yakima Ave S; S Jackson St; 30th Ave; 29th Ave; 31st Ave; 32nd Ave; S Frink Pl; 28th Ave; E Huron St; S Leschi Pl; 33rd Ave; Randolph Ave; Euclid Ave; Bradner Pl S; Yakima Pl S; 34th Ave; 34th Ave S; Randolph Pl; S Elmwood Pl; Wellington Ave; Lakeside Ave; 37th Ave; E Conover Ct; S Parkland Pl; 35th Ave; Power Ave; 36th Ave; Martin Luther King Way S.
Leschi neighborhood detailed profile
Lower Queen Anne neighborhood in Seattle statistics: (Find on map)
Area: 0.620 square miles
Population: 11,593
Population density:
Median household income in 2021:
Median rent in in 2021:
Male vs Females
Median age
Housing prices:
Average estimated value of detached houses in 2021 (46.2% of all units):
Average estimated '21 value of housing units in 5-or-more-unit structures (11.7% of all units):
Most popular occupations of males: management occupations (except farmers) (23.2%); sales and office occupations (17.0%); computer and mathematical occupations (14.6%); business and financial operations occupations (12.6%); legal occupations (6.7%); arts, design, entertainment, sports, and media occupations (6.3%); service occupations (5.5%)
Most popular occupations of females: sales and office occupations (26.9%); management occupations (except farmers) (22.1%); service occupations (11.2%); business and financial operations occupations (7.3%); arts, design, entertainment, sports, and media occupations (7.3%); education, training, and library occupations (7.1%); healthcare practitioners and technical occupations (5.8%)
Highways in this neighborhood: State Rte 99 (Aurora Ave N).
Roads and streets: Valley St; Mercer St; Ward St; Aloha St; Roy St; 1st Ave W; Queen Anne Ave N; 2nd Ave W; 3rd Ave W; 5th Ave N; 1st Ave N; W Olympic Pl; W Roy St; W Mercer St; Harrison St; W Republican St; 4th Ave W; Warren Ave N; Republican St; W Harrison St; W Lee St; W Comstock St; W Highland Dr; W Prospect St; Thomas St; 2nd Ave N; 4th Ave N; W Kinnear Pl; W Galer St; W Thomas St; John St; Taylor Ave N; 3rd Ave N; 6th Ave N; Broad St; 5th Ave W; Nob Hill Ave N; 6th Ave W; W Mercer Pl; Queen Anne Way; W John St; W Aloha St; Ward Pl; Western Ave W.
Lower Queen Anne neighborhood detailed profile
Area: 0.620 square miles
Population: 11,593
Population density:
| Lower Queen Anne: | 18,712 people per square mile |
| Seattle: | 8,750 people per square mile |
Median household income in 2021:
| Lower Queen Anne: | $188,075 |
| Seattle: | $110,781 |
Median rent in in 2021:
| Lower Queen Anne: | $2,117 |
| Seattle: | $1,670 |
Male vs Females
| Males: | 5,425 |
| Females: | 6,167 |
Median age
| Males: | 41.0 years |
| Females: | 40.9 years |
Housing prices:
Average estimated value of detached houses in 2021 (46.2% of all units):
| Lower Queen Anne: | $2,550,593 |
| Seattle: | $906,138 |
Average estimated '21 value of housing units in 5-or-more-unit structures (11.7% of all units):
| Lower Queen Anne: | $1,059,887 |
| Seattle: | $570,782 |
Most popular occupations of males: management occupations (except farmers) (23.2%); sales and office occupations (17.0%); computer and mathematical occupations (14.6%); business and financial operations occupations (12.6%); legal occupations (6.7%); arts, design, entertainment, sports, and media occupations (6.3%); service occupations (5.5%)
Most popular occupations of females: sales and office occupations (26.9%); management occupations (except farmers) (22.1%); service occupations (11.2%); business and financial operations occupations (7.3%); arts, design, entertainment, sports, and media occupations (7.3%); education, training, and library occupations (7.1%); healthcare practitioners and technical occupations (5.8%)
Highways in this neighborhood: State Rte 99 (Aurora Ave N).
Roads and streets: Valley St; Mercer St; Ward St; Aloha St; Roy St; 1st Ave W; Queen Anne Ave N; 2nd Ave W; 3rd Ave W; 5th Ave N; 1st Ave N; W Olympic Pl; W Roy St; W Mercer St; Harrison St; W Republican St; 4th Ave W; Warren Ave N; Republican St; W Harrison St; W Lee St; W Comstock St; W Highland Dr; W Prospect St; Thomas St; 2nd Ave N; 4th Ave N; W Kinnear Pl; W Galer St; W Thomas St; John St; Taylor Ave N; 3rd Ave N; 6th Ave N; Broad St; 5th Ave W; Nob Hill Ave N; 6th Ave W; W Mercer Pl; Queen Anne Way; W John St; W Aloha St; Ward Pl; Western Ave W.
Lower Queen Anne neighborhood detailed profile
Loyal Heights neighborhood in Seattle statistics: (Find on map)
Area: 0.767 square miles
Population: 13,619
Population density:
Median household income in 2021:
Median rent in in 2021:
Male vs Females
Median age
Average estimated value of detached houses in 2021 (79.9% of all units):
Most popular occupations of males: management occupations (except farmers) (25.0%); computer and mathematical occupations (20.0%); sales and office occupations (7.9%); service occupations (6.8%); construction, extraction, and maintenance occupations (6.1%); business and financial operations occupations (5.7%); education, training, and library occupations (5.4%)
Most popular occupations of females: sales and office occupations (22.8%); education, training, and library occupations (20.5%); management occupations (except farmers) (12.4%); business and financial operations occupations (10.2%); service occupations (9.8%); arts, design, entertainment, sports, and media occupations (7.5%); healthcare practitioners and technical occupations (6.4%)
Roads and streets: NW 65th St; NW 83rd St; NW 80th St; NW 75th St; NW 77th St; NW 73rd St; Earl Ave NW; 27th Ave NW; 26th Ave NW; 24th Ave NW; 25th Ave NW; Jones Ave NW; 23rd Ave NW; NW 67th St; 15th Ave NW; NW 70th St; 16th Ave NW; 17th Ave NW; 18th Ave NW; 22nd Ave NW; 19th Ave NW; 20th Ave NW; 21st Ave NW; NW 85th St; NW Canoe Pl; NW Sloop Pl.
Loyal Heights neighborhood detailed profile
Area: 0.767 square miles
Population: 13,619
Population density:
| Loyal Heights: | 17,748 people per square mile |
| Seattle: | 8,750 people per square mile |
Median household income in 2021:
| Loyal Heights: | $162,895 |
| Seattle: | $110,781 |
Median rent in in 2021:
| Loyal Heights: | $2,383 |
| Seattle: | $1,670 |
Male vs Females
| Males: | 6,358 |
| Females: | 7,260 |
Median age
| Males: | 40.8 years |
| Females: | 42.3 years |
Average estimated value of detached houses in 2021 (79.9% of all units):
| Loyal Heights: | $806,922 |
| Seattle: | $906,138 |
Most popular occupations of males: management occupations (except farmers) (25.0%); computer and mathematical occupations (20.0%); sales and office occupations (7.9%); service occupations (6.8%); construction, extraction, and maintenance occupations (6.1%); business and financial operations occupations (5.7%); education, training, and library occupations (5.4%)
Most popular occupations of females: sales and office occupations (22.8%); education, training, and library occupations (20.5%); management occupations (except farmers) (12.4%); business and financial operations occupations (10.2%); service occupations (9.8%); arts, design, entertainment, sports, and media occupations (7.5%); healthcare practitioners and technical occupations (6.4%)
Roads and streets: NW 65th St; NW 83rd St; NW 80th St; NW 75th St; NW 77th St; NW 73rd St; Earl Ave NW; 27th Ave NW; 26th Ave NW; 24th Ave NW; 25th Ave NW; Jones Ave NW; 23rd Ave NW; NW 67th St; 15th Ave NW; NW 70th St; 16th Ave NW; 17th Ave NW; 18th Ave NW; 22nd Ave NW; 19th Ave NW; 20th Ave NW; 21st Ave NW; NW 85th St; NW Canoe Pl; NW Sloop Pl.
Loyal Heights neighborhood detailed profile
Madison Park neighborhood in Seattle statistics: (Find on map)
Area: 1.066 square miles
Population: 4,655
Population density:
Median household income in 2021:
Median rent in in 2021:
Male vs Females
Median age
Housing prices:
Average estimated value of detached houses in 2021 (71.1% of all units):
Average estimated value of townhouses or other attached units in 2021 (4.8% of all units):
Average estimated '21 value of housing units in 5-or-more-unit structures (16.7% of all units):
Most popular occupations of males: management occupations (except farmers) (34.3%); sales and office occupations (11.8%); healthcare practitioners and technical occupations (10.0%); computer and mathematical occupations (9.4%); business and financial operations occupations (8.7%); architecture and engineering occupations (4.2%); transportation occupations (4.0%)
Most popular occupations of females: management occupations (except farmers) (20.3%); sales and office occupations (14.3%); healthcare practitioners and technical occupations (12.7%); legal occupations (9.5%); service occupations (8.5%); arts, design, entertainment, sports, and media occupations (7.1%); business and financial operations occupations (6.7%)
Highways in this neighborhood: State Rte 520; Evergreen Point Floating Brg (State Rte 520).
Roads and streets: E Madison St; Broadmoor Dr E; Arboretum Dr E; 42nd Ave E; 41st Ave E; Parkside Dr E; 38th Ave E; Shenandoah Dr E; McGilvra Blvd E; 39th Ave E; E Garfield St; E Mc Gilvra St; E Lee St; 43rd Ave E; E Newton St; E Blaine St; 40th Ave E; E Galer St; 37th Ave E; E Lynn St; E Howe St; E Shore Dr; E Mc Graw St; Blenheim Dr E; E Highland Dr; E St Andrews Way; Park Trl; 31st Ave E; Lake Washington Blvd E; Waverly Way E; 32nd Ave E; 37th Pl E; Lexington Dr E; Woodrow Pl E; 38th Pl E; E Ward St; Windermere Dr E; E Boston St; E Crockett St; E Morley Way; 33rd Ave E; Washington Pl E; Canterbury Ln E; E Edgewater Pl; E Foster Island Rd; E Saint Andrews Way; Knox Pl E; E McGilvra St.
Madison Park neighborhood detailed profile
Area: 1.066 square miles
Population: 4,655
Population density:
| Madison Park: | 4,365 people per square mile |
| Seattle: | 8,750 people per square mile |
Median household income in 2021:
| Madison Park: | $181,729 |
| Seattle: | $110,781 |
Median rent in in 2021:
| Madison Park: | $2,333 |
| Seattle: | $1,670 |
Male vs Females
| Males: | 2,296 |
| Females: | 2,359 |
Median age
| Males: | 38.6 years |
| Females: | 45.8 years |
Housing prices:
Average estimated value of detached houses in 2021 (71.1% of all units):
| Madison Park: | $1,987,463 |
| Seattle: | $906,138 |
Average estimated value of townhouses or other attached units in 2021 (4.8% of all units):
| This neighborhood: | $1,007,143 |
| city: | $615,733 |
Average estimated '21 value of housing units in 5-or-more-unit structures (16.7% of all units):
| Madison Park: | $636,849 |
| Seattle: | $570,782 |
Most popular occupations of males: management occupations (except farmers) (34.3%); sales and office occupations (11.8%); healthcare practitioners and technical occupations (10.0%); computer and mathematical occupations (9.4%); business and financial operations occupations (8.7%); architecture and engineering occupations (4.2%); transportation occupations (4.0%)
Most popular occupations of females: management occupations (except farmers) (20.3%); sales and office occupations (14.3%); healthcare practitioners and technical occupations (12.7%); legal occupations (9.5%); service occupations (8.5%); arts, design, entertainment, sports, and media occupations (7.1%); business and financial operations occupations (6.7%)
Highways in this neighborhood: State Rte 520; Evergreen Point Floating Brg (State Rte 520).
Roads and streets: E Madison St; Broadmoor Dr E; Arboretum Dr E; 42nd Ave E; 41st Ave E; Parkside Dr E; 38th Ave E; Shenandoah Dr E; McGilvra Blvd E; 39th Ave E; E Garfield St; E Mc Gilvra St; E Lee St; 43rd Ave E; E Newton St; E Blaine St; 40th Ave E; E Galer St; 37th Ave E; E Lynn St; E Howe St; E Shore Dr; E Mc Graw St; Blenheim Dr E; E Highland Dr; E St Andrews Way; Park Trl; 31st Ave E; Lake Washington Blvd E; Waverly Way E; 32nd Ave E; 37th Pl E; Lexington Dr E; Woodrow Pl E; 38th Pl E; E Ward St; Windermere Dr E; E Boston St; E Crockett St; E Morley Way; 33rd Ave E; Washington Pl E; Canterbury Ln E; E Edgewater Pl; E Foster Island Rd; E Saint Andrews Way; Knox Pl E; E McGilvra St.
Madison Park neighborhood detailed profile
Madrona neighborhood in Seattle statistics: (Find on map)
Area: 0.527 square miles
Population: 6,448
Population density:
Median household income in 2021:
Median rent in in 2021:
Male vs Females
Median age
Housing prices:
Average estimated value of detached houses in 2021 (74.7% of all units):
Average estimated value of townhouses or other attached units in 2021 (11.5% of all units):
Average estimated value of housing units in 2-unit structures in 2021 (6.1% of all units):
Average estimated '21 value of housing units in 5-or-more-unit structures (3.6% of all units):
Most popular occupations of males: management occupations (except farmers) (21.3%); service occupations (14.5%); computer and mathematical occupations (13.1%); business and financial operations occupations (11.9%); sales and office occupations (10.6%); healthcare practitioners and technical occupations (6.0%); education, training, and library occupations (4.8%)
Most popular occupations of females: healthcare practitioners and technical occupations (19.9%); service occupations (14.7%); management occupations (except farmers) (10.8%); education, training, and library occupations (10.1%); sales and office occupations (9.9%); business and financial operations occupations (9.6%); computer and mathematical occupations (5.5%)
Roads and streets: 30th Ave; Lake Washington Blvd; E Olive St; E Howell St; 34th Ave; E Pike St; 36th Ave; 33rd Ave; 32nd Ave; E Pine St; 29th Ave; 35th Ave; 38th Ave; 31st Ave; E Columbia St; 37th Ave; E Union St; E Marion St; E Spring St; Grand Ave; Madrona Dr; Newport Way; 39th Ave; E Arlington Pl; E Cherry St; Fullerton Ave; E Howell Pl; 40th Ave; Evergreen Pl; Wellington Ave; E Olive Ln; E Schubert Pl; Randolph Ave; Madrona Park.
Madrona neighborhood detailed profile
Area: 0.527 square miles
Population: 6,448
Population density:
| Madrona: | 12,237 people per square mile |
| Seattle: | 8,750 people per square mile |
Median household income in 2021:
| Madrona: | $162,616 |
| Seattle: | $110,781 |
Median rent in in 2021:
| Madrona: | $2,231 |
| Seattle: | $1,670 |
Male vs Females
| Males: | 2,872 |
| Females: | 3,576 |
Median age
| Males: | 40.9 years |
| Females: | 40.2 years |
Housing prices:
Average estimated value of detached houses in 2021 (74.7% of all units):
| Madrona: | $1,124,359 |
| Seattle: | $906,138 |
Average estimated value of townhouses or other attached units in 2021 (11.5% of all units):
| This neighborhood: | $917,877 |
| city: | $615,733 |
Average estimated value of housing units in 2-unit structures in 2021 (6.1% of all units):
| This neighborhood: | $806,250 |
| Seattle: | $793,396 |
Average estimated '21 value of housing units in 5-or-more-unit structures (3.6% of all units):
| Madrona: | $706,290 |
| Seattle: | $570,782 |
Most popular occupations of males: management occupations (except farmers) (21.3%); service occupations (14.5%); computer and mathematical occupations (13.1%); business and financial operations occupations (11.9%); sales and office occupations (10.6%); healthcare practitioners and technical occupations (6.0%); education, training, and library occupations (4.8%)
Most popular occupations of females: healthcare practitioners and technical occupations (19.9%); service occupations (14.7%); management occupations (except farmers) (10.8%); education, training, and library occupations (10.1%); sales and office occupations (9.9%); business and financial operations occupations (9.6%); computer and mathematical occupations (5.5%)
Roads and streets: 30th Ave; Lake Washington Blvd; E Olive St; E Howell St; 34th Ave; E Pike St; 36th Ave; 33rd Ave; 32nd Ave; E Pine St; 29th Ave; 35th Ave; 38th Ave; 31st Ave; E Columbia St; 37th Ave; E Union St; E Marion St; E Spring St; Grand Ave; Madrona Dr; Newport Way; 39th Ave; E Arlington Pl; E Cherry St; Fullerton Ave; E Howell Pl; 40th Ave; Evergreen Pl; Wellington Ave; E Olive Ln; E Schubert Pl; Randolph Ave; Madrona Park.
Madrona neighborhood detailed profile
Magnolia neighborhood in Seattle statistics: (Find on map)
Area: 3.785 square miles
Population: 18,080
Population density:
Median household income in 2021:
Median rent in in 2021:
Male vs Females
Median age
Housing prices:
Average estimated value of detached houses in 2021 (58.3% of all units):
Average estimated value of townhouses or other attached units in 2021 (11.8% of all units):
Average estimated '21 value of housing units in 5-or-more-unit structures (26.8% of all units):
Most popular occupations of males: management occupations (except farmers) (20.3%); computer and mathematical occupations (19.0%); sales and office occupations (10.1%); business and financial operations occupations (7.0%); architecture and engineering occupations (5.5%); life, physical, and social science occupations (5.5%); education, training, and library occupations (5.5%)
Most popular occupations of females: management occupations (except farmers) (17.4%); sales and office occupations (15.9%); business and financial operations occupations (13.4%); computer and mathematical occupations (12.2%); service occupations (8.7%); healthcare practitioners and technical occupations (8.4%); arts, design, entertainment, sports, and media occupations (6.9%)
Roads and streets: Magnolia Blvd W; W Bertona St; W Dravus St; W Armour St; 32nd Ave W; 30th Ave W; 36th Ave W; W Ruffner St; 29th Ave W; W Emerson St; 35th Ave W; Perkins Ln W; 34th Ave W; 28th Ave W; 31st Ave W; Utah Ave; W Barrett St; W Raye St; Washington Ave; 26th Ave W; W Viewmont Way W; 25th Ave W; 24th Ave W; W Mc Graw St; 42nd Ave W; W Smith St; 33rd Ave W; 43rd Ave W; 40th Ave W; W Howe St; 27th Ave W; 39th Ave W; W Thurman St; Constance Dr W; W Elmore St; 37th Ave W; 23rd Ave W; Washington Ave (W Government Way); Texas Way; 38th Ave W; W Cramer St; W Commodore Way; W Crockett St; W Lynn St; W Blaine St; Condon Way W; 45th Ave W; Oregon Ave; W Boston St; W Lawton St; 22nd Ave W; W Sheridan St; W Halladay St; Montavista Pl W; Westmont Way W; W Fulton St; W Jameson St; W Parkmont Pl; Hawaii Cir; 21st Ave W; Viewmont Way W; W Newton St; W Manor Pl; Williams Ave W; W Tilden St; Arapahoe Pl W; 44th Ave W; Crestmont Pl W; Rosemont Pl W; W Grover St; Altavista Pl W; W Garfield St; W Prosper St; W Hayes St; 46th Ave W; Clise Pl W; Mountain Dr W; Illinois Ave; W Lynn Pl; W Mc Laren St; Piedmont Pl W; Edgemont Pl W; W Wheeler St; W Galer St; Alaska Ave; Crane Dr W; Eyers Pl W; Morley Pl W; Lighthouse and Sewer Plant Parking; W Eaton St; Thorndyke Ave W; W Mansell St; 26th Pl W; 28th Pl W; Eastmont Way W; W Fort St; Ellinor Dr W; 27th Pl W; W Plymouth St; W Marina Pl; W Montfort Pl; Burton Pl W; Logan Ave W; W Glenmont Ln; 41st Ave W; W Roberts Way; W McCord Pl; Colorado Ave; Montvale Pl W; W Brygger Dr; Whalley Pl W; 25th Pl W; Bishop Pl W; Gay Ave W; 24th Pl W; W Elmore Pl; W View Pl; 47th Ave W; Montvale Ct W; Thorndyke Pl W; Montana Cir; Patten Pl W; Lawton Ln W; Wolfe Pl W; W Armour Pl; Soundview Dr W; Gilman Ave N; W Clise Ct; Magnolia Ln W; 34th Ct W; W Parry Way; W Semple St; Lawtonwood Rd; W Ohman Pl; W Barrett Ln; W Hooker St; Brygger Dr; Lawtonwood Rd W; Elmore St Stairs.
Railroad features: Burlington Northern Santa Fe Rlwy.
Magnolia neighborhood detailed profile
Area: 3.785 square miles
Population: 18,080
Population density:
| Magnolia: | 4,777 people per square mile |
| Seattle: | 8,750 people per square mile |
Median household income in 2021:
| Magnolia: | $155,403 |
| Seattle: | $110,781 |
Median rent in in 2021:
| Magnolia: | $1,921 |
| Seattle: | $1,670 |
Male vs Females
| Males: | 9,529 |
| Females: | 8,550 |
Median age
| Males: | 41.0 years |
| Females: | 42.7 years |
Housing prices:
Average estimated value of detached houses in 2021 (58.3% of all units):
| Magnolia: | $1,042,077 |
| Seattle: | $906,138 |
Average estimated value of townhouses or other attached units in 2021 (11.8% of all units):
| This neighborhood: | $609,813 |
| city: | $615,733 |
Average estimated '21 value of housing units in 5-or-more-unit structures (26.8% of all units):
| Magnolia: | $260,235 |
| Seattle: | $570,782 |
Most popular occupations of males: management occupations (except farmers) (20.3%); computer and mathematical occupations (19.0%); sales and office occupations (10.1%); business and financial operations occupations (7.0%); architecture and engineering occupations (5.5%); life, physical, and social science occupations (5.5%); education, training, and library occupations (5.5%)
Most popular occupations of females: management occupations (except farmers) (17.4%); sales and office occupations (15.9%); business and financial operations occupations (13.4%); computer and mathematical occupations (12.2%); service occupations (8.7%); healthcare practitioners and technical occupations (8.4%); arts, design, entertainment, sports, and media occupations (6.9%)
Roads and streets: Magnolia Blvd W; W Bertona St; W Dravus St; W Armour St; 32nd Ave W; 30th Ave W; 36th Ave W; W Ruffner St; 29th Ave W; W Emerson St; 35th Ave W; Perkins Ln W; 34th Ave W; 28th Ave W; 31st Ave W; Utah Ave; W Barrett St; W Raye St; Washington Ave; 26th Ave W; W Viewmont Way W; 25th Ave W; 24th Ave W; W Mc Graw St; 42nd Ave W; W Smith St; 33rd Ave W; 43rd Ave W; 40th Ave W; W Howe St; 27th Ave W; 39th Ave W; W Thurman St; Constance Dr W; W Elmore St; 37th Ave W; 23rd Ave W; Washington Ave (W Government Way); Texas Way; 38th Ave W; W Cramer St; W Commodore Way; W Crockett St; W Lynn St; W Blaine St; Condon Way W; 45th Ave W; Oregon Ave; W Boston St; W Lawton St; 22nd Ave W; W Sheridan St; W Halladay St; Montavista Pl W; Westmont Way W; W Fulton St; W Jameson St; W Parkmont Pl; Hawaii Cir; 21st Ave W; Viewmont Way W; W Newton St; W Manor Pl; Williams Ave W; W Tilden St; Arapahoe Pl W; 44th Ave W; Crestmont Pl W; Rosemont Pl W; W Grover St; Altavista Pl W; W Garfield St; W Prosper St; W Hayes St; 46th Ave W; Clise Pl W; Mountain Dr W; Illinois Ave; W Lynn Pl; W Mc Laren St; Piedmont Pl W; Edgemont Pl W; W Wheeler St; W Galer St; Alaska Ave; Crane Dr W; Eyers Pl W; Morley Pl W; Lighthouse and Sewer Plant Parking; W Eaton St; Thorndyke Ave W; W Mansell St; 26th Pl W; 28th Pl W; Eastmont Way W; W Fort St; Ellinor Dr W; 27th Pl W; W Plymouth St; W Marina Pl; W Montfort Pl; Burton Pl W; Logan Ave W; W Glenmont Ln; 41st Ave W; W Roberts Way; W McCord Pl; Colorado Ave; Montvale Pl W; W Brygger Dr; Whalley Pl W; 25th Pl W; Bishop Pl W; Gay Ave W; 24th Pl W; W Elmore Pl; W View Pl; 47th Ave W; Montvale Ct W; Thorndyke Pl W; Montana Cir; Patten Pl W; Lawton Ln W; Wolfe Pl W; W Armour Pl; Soundview Dr W; Gilman Ave N; W Clise Ct; Magnolia Ln W; 34th Ct W; W Parry Way; W Semple St; Lawtonwood Rd; W Ohman Pl; W Barrett Ln; W Hooker St; Brygger Dr; Lawtonwood Rd W; Elmore St Stairs.
Railroad features: Burlington Northern Santa Fe Rlwy.
Magnolia neighborhood detailed profile
Mann neighborhood in Seattle statistics: (Find on map)
Area: 0.391 square miles
Population: 7,208
Population density:
Median household income in 2021:
Median rent in in 2021:
Male vs Females
Median age
Housing prices:
Average estimated value of detached houses in 2021 (39.3% of all units):
Average estimated value of townhouses or other attached units in 2021 (17.4% of all units):
Average estimated value of housing units in 2-unit structures in 2021 (8.6% of all units):
Average estimated '21 value of housing units in 5-or-more-unit structures (3.0% of all units):
Most popular occupations of males: management occupations (except farmers) (21.2%); sales and office occupations (16.5%); computer and mathematical occupations (12.6%); business and financial operations occupations (7.6%); service occupations (6.2%); education, training, and library occupations (5.7%); arts, design, entertainment, sports, and media occupations (5.6%)
Most popular occupations of females: education, training, and library occupations (19.7%); management occupations (except farmers) (14.9%); sales and office occupations (14.9%); service occupations (12.9%); computer and mathematical occupations (10.1%); business and financial operations occupations (5.7%); life, physical, and social science occupations (4.4%)
Roads and streets: Martin Luther King Way S; 27th Ave; 26th Ave; 25th Ave; 24th Ave; E Howell St; E Olive St; E Marion St; E Pine St; E Cherry St; E Pike St; E Union St; E Columbia St; E Spring St; E Denny Way; E Fir St; E Alder St; E John St; 27th Ave E; E Jefferson St; 26th Ave E; E Thomas St; Temple Pl; 25th Ave E; E Spruce St; E Yesler Way; E Arthur Pl; E Harrison St.
Mann neighborhood detailed profile
Area: 0.391 square miles
Population: 7,208
Population density:
| Mann: | 18,445 people per square mile |
| Seattle: | 8,750 people per square mile |
Median household income in 2021:
| Mann: | $137,402 |
| Seattle: | $110,781 |
Median rent in in 2021:
| Mann: | $1,682 |
| Seattle: | $1,670 |
Male vs Females
| Males: | 3,643 |
| Females: | 3,565 |
Median age
| Males: | 35.9 years |
| Females: | 35.4 years |
Housing prices:
Average estimated value of detached houses in 2021 (39.3% of all units):
| Mann: | $1,064,815 |
| Seattle: | $906,138 |
Average estimated value of townhouses or other attached units in 2021 (17.4% of all units):
| This neighborhood: | $711,404 |
| city: | $615,733 |
Average estimated value of housing units in 2-unit structures in 2021 (8.6% of all units):
| This neighborhood: | $806,250 |
| Seattle: | $793,396 |
Average estimated '21 value of housing units in 5-or-more-unit structures (3.0% of all units):
| Mann: | $706,290 |
| Seattle: | $570,782 |
Most popular occupations of males: management occupations (except farmers) (21.2%); sales and office occupations (16.5%); computer and mathematical occupations (12.6%); business and financial operations occupations (7.6%); service occupations (6.2%); education, training, and library occupations (5.7%); arts, design, entertainment, sports, and media occupations (5.6%)
Most popular occupations of females: education, training, and library occupations (19.7%); management occupations (except farmers) (14.9%); sales and office occupations (14.9%); service occupations (12.9%); computer and mathematical occupations (10.1%); business and financial operations occupations (5.7%); life, physical, and social science occupations (4.4%)
Roads and streets: Martin Luther King Way S; 27th Ave; 26th Ave; 25th Ave; 24th Ave; E Howell St; E Olive St; E Marion St; E Pine St; E Cherry St; E Pike St; E Union St; E Columbia St; E Spring St; E Denny Way; E Fir St; E Alder St; E John St; 27th Ave E; E Jefferson St; 26th Ave E; E Thomas St; Temple Pl; 25th Ave E; E Spruce St; E Yesler Way; E Arthur Pl; E Harrison St.
Mann neighborhood detailed profile
Maple Leaf neighborhood in Seattle statistics: (Find on map)
Area: 1.258 square miles
Population: 11,765
Population density:
Median household income in 2021:
Median rent in in 2021:
Male vs Females
Median age
Housing prices:
Average estimated value of detached houses in 2021 (80.5% of all units):
Average estimated '21 value of housing units in 5-or-more-unit structures (21.9% of all units):
Most popular occupations of males: computer and mathematical occupations (18.6%); management occupations (except farmers) (17.5%); sales and office occupations (9.7%); service occupations (7.8%); architecture and engineering occupations (7.5%); life, physical, and social science occupations (6.2%); business and financial operations occupations (5.6%)
Most popular occupations of females: management occupations (except farmers) (19.3%); sales and office occupations (18.8%); service occupations (11.0%); business and financial operations occupations (9.9%); healthcare practitioners and technical occupations (9.4%); education, training, and library occupations (8.4%); computer and mathematical occupations (8.2%)
Limited-access highways (interstate or state) in this neighborhood: I- 5.
Highways in this neighborhood: State Rte 522 (Lake City Way NE).
Roads and streets: NE 90th St; NE 91st St; NE 92nd St; NE 94th St; NE 89th St; NE 95th St; NE 88th St; NE 97th St; 5th Ave NE; 8th Ave NE; Roosevelt Way NE; 1st Ave NE; NE 85th St; 15th Ave NE; NE 100th St; NE 103rd St; NE 96th St; 12th Ave NE; NE 86th St; NE 98th St; NE 102nd St; NE Northgate Way; NE 104th St; NE 105th St; 17th Ave NE; 20th Ave NE; 2nd Ave NE; NE 107th St; 4th Ave NE; NE 106th St; Latona Ave NE; 3rd Ave NE; NE 108th St; 14th Ave NE; 11th Ave NE; NE 105th Pl; N Northgate Way; Ravenna Ave NE; NE 96th Pl; N 92nd St; 17th Pl NE; 9th Ave NE; 16th Ave NE; Northgate West Dr; Northgate Mall; 7th Ave NE; N 85th St; 10th Pl NE; Northgate Plz; Northgate East Dr; 18th Ave NE; 23rd Ave NE.
Maple Leaf neighborhood detailed profile
Area: 1.258 square miles
Population: 11,765
Population density:
| Maple Leaf: | 9,350 people per square mile |
| Seattle: | 8,750 people per square mile |
Median household income in 2021:
| Maple Leaf: | $129,907 |
| Seattle: | $110,781 |
Median rent in in 2021:
| Maple Leaf: | $1,861 |
| Seattle: | $1,670 |
Male vs Females
| Males: | 5,794 |
| Females: | 5,970 |
Median age
| Males: | 37.5 years |
| Females: | 35.4 years |
Housing prices:
Average estimated value of detached houses in 2021 (80.5% of all units):
| Maple Leaf: | $798,871 |
| Seattle: | $906,138 |
Average estimated '21 value of housing units in 5-or-more-unit structures (21.9% of all units):
| Maple Leaf: | $297,329 |
| Seattle: | $570,782 |
Most popular occupations of males: computer and mathematical occupations (18.6%); management occupations (except farmers) (17.5%); sales and office occupations (9.7%); service occupations (7.8%); architecture and engineering occupations (7.5%); life, physical, and social science occupations (6.2%); business and financial operations occupations (5.6%)
Most popular occupations of females: management occupations (except farmers) (19.3%); sales and office occupations (18.8%); service occupations (11.0%); business and financial operations occupations (9.9%); healthcare practitioners and technical occupations (9.4%); education, training, and library occupations (8.4%); computer and mathematical occupations (8.2%)
Limited-access highways (interstate or state) in this neighborhood: I- 5.
Highways in this neighborhood: State Rte 522 (Lake City Way NE).
Roads and streets: NE 90th St; NE 91st St; NE 92nd St; NE 94th St; NE 89th St; NE 95th St; NE 88th St; NE 97th St; 5th Ave NE; 8th Ave NE; Roosevelt Way NE; 1st Ave NE; NE 85th St; 15th Ave NE; NE 100th St; NE 103rd St; NE 96th St; 12th Ave NE; NE 86th St; NE 98th St; NE 102nd St; NE Northgate Way; NE 104th St; NE 105th St; 17th Ave NE; 20th Ave NE; 2nd Ave NE; NE 107th St; 4th Ave NE; NE 106th St; Latona Ave NE; 3rd Ave NE; NE 108th St; 14th Ave NE; 11th Ave NE; NE 105th Pl; N Northgate Way; Ravenna Ave NE; NE 96th Pl; N 92nd St; 17th Pl NE; 9th Ave NE; 16th Ave NE; Northgate West Dr; Northgate Mall; 7th Ave NE; N 85th St; 10th Pl NE; Northgate Plz; Northgate East Dr; 18th Ave NE; 23rd Ave NE.
Maple Leaf neighborhood detailed profile
Matthews Beach neighborhood in Seattle statistics: (Find on map)
Area: 1.102 square miles
Population: 6,858
Population density:
Median household income in 2021:
Median rent in in 2021:
Male vs Females
Median age
Housing prices:
Average estimated value of detached houses in 2021 (93.3% of all units):
Average estimated '21 value of housing units in 5-or-more-unit structures (5.4% of all units):
Most popular occupations of males: management occupations (except farmers) (17.6%); sales and office occupations (12.4%); service occupations (10.0%); computer and mathematical occupations (9.8%); life, physical, and social science occupations (8.4%); arts, design, entertainment, sports, and media occupations (8.2%); business and financial operations occupations (7.9%)
Most popular occupations of females: healthcare practitioners and technical occupations (20.0%); sales and office occupations (17.4%); business and financial operations occupations (14.2%); education, training, and library occupations (12.1%); management occupations (except farmers) (11.1%); service occupations (9.0%); computer and mathematical occupations (4.7%)
Roads and streets: Riviera Pl NE; Sand Point Way NE; Burke Gilman Trl; Exeter Ave NE; NE 105th St; 40th Ave NE; NE 110th St; 38th Ave NE; 39th Ave NE; NE 113th St; NE 115th St; Alton Ave NE; NE 100th St; Durland Ave NE; 36th Ave NE; NE 95th St; 49th Ave NE; Lake Shore Blvd NE; 46th Ave NE; NE 103rd St; 45th Ave NE; NE 97th St; 48th Ave NE; NE 107th St; Bartlett Ave NE; 44th Ave NE; Lakeside Ave NE; 43rd Pl NE; NE 89th St; NE 106th St; NE 98th St; Mathews Ave NE; 42nd Ave NE; 41st Pl NE; NE 93rd St; 41st Ave NE; Durland Pl NE; NE 109th St; NE 104th Pl; Inverness Dr NE; NE 103rd Pl; NE 88th Pl; NE 117th St; NE 104th St; 51st Ave NE; NE 96th St; Alton Pl NE; 46th Pl NE; Mathews Pl NE; NE 120th St; NE 90th Pl; NE 112th St; Inverness Ct NE.
Other features: Thornton Crk.
Matthews Beach neighborhood detailed profile
Area: 1.102 square miles
Population: 6,858
Population density:
| Matthews Beach: | 6,223 people per square mile |
| Seattle: | 8,750 people per square mile |
Median household income in 2021:
| Matthews Beach: | $124,629 |
| Seattle: | $110,781 |
Median rent in in 2021:
| Matthews Beach: | $1,864 |
| Seattle: | $1,670 |
Male vs Females
| Males: | 3,476 |
| Females: | 3,382 |
Median age
| Males: | 42.7 years |
| Females: | 44.9 years |
Housing prices:
Average estimated value of detached houses in 2021 (93.3% of all units):
| Matthews Beach: | $864,936 |
| Seattle: | $906,138 |
Average estimated '21 value of housing units in 5-or-more-unit structures (5.4% of all units):
| Matthews Beach: | $699,091 |
| Seattle: | $570,782 |
Most popular occupations of males: management occupations (except farmers) (17.6%); sales and office occupations (12.4%); service occupations (10.0%); computer and mathematical occupations (9.8%); life, physical, and social science occupations (8.4%); arts, design, entertainment, sports, and media occupations (8.2%); business and financial operations occupations (7.9%)
Most popular occupations of females: healthcare practitioners and technical occupations (20.0%); sales and office occupations (17.4%); business and financial operations occupations (14.2%); education, training, and library occupations (12.1%); management occupations (except farmers) (11.1%); service occupations (9.0%); computer and mathematical occupations (4.7%)
Roads and streets: Riviera Pl NE; Sand Point Way NE; Burke Gilman Trl; Exeter Ave NE; NE 105th St; 40th Ave NE; NE 110th St; 38th Ave NE; 39th Ave NE; NE 113th St; NE 115th St; Alton Ave NE; NE 100th St; Durland Ave NE; 36th Ave NE; NE 95th St; 49th Ave NE; Lake Shore Blvd NE; 46th Ave NE; NE 103rd St; 45th Ave NE; NE 97th St; 48th Ave NE; NE 107th St; Bartlett Ave NE; 44th Ave NE; Lakeside Ave NE; 43rd Pl NE; NE 89th St; NE 106th St; NE 98th St; Mathews Ave NE; 42nd Ave NE; 41st Pl NE; NE 93rd St; 41st Ave NE; Durland Pl NE; NE 109th St; NE 104th Pl; Inverness Dr NE; NE 103rd Pl; NE 88th Pl; NE 117th St; NE 104th St; 51st Ave NE; NE 96th St; Alton Pl NE; 46th Pl NE; Mathews Pl NE; NE 120th St; NE 90th Pl; NE 112th St; Inverness Ct NE.
Other features: Thornton Crk.
Matthews Beach neighborhood detailed profile
Meadowbrook neighborhood in Seattle statistics: (Find on map)
Area: 0.599 square miles
Population: 4,433
Population density:
Median household income in 2021:
Median rent in in 2021:
Male vs Females
Median age
Average estimated value of detached houses in 2021 (83.1% of all units):
Most popular occupations of males: sales and office occupations (20.7%); management occupations (except farmers) (15.3%); service occupations (11.7%); architecture and engineering occupations (8.7%); transportation occupations (7.8%); computer and mathematical occupations (7.1%); education, training, and library occupations (5.8%)
Most popular occupations of females: management occupations (except farmers) (18.5%); sales and office occupations (16.4%); business and financial operations occupations (13.8%); education, training, and library occupations (13.2%); healthcare practitioners and technical occupations (12.7%); service occupations (8.9%); life, physical, and social science occupations (3.8%)
Roads and streets: 35th Ave NE; NE 98th St; Ravenna Ave NE; NE 100th St; NE 105th St; NE 97th St; 30th Ave NE; NE 110th St; 32nd Ave NE; NE 95th St; NE 103rd St; NE 96th St; NE 115th St; 28th Ave NE; 31st Ave NE; 27th Ave NE; 34th Ave NE; NE 113th St; NE 117th St; NE 104th St; NE 118th St; NE 106th Pl; 33rd Ave NE; NE 107th St; NE 105th Pl; 29th Ave NE; NE 108th Pl; 33rd Pl NE.
Other features: Thornton Crk.
Meadowbrook neighborhood detailed profile
Area: 0.599 square miles
Population: 4,433
Population density:
| Meadowbrook: | 7,406 people per square mile |
| Seattle: | 8,750 people per square mile |
Median household income in 2021:
| Meadowbrook: | $134,041 |
| Seattle: | $110,781 |
Median rent in in 2021:
| Meadowbrook: | $1,576 |
| Seattle: | $1,670 |
Male vs Females
| Males: | 2,324 |
| Females: | 2,109 |
Median age
| Males: | 35.9 years |
| Females: | 41.4 years |
Average estimated value of detached houses in 2021 (83.1% of all units):
| Meadowbrook: | $823,531 |
| Seattle: | $906,138 |
Most popular occupations of males: sales and office occupations (20.7%); management occupations (except farmers) (15.3%); service occupations (11.7%); architecture and engineering occupations (8.7%); transportation occupations (7.8%); computer and mathematical occupations (7.1%); education, training, and library occupations (5.8%)
Most popular occupations of females: management occupations (except farmers) (18.5%); sales and office occupations (16.4%); business and financial operations occupations (13.8%); education, training, and library occupations (13.2%); healthcare practitioners and technical occupations (12.7%); service occupations (8.9%); life, physical, and social science occupations (3.8%)
Roads and streets: 35th Ave NE; NE 98th St; Ravenna Ave NE; NE 100th St; NE 105th St; NE 97th St; 30th Ave NE; NE 110th St; 32nd Ave NE; NE 95th St; NE 103rd St; NE 96th St; NE 115th St; 28th Ave NE; 31st Ave NE; 27th Ave NE; 34th Ave NE; NE 113th St; NE 117th St; NE 104th St; NE 118th St; NE 106th Pl; 33rd Ave NE; NE 107th St; NE 105th Pl; 29th Ave NE; NE 108th Pl; 33rd Pl NE.
Other features: Thornton Crk.
Meadowbrook neighborhood detailed profile
Mid Beacon Hill neighborhood in Seattle statistics: (Find on map)
Area: 1.843 square miles
Population: 481
Population density:
Median household income in 2021:
Median rent in in 2021:
Male vs Females
Median age
Most popular occupations of males: sales and office occupations (26.8%); management occupations (except farmers) (21.3%); arts, design, entertainment, sports, and media occupations (14.7%); business and financial operations occupations (11.1%); healthcare practitioners and technical occupations (10.0%); life, physical, and social science occupations (6.3%); architecture and engineering occupations (5.9%)
Most popular occupations of females: management occupations (except farmers) (24.0%); healthcare practitioners and technical occupations (22.4%); service occupations (21.0%); arts, design, entertainment, sports, and media occupations (11.7%); business and financial operations occupations (5.9%); community and social services occupations (5.2%); education, training, and library occupations (5.1%)
Limited-access highways (interstate or state) in this neighborhood: I- 5.
Roads and streets: Beacon Ave S; S Orcas St; S Dawson St; S Ferdinand St; S Graham St; S Juneau St; 13th Ave S; S Brandon St; S Lucile St; S Bennett St; S Raymond St; 12th Ave S; 14th Ave S; S Angeline St; 15th Ave S; S Pearl St; 32nd Ave S; S Hudson St; 20th Ave S; 24th Ave S; 28th Ave S; 30th Ave S; Swift Ave S; Martin Luther King Way S; S Shelton St; 17th Ave S; S Eddy St; S Edmunds St; 26th Ave S; 25th Ave S; 33rd Ave S; S Spencer St; 31st Ave S; Columbia Dr S; 23rd Ave S; 21st Ave S; 22nd Ave S; 29th Ave S; S Snoqualmie St; S Oregon St; 18th Ave S; 19th Ave S; Corson Ave S; 16th Ave S; S Columbian Way; S Warsaw St; 27th Ave S; S Morgan St; 10th Ave S; Mars Ave S; Powell Pl S; 35th Ave S; 36th Ave S; 11th Ave S; S Holly St; S Nevada St; 24th Pl S; South Dakota St; S Bateman St; Vista Ave S; Mountain View Dr S; S Brighton St; S Willow St; S Charlestown St; S Court St; S Kenny St; Shaffer Ave S; Decatur Pl S; S Avon Crest Pl; Gould Ave S; Agnew Ave S; S Albro Pl; Hahn Pl S; S Andover St; S Bradford St; S Vern Ct; S Dean Ct; S Mead St; Crest Pl S; S Alaska St; 34th Ct S; S Findlay St; 19th Pl S; Winston Ave S; Seelye Ct S; 38th Ave S; S Snoqualmie Pl; S Spokane St; Thorin Pl S; Military Rd S; S Eddy Ct; Augusta Pl S; Brandon Ct; Warsaw St; Eddy Ct S; S Brandon Ct.
Railroad features: Union Pacific RR (Burlington Northern Santa Fe Rlwy).
Mid Beacon Hill neighborhood detailed profile
Area: 1.843 square miles
Population: 481
Population density:
| Mid Beacon Hill: | 261 people per square mile |
| Seattle: | 8,750 people per square mile |
Median household income in 2021:
| Mid Beacon Hill: | $96,515 |
| Seattle: | $110,781 |
Median rent in in 2021:
| Mid Beacon Hill: | $1,676 |
| Seattle: | $1,670 |
Male vs Females
| Males: | 284 |
| Females: | 197 |
Median age
| Males: | 46.2 years |
| Females: | 41.3 years |
Most popular occupations of males: sales and office occupations (26.8%); management occupations (except farmers) (21.3%); arts, design, entertainment, sports, and media occupations (14.7%); business and financial operations occupations (11.1%); healthcare practitioners and technical occupations (10.0%); life, physical, and social science occupations (6.3%); architecture and engineering occupations (5.9%)
Most popular occupations of females: management occupations (except farmers) (24.0%); healthcare practitioners and technical occupations (22.4%); service occupations (21.0%); arts, design, entertainment, sports, and media occupations (11.7%); business and financial operations occupations (5.9%); community and social services occupations (5.2%); education, training, and library occupations (5.1%)
Limited-access highways (interstate or state) in this neighborhood: I- 5.
Roads and streets: Beacon Ave S; S Orcas St; S Dawson St; S Ferdinand St; S Graham St; S Juneau St; 13th Ave S; S Brandon St; S Lucile St; S Bennett St; S Raymond St; 12th Ave S; 14th Ave S; S Angeline St; 15th Ave S; S Pearl St; 32nd Ave S; S Hudson St; 20th Ave S; 24th Ave S; 28th Ave S; 30th Ave S; Swift Ave S; Martin Luther King Way S; S Shelton St; 17th Ave S; S Eddy St; S Edmunds St; 26th Ave S; 25th Ave S; 33rd Ave S; S Spencer St; 31st Ave S; Columbia Dr S; 23rd Ave S; 21st Ave S; 22nd Ave S; 29th Ave S; S Snoqualmie St; S Oregon St; 18th Ave S; 19th Ave S; Corson Ave S; 16th Ave S; S Columbian Way; S Warsaw St; 27th Ave S; S Morgan St; 10th Ave S; Mars Ave S; Powell Pl S; 35th Ave S; 36th Ave S; 11th Ave S; S Holly St; S Nevada St; 24th Pl S; South Dakota St; S Bateman St; Vista Ave S; Mountain View Dr S; S Brighton St; S Willow St; S Charlestown St; S Court St; S Kenny St; Shaffer Ave S; Decatur Pl S; S Avon Crest Pl; Gould Ave S; Agnew Ave S; S Albro Pl; Hahn Pl S; S Andover St; S Bradford St; S Vern Ct; S Dean Ct; S Mead St; Crest Pl S; S Alaska St; 34th Ct S; S Findlay St; 19th Pl S; Winston Ave S; Seelye Ct S; 38th Ave S; S Snoqualmie Pl; S Spokane St; Thorin Pl S; Military Rd S; S Eddy Ct; Augusta Pl S; Brandon Ct; Warsaw St; Eddy Ct S; S Brandon Ct.
Railroad features: Union Pacific RR (Burlington Northern Santa Fe Rlwy).
Mid Beacon Hill neighborhood detailed profile
Minor neighborhood in Seattle statistics: (Find on map)
Area: 0.649 square miles
Population: 14,849
Population density:
Median household income in 2021:
Median rent in in 2021:
Male vs Females
Median age
Housing prices:
Average estimated value of detached houses in 2021 (34.0% of all units):
Average estimated value of townhouses or other attached units in 2021 (18.3% of all units):
Average estimated value of housing units in 2-unit structures in 2021 (8.1% of all units):
Average estimated '21 value of housing units in 3-to-4-unit structures (10.6% of all units):
Average estimated '21 value of housing units in 5-or-more-unit structures (19.3% of all units):
Most popular occupations of males: computer and mathematical occupations (21.0%); management occupations (except farmers) (14.1%); service occupations (14.0%); sales and office occupations (11.3%); business and financial operations occupations (7.3%); healthcare practitioners and technical occupations (6.8%); arts, design, entertainment, sports, and media occupations (5.8%)
Most popular occupations of females: service occupations (20.0%); sales and office occupations (17.1%); management occupations (except farmers) (15.7%); healthcare practitioners and technical occupations (10.2%); business and financial operations occupations (9.6%); arts, design, entertainment, sports, and media occupations (8.2%); education, training, and library occupations (6.5%)
Roads and streets: 23rd Ave; 20th Ave; 22nd Ave; 21st Ave; E Union St; E Spruce St; 15th Ave; E Alder St; E Columbia St; E Jefferson St; E Cherry St; E Marion St; 18th Ave; 19th Ave; E Fir St; 14th Ave; 16th Ave; 17th Ave; 13th Ave; E Spring St; E Pine St; E Pike St; E Terrace St; E James St; E Olive St; E Madison St; E Remington Ct.
Minor neighborhood detailed profile
Area: 0.649 square miles
Population: 14,849
Population density:
| Minor: | 22,865 people per square mile |
| Seattle: | 8,750 people per square mile |
Median household income in 2021:
| Minor: | $133,013 |
| Seattle: | $110,781 |
Median rent in in 2021:
| Minor: | $1,770 |
| Seattle: | $1,670 |
Male vs Females
| Males: | 7,515 |
| Females: | 7,333 |
Median age
| Males: | 29.8 years |
| Females: | 29.6 years |
Housing prices:
Average estimated value of detached houses in 2021 (34.0% of all units):
| Minor: | $671,161 |
| Seattle: | $906,138 |
Average estimated value of townhouses or other attached units in 2021 (18.3% of all units):
| This neighborhood: | $385,498 |
| city: | $615,733 |
Average estimated value of housing units in 2-unit structures in 2021 (8.1% of all units):
| This neighborhood: | $816,333 |
| Seattle: | $793,396 |
Average estimated '21 value of housing units in 3-to-4-unit structures (10.6% of all units):
| Minor: | $739,384 |
| city: | $599,472 |
Average estimated '21 value of housing units in 5-or-more-unit structures (19.3% of all units):
| Minor: | $272,691 |
| Seattle: | $570,782 |
Most popular occupations of males: computer and mathematical occupations (21.0%); management occupations (except farmers) (14.1%); service occupations (14.0%); sales and office occupations (11.3%); business and financial operations occupations (7.3%); healthcare practitioners and technical occupations (6.8%); arts, design, entertainment, sports, and media occupations (5.8%)
Most popular occupations of females: service occupations (20.0%); sales and office occupations (17.1%); management occupations (except farmers) (15.7%); healthcare practitioners and technical occupations (10.2%); business and financial operations occupations (9.6%); arts, design, entertainment, sports, and media occupations (8.2%); education, training, and library occupations (6.5%)
Roads and streets: 23rd Ave; 20th Ave; 22nd Ave; 21st Ave; E Union St; E Spruce St; 15th Ave; E Alder St; E Columbia St; E Jefferson St; E Cherry St; E Marion St; 18th Ave; 19th Ave; E Fir St; 14th Ave; 16th Ave; 17th Ave; 13th Ave; E Spring St; E Pine St; E Pike St; E Terrace St; E James St; E Olive St; E Madison St; E Remington Ct.
Minor neighborhood detailed profile
Montlake neighborhood in Seattle statistics: (Find on map)
Area: 0.758 square miles
Population: 5,033
Population density:
Median household income in 2021:
Median rent in in 2021:
Male vs Females
Median age
Housing prices:
Average estimated value of detached houses in 2021 (56.8% of all units):
Average estimated value of townhouses or other attached units in 2021 (12.1% of all units):
Average estimated '21 value of housing units in 5-or-more-unit structures (10.9% of all units):
Most popular occupations of males: computer and mathematical occupations (21.2%); sales and office occupations (14.8%); management occupations (except farmers) (11.5%); healthcare practitioners and technical occupations (11.3%); business and financial operations occupations (8.0%); legal occupations (6.8%); life, physical, and social science occupations (5.5%)
Most popular occupations of females: management occupations (except farmers) (15.0%); business and financial operations occupations (12.5%); sales and office occupations (12.3%); healthcare practitioners and technical occupations (11.6%); arts, design, entertainment, sports, and media occupations (8.7%); service occupations (8.5%); computer and mathematical occupations (8.2%)
Limited-access highways (interstate or state) in this neighborhood: I- 5.
Highways in this neighborhood: State Rte 520.
Roads and streets: Boyer Ave E; E Lynn St; E Miller St; E Mc Graw St; Lake Washington Blvd E; 24th Ave E; E Calhoun St; E Newton St; 25th Ave E; 26th Ave E; E Boston St; 22nd Ave E; E Shelby St; E Hamlin St; E Roanoke St; Delmar Dr E; E Louisa St; E Howe St; 19th Ave E; 10th Ave E; 11th Ave E; Federal Ave E; Montlake Blvd E; E Blaine St; 12th Ave E; E Lake Washington Blvd; 23rd Ave E; 20th Ave E; Everett Ave E; E University Blvd; W Montlake Pl E; 13th Ave E; E Montlake Pl E; 16th Ave E; 18th Ave E; E Crockett St; 14th Ave E; E North St; Eaton Pl (E Eaton Pl); Royal Ct E; E Interlaken Blvd; 15th Ave E; 21st Ave E; E Park Dr E; W Park Dr E; E Lousia St; Glenwild Pl E; Broadway E; Glenwilde Pl E.
Montlake neighborhood detailed profile
Area: 0.758 square miles
Population: 5,033
Population density:
| Montlake: | 6,640 people per square mile |
| Seattle: | 8,750 people per square mile |
Median household income in 2021:
| Montlake: | $154,571 |
| Seattle: | $110,781 |
Median rent in in 2021:
| Montlake: | $1,967 |
| Seattle: | $1,670 |
Male vs Females
| Males: | 2,601 |
| Females: | 2,432 |
Median age
| Males: | 39.5 years |
| Females: | 39.3 years |
Housing prices:
Average estimated value of detached houses in 2021 (56.8% of all units):
| Montlake: | $605,428 |
| Seattle: | $906,138 |
Average estimated value of townhouses or other attached units in 2021 (12.1% of all units):
| This neighborhood: | $390,265 |
| city: | $615,733 |
Average estimated '21 value of housing units in 5-or-more-unit structures (10.9% of all units):
| Montlake: | $197,835 |
| Seattle: | $570,782 |
Most popular occupations of males: computer and mathematical occupations (21.2%); sales and office occupations (14.8%); management occupations (except farmers) (11.5%); healthcare practitioners and technical occupations (11.3%); business and financial operations occupations (8.0%); legal occupations (6.8%); life, physical, and social science occupations (5.5%)
Most popular occupations of females: management occupations (except farmers) (15.0%); business and financial operations occupations (12.5%); sales and office occupations (12.3%); healthcare practitioners and technical occupations (11.6%); arts, design, entertainment, sports, and media occupations (8.7%); service occupations (8.5%); computer and mathematical occupations (8.2%)
Limited-access highways (interstate or state) in this neighborhood: I- 5.
Highways in this neighborhood: State Rte 520.
Roads and streets: Boyer Ave E; E Lynn St; E Miller St; E Mc Graw St; Lake Washington Blvd E; 24th Ave E; E Calhoun St; E Newton St; 25th Ave E; 26th Ave E; E Boston St; 22nd Ave E; E Shelby St; E Hamlin St; E Roanoke St; Delmar Dr E; E Louisa St; E Howe St; 19th Ave E; 10th Ave E; 11th Ave E; Federal Ave E; Montlake Blvd E; E Blaine St; 12th Ave E; E Lake Washington Blvd; 23rd Ave E; 20th Ave E; Everett Ave E; E University Blvd; W Montlake Pl E; 13th Ave E; E Montlake Pl E; 16th Ave E; 18th Ave E; E Crockett St; 14th Ave E; E North St; Eaton Pl (E Eaton Pl); Royal Ct E; E Interlaken Blvd; 15th Ave E; 21st Ave E; E Park Dr E; W Park Dr E; E Lousia St; Glenwild Pl E; Broadway E; Glenwilde Pl E.
Montlake neighborhood detailed profile
Mount Baker neighborhood in Seattle statistics: (Find on map)
Area: 1.057 square miles
Population: 11,607
Population density:
Median household income in 2021:
Median rent in in 2021:
Male vs Females
Median age
Housing prices:
Average estimated value of detached houses in 2021 (67.7% of all units):
Average estimated value of townhouses or other attached units in 2021 (8.1% of all units):
Most popular occupations of males: computer and mathematical occupations (16.8%); business and financial operations occupations (16.1%); management occupations (except farmers) (14.9%); sales and office occupations (10.9%); service occupations (9.7%); education, training, and library occupations (5.4%); architecture and engineering occupations (3.9%)
Most popular occupations of females: business and financial operations occupations (17.7%); sales and office occupations (15.7%); service occupations (13.1%); education, training, and library occupations (11.1%); computer and mathematical occupations (9.6%); management occupations (except farmers) (9.4%); arts, design, entertainment, sports, and media occupations (5.9%)
Limited-access highways (interstate or state) in this neighborhood: I- 90.
Roads and streets: Lake Washington Blvd S; Cascadia Ave S; 33rd Ave S; S Mount Baker Blvd; 30th Ave S; 34th Ave S; 36th Ave S; 31st Ave S; 32nd Ave S; 37th Ave S; 29th Ave S; S Massachusetts St; S Horton St; 35th Ave S; S Mc Clellan St; S Hanford St; S Andover St; S Atlantic St; Rainier Ave; S Bayview St; South Dakota St; 28th Ave S; Hunter Blvd S; 38th Ave S; S Genesee St; S Hinds St; S College St; Lakewood Ave S; 42nd Ave S; 39th Ave S; 41st Ave S; S Spokane St; S Plum St; S Charlestown St; S Court St; Lakeside Ave S; Courtland Pl S; Shoreland Dr S; Mount Rainier Dr S; Lake Park Dr S; Bellavista Ave S; S Walker St; Mount St Helens Pl S; S Lander St; Sierra Dr S; Mount Adams Pl S; S Dose Ter; Mount Baker Dr S; S Byron St; S Holgate St; S Grand St; York Rd S; 37th Pl S; Bradner Pl S; 27th Ave S; S Hill St; Wetmore Ave S; Mount Claire Dr S; Mc Clintock Ave S; S Walden St; S Ridgeway Pl; S Day St; Gale Pl S; S Mount Baker Cir; S Adams St; S Ferris Pl; Terminal Ct S; S Estelle St; Martin Luther King Way S; S Bradford St.
Mount Baker neighborhood detailed profile
Area: 1.057 square miles
Population: 11,607
Population density:
| Mount Baker: | 10,980 people per square mile |
| Seattle: | 8,750 people per square mile |
Median household income in 2021:
| Mount Baker: | $145,169 |
| Seattle: | $110,781 |
Median rent in in 2021:
| Mount Baker: | $1,378 |
| Seattle: | $1,670 |
Male vs Females
| Males: | 6,635 |
| Females: | 4,972 |
Median age
| Males: | 39.6 years |
| Females: | 45.3 years |
Housing prices:
Average estimated value of detached houses in 2021 (67.7% of all units):
| Mount Baker: | $1,094,875 |
| Seattle: | $906,138 |
Average estimated value of townhouses or other attached units in 2021 (8.1% of all units):
| This neighborhood: | $619,750 |
| city: | $615,733 |
Most popular occupations of males: computer and mathematical occupations (16.8%); business and financial operations occupations (16.1%); management occupations (except farmers) (14.9%); sales and office occupations (10.9%); service occupations (9.7%); education, training, and library occupations (5.4%); architecture and engineering occupations (3.9%)
Most popular occupations of females: business and financial operations occupations (17.7%); sales and office occupations (15.7%); service occupations (13.1%); education, training, and library occupations (11.1%); computer and mathematical occupations (9.6%); management occupations (except farmers) (9.4%); arts, design, entertainment, sports, and media occupations (5.9%)
Limited-access highways (interstate or state) in this neighborhood: I- 90.
Roads and streets: Lake Washington Blvd S; Cascadia Ave S; 33rd Ave S; S Mount Baker Blvd; 30th Ave S; 34th Ave S; 36th Ave S; 31st Ave S; 32nd Ave S; 37th Ave S; 29th Ave S; S Massachusetts St; S Horton St; 35th Ave S; S Mc Clellan St; S Hanford St; S Andover St; S Atlantic St; Rainier Ave; S Bayview St; South Dakota St; 28th Ave S; Hunter Blvd S; 38th Ave S; S Genesee St; S Hinds St; S College St; Lakewood Ave S; 42nd Ave S; 39th Ave S; 41st Ave S; S Spokane St; S Plum St; S Charlestown St; S Court St; Lakeside Ave S; Courtland Pl S; Shoreland Dr S; Mount Rainier Dr S; Lake Park Dr S; Bellavista Ave S; S Walker St; Mount St Helens Pl S; S Lander St; Sierra Dr S; Mount Adams Pl S; S Dose Ter; Mount Baker Dr S; S Byron St; S Holgate St; S Grand St; York Rd S; 37th Pl S; Bradner Pl S; 27th Ave S; S Hill St; Wetmore Ave S; Mount Claire Dr S; Mc Clintock Ave S; S Walden St; S Ridgeway Pl; S Day St; Gale Pl S; S Mount Baker Cir; S Adams St; S Ferris Pl; Terminal Ct S; S Estelle St; Martin Luther King Way S; S Bradford St.
Mount Baker neighborhood detailed profile
North Admiral neighborhood in Seattle statistics: (Find on map)
Area: 2.011 square miles
Population: 16,749
Population density:
Median household income in 2021:
Median rent in in 2021:
Male vs Females
Median age
Housing prices:
Average estimated value of detached houses in 2021 (47.9% of all units):
Average estimated value of townhouses or other attached units in 2021 (7.7% of all units):
Most popular occupations of males: management occupations (except farmers) (23.5%); business and financial operations occupations (15.5%); sales and office occupations (12.3%); computer and mathematical occupations (11.8%); architecture and engineering occupations (6.7%); healthcare practitioners and technical occupations (5.9%); service occupations (5.5%)
Most popular occupations of females: sales and office occupations (23.6%); management occupations (except farmers) (15.3%); business and financial operations occupations (12.9%); education, training, and library occupations (12.3%); healthcare practitioners and technical occupations (11.8%); service occupations (5.6%); computer and mathematical occupations (3.6%)
Limited-access highways (interstate or state) in this neighborhood: W Seattle Fwy.
Roads and streets: SW Admiral Way; Harbor Ave SW; Alki Ave SW; SW Hinds St; California Ave SW; SW Stevens St; SW Hanford St; SW Lander St; 45th Ave SW; 44th Ave SW; 46th Ave SW; 42nd Ave SW; 47th Ave SW; SW Spokane St; Walnut Ave SW; Sunset Ave SW; SW Manning St; SW College St; 37th Ave SW; SW Hill St; Belvidere Ave SW; Fairmount Ave SW; 41st Ave SW; 48th Ave SW; 49th Ave SW; SW Walker St; 36th Ave SW; 38th Ave SW; SW Holgate St; 39th Ave SW; Ferry Ave SW; Palm Ave SW; Bonair Dr SW; 50th Ave SW; SW Massachusetts St; 51st Ave SW; SW Waite St; California Way SW; SW Olga St; SW Grayson St; SW Charlestown St; SW Seattle St; 52nd Ave SW; 53rd Ave SW; Garlough Ave SW; SW Atlantic St; 30th Ave SW; Clamar Pl SW; SW Prince St; 33rd Ave SW; Halleck Ave SW; SW Pritchard St; 40th Ave SW; 34th Ave SW; 35th Ave SW; Schmitz Blvd; Hughes Ave SW; California Ln SW; SW Orleans St; Arch Ave SW; SW Forest St; Prescott Ave SW; SW City View St; Fauntleroy Ave SW; SW Forney St; Bonair Pl SW; 31st Ave SW; SW Donald St; Victoria Ave SW; SW Avalon Way; Hobart Ave SW; Fauntleroy Way SW; SW Harbor Ln; SW Niesz Ct; SW Prescott Pl; Wickstrom Pl SW; Brook Ave SW; 54th Pl SW; Edgewood Ave SW; Sumner Ave SW; SW Lander Pl; Elm Pl SW; Lotus Ave SW; SW Maryland Pl; SW California Pl; Edgewood.
Railroad features: .
Other features: Water Taxi Route.
North Admiral neighborhood detailed profile
Area: 2.011 square miles
Population: 16,749
Population density:
| North Admiral: | 8,329 people per square mile |
| Seattle: | 8,750 people per square mile |
Median household income in 2021:
| North Admiral: | $131,494 |
| Seattle: | $110,781 |
Median rent in in 2021:
| North Admiral: | $1,439 |
| Seattle: | $1,670 |
Male vs Females
| Males: | 8,322 |
| Females: | 8,426 |
Median age
| Males: | 42.8 years |
| Females: | 44.6 years |
Housing prices:
Average estimated value of detached houses in 2021 (47.9% of all units):
| North Admiral: | $808,276 |
| Seattle: | $906,138 |
Average estimated value of townhouses or other attached units in 2021 (7.7% of all units):
| This neighborhood: | $850,000 |
| city: | $615,733 |
Most popular occupations of males: management occupations (except farmers) (23.5%); business and financial operations occupations (15.5%); sales and office occupations (12.3%); computer and mathematical occupations (11.8%); architecture and engineering occupations (6.7%); healthcare practitioners and technical occupations (5.9%); service occupations (5.5%)
Most popular occupations of females: sales and office occupations (23.6%); management occupations (except farmers) (15.3%); business and financial operations occupations (12.9%); education, training, and library occupations (12.3%); healthcare practitioners and technical occupations (11.8%); service occupations (5.6%); computer and mathematical occupations (3.6%)
Limited-access highways (interstate or state) in this neighborhood: W Seattle Fwy.
Roads and streets: SW Admiral Way; Harbor Ave SW; Alki Ave SW; SW Hinds St; California Ave SW; SW Stevens St; SW Hanford St; SW Lander St; 45th Ave SW; 44th Ave SW; 46th Ave SW; 42nd Ave SW; 47th Ave SW; SW Spokane St; Walnut Ave SW; Sunset Ave SW; SW Manning St; SW College St; 37th Ave SW; SW Hill St; Belvidere Ave SW; Fairmount Ave SW; 41st Ave SW; 48th Ave SW; 49th Ave SW; SW Walker St; 36th Ave SW; 38th Ave SW; SW Holgate St; 39th Ave SW; Ferry Ave SW; Palm Ave SW; Bonair Dr SW; 50th Ave SW; SW Massachusetts St; 51st Ave SW; SW Waite St; California Way SW; SW Olga St; SW Grayson St; SW Charlestown St; SW Seattle St; 52nd Ave SW; 53rd Ave SW; Garlough Ave SW; SW Atlantic St; 30th Ave SW; Clamar Pl SW; SW Prince St; 33rd Ave SW; Halleck Ave SW; SW Pritchard St; 40th Ave SW; 34th Ave SW; 35th Ave SW; Schmitz Blvd; Hughes Ave SW; California Ln SW; SW Orleans St; Arch Ave SW; SW Forest St; Prescott Ave SW; SW City View St; Fauntleroy Ave SW; SW Forney St; Bonair Pl SW; 31st Ave SW; SW Donald St; Victoria Ave SW; SW Avalon Way; Hobart Ave SW; Fauntleroy Way SW; SW Harbor Ln; SW Niesz Ct; SW Prescott Pl; Wickstrom Pl SW; Brook Ave SW; 54th Pl SW; Edgewood Ave SW; Sumner Ave SW; SW Lander Pl; Elm Pl SW; Lotus Ave SW; SW Maryland Pl; SW California Pl; Edgewood.
Railroad features: .
Other features: Water Taxi Route.
North Admiral neighborhood detailed profile
North Beach neighborhood in Seattle statistics: (Find on map)
Area: 1.184 square miles
Population: 7,372
Population density:
Median household income in 2021:
Median rent in in 2021:
Male vs Females
Median age
Average estimated value of detached houses in 2021 (91.1% of all units):
Most popular occupations of males: management occupations (except farmers) (20.6%); arts, design, entertainment, sports, and media occupations (10.3%); business and financial operations occupations (8.6%); computer and mathematical occupations (8.5%); sales and office occupations (8.0%); healthcare practitioners and technical occupations (6.8%); service occupations (6.2%)
Most popular occupations of females: sales and office occupations (16.4%); healthcare practitioners and technical occupations (15.4%); management occupations (except farmers) (14.5%); service occupations (11.9%); education, training, and library occupations (10.4%); business and financial operations occupations (8.3%); arts, design, entertainment, sports, and media occupations (6.3%)
Roads and streets: NW Blue Ridge Dr; NW 96th St; NW 95th St; 15th Ave NW; 23rd Ave NW; NW Esplanade St; NW 97th St; NW 100th St; NW 105th St; 28th Ave NW; 24th Ave NW; NW Woodbine Way; NW 98th St; Valmay Ave NW; NW 92nd St; 31st Ave NW; NW 87th St; NW 90th St; 26th Ave NW; NW 94th St; NW 99th St; 21st Ave NW; NW 93rd St; NW 86th St; 25th Ave NW; Mary Ave NW; NW 91st St; NW Norcross Way; 22nd Ave NW; NW Richwood Ave; 27th Ave NW; NW Greenbrier Way; Radford Ave NW; Triton Dr NW; 11th Ave NW; 8th Ave NW; 29th Ave NW; NW North Beach Dr; 12th Ave NW; 9th Ave NW; Cyrus Ave NW; Jones Ave NW; NW 107th St; NW 89th Pl; Bayard Ave NW; NW Golden Dr; NW 88th St; NW 110th St; Marmount Dr NW; 14th Ave NW; NW Milford Way; 30th Ave NW; View Ave NW; 20th Ave NW; 17th Ave NW; NW Neptune Pl; Earl Ave NW; 4th Ave NW; Belgrove Ct NW; 13th Ave NW; NW 106th St; 19th Ave NW; Forest Hill Pl NW; 3rd Ave NW; Culpepper Ct NW; 26th Pl NW; NW Carkeek Park Rd; Whitney Pl NW; Bedford Ct NW; NW 89th St; NW 90th Pl; 5th Ave NW; Vinton Ct NW; Alvin Pl NW; Sylvan Pl NW; NW Roundhill Cir; NW Woodbine Pl; 18th Ave NW; 18th Pl NW; Park Boundary; NW 108th St; 32nd Ave NW; 22nd Ct NW; NW 103rd St; Jones Pl NW.
Railroad features: Burlington Northern Santa Fe Rlwy.
North Beach neighborhood detailed profile
Area: 1.184 square miles
Population: 7,372
Population density:
| North Beach (Blue Ridge): | 6,225 people per square mile |
| Seattle: | 8,750 people per square mile |
Median household income in 2021:
| North Beach (Blue Ridge): | $191,684 |
| Seattle: | $110,781 |
Median rent in in 2021:
| North Beach (Blue Ridge): | $2,121 |
| Seattle: | $1,670 |
Male vs Females
| Males: | 3,658 |
| Females: | 3,713 |
Median age
| Males: | 46.0 years |
| Females: | 44.9 years |
Average estimated value of detached houses in 2021 (91.1% of all units):
| North Beach (Blue Ridge): | $1,218,454 |
| Seattle: | $906,138 |
Most popular occupations of males: management occupations (except farmers) (20.6%); arts, design, entertainment, sports, and media occupations (10.3%); business and financial operations occupations (8.6%); computer and mathematical occupations (8.5%); sales and office occupations (8.0%); healthcare practitioners and technical occupations (6.8%); service occupations (6.2%)
Most popular occupations of females: sales and office occupations (16.4%); healthcare practitioners and technical occupations (15.4%); management occupations (except farmers) (14.5%); service occupations (11.9%); education, training, and library occupations (10.4%); business and financial operations occupations (8.3%); arts, design, entertainment, sports, and media occupations (6.3%)
Roads and streets: NW Blue Ridge Dr; NW 96th St; NW 95th St; 15th Ave NW; 23rd Ave NW; NW Esplanade St; NW 97th St; NW 100th St; NW 105th St; 28th Ave NW; 24th Ave NW; NW Woodbine Way; NW 98th St; Valmay Ave NW; NW 92nd St; 31st Ave NW; NW 87th St; NW 90th St; 26th Ave NW; NW 94th St; NW 99th St; 21st Ave NW; NW 93rd St; NW 86th St; 25th Ave NW; Mary Ave NW; NW 91st St; NW Norcross Way; 22nd Ave NW; NW Richwood Ave; 27th Ave NW; NW Greenbrier Way; Radford Ave NW; Triton Dr NW; 11th Ave NW; 8th Ave NW; 29th Ave NW; NW North Beach Dr; 12th Ave NW; 9th Ave NW; Cyrus Ave NW; Jones Ave NW; NW 107th St; NW 89th Pl; Bayard Ave NW; NW Golden Dr; NW 88th St; NW 110th St; Marmount Dr NW; 14th Ave NW; NW Milford Way; 30th Ave NW; View Ave NW; 20th Ave NW; 17th Ave NW; NW Neptune Pl; Earl Ave NW; 4th Ave NW; Belgrove Ct NW; 13th Ave NW; NW 106th St; 19th Ave NW; Forest Hill Pl NW; 3rd Ave NW; Culpepper Ct NW; 26th Pl NW; NW Carkeek Park Rd; Whitney Pl NW; Bedford Ct NW; NW 89th St; NW 90th Pl; 5th Ave NW; Vinton Ct NW; Alvin Pl NW; Sylvan Pl NW; NW Roundhill Cir; NW Woodbine Pl; 18th Ave NW; 18th Pl NW; Park Boundary; NW 108th St; 32nd Ave NW; 22nd Ct NW; NW 103rd St; Jones Pl NW.
Railroad features: Burlington Northern Santa Fe Rlwy.
North Beach neighborhood detailed profile
North Beacon Hill neighborhood in Seattle statistics: (Find on map)
Area: 1.744 square miles
Population: 14,800
Population density:
Median household income in 2021:
Median rent in in 2021:
Male vs Females
Median age
Housing prices:
Average estimated value of detached houses in 2021 (30.7% of all units):
Average estimated value of townhouses or other attached units in 2021 (13.5% of all units):
Average estimated '21 value of housing units in 5-or-more-unit structures (29.3% of all units):
Most popular occupations of males: computer and mathematical occupations (15.1%); sales and office occupations (14.8%); transportation occupations (13.4%); service occupations (10.3%); arts, design, entertainment, sports, and media occupations (8.6%); management occupations (except farmers) (8.2%); architecture and engineering occupations (5.9%)
Most popular occupations of females: service occupations (21.1%); business and financial operations occupations (19.2%); management occupations (except farmers) (15.0%); sales and office occupations (14.9%); computer and mathematical occupations (7.7%); healthcare practitioners and technical occupations (7.2%); education, training, and library occupations (3.3%)
Limited-access highways (interstate or state) in this neighborhood: I- 90.
Roads and streets: Beacon Ave S; 15th Ave S; 16th Ave S; Rainier Ave; 14th Ave S; S Mc Clellan St; 17th Ave S; S Forest St; 19th Ave S; 18th Ave S; 12th Ave S; 13th Ave S; S Stevens St; 20th Ave S; 21st Ave S; S Hanford St; S Lander St; S Hinds St; S Bayview St; S Walker St; S Spokane St; S College St; S Hill St; Cheasty Blvd S; S Horton St; 25th Ave S; 22nd Ave S; 23rd Ave S; S Plum St; S Winthrop St; S Holgate St; 24th Ave S; S Massachusetts St; Sturgus Ave S; S State St; S Waite St; S Grand St; S Atlantic St; 11th Ave S; Harris Pl S; 24th Pl S; Poplar Pl S; Golf Dr S; S Columbian Way; S Snoqualmie St; S Charles St; Lafayette Ave S; S Judkins St; S Hinds Pl; Valentine Pl S; South Dakota St; Alamo Pl S; S Andover St; S Dean St; S Bush Pl; S Norman St; S Bradford St; Cherry Ln Pl S; Horton St; 26th Ave S; 27th Ave S; Hanford St; Sturgus Ave; S Nevada St; Sander Rd S; Bayview St; Martin Luther King Way S; Sturgus St S; S Massachusetts Ave; S Alaska St; Dr Jose P Rizal Brg.
North Beacon Hill neighborhood detailed profile
Area: 1.744 square miles
Population: 14,800
Population density:
| North Beacon Hill: | 8,486 people per square mile |
| Seattle: | 8,750 people per square mile |
Median household income in 2021:
| North Beacon Hill: | $96,495 |
| Seattle: | $110,781 |
Median rent in in 2021:
| North Beacon Hill: | $1,468 |
| Seattle: | $1,670 |
Male vs Females
| Males: | 8,450 |
| Females: | 6,350 |
Median age
| Males: | 39.1 years |
| Females: | 42.2 years |
Housing prices:
Average estimated value of detached houses in 2021 (30.7% of all units):
| North Beacon Hill: | $629,433 |
| Seattle: | $906,138 |
Average estimated value of townhouses or other attached units in 2021 (13.5% of all units):
| This neighborhood: | $600,533 |
| city: | $615,733 |
Average estimated '21 value of housing units in 5-or-more-unit structures (29.3% of all units):
| North Beacon Hill: | $376,488 |
| Seattle: | $570,782 |
Most popular occupations of males: computer and mathematical occupations (15.1%); sales and office occupations (14.8%); transportation occupations (13.4%); service occupations (10.3%); arts, design, entertainment, sports, and media occupations (8.6%); management occupations (except farmers) (8.2%); architecture and engineering occupations (5.9%)
Most popular occupations of females: service occupations (21.1%); business and financial operations occupations (19.2%); management occupations (except farmers) (15.0%); sales and office occupations (14.9%); computer and mathematical occupations (7.7%); healthcare practitioners and technical occupations (7.2%); education, training, and library occupations (3.3%)
Limited-access highways (interstate or state) in this neighborhood: I- 90.
Roads and streets: Beacon Ave S; 15th Ave S; 16th Ave S; Rainier Ave; 14th Ave S; S Mc Clellan St; 17th Ave S; S Forest St; 19th Ave S; 18th Ave S; 12th Ave S; 13th Ave S; S Stevens St; 20th Ave S; 21st Ave S; S Hanford St; S Lander St; S Hinds St; S Bayview St; S Walker St; S Spokane St; S College St; S Hill St; Cheasty Blvd S; S Horton St; 25th Ave S; 22nd Ave S; 23rd Ave S; S Plum St; S Winthrop St; S Holgate St; 24th Ave S; S Massachusetts St; Sturgus Ave S; S State St; S Waite St; S Grand St; S Atlantic St; 11th Ave S; Harris Pl S; 24th Pl S; Poplar Pl S; Golf Dr S; S Columbian Way; S Snoqualmie St; S Charles St; Lafayette Ave S; S Judkins St; S Hinds Pl; Valentine Pl S; South Dakota St; Alamo Pl S; S Andover St; S Dean St; S Bush Pl; S Norman St; S Bradford St; Cherry Ln Pl S; Horton St; 26th Ave S; 27th Ave S; Hanford St; Sturgus Ave; S Nevada St; Sander Rd S; Bayview St; Martin Luther King Way S; Sturgus St S; S Massachusetts Ave; S Alaska St; Dr Jose P Rizal Brg.
North Beacon Hill neighborhood detailed profile
North College Park neighborhood in Seattle statistics: (Find on map)
Area: 0.791 square miles
Population: 8,920
Population density:
Median household income in 2021:
Median rent in in 2021:
Male vs Females
Median age
Housing prices:
Average estimated value of detached houses in 2021 (40.5% of all units):
Average estimated '21 value of housing units in 5-or-more-unit structures (12.1% of all units):
Most popular occupations of males: sales and office occupations (18.3%); computer and mathematical occupations (15.1%); management occupations (except farmers) (13.6%); architecture and engineering occupations (10.2%); service occupations (9.0%); production occupations (7.2%); education, training, and library occupations (6.0%)
Most popular occupations of females: sales and office occupations (19.2%); service occupations (17.4%); education, training, and library occupations (12.2%); healthcare practitioners and technical occupations (10.1%); management occupations (except farmers) (9.2%); community and social services occupations (5.6%); business and financial operations occupations (5.4%)
Limited-access highways (interstate or state) in this neighborhood: I- 5.
Roads and streets: College Way N; Wallingford Ave N; Stone Ave N; N 85th St; Densmore Ave N; Ashworth Ave N; N 90th St; N 88th St; N 92nd St; N 95th St; N 103rd St; Interlake Ave N; Meridian Ave N; N 97th St; N Northgate Way; Midvale Ave N; N 100th St; N 105th St; Burke Ave N; Corliss Ave N; N 107th St; Nesbit Ave N; Woodlawn Ave N; N 86th St; N 87th St; N 89th St; N 106th St; N 94th St; N 96th St; Meridian Pl N; Caroline Ave N; Bagley Ave N; 100th St.
North College Park neighborhood detailed profile
Area: 0.791 square miles
Population: 8,920
Population density:
| North College Park: | 11,274 people per square mile |
| Seattle: | 8,750 people per square mile |
Median household income in 2021:
| North College Park: | $100,455 |
| Seattle: | $110,781 |
Median rent in in 2021:
| North College Park: | $1,592 |
| Seattle: | $1,670 |
Male vs Females
| Males: | 4,453 |
| Females: | 4,466 |
Median age
| Males: | 35.3 years |
| Females: | 33.4 years |
Housing prices:
Average estimated value of detached houses in 2021 (40.5% of all units):
| North College Park: | $1,007,529 |
| Seattle: | $906,138 |
Average estimated '21 value of housing units in 5-or-more-unit structures (12.1% of all units):
| North College Park: | $391,741 |
| Seattle: | $570,782 |
Most popular occupations of males: sales and office occupations (18.3%); computer and mathematical occupations (15.1%); management occupations (except farmers) (13.6%); architecture and engineering occupations (10.2%); service occupations (9.0%); production occupations (7.2%); education, training, and library occupations (6.0%)
Most popular occupations of females: sales and office occupations (19.2%); service occupations (17.4%); education, training, and library occupations (12.2%); healthcare practitioners and technical occupations (10.1%); management occupations (except farmers) (9.2%); community and social services occupations (5.6%); business and financial operations occupations (5.4%)
Limited-access highways (interstate or state) in this neighborhood: I- 5.
Roads and streets: College Way N; Wallingford Ave N; Stone Ave N; N 85th St; Densmore Ave N; Ashworth Ave N; N 90th St; N 88th St; N 92nd St; N 95th St; N 103rd St; Interlake Ave N; Meridian Ave N; N 97th St; N Northgate Way; Midvale Ave N; N 100th St; N 105th St; Burke Ave N; Corliss Ave N; N 107th St; Nesbit Ave N; Woodlawn Ave N; N 86th St; N 87th St; N 89th St; N 106th St; N 94th St; N 96th St; Meridian Pl N; Caroline Ave N; Bagley Ave N; 100th St.
North College Park neighborhood detailed profile
North Delridge neighborhood in Seattle statistics: (Find on map)
Area: 1.040 square miles
Population: 4,479
Population density:
Median household income in 2021:
Median rent in in 2021:
Male vs Females
Median age
Housing prices:
Average estimated value of detached houses in 2021 (42.6% of all units):
Average estimated value of townhouses or other attached units in 2021 (12.2% of all units):
Average estimated '21 value of housing units in 5-or-more-unit structures (26.8% of all units):
Most popular occupations of males: sales and office occupations (20.2%); management occupations (except farmers) (15.1%); service occupations (11.6%); business and financial operations occupations (9.4%); computer and mathematical occupations (9.3%); production occupations (5.2%); healthcare practitioners and technical occupations (5.1%)
Most popular occupations of females: sales and office occupations (17.6%); management occupations (except farmers) (15.6%); healthcare practitioners and technical occupations (15.6%); service occupations (15.2%); business and financial operations occupations (15.0%); education, training, and library occupations (6.7%); computer and mathematical occupations (3.8%)
Roads and streets: 21st Ave SW; 23rd Ave SW; Delridge Way SW; SW Genesee St; 26th Ave SW; SW Andover St; SW Brandon St; 25th Ave SW; 22nd Ave SW; W Marginal Way SW; SW Charlestown St; 20th Ave SW; SW Alaska St; 19th Ave SW; SW Dakota St; SW Edmunds St; SW Nevada St; 16th Ave SW; SW Hudson St; 34th Ave SW; Puget Blvd SW; SW Adams St; 28th Ave SW; 14th Ave SW; Marginal Pl SW; 17th Ave SW; SW Yancy St; Cottage Pl SW; 18th Ave SW; 30th Ave SW; SW Oregon St; 31st Ave SW; SW Dawson St; 15th Ave SW; SW Marginal Pl; 24th Ave SW.
Railroad features: Burlington Northern Santa Fe Rlwy.
North Delridge neighborhood detailed profile
Area: 1.040 square miles
Population: 4,479
Population density:
| North Delridge: | 4,305 people per square mile |
| Seattle: | 8,750 people per square mile |
Median household income in 2021:
| North Delridge: | $101,925 |
| Seattle: | $110,781 |
Median rent in in 2021:
| North Delridge: | $1,840 |
| Seattle: | $1,670 |
Male vs Females
| Males: | 2,053 |
| Females: | 2,426 |
Median age
| Males: | 38.5 years |
| Females: | 37.5 years |
Housing prices:
Average estimated value of detached houses in 2021 (42.6% of all units):
| North Delridge: | $561,322 |
| Seattle: | $906,138 |
Average estimated value of townhouses or other attached units in 2021 (12.2% of all units):
| This neighborhood: | $502,223 |
| city: | $615,733 |
Average estimated '21 value of housing units in 5-or-more-unit structures (26.8% of all units):
| North Delridge: | $360,091 |
| Seattle: | $570,782 |
Most popular occupations of males: sales and office occupations (20.2%); management occupations (except farmers) (15.1%); service occupations (11.6%); business and financial operations occupations (9.4%); computer and mathematical occupations (9.3%); production occupations (5.2%); healthcare practitioners and technical occupations (5.1%)
Most popular occupations of females: sales and office occupations (17.6%); management occupations (except farmers) (15.6%); healthcare practitioners and technical occupations (15.6%); service occupations (15.2%); business and financial operations occupations (15.0%); education, training, and library occupations (6.7%); computer and mathematical occupations (3.8%)
Roads and streets: 21st Ave SW; 23rd Ave SW; Delridge Way SW; SW Genesee St; 26th Ave SW; SW Andover St; SW Brandon St; 25th Ave SW; 22nd Ave SW; W Marginal Way SW; SW Charlestown St; 20th Ave SW; SW Alaska St; 19th Ave SW; SW Dakota St; SW Edmunds St; SW Nevada St; 16th Ave SW; SW Hudson St; 34th Ave SW; Puget Blvd SW; SW Adams St; 28th Ave SW; 14th Ave SW; Marginal Pl SW; 17th Ave SW; SW Yancy St; Cottage Pl SW; 18th Ave SW; 30th Ave SW; SW Oregon St; 31st Ave SW; SW Dawson St; 15th Ave SW; SW Marginal Pl; 24th Ave SW.
Railroad features: Burlington Northern Santa Fe Rlwy.
North Delridge neighborhood detailed profile
North Queen Anne neighborhood in Seattle statistics: (Find on map)
Area: 1.064 square miles
Population: 13,138
Population density:
Median household income in 2021:
Median rent in in 2021:
Male vs Females
Median age
Housing prices:
Average estimated value of detached houses in 2021 (41.8% of all units):
Average estimated value of townhouses or other attached units in 2021 (4.7% of all units):
Average estimated '21 value of housing units in 5-or-more-unit structures (6.8% of all units):
Most popular occupations of males: sales and office occupations (23.9%); service occupations (20.5%); management occupations (except farmers) (11.9%); computer and mathematical occupations (9.9%); architecture and engineering occupations (4.8%); business and financial operations occupations (4.6%); life, physical, and social science occupations (4.5%)
Most popular occupations of females: management occupations (except farmers) (20.3%); service occupations (16.4%); sales and office occupations (11.4%); healthcare practitioners and technical occupations (9.4%); business and financial operations occupations (9.0%); computer and mathematical occupations (6.3%); education, training, and library occupations (4.7%)
Roads and streets: W Ewing St; W Nickerson St; 13th Ave W; W Emerson St; W Bertona St; W Raye St; W Dravus St; 3rd Ave W; 11th Ave W; W Barrett St; 8th Ave W; 12th Ave W; 5th Ave W; 10th Ave W; 14th Ave W; W Etruria St; W Halladay St; 9th Ave W; W Smith St; W Armour St; Queen Anne Ave N; W Cremona St; Nickerson St; 4th Ave W; Florentia St; W Fulton St; Newell St; W Newell St; 1st Ave W; Fulton St; Westlake Ave N; Etruria St; 6th Ave W; Warren Ave N; 7th Ave W; 1st Ave N; W Wheeler St; 3rd Ave N; 4th Ave N; W Ruffner St; Prosch Ave W; Mayfair Ave N; W Bothwell St; Raye St; 2nd Ave N; Conkling Pl W; Dravus St; W Florentia St; Westview Dr W; Nob Hill Ave N; W Blewett Way; Jesse Ave W; Humes Pl W; 15th Pl W; W Florentia Pl; 10th Pl W; 2nd Ave W; W Mc Graw Pl; W Pleasant Pl; Sound View Ter W; W Argand St; Armour St; W Ewing Pl; W Aetna St; Cremona St; W McGraw Pl; Irondale Ave W; Dexter Ave N.
Railroad features: Burlington Northern Santa Fe Rlwy.
North Queen Anne neighborhood detailed profile
Area: 1.064 square miles
Population: 13,138
Population density:
| North Queen Anne: | 12,345 people per square mile |
| Seattle: | 8,750 people per square mile |
Median household income in 2021:
| North Queen Anne: | $136,044 |
| Seattle: | $110,781 |
Median rent in in 2021:
| North Queen Anne: | $1,805 |
| Seattle: | $1,670 |
Male vs Females
| Males: | 6,737 |
| Females: | 6,400 |
Median age
| Males: | 36.7 years |
| Females: | 37.3 years |
Housing prices:
Average estimated value of detached houses in 2021 (41.8% of all units):
| North Queen Anne: | $1,207,179 |
| Seattle: | $906,138 |
Average estimated value of townhouses or other attached units in 2021 (4.7% of all units):
| This neighborhood: | $1,781,895 |
| city: | $615,733 |
Average estimated '21 value of housing units in 5-or-more-unit structures (6.8% of all units):
| North Queen Anne: | $198,682 |
| Seattle: | $570,782 |
Most popular occupations of males: sales and office occupations (23.9%); service occupations (20.5%); management occupations (except farmers) (11.9%); computer and mathematical occupations (9.9%); architecture and engineering occupations (4.8%); business and financial operations occupations (4.6%); life, physical, and social science occupations (4.5%)
Most popular occupations of females: management occupations (except farmers) (20.3%); service occupations (16.4%); sales and office occupations (11.4%); healthcare practitioners and technical occupations (9.4%); business and financial operations occupations (9.0%); computer and mathematical occupations (6.3%); education, training, and library occupations (4.7%)
Roads and streets: W Ewing St; W Nickerson St; 13th Ave W; W Emerson St; W Bertona St; W Raye St; W Dravus St; 3rd Ave W; 11th Ave W; W Barrett St; 8th Ave W; 12th Ave W; 5th Ave W; 10th Ave W; 14th Ave W; W Etruria St; W Halladay St; 9th Ave W; W Smith St; W Armour St; Queen Anne Ave N; W Cremona St; Nickerson St; 4th Ave W; Florentia St; W Fulton St; Newell St; W Newell St; 1st Ave W; Fulton St; Westlake Ave N; Etruria St; 6th Ave W; Warren Ave N; 7th Ave W; 1st Ave N; W Wheeler St; 3rd Ave N; 4th Ave N; W Ruffner St; Prosch Ave W; Mayfair Ave N; W Bothwell St; Raye St; 2nd Ave N; Conkling Pl W; Dravus St; W Florentia St; Westview Dr W; Nob Hill Ave N; W Blewett Way; Jesse Ave W; Humes Pl W; 15th Pl W; W Florentia Pl; 10th Pl W; 2nd Ave W; W Mc Graw Pl; W Pleasant Pl; Sound View Ter W; W Argand St; Armour St; W Ewing Pl; W Aetna St; Cremona St; W McGraw Pl; Irondale Ave W; Dexter Ave N.
Railroad features: Burlington Northern Santa Fe Rlwy.
North Queen Anne neighborhood detailed profile
Northgate neighborhood in Seattle statistics: (Find on map)
Area: 4.794 square miles
Population: 46,593
Population density:
Median household income in 2021:
Median rent in in 2021:
Male vs Females
Median age
Housing prices:
Average estimated value of detached houses in 2021 (60.9% of all units):
Average estimated '21 value of housing units in 5-or-more-unit structures (17.6% of all units):
Most popular occupations of males: management occupations (except farmers) (15.2%); computer and mathematical occupations (15.0%); sales and office occupations (14.3%); service occupations (9.3%); architecture and engineering occupations (8.4%); business and financial operations occupations (5.3%); production occupations (5.0%)
Most popular occupations of females: sales and office occupations (19.8%); service occupations (15.3%); management occupations (except farmers) (12.8%); education, training, and library occupations (10.2%); healthcare practitioners and technical occupations (9.6%); business and financial operations occupations (7.3%); computer and mathematical occupations (6.7%)
Limited-access highways (interstate or state) in this neighborhood: I- 5.
Highways in this neighborhood: State Rte 522 (Lake City Way NE); Aurora Ave N (State Rte 99).
Roads and streets: 5th Ave NE; 1st Ave NE; 15th Ave NE; Roosevelt Way NE; Stone Ave N; 8th Ave NE; Ashworth Ave N; Meridian Ave N; 12th Ave NE; Densmore Ave N; Corliss Ave N; NE 90th St; NE 91st St; NE 92nd St; 3rd Ave NE; NE 94th St; NE 89th St; Wallingford Ave N; NE 95th St; NE 88th St; NE 97th St; Roosevelt Way N; Interlake Ave N; NE 85th St; NE 100th St; NE 103rd St; N 137th St; NE Northgate Way; N Northgate Way; College Way N; NE 125th St; N 143rd St; NE 120th St; NE 96th St; NE 115th St; N 85th St; NE 130th St; Midvale Ave N; NE 117th St; Burke Ave N; NE 123rd St; N 130th St; N 128th St; N 115th St; N 92nd St; N 122nd St; N 90th St; N 107th St; 14th Ave NE; 2nd Ave NE; N 88th St; NE 86th St; N 140th St; N 95th St; N 103rd St; NE 98th St; NE 102nd St; N 135th St; NE 127th St; N 120th St; 4th Ave NE; NE 104th St; N 125th St; NE 105th St; 17th Ave NE; 20th Ave NE; NE 135th St; N 97th St; 11th Ave NE; 10th Ave NE; N 117th St; Pinehurst Way NE; N 133rd St; NE 140th St; N 100th St; N 105th St; NE 112th St; NE 113th St; 9th Ave NE; NE 133rd St; NE 107th St; NE 106th St; NE 114th St; Bagley Ave N; Latona Ave NE; Nesbit Ave N; N 110th St; Sunnyside Ave N; N 121st St; Stendall Dr N; Stendall Pl N; N 116th St; Woodlawn Ave N; N 113th St; NE 126th St; 7th Ave NE; NE 124th St; N 131st St; N 87th St; N 86th St; N 89th St; N 106th St; NE 143rd St; NE 139th St; Lenora Pl N; NE 108th St; 10th Pl NE; Par Pl NE; N 122nd Pl; N 112th St; N 136th St; NE 111th St; L St NE; Courtland Pl N; N 134th St; Roslyn Pl N; NE 137th St; N 94th St; Wayne Pl N; NE 128th St; NE 136th St; N 96th St; NE 131st Pl; NE Brockman Pl; N 132nd St; 8th Ct NE; N 114th St; NE 105th Pl; NE 122nd St; N 113th Pl; Ravenna Ave NE; Meridian Pl N; NE 96th Pl; NE 12th Ave; 17th Pl NE; 16th Ave NE; Caroline Ave N; N 135th Pl; Northgate West Dr; Northgate Mall; 14th Pl NE; NE 116th St; 6th Pl NE; 100th St; Northgate Plz; Northgate East Dr; N 104th St; 18th Ave NE; NE 130th Pl.
Northgate neighborhood detailed profile
Area: 4.794 square miles
Population: 46,593
Population density:
| Northgate: | 9,718 people per square mile |
| Seattle: | 8,750 people per square mile |
Median household income in 2021:
| Northgate: | $115,580 |
| Seattle: | $110,781 |
Median rent in in 2021:
| Northgate: | $1,730 |
| Seattle: | $1,670 |
Male vs Females
| Males: | 23,252 |
| Females: | 23,340 |
Median age
| Males: | 36.9 years |
| Females: | 35.8 years |
Housing prices:
Average estimated value of detached houses in 2021 (60.9% of all units):
| Northgate: | $799,335 |
| Seattle: | $906,138 |
Average estimated '21 value of housing units in 5-or-more-unit structures (17.6% of all units):
| Northgate: | $289,440 |
| Seattle: | $570,782 |
Most popular occupations of males: management occupations (except farmers) (15.2%); computer and mathematical occupations (15.0%); sales and office occupations (14.3%); service occupations (9.3%); architecture and engineering occupations (8.4%); business and financial operations occupations (5.3%); production occupations (5.0%)
Most popular occupations of females: sales and office occupations (19.8%); service occupations (15.3%); management occupations (except farmers) (12.8%); education, training, and library occupations (10.2%); healthcare practitioners and technical occupations (9.6%); business and financial operations occupations (7.3%); computer and mathematical occupations (6.7%)
Limited-access highways (interstate or state) in this neighborhood: I- 5.
Highways in this neighborhood: State Rte 522 (Lake City Way NE); Aurora Ave N (State Rte 99).
Roads and streets: 5th Ave NE; 1st Ave NE; 15th Ave NE; Roosevelt Way NE; Stone Ave N; 8th Ave NE; Ashworth Ave N; Meridian Ave N; 12th Ave NE; Densmore Ave N; Corliss Ave N; NE 90th St; NE 91st St; NE 92nd St; 3rd Ave NE; NE 94th St; NE 89th St; Wallingford Ave N; NE 95th St; NE 88th St; NE 97th St; Roosevelt Way N; Interlake Ave N; NE 85th St; NE 100th St; NE 103rd St; N 137th St; NE Northgate Way; N Northgate Way; College Way N; NE 125th St; N 143rd St; NE 120th St; NE 96th St; NE 115th St; N 85th St; NE 130th St; Midvale Ave N; NE 117th St; Burke Ave N; NE 123rd St; N 130th St; N 128th St; N 115th St; N 92nd St; N 122nd St; N 90th St; N 107th St; 14th Ave NE; 2nd Ave NE; N 88th St; NE 86th St; N 140th St; N 95th St; N 103rd St; NE 98th St; NE 102nd St; N 135th St; NE 127th St; N 120th St; 4th Ave NE; NE 104th St; N 125th St; NE 105th St; 17th Ave NE; 20th Ave NE; NE 135th St; N 97th St; 11th Ave NE; 10th Ave NE; N 117th St; Pinehurst Way NE; N 133rd St; NE 140th St; N 100th St; N 105th St; NE 112th St; NE 113th St; 9th Ave NE; NE 133rd St; NE 107th St; NE 106th St; NE 114th St; Bagley Ave N; Latona Ave NE; Nesbit Ave N; N 110th St; Sunnyside Ave N; N 121st St; Stendall Dr N; Stendall Pl N; N 116th St; Woodlawn Ave N; N 113th St; NE 126th St; 7th Ave NE; NE 124th St; N 131st St; N 87th St; N 86th St; N 89th St; N 106th St; NE 143rd St; NE 139th St; Lenora Pl N; NE 108th St; 10th Pl NE; Par Pl NE; N 122nd Pl; N 112th St; N 136th St; NE 111th St; L St NE; Courtland Pl N; N 134th St; Roslyn Pl N; NE 137th St; N 94th St; Wayne Pl N; NE 128th St; NE 136th St; N 96th St; NE 131st Pl; NE Brockman Pl; N 132nd St; 8th Ct NE; N 114th St; NE 105th Pl; NE 122nd St; N 113th Pl; Ravenna Ave NE; Meridian Pl N; NE 96th Pl; NE 12th Ave; 17th Pl NE; 16th Ave NE; Caroline Ave N; N 135th Pl; Northgate West Dr; Northgate Mall; 14th Pl NE; NE 116th St; 6th Pl NE; 100th St; Northgate Plz; Northgate East Dr; N 104th St; 18th Ave NE; NE 130th Pl.
Northgate neighborhood detailed profile
Olympic Hills neighborhood in Seattle statistics: (Find on map)
Area: 0.910 square miles
Population: 20,298
Population density:
Median household income in 2021:
Median rent in in 2021:
Male vs Females
Median age
Most popular occupations of males: sales and office occupations (17.5%); production occupations (16.6%); material moving occupations (12.7%); education, training, and library occupations (10.6%); service occupations (9.6%); construction, extraction, and maintenance occupations (8.3%); architecture and engineering occupations (7.6%)
Most popular occupations of females: service occupations (17.6%); healthcare practitioners and technical occupations (17.2%); sales and office occupations (16.7%); education, training, and library occupations (13.6%); business and financial operations occupations (11.9%); production occupations (10.8%); management occupations (except farmers) (4.4%)
Highways in this neighborhood: State Rte 522 (Lake City Way NE).
Roads and streets: NE 135th St; NE 137th St; NE 143rd St; NE 140th St; NE 130th St; 27th Ave NE; NE 127th St; 30th Ave NE; 25th Ave NE; NE 133rd St; 28th Ave NE; 23rd Ave NE; 20th Ave NE; 26th Ave NE; 19th Ave NE; 23rd Pl NE; 22nd Ave NE; NE 125th St; 17th Ave NE; 32nd Ave NE; NE 136th St; NE 130th Pl; NE 134th St; 24th Ave NE; 31st Ave NE; NE 128th St; NE Brockman Pl; 16th Ave NE; 15th Pl NE; NE 135th Pl; NE 138th St; NE 143rd Pl; NE 144th St.
Olympic Hills neighborhood detailed profile
Area: 0.910 square miles
Population: 20,298
Population density:
| Olympic Hills: | 22,294 people per square mile |
| Seattle: | 8,750 people per square mile |
Median household income in 2021:
| Olympic Hills: | $86,810 |
| Seattle: | $110,781 |
Median rent in in 2021:
| Olympic Hills: | $1,580 |
| Seattle: | $1,670 |
Male vs Females
| Males: | 8,901 |
| Females: | 11,397 |
Median age
| Males: | 38.4 years |
| Females: | 44.2 years |
Most popular occupations of males: sales and office occupations (17.5%); production occupations (16.6%); material moving occupations (12.7%); education, training, and library occupations (10.6%); service occupations (9.6%); construction, extraction, and maintenance occupations (8.3%); architecture and engineering occupations (7.6%)
Most popular occupations of females: service occupations (17.6%); healthcare practitioners and technical occupations (17.2%); sales and office occupations (16.7%); education, training, and library occupations (13.6%); business and financial operations occupations (11.9%); production occupations (10.8%); management occupations (except farmers) (4.4%)
Highways in this neighborhood: State Rte 522 (Lake City Way NE).
Roads and streets: NE 135th St; NE 137th St; NE 143rd St; NE 140th St; NE 130th St; 27th Ave NE; NE 127th St; 30th Ave NE; 25th Ave NE; NE 133rd St; 28th Ave NE; 23rd Ave NE; 20th Ave NE; 26th Ave NE; 19th Ave NE; 23rd Pl NE; 22nd Ave NE; NE 125th St; 17th Ave NE; 32nd Ave NE; NE 136th St; NE 130th Pl; NE 134th St; 24th Ave NE; 31st Ave NE; NE 128th St; NE Brockman Pl; 16th Ave NE; 15th Pl NE; NE 135th Pl; NE 138th St; NE 143rd Pl; NE 144th St.
Olympic Hills neighborhood detailed profile
Orillia neighborhood in Seattle statistics: (Find on map)
Area: 7.085 square miles
Population: 3,698
Population density:
Median household income in 2021:
Median rent in in 2021:
Male vs Females
Median age
Housing prices:
Average estimated value of detached houses in 2021 (129.1% of all units):
Average estimated value of mobile home in 2021 (29.1% of all units):
Most popular occupations of males: sales and office occupations (17.2%); transportation occupations (14.9%); service occupations (14.7%); computer and mathematical occupations (9.1%); construction, extraction, and maintenance occupations (8.8%); production occupations (7.9%); management occupations (except farmers) (6.9%)
Most popular occupations of females: sales and office occupations (40.0%); service occupations (12.9%); management occupations (except farmers) (12.6%); business and financial operations occupations (6.0%); healthcare practitioners and technical occupations (5.9%); arts, design, entertainment, sports, and media occupations (5.0%); education, training, and library occupations (4.0%)
Limited-access highways (interstate or state) in this neighborhood: I- 405; I- 5.
Highways in this neighborhood: State Rte 167; State Rte 181 (W Valley Rd); State Rte 181 (W Valley Rd, 68th Ave S); State Rte 518; State Rte 167 (Rainier Ave).
Roads and streets: S 196th St; S 194th St; S 190th St; SW 43rd St (S 180th St); S 192nd St; Lind Ave SW; Andover Park W; E Rainier Ave S (E Valley Rd); Oakesdale Ave SW; Christensen Rd; SW 27th St; SW 16th St; Andover Park E; Southcenter Pkwy; Strander Blvd; 84th Ave S; Minkler Blvd; Orillia Rd S; 80th Ave S; S 188th St; 72nd Ave S; S 180th St; SW 34th St; SW 41st St; Tukwila Pkwy; 57th Ave S (Southcenter Pkwy); 80th Pl S; Industry Dr; Frager Rd (Frager Rd S); Southcenter Blvd; Longacres Dr SW; SW 19th St; S 184th St; SW 23rd St; Longacres Way (SW 21st St); S 182nd St; SW 39th St; S 178th St; S 200th St; S 187th St; Christensen Rd (S 164th St); Raymond Ave SW; Baker Blvd; Segale Park Dr C; S 186th Pl; S 193rd St; S 198th St; 66th Ave S; 62nd Ave S; Russell Rd; Triland Dr; Military Rd S; SW 13th St; 70th Ave S; Segale Park Dr B; Klickitat Dr; S 168th St; Cascade Ave S; S Grady Way (S 153rd St, SW Grady Way); Olympic Ave S; S Todd Blvd; Segale Park Dr D; SW 29th St; Sperry Dr; 77th Pl S; Upland Dr; S 75th Pl; Saxon Dr; Midland Dr; 88th Ave S; S Glacier St; 200th St; S Grady Way (SW Grady Way); 64th Ave S; Riverside Dr; Treck Dr; Nelson Pl; 54th Ave S; 58th Pl S; S 194th Pl; Corporate Dr S; Corporate Dr N; 53rd Ave S; Evans Black Dr; 61st Pl S; S 23rd St; S 192nd Pl; 78th Ave S; S 191st Pl; S 185th Pl; S 156th St; S 208th St; 61st Ave S; S 193rd Pl; SW Grady Way; Seneca Ave SW; Sperry Dr S; Maple Ave SW; 71st Ave S; 54th Pl S; S 181st St; Interurban Ave S; Fun Center Way; Longacres Dr SW (Grady Way); S 55th St (S 192nd St); 180th St Brg; 46th Ave S; Taylor Ave SW; 81st Ave S.
Railroad features: Burlington Northern Santa Fe Rlwy; Union Pacific RR.
Other features: Green Riv; Black Riv.
Orillia neighborhood detailed profile
Area: 7.085 square miles
Population: 3,698
Population density:
| Orillia: | 522 people per square mile |
| Seattle: | 8,750 people per square mile |
Median household income in 2021:
| Orillia: | $82,892 |
| Seattle: | $110,781 |
Median rent in in 2021:
| Orillia: | $1,609 |
| Seattle: | $1,670 |
Male vs Females
| Males: | 1,991 |
| Females: | 1,706 |
Median age
| Males: | 38.5 years |
| Females: | 34.6 years |
Housing prices:
Average estimated value of detached houses in 2021 (129.1% of all units):
| Orillia: | $516,463 |
| Seattle: | $906,138 |
Average estimated value of mobile home in 2021 (29.1% of all units):
| Orillia: | $21,821 |
| Seattle: | $1,185,654 |
Most popular occupations of males: sales and office occupations (17.2%); transportation occupations (14.9%); service occupations (14.7%); computer and mathematical occupations (9.1%); construction, extraction, and maintenance occupations (8.8%); production occupations (7.9%); management occupations (except farmers) (6.9%)
Most popular occupations of females: sales and office occupations (40.0%); service occupations (12.9%); management occupations (except farmers) (12.6%); business and financial operations occupations (6.0%); healthcare practitioners and technical occupations (5.9%); arts, design, entertainment, sports, and media occupations (5.0%); education, training, and library occupations (4.0%)
Limited-access highways (interstate or state) in this neighborhood: I- 405; I- 5.
Highways in this neighborhood: State Rte 167; State Rte 181 (W Valley Rd); State Rte 181 (W Valley Rd, 68th Ave S); State Rte 518; State Rte 167 (Rainier Ave).
Roads and streets: S 196th St; S 194th St; S 190th St; SW 43rd St (S 180th St); S 192nd St; Lind Ave SW; Andover Park W; E Rainier Ave S (E Valley Rd); Oakesdale Ave SW; Christensen Rd; SW 27th St; SW 16th St; Andover Park E; Southcenter Pkwy; Strander Blvd; 84th Ave S; Minkler Blvd; Orillia Rd S; 80th Ave S; S 188th St; 72nd Ave S; S 180th St; SW 34th St; SW 41st St; Tukwila Pkwy; 57th Ave S (Southcenter Pkwy); 80th Pl S; Industry Dr; Frager Rd (Frager Rd S); Southcenter Blvd; Longacres Dr SW; SW 19th St; S 184th St; SW 23rd St; Longacres Way (SW 21st St); S 182nd St; SW 39th St; S 178th St; S 200th St; S 187th St; Christensen Rd (S 164th St); Raymond Ave SW; Baker Blvd; Segale Park Dr C; S 186th Pl; S 193rd St; S 198th St; 66th Ave S; 62nd Ave S; Russell Rd; Triland Dr; Military Rd S; SW 13th St; 70th Ave S; Segale Park Dr B; Klickitat Dr; S 168th St; Cascade Ave S; S Grady Way (S 153rd St, SW Grady Way); Olympic Ave S; S Todd Blvd; Segale Park Dr D; SW 29th St; Sperry Dr; 77th Pl S; Upland Dr; S 75th Pl; Saxon Dr; Midland Dr; 88th Ave S; S Glacier St; 200th St; S Grady Way (SW Grady Way); 64th Ave S; Riverside Dr; Treck Dr; Nelson Pl; 54th Ave S; 58th Pl S; S 194th Pl; Corporate Dr S; Corporate Dr N; 53rd Ave S; Evans Black Dr; 61st Pl S; S 23rd St; S 192nd Pl; 78th Ave S; S 191st Pl; S 185th Pl; S 156th St; S 208th St; 61st Ave S; S 193rd Pl; SW Grady Way; Seneca Ave SW; Sperry Dr S; Maple Ave SW; 71st Ave S; 54th Pl S; S 181st St; Interurban Ave S; Fun Center Way; Longacres Dr SW (Grady Way); S 55th St (S 192nd St); 180th St Brg; 46th Ave S; Taylor Ave SW; 81st Ave S.
Railroad features: Burlington Northern Santa Fe Rlwy; Union Pacific RR.
Other features: Green Riv; Black Riv.
Orillia neighborhood detailed profile
Phinney Ridge neighborhood in Seattle statistics: (Find on map)
Area: 0.838 square miles
Population: 12,377
Population density:
Median household income in 2021:
Median rent in in 2021:
Male vs Females
Median age
Housing prices:
Average estimated value of detached houses in 2021 (70.1% of all units):
Average estimated value of townhouses or other attached units in 2021 (4.6% of all units):
Average estimated '21 value of housing units in 5-or-more-unit structures (10.7% of all units):
Most popular occupations of males: management occupations (except farmers) (17.6%); computer and mathematical occupations (15.9%); sales and office occupations (11.9%); architecture and engineering occupations (8.6%); service occupations (6.6%); construction, extraction, and maintenance occupations (5.7%); business and financial operations occupations (5.1%)
Most popular occupations of females: management occupations (except farmers) (17.8%); healthcare practitioners and technical occupations (15.3%); sales and office occupations (13.5%); business and financial operations occupations (11.1%); education, training, and library occupations (10.8%); service occupations (10.0%); arts, design, entertainment, sports, and media occupations (6.8%)
Highways in this neighborhood: State Rte 99 (Aurora Ave N).
Roads and streets: Greenwood Ave N; 1st Ave NW; Phinney Ave N; 2nd Ave NW; N 73rd St; N 74th St; N 72nd St; Palatine Ave N; N 70th St; N 65th St; Linden Ave N; N 67th St; Dayton Ave N; Fremont Ave N; N 59th St; N 62nd St; N 60th St; N 71st St; N 68th St; Sycamore Ave NW; N 63rd St; NW 67th St; NW 70th St; N 61st St; Woodland Pl N; N 64th St; NW 73rd St; NW 65th St; 3rd Ave NW; 6th Ave NW; N 66th St; NW 72nd St; Cleopatra Pl NW; 4th Ave NW; 5th Ave NW; 7th Ave NW; NW 74th St; Evanston Ave N; N 57th St; N 58th St; NW 53rd St; N 52nd St; N 54th St; N 51st St; N Argyle Pl; N 55th St; NW 55th St; NW 52nd St; Francis Ave N; Winona Ave N; NW 62nd St; NW 60th St; NW 58th St; NW 56th St; N 50th St; NW 54th St; N 49th St; N 48th St; NW 50th St; NW 51st St; N 47th St; Palmer Ct NW; N 53rd St; N 56th St; Palmer Dr NW; Baker Ave NW; Palatine Pl N.
Phinney Ridge neighborhood detailed profile
Area: 0.838 square miles
Population: 12,377
Population density:
| Phinney Ridge: | 14,768 people per square mile |
| Seattle: | 8,750 people per square mile |
Median household income in 2021:
| Phinney Ridge: | $133,560 |
| Seattle: | $110,781 |
Median rent in in 2021:
| Phinney Ridge: | $1,747 |
| Seattle: | $1,670 |
Male vs Females
| Males: | 6,196 |
| Females: | 6,180 |
Median age
| Males: | 38.8 years |
| Females: | 40.7 years |
Housing prices:
Average estimated value of detached houses in 2021 (70.1% of all units):
| Phinney Ridge: | $1,140,548 |
| Seattle: | $906,138 |
Average estimated value of townhouses or other attached units in 2021 (4.6% of all units):
| This neighborhood: | $807,046 |
| city: | $615,733 |
Average estimated '21 value of housing units in 5-or-more-unit structures (10.7% of all units):
| Phinney Ridge: | $380,000 |
| Seattle: | $570,782 |
Most popular occupations of males: management occupations (except farmers) (17.6%); computer and mathematical occupations (15.9%); sales and office occupations (11.9%); architecture and engineering occupations (8.6%); service occupations (6.6%); construction, extraction, and maintenance occupations (5.7%); business and financial operations occupations (5.1%)
Most popular occupations of females: management occupations (except farmers) (17.8%); healthcare practitioners and technical occupations (15.3%); sales and office occupations (13.5%); business and financial operations occupations (11.1%); education, training, and library occupations (10.8%); service occupations (10.0%); arts, design, entertainment, sports, and media occupations (6.8%)
Highways in this neighborhood: State Rte 99 (Aurora Ave N).
Roads and streets: Greenwood Ave N; 1st Ave NW; Phinney Ave N; 2nd Ave NW; N 73rd St; N 74th St; N 72nd St; Palatine Ave N; N 70th St; N 65th St; Linden Ave N; N 67th St; Dayton Ave N; Fremont Ave N; N 59th St; N 62nd St; N 60th St; N 71st St; N 68th St; Sycamore Ave NW; N 63rd St; NW 67th St; NW 70th St; N 61st St; Woodland Pl N; N 64th St; NW 73rd St; NW 65th St; 3rd Ave NW; 6th Ave NW; N 66th St; NW 72nd St; Cleopatra Pl NW; 4th Ave NW; 5th Ave NW; 7th Ave NW; NW 74th St; Evanston Ave N; N 57th St; N 58th St; NW 53rd St; N 52nd St; N 54th St; N 51st St; N Argyle Pl; N 55th St; NW 55th St; NW 52nd St; Francis Ave N; Winona Ave N; NW 62nd St; NW 60th St; NW 58th St; NW 56th St; N 50th St; NW 54th St; N 49th St; N 48th St; NW 50th St; NW 51st St; N 47th St; Palmer Ct NW; N 53rd St; N 56th St; Palmer Dr NW; Baker Ave NW; Palatine Pl N.
Phinney Ridge neighborhood detailed profile
Pike Place neighborhood in Seattle statistics: (Find on map)
Area: 0.074 square miles
Population: 2,069
Population density:
Median household income in 2021:
Median rent in in 2021:
Male vs Females
Median age
Average estimated '21 value of housing units in 5-or-more-unit structures (64.9% of all units):
Most popular occupations of males: management occupations (except farmers) (31.4%); business and financial operations occupations (17.7%); computer and mathematical occupations (16.4%); healthcare practitioners and technical occupations (11.2%); service occupations (8.2%); production occupations (7.9%); life, physical, and social science occupations (6.3%)
Most popular occupations of females: service occupations (25.4%); arts, design, entertainment, sports, and media occupations (14.3%); management occupations (except farmers) (12.5%); business and financial operations occupations (11.0%); education, training, and library occupations (9.8%); healthcare practitioners and technical occupations (6.8%); computer and mathematical occupations (6.6%)
Highways in this neighborhood: State Rte 99 (Alaska Fwy, Alaskan Way Viaduct).
Roads and streets: Western Ave; 2nd Ave; 1st Ave; Pike St; Pike Pl; Post Aly; Virginia St; Stewart St; Pine St; Union St; News Ln.
Railroad features: Burlington Northern Santa Fe Rlwy.
Pike Place neighborhood detailed profile
Area: 0.074 square miles
Population: 2,069
Population density:
| Pike Place: | 28,137 people per square mile |
| Seattle: | 8,750 people per square mile |
Median household income in 2021:
| Pike Place: | $82,430 |
| Seattle: | $110,781 |
Median rent in in 2021:
| Pike Place: | $890 |
| Seattle: | $1,670 |
Male vs Females
| Males: | 918 |
| Females: | 1,150 |
Median age
| Males: | 38.8 years |
| Females: | 42.1 years |
Average estimated '21 value of housing units in 5-or-more-unit structures (64.9% of all units):
| Pike Place: | $1,352,500 |
| Seattle: | $570,782 |
Most popular occupations of males: management occupations (except farmers) (31.4%); business and financial operations occupations (17.7%); computer and mathematical occupations (16.4%); healthcare practitioners and technical occupations (11.2%); service occupations (8.2%); production occupations (7.9%); life, physical, and social science occupations (6.3%)
Most popular occupations of females: service occupations (25.4%); arts, design, entertainment, sports, and media occupations (14.3%); management occupations (except farmers) (12.5%); business and financial operations occupations (11.0%); education, training, and library occupations (9.8%); healthcare practitioners and technical occupations (6.8%); computer and mathematical occupations (6.6%)
Highways in this neighborhood: State Rte 99 (Alaska Fwy, Alaskan Way Viaduct).
Roads and streets: Western Ave; 2nd Ave; 1st Ave; Pike St; Pike Pl; Post Aly; Virginia St; Stewart St; Pine St; Union St; News Ln.
Railroad features: Burlington Northern Santa Fe Rlwy.
Pike Place neighborhood detailed profile
Pinehurst neighborhood in Seattle statistics: (Find on map)
Area: 1.065 square miles
Population: 5,479
Population density:
Median household income in 2021:
Median rent in in 2021:
Male vs Females
Median age
Most popular occupations of males: management occupations (except farmers) (13.2%); healthcare practitioners and technical occupations (13.0%); production occupations (9.3%); life, physical, and social science occupations (8.9%); sales and office occupations (7.6%); service occupations (7.3%); business and financial operations occupations (7.1%)
Most popular occupations of females: service occupations (33.2%); sales and office occupations (15.2%); healthcare practitioners and technical occupations (11.9%); education, training, and library occupations (9.7%); computer and mathematical occupations (7.0%); community and social services occupations (6.8%); business and financial operations occupations (6.6%)
Limited-access highways (interstate or state) in this neighborhood: I- 5.
Roads and streets: 5th Ave NE; 15th Ave NE; Roosevelt Way NE; 12th Ave NE; NE 115th St; NE 117th St; NE 120th St; 8th Ave NE; NE 123rd St; NE 125th St; NE 127th St; NE 130th St; 14th Ave NE; 10th Ave NE; Pinehurst Way NE; NE 135th St; NE 112th St; NE 113th St; 3rd Ave NE; 1st Ave NE; 9th Ave NE; NE 114th St; 11th Ave NE; NE 126th St; NE 124th St; NE 140th St; NE 143rd St; 7th Ave NE; NE 111th St; 10th Pl NE; 4th Ave NE; NE 128th St; NE 131st Pl; NE Brockman Pl; 8th Ct NE; NE 133rd St; NE 122nd St; NE Northgate Way; NE 12th Ave; 14th Pl NE; NE 116th St; 6th Pl NE; NE 130th Pl.
Pinehurst neighborhood detailed profile
Area: 1.065 square miles
Population: 5,479
Population density:
| Pinehurst: | 5,143 people per square mile |
| Seattle: | 8,750 people per square mile |
Median household income in 2021:
| Pinehurst: | $100,963 |
| Seattle: | $110,781 |
Median rent in in 2021:
| Pinehurst: | $1,994 |
| Seattle: | $1,670 |
Male vs Females
| Males: | 2,297 |
| Females: | 3,182 |
Median age
| Males: | 41.6 years |
| Females: | 35.6 years |
Most popular occupations of males: management occupations (except farmers) (13.2%); healthcare practitioners and technical occupations (13.0%); production occupations (9.3%); life, physical, and social science occupations (8.9%); sales and office occupations (7.6%); service occupations (7.3%); business and financial operations occupations (7.1%)
Most popular occupations of females: service occupations (33.2%); sales and office occupations (15.2%); healthcare practitioners and technical occupations (11.9%); education, training, and library occupations (9.7%); computer and mathematical occupations (7.0%); community and social services occupations (6.8%); business and financial operations occupations (6.6%)
Limited-access highways (interstate or state) in this neighborhood: I- 5.
Roads and streets: 5th Ave NE; 15th Ave NE; Roosevelt Way NE; 12th Ave NE; NE 115th St; NE 117th St; NE 120th St; 8th Ave NE; NE 123rd St; NE 125th St; NE 127th St; NE 130th St; 14th Ave NE; 10th Ave NE; Pinehurst Way NE; NE 135th St; NE 112th St; NE 113th St; 3rd Ave NE; 1st Ave NE; 9th Ave NE; NE 114th St; 11th Ave NE; NE 126th St; NE 124th St; NE 140th St; NE 143rd St; 7th Ave NE; NE 111th St; 10th Pl NE; 4th Ave NE; NE 128th St; NE 131st Pl; NE Brockman Pl; 8th Ct NE; NE 133rd St; NE 122nd St; NE Northgate Way; NE 12th Ave; 14th Pl NE; NE 116th St; 6th Pl NE; NE 130th Pl.
Pinehurst neighborhood detailed profile
Portage Bay neighborhood in Seattle statistics: (Find on map)
Area: 0.162 square miles
Population: 1,590
Population density:
Median household income in 2021:
Median rent in in 2021:
Male vs Females
Median age
Most popular occupations of males: computer and mathematical occupations (27.7%); management occupations (except farmers) (19.4%); sales and office occupations (14.1%); legal occupations (8.4%); education, training, and library occupations (5.0%); healthcare practitioners and technical occupations (5.0%); arts, design, entertainment, sports, and media occupations (4.3%)
Most popular occupations of females: business and financial operations occupations (26.3%); sales and office occupations (15.0%); management occupations (except farmers) (11.7%); service occupations (10.6%); education, training, and library occupations (10.5%); healthcare practitioners and technical occupations (9.1%); community and social services occupations (4.8%)
Limited-access highways (interstate or state) in this neighborhood: I- 5.
Roads and streets: Fuhrman Ave E; E Shelby St; E Hamlin St; Harvard Ave E; Broadway E; E Edgar St; E Roanoke St; E Gwinn Pl; 10th Ave E; E Allison St; 11th Ave E; Boyer Ave E; Franklin Ave E; Portage Bay Pl E; E Martin St.
Portage Bay neighborhood detailed profile
Area: 0.162 square miles
Population: 1,590
Population density:
| Portage Bay: | 9,811 people per square mile |
| Seattle: | 8,750 people per square mile |
Median household income in 2021:
| Portage Bay: | $122,080 |
| Seattle: | $110,781 |
Median rent in in 2021:
| Portage Bay: | $1,680 |
| Seattle: | $1,670 |
Male vs Females
| Males: | 832 |
| Females: | 757 |
Median age
| Males: | 40.6 years |
| Females: | 37.6 years |
Most popular occupations of males: computer and mathematical occupations (27.7%); management occupations (except farmers) (19.4%); sales and office occupations (14.1%); legal occupations (8.4%); education, training, and library occupations (5.0%); healthcare practitioners and technical occupations (5.0%); arts, design, entertainment, sports, and media occupations (4.3%)
Most popular occupations of females: business and financial operations occupations (26.3%); sales and office occupations (15.0%); management occupations (except farmers) (11.7%); service occupations (10.6%); education, training, and library occupations (10.5%); healthcare practitioners and technical occupations (9.1%); community and social services occupations (4.8%)
Limited-access highways (interstate or state) in this neighborhood: I- 5.
Roads and streets: Fuhrman Ave E; E Shelby St; E Hamlin St; Harvard Ave E; Broadway E; E Edgar St; E Roanoke St; E Gwinn Pl; 10th Ave E; E Allison St; 11th Ave E; Boyer Ave E; Franklin Ave E; Portage Bay Pl E; E Martin St.
Portage Bay neighborhood detailed profile
Queen Anne neighborhood in Seattle statistics: (Find on map)
Area: 2.976 square miles
Population: 46,956
Population density:
Median household income in 2021:
Median rent in in 2021:
Male vs Females
Median age
Housing prices:
Average estimated value of detached houses in 2021 (43.7% of all units):
Average estimated value of townhouses or other attached units in 2021 (6.6% of all units):
Average estimated '21 value of housing units in 5-or-more-unit structures (10.8% of all units):
Most popular occupations of males: management occupations (except farmers) (18.4%); sales and office occupations (17.5%); computer and mathematical occupations (12.8%); business and financial operations occupations (11.3%); service occupations (10.1%); architecture and engineering occupations (6.4%); arts, design, entertainment, sports, and media occupations (4.0%)
Most popular occupations of females: sales and office occupations (22.4%); management occupations (except farmers) (17.9%); service occupations (12.8%); business and financial operations occupations (8.5%); healthcare practitioners and technical occupations (6.3%); arts, design, entertainment, sports, and media occupations (6.1%); education, training, and library occupations (4.8%)
Highways in this neighborhood: State Rte 99 (Aurora Ave N); Aurora Ave N (Aurora Brg, State Rte 99).
Roads and streets: 3rd Ave W; 8th Ave W; Queen Anne Ave N; 1st Ave N; W Ewing St; 5th Ave W; 1st Ave W; Warren Ave N; 14th Ave W; 12th Ave W; 13th Ave W; 9th Ave W; 11th Ave W; W Nickerson St; 4th Ave W; 5th Ave N; 4th Ave N; 10th Ave W; 6th Ave W; Ward St; 2nd Ave W; 2nd Ave N; 7th Ave W; Nob Hill Ave N; 3rd Ave N; W Emerson St; Valley St; W Bertona St; W Blaine St; W Raye St; W Howe St; Highland Dr; W Mc Graw St; Taylor Ave N; Bigelow Ave N; W Dravus St; W Garfield St; W Prospect St; W Crockett St; 6th Ave N; Mercer St; Aloha St; Roy St; W Galer St; W Barrett St; Prospect St; W Lee St; W Olympic Pl; Westlake Ave N; W Highland Dr; Lee St; Dexter Ave N; Crockett St; Newton St; Garfield St; McGraw St; W Etruria St; Boston St; Galer St; W Comstock St; Howe St; W Halladay St; W Smith St; Gilman Dr W; W Kinnear Pl; W Armour St; W Cremona St; Raye St; Nickerson St; W Wheeler St; Florentia St; Lynn St; W Fulton St; Blaine St; W Roy St; Newell St; W Newell St; Queen Anne Dr; W Mercer St; Fulton St; Harrison St; Hayes St; W Republican St; Etruria St; Wheeler St; Republican St; W Mc Graw Pl; W Harrison St; Halladay St; W Boston St; Thomas St; Dexter Way N; 8th Ave N; W Ruffner St; Prosch Ave W; Olympic Way W; Mayfair Ave N; Westview Dr W; W Bothwell St; W Thomas St; John St; Smith St; Waverly Pl N; Conkling Pl W; Dravus St; W Florentia St; Broad St; Willard Ave W; W Blewett Way; Jesse Ave W; McGraw Pl; Sound View Ter W; Humes Pl W; 15th Pl W; Comstock St; W Florentia Pl; 10th Pl W; Lorentz Pl N; W Mercer Pl; 8th Pl W; Queen Anne Way; W Pleasant Pl; McGraw Street Brg; W Argand St; Mc Graw St; Orange Pl N; W John St; W Aloha St; Armour St; Ward Pl; W Ewing Pl; Queen Anne Drive Brg; W Aetna St; W Newton St; Birch Ave N; Cremona St; Comstock Pl; Tower Pl; S Warsaw St; Nob Hill Pl N; Van Buren Ave W; Warren Pl; W McGraw Pl; Western Ave W; Irondale Ave W; Galer Pl N; Smith Pl; Taylor Pl N.
Railroad features: Burlington Northern Santa Fe Rlwy.
Queen Anne neighborhood detailed profile
Area: 2.976 square miles
Population: 46,956
Population density:
| Queen Anne: | 15,777 people per square mile |
| Seattle: | 8,750 people per square mile |
Median household income in 2021:
| Queen Anne: | $143,596 |
| Seattle: | $110,781 |
Median rent in in 2021:
| Queen Anne: | $1,964 |
| Seattle: | $1,670 |
Male vs Females
| Males: | 22,617 |
| Females: | 24,339 |
Median age
| Males: | 36.3 years |
| Females: | 35.5 years |
Housing prices:
Average estimated value of detached houses in 2021 (43.7% of all units):
| Queen Anne: | $1,580,911 |
| Seattle: | $906,138 |
Average estimated value of townhouses or other attached units in 2021 (6.6% of all units):
| This neighborhood: | $666,821 |
| city: | $615,733 |
Average estimated '21 value of housing units in 5-or-more-unit structures (10.8% of all units):
| Queen Anne: | $1,059,887 |
| Seattle: | $570,782 |
Most popular occupations of males: management occupations (except farmers) (18.4%); sales and office occupations (17.5%); computer and mathematical occupations (12.8%); business and financial operations occupations (11.3%); service occupations (10.1%); architecture and engineering occupations (6.4%); arts, design, entertainment, sports, and media occupations (4.0%)
Most popular occupations of females: sales and office occupations (22.4%); management occupations (except farmers) (17.9%); service occupations (12.8%); business and financial operations occupations (8.5%); healthcare practitioners and technical occupations (6.3%); arts, design, entertainment, sports, and media occupations (6.1%); education, training, and library occupations (4.8%)
Highways in this neighborhood: State Rte 99 (Aurora Ave N); Aurora Ave N (Aurora Brg, State Rte 99).
Roads and streets: 3rd Ave W; 8th Ave W; Queen Anne Ave N; 1st Ave N; W Ewing St; 5th Ave W; 1st Ave W; Warren Ave N; 14th Ave W; 12th Ave W; 13th Ave W; 9th Ave W; 11th Ave W; W Nickerson St; 4th Ave W; 5th Ave N; 4th Ave N; 10th Ave W; 6th Ave W; Ward St; 2nd Ave W; 2nd Ave N; 7th Ave W; Nob Hill Ave N; 3rd Ave N; W Emerson St; Valley St; W Bertona St; W Blaine St; W Raye St; W Howe St; Highland Dr; W Mc Graw St; Taylor Ave N; Bigelow Ave N; W Dravus St; W Garfield St; W Prospect St; W Crockett St; 6th Ave N; Mercer St; Aloha St; Roy St; W Galer St; W Barrett St; Prospect St; W Lee St; W Olympic Pl; Westlake Ave N; W Highland Dr; Lee St; Dexter Ave N; Crockett St; Newton St; Garfield St; McGraw St; W Etruria St; Boston St; Galer St; W Comstock St; Howe St; W Halladay St; W Smith St; Gilman Dr W; W Kinnear Pl; W Armour St; W Cremona St; Raye St; Nickerson St; W Wheeler St; Florentia St; Lynn St; W Fulton St; Blaine St; W Roy St; Newell St; W Newell St; Queen Anne Dr; W Mercer St; Fulton St; Harrison St; Hayes St; W Republican St; Etruria St; Wheeler St; Republican St; W Mc Graw Pl; W Harrison St; Halladay St; W Boston St; Thomas St; Dexter Way N; 8th Ave N; W Ruffner St; Prosch Ave W; Olympic Way W; Mayfair Ave N; Westview Dr W; W Bothwell St; W Thomas St; John St; Smith St; Waverly Pl N; Conkling Pl W; Dravus St; W Florentia St; Broad St; Willard Ave W; W Blewett Way; Jesse Ave W; McGraw Pl; Sound View Ter W; Humes Pl W; 15th Pl W; Comstock St; W Florentia Pl; 10th Pl W; Lorentz Pl N; W Mercer Pl; 8th Pl W; Queen Anne Way; W Pleasant Pl; McGraw Street Brg; W Argand St; Mc Graw St; Orange Pl N; W John St; W Aloha St; Armour St; Ward Pl; W Ewing Pl; Queen Anne Drive Brg; W Aetna St; W Newton St; Birch Ave N; Cremona St; Comstock Pl; Tower Pl; S Warsaw St; Nob Hill Pl N; Van Buren Ave W; Warren Pl; W McGraw Pl; Western Ave W; Irondale Ave W; Galer Pl N; Smith Pl; Taylor Pl N.
Railroad features: Burlington Northern Santa Fe Rlwy.
Queen Anne neighborhood detailed profile
Rainier Valley neighborhood in Seattle statistics: (Find on map)
Area: 7.279 square miles
Population: 57,662
Population density:
Median household income in 2021:
Median rent in in 2021:
Male vs Females
Median age
Housing prices:
Average estimated value of detached houses in 2021 (71.0% of all units):
Average estimated value of townhouses or other attached units in 2021 (6.1% of all units):
Most popular occupations of males: service occupations (16.3%); sales and office occupations (14.6%); computer and mathematical occupations (11.0%); management occupations (except farmers) (10.9%); business and financial operations occupations (9.1%); construction, extraction, and maintenance occupations (4.9%); production occupations (4.9%)
Most popular occupations of females: sales and office occupations (20.0%); service occupations (18.3%); management occupations (except farmers) (9.6%); education, training, and library occupations (8.8%); healthcare practitioners and technical occupations (8.5%); business and financial operations occupations (8.4%); computer and mathematical occupations (4.7%)
Limited-access highways (interstate or state) in this neighborhood: I- 90.
Roads and streets: Rainier Ave; Renton Ave S; Lake Washington Blvd S; Martin Luther King Way S; 46th Ave S; 51st Ave S; 48th Ave S; Seward Park Ave S; S Alaska St; 52nd Ave S; 42nd Ave S; 57th Ave S; 55th Ave S; Beacon Ave S; 47th Ave S; S Genesee St; S Orcas St; 39th Ave S; Waters Ave S; S Brandon St; S Ferdinand St; S Dawson St; 37th Ave S; 50th Ave S; 49th Ave S; 44th Ave S; S Angeline St; 34th Ave S; S Juneau St; 54th Ave S; S Morgan St; S Holly St; 45th Ave S; 33rd Ave S; S Oregon St; S Bangor St; S Hudson St; 56th Ave S; S Graham St; Cascadia Ave S; 43rd Ave S; S Willow St; South Dakota St; 53rd Ave S; 35th Ave S; S Lucile St; S Roxbury St; S Findlay St; S Mead St; 36th Ave S; 31st Ave S; S Ryan St; S Myrtle St; S Cloverdale St; 30th Ave S; S Mount Baker Blvd; S Kenyon St; S Othello St; Wilson Ave S; 32nd Ave S; S Hazel St; S Prentice St; S Henderson St; S Andover St; S Cooper St; S Eddy St; Cornell Ave S; Seward Park Rd; S Rose St; 38th Ave S; S Warsaw St; 59th Ave S; S Fletcher St; S Frontenac St; S Hanford St; 29th Ave S; S Norfolk St; 61st Ave S; S Adams St; S Horton St; S Edmunds St; S Massachusetts St; 62nd Ave S; S Mc Clellan St; S Spencer St; 63rd Ave S; S Leo St; 41st Ave S; S Holden St; S Avon St; S Snoqualmie St; S Brighton St; S Pearl St; 60th Ave S; Crestwood Dr S; Letitia Ave S; S Atlantic St; S Gazelle St; 66th Ave S; S Bayview St; S Charlestown St; S Wallace St; S Orchard St; 28th Ave S; S Court St; S Thistle St; Wabash Ave S; Rustic Rd S; Hunter Blvd S; S Chicago St; S Hinds St; Woodley Ave S; S Fountain St; S Kenny St; S Raymond St; S Pilgrim St; S Walden St; S Garden St; S Bennett St; S Bateman St; S Mayflower St; S Director St; 68th Ave S; 64th Ave S; 65th Ave S; S College St; Lakewood Ave S; S Spokane St; Arrowsmith Ave S; Luther Ave S; S Columbian Way; S Byron St; Sears Dr S; Island Dr S; S Plum St; 27th Ave S; Lake Ridge Dr S; S 115th St; Auburn Ave S; Tamarack Dr S; Lakeside Ave S; Courtland Pl S; Shoreland Dr S; S Bond St; Lexington Pl S; Mount Rainier Dr S; S Creston St; S Austin St; S Augusta St; S Hawthorne Rd; S Fontanelle St; S Victor St; Oakhurst Rd S; S Farrar St; S Webster St; Upland Ter S; S Fisher Pl; Lake Park Dr S; Bellavista Ave S; S Walker St; Waters Aly S (Arrowsmith Aly S); S Bradford St; 51st Pl S; Mount St Helens Pl S; S Lander St; S Conover Way; Sierra Dr S; Spear Pl S; Mount Adams Pl S; Chestnut Ct S; S Ruggles St; S Dose Ter; Mount Baker Dr S; S Taft St; S Angel Pl; 68th Pl S; Lakeshore Dr S; S Upland Rd; S Holgate St; S Grand St; Wolcott Ave S; York Rd S; S Trenton St; Escallonia Ct S; Holyoke Way S; Grattan Pl S; Sturtevant Ave S; 37th Pl S; 58th Ave S; Duncan Ave S; 67th Ave S; Claremont Ave S; Hampton Rd S; S Fontanelle Pl; Bradner Pl S; S Wildwood Ln; 69th Pl S; 71st Pl S; S Hill St; S Americus St; Valdez Ave S; Wetmore Ave S; 44th Pl S; Juneau Ter S; Parkview Ave S; Marcus Ave S; Mount Claire Dr S; Abelia Ct S; S Elmgrove St; S Cambridge St; S Grattan St; S Seward Park Ave; Woodward Ave S; 70th Pl S; S 119th St; Hamlet Ave S; S Camano Pl; S Bozeman St; S Carver St; Mc Clintock Ave S; S Eastwood Dr; S Barton St; Sumac Ct S; S Keppler St; S Redwing St; Park Dr S; Lima Ter S; S Moore St; S Budd Ct; S 104th Pl; Locust Ct S; Barberry Ct S; S Ridgeway Pl; Morse Ave S; Rainier Pl S; S Genesee Way; Bowen Pl S; S Estelle St; Viburnum Ct S; 40th Ave S; S Day St; S Lilac St; S 112th Pl; S Medley Ct; S Oakhurst Pl; S Raymond Pl; Rowan Rd S; S Rose Ct; S Orchard Ter; S Ryan Way; Gale Pl S; Mayes Ct S; Chatham Dr S; S Van Dyke Rd; S Mount Baker Cir; S Perry St; S Bradford Pl; 52nd Ter S; Ithaca Pl S; S Ferris Pl; Bowlyn Pl S; S Lake Dell Ln; Hampton Rd; S Hazel Ct; Barton Pl S; Terminal Ct S; Yukon Ave S; S 120th St; Anthony Pl S; S Bangor Ct; S Pearl St S; S Thayer St; S 118th St; Lindsay Pl S; Blair Ter S; S Oaklawn Pl; Brighton Ln S; la Fern Pl S; 56th Pl S; S 117th St; S Delappe Pl; Goodell Pl S; 72nd Ave S; Renton Pl S; S Morgan Pl; S Lawrence Pl; S Fountain Pl; Hudson St; Dawson St; Holly Ter S; 42nd Pl S; Orchard Pl S; 75th Ave S; S Garden Loop Rd; Forest Ave S; Kinnikinick Pl S; Lucile St; Lafern Pl S; S Heather Pl; S 114th St; S Andover Ct; Juneau Ter; Cooper Pl S; Morgan St; Mc Coy Pl S.
Rainier Valley neighborhood detailed profile
Area: 7.279 square miles
Population: 57,662
Population density:
| Rainier Valley: | 7,921 people per square mile |
| Seattle: | 8,750 people per square mile |
Median household income in 2021:
| Rainier Valley: | $114,802 |
| Seattle: | $110,781 |
Median rent in in 2021:
| Rainier Valley: | $1,720 |
| Seattle: | $1,670 |
Male vs Females
| Males: | 30,485 |
| Females: | 27,177 |
Median age
| Males: | 40.0 years |
| Females: | 45.3 years |
Housing prices:
Average estimated value of detached houses in 2021 (71.0% of all units):
| Rainier Valley: | $941,667 |
| Seattle: | $906,138 |
Average estimated value of townhouses or other attached units in 2021 (6.1% of all units):
| This neighborhood: | $619,750 |
| city: | $615,733 |
Most popular occupations of males: service occupations (16.3%); sales and office occupations (14.6%); computer and mathematical occupations (11.0%); management occupations (except farmers) (10.9%); business and financial operations occupations (9.1%); construction, extraction, and maintenance occupations (4.9%); production occupations (4.9%)
Most popular occupations of females: sales and office occupations (20.0%); service occupations (18.3%); management occupations (except farmers) (9.6%); education, training, and library occupations (8.8%); healthcare practitioners and technical occupations (8.5%); business and financial operations occupations (8.4%); computer and mathematical occupations (4.7%)
Limited-access highways (interstate or state) in this neighborhood: I- 90.
Roads and streets: Rainier Ave; Renton Ave S; Lake Washington Blvd S; Martin Luther King Way S; 46th Ave S; 51st Ave S; 48th Ave S; Seward Park Ave S; S Alaska St; 52nd Ave S; 42nd Ave S; 57th Ave S; 55th Ave S; Beacon Ave S; 47th Ave S; S Genesee St; S Orcas St; 39th Ave S; Waters Ave S; S Brandon St; S Ferdinand St; S Dawson St; 37th Ave S; 50th Ave S; 49th Ave S; 44th Ave S; S Angeline St; 34th Ave S; S Juneau St; 54th Ave S; S Morgan St; S Holly St; 45th Ave S; 33rd Ave S; S Oregon St; S Bangor St; S Hudson St; 56th Ave S; S Graham St; Cascadia Ave S; 43rd Ave S; S Willow St; South Dakota St; 53rd Ave S; 35th Ave S; S Lucile St; S Roxbury St; S Findlay St; S Mead St; 36th Ave S; 31st Ave S; S Ryan St; S Myrtle St; S Cloverdale St; 30th Ave S; S Mount Baker Blvd; S Kenyon St; S Othello St; Wilson Ave S; 32nd Ave S; S Hazel St; S Prentice St; S Henderson St; S Andover St; S Cooper St; S Eddy St; Cornell Ave S; Seward Park Rd; S Rose St; 38th Ave S; S Warsaw St; 59th Ave S; S Fletcher St; S Frontenac St; S Hanford St; 29th Ave S; S Norfolk St; 61st Ave S; S Adams St; S Horton St; S Edmunds St; S Massachusetts St; 62nd Ave S; S Mc Clellan St; S Spencer St; 63rd Ave S; S Leo St; 41st Ave S; S Holden St; S Avon St; S Snoqualmie St; S Brighton St; S Pearl St; 60th Ave S; Crestwood Dr S; Letitia Ave S; S Atlantic St; S Gazelle St; 66th Ave S; S Bayview St; S Charlestown St; S Wallace St; S Orchard St; 28th Ave S; S Court St; S Thistle St; Wabash Ave S; Rustic Rd S; Hunter Blvd S; S Chicago St; S Hinds St; Woodley Ave S; S Fountain St; S Kenny St; S Raymond St; S Pilgrim St; S Walden St; S Garden St; S Bennett St; S Bateman St; S Mayflower St; S Director St; 68th Ave S; 64th Ave S; 65th Ave S; S College St; Lakewood Ave S; S Spokane St; Arrowsmith Ave S; Luther Ave S; S Columbian Way; S Byron St; Sears Dr S; Island Dr S; S Plum St; 27th Ave S; Lake Ridge Dr S; S 115th St; Auburn Ave S; Tamarack Dr S; Lakeside Ave S; Courtland Pl S; Shoreland Dr S; S Bond St; Lexington Pl S; Mount Rainier Dr S; S Creston St; S Austin St; S Augusta St; S Hawthorne Rd; S Fontanelle St; S Victor St; Oakhurst Rd S; S Farrar St; S Webster St; Upland Ter S; S Fisher Pl; Lake Park Dr S; Bellavista Ave S; S Walker St; Waters Aly S (Arrowsmith Aly S); S Bradford St; 51st Pl S; Mount St Helens Pl S; S Lander St; S Conover Way; Sierra Dr S; Spear Pl S; Mount Adams Pl S; Chestnut Ct S; S Ruggles St; S Dose Ter; Mount Baker Dr S; S Taft St; S Angel Pl; 68th Pl S; Lakeshore Dr S; S Upland Rd; S Holgate St; S Grand St; Wolcott Ave S; York Rd S; S Trenton St; Escallonia Ct S; Holyoke Way S; Grattan Pl S; Sturtevant Ave S; 37th Pl S; 58th Ave S; Duncan Ave S; 67th Ave S; Claremont Ave S; Hampton Rd S; S Fontanelle Pl; Bradner Pl S; S Wildwood Ln; 69th Pl S; 71st Pl S; S Hill St; S Americus St; Valdez Ave S; Wetmore Ave S; 44th Pl S; Juneau Ter S; Parkview Ave S; Marcus Ave S; Mount Claire Dr S; Abelia Ct S; S Elmgrove St; S Cambridge St; S Grattan St; S Seward Park Ave; Woodward Ave S; 70th Pl S; S 119th St; Hamlet Ave S; S Camano Pl; S Bozeman St; S Carver St; Mc Clintock Ave S; S Eastwood Dr; S Barton St; Sumac Ct S; S Keppler St; S Redwing St; Park Dr S; Lima Ter S; S Moore St; S Budd Ct; S 104th Pl; Locust Ct S; Barberry Ct S; S Ridgeway Pl; Morse Ave S; Rainier Pl S; S Genesee Way; Bowen Pl S; S Estelle St; Viburnum Ct S; 40th Ave S; S Day St; S Lilac St; S 112th Pl; S Medley Ct; S Oakhurst Pl; S Raymond Pl; Rowan Rd S; S Rose Ct; S Orchard Ter; S Ryan Way; Gale Pl S; Mayes Ct S; Chatham Dr S; S Van Dyke Rd; S Mount Baker Cir; S Perry St; S Bradford Pl; 52nd Ter S; Ithaca Pl S; S Ferris Pl; Bowlyn Pl S; S Lake Dell Ln; Hampton Rd; S Hazel Ct; Barton Pl S; Terminal Ct S; Yukon Ave S; S 120th St; Anthony Pl S; S Bangor Ct; S Pearl St S; S Thayer St; S 118th St; Lindsay Pl S; Blair Ter S; S Oaklawn Pl; Brighton Ln S; la Fern Pl S; 56th Pl S; S 117th St; S Delappe Pl; Goodell Pl S; 72nd Ave S; Renton Pl S; S Morgan Pl; S Lawrence Pl; S Fountain Pl; Hudson St; Dawson St; Holly Ter S; 42nd Pl S; Orchard Pl S; 75th Ave S; S Garden Loop Rd; Forest Ave S; Kinnikinick Pl S; Lucile St; Lafern Pl S; S Heather Pl; S 114th St; S Andover Ct; Juneau Ter; Cooper Pl S; Morgan St; Mc Coy Pl S.
Rainier Valley neighborhood detailed profile
Ranier Beach neighborhood in Seattle statistics: (Find on map)
Area: 1.285 square miles
Population: 4,376
Population density:
Median household income in 2021:
Median rent in in 2021:
Male vs Females
Median age
Average estimated value of detached houses in 2021 (99.5% of all units):
Most popular occupations of males: sales and office occupations (21.8%); transportation occupations (12.8%); community and social services occupations (12.4%); production occupations (12.0%); computer and mathematical occupations (9.0%); management occupations (except farmers) (8.1%); service occupations (7.4%)
Most popular occupations of females: service occupations (25.4%); sales and office occupations (19.6%); production occupations (13.9%); business and financial operations occupations (8.4%); material moving occupations (7.7%); management occupations (except farmers) (6.8%); computer and mathematical occupations (6.7%)
Roads and streets: Waters Ave S; Renton Ave S; S Roxbury St; Rainier Ave; S Ryan St; S Prentice St; S Cooper St; 57th Ave S; 51st Ave S; S Bangor St; S Norfolk St; 55th Ave S; 59th Ave S; S Fletcher St; 61st Ave S; 56th Ave S; Beacon Ave S; S Gazelle St; 63rd Ave S; S Pilgrim St; 62nd Ave S; 64th Ave S; 60th Ave S; Arrowsmith Ave S; 54th Ave S; 65th Ave S; Cornell Ave S; Martin Luther King Way S; S Bond St; S Creston St; S Victor St; 66th Ave S; Waters Aly S (Arrowsmith Aly S); 52nd Ave S; 48th Ave S; S Ruggles St; S Taft St; 53rd Ave S; Holyoke Way S; Sturtevant Ave S; 58th Ave S; 49th Ave S; 68th Ave S; 67th Ave S; S Cambridge St; 46th Ave S; S Carver St; S Keppler St; S Redwing St; 47th Ave S; Lima Ter S; 50th Ave S; S 104th Pl; S Ryan Way; Mayes Ct S; S Perry St; Ithaca Pl S; S Thayer St; Lindsay Pl S; 72nd Ave S; 75th Ave S; S Garden Loop Rd; Forest Ave S; Cooper Pl S.
Ranier Beach neighborhood detailed profile
Area: 1.285 square miles
Population: 4,376
Population density:
| Ranier Beach: | 3,406 people per square mile |
| Seattle: | 8,750 people per square mile |
Median household income in 2021:
| Ranier Beach: | $83,759 |
| Seattle: | $110,781 |
Median rent in in 2021:
| Ranier Beach: | $2,579 |
| Seattle: | $1,670 |
Male vs Females
| Males: | 2,189 |
| Females: | 2,187 |
Median age
| Males: | 42.4 years |
| Females: | 51.2 years |
Average estimated value of detached houses in 2021 (99.5% of all units):
| Ranier Beach: | $550,498 |
| Seattle: | $906,138 |
Most popular occupations of males: sales and office occupations (21.8%); transportation occupations (12.8%); community and social services occupations (12.4%); production occupations (12.0%); computer and mathematical occupations (9.0%); management occupations (except farmers) (8.1%); service occupations (7.4%)
Most popular occupations of females: service occupations (25.4%); sales and office occupations (19.6%); production occupations (13.9%); business and financial operations occupations (8.4%); material moving occupations (7.7%); management occupations (except farmers) (6.8%); computer and mathematical occupations (6.7%)
Roads and streets: Waters Ave S; Renton Ave S; S Roxbury St; Rainier Ave; S Ryan St; S Prentice St; S Cooper St; 57th Ave S; 51st Ave S; S Bangor St; S Norfolk St; 55th Ave S; 59th Ave S; S Fletcher St; 61st Ave S; 56th Ave S; Beacon Ave S; S Gazelle St; 63rd Ave S; S Pilgrim St; 62nd Ave S; 64th Ave S; 60th Ave S; Arrowsmith Ave S; 54th Ave S; 65th Ave S; Cornell Ave S; Martin Luther King Way S; S Bond St; S Creston St; S Victor St; 66th Ave S; Waters Aly S (Arrowsmith Aly S); 52nd Ave S; 48th Ave S; S Ruggles St; S Taft St; 53rd Ave S; Holyoke Way S; Sturtevant Ave S; 58th Ave S; 49th Ave S; 68th Ave S; 67th Ave S; S Cambridge St; 46th Ave S; S Carver St; S Keppler St; S Redwing St; 47th Ave S; Lima Ter S; 50th Ave S; S 104th Pl; S Ryan Way; Mayes Ct S; S Perry St; Ithaca Pl S; S Thayer St; Lindsay Pl S; 72nd Ave S; 75th Ave S; S Garden Loop Rd; Forest Ave S; Cooper Pl S.
Ranier Beach neighborhood detailed profile
Ranier View neighborhood in Seattle statistics: (Find on map)
Area: 0.707 square miles
Population: 4,497
Population density:
Median household income in 2021:
Median rent in in 2021:
Male vs Females
Median age
Average estimated value of detached houses in 2021 (99.9% of all units):
Most popular occupations of males: sales and office occupations (21.0%); management occupations (except farmers) (19.6%); business and financial operations occupations (18.5%); computer and mathematical occupations (11.7%); service occupations (7.9%); production occupations (4.6%); construction, extraction, and maintenance occupations (4.4%)
Most popular occupations of females: sales and office occupations (27.7%); healthcare practitioners and technical occupations (22.9%); management occupations (except farmers) (15.8%); business and financial operations occupations (8.4%); service occupations (7.5%); production occupations (5.5%); computer and mathematical occupations (5.0%)
Highways in this neighborhood: Martin Luther King Way S (State Rte 900).
Roads and streets: S Hazel St; Beacon Ave S; S Leo St; S Avon St; Cornell Ave S; Crestwood Dr S; S Wallace St; Woodley Ave S; S Fountain St; 53rd Ave S; 56th Ave S; Luther Ave S; Lake Ridge Dr S; S 115th St; Auburn Ave S; 51st Ave S; S Augusta St; Renton Ave S; 57th Ave S; 68th Pl S; 66th Ave S; 55th Ave S; 69th Pl S; 71st Pl S; Parkview Ave S; 68th Ave S; Woodward Ave S; 70th Pl S; S 119th St; S Eastwood Dr; 63rd Ave S; S Moore St; Rustic Rd S; S 112th Pl; 54th Ave S; Rowan Rd S; 62nd Ave S; 59th Ave S; S Hazel Ct; S Bangor St; S 120th St; S Bangor Ct; S 118th St; 56th Pl S; S 117th St; 61st Ave S; S Fountain Pl; S 114th St; Leo St.
Ranier View neighborhood detailed profile
Area: 0.707 square miles
Population: 4,497
Population density:
| Ranier View: | 6,360 people per square mile |
| Seattle: | 8,750 people per square mile |
Median household income in 2021:
| Ranier View: | $105,318 |
| Seattle: | $110,781 |
Median rent in in 2021:
| Ranier View: | $2,721 |
| Seattle: | $1,670 |
Male vs Females
| Males: | 2,213 |
| Females: | 2,283 |
Median age
| Males: | 44.2 years |
| Females: | 51.3 years |
Average estimated value of detached houses in 2021 (99.9% of all units):
| Ranier View: | $584,140 |
| Seattle: | $906,138 |
Most popular occupations of males: sales and office occupations (21.0%); management occupations (except farmers) (19.6%); business and financial operations occupations (18.5%); computer and mathematical occupations (11.7%); service occupations (7.9%); production occupations (4.6%); construction, extraction, and maintenance occupations (4.4%)
Most popular occupations of females: sales and office occupations (27.7%); healthcare practitioners and technical occupations (22.9%); management occupations (except farmers) (15.8%); business and financial operations occupations (8.4%); service occupations (7.5%); production occupations (5.5%); computer and mathematical occupations (5.0%)
Highways in this neighborhood: Martin Luther King Way S (State Rte 900).
Roads and streets: S Hazel St; Beacon Ave S; S Leo St; S Avon St; Cornell Ave S; Crestwood Dr S; S Wallace St; Woodley Ave S; S Fountain St; 53rd Ave S; 56th Ave S; Luther Ave S; Lake Ridge Dr S; S 115th St; Auburn Ave S; 51st Ave S; S Augusta St; Renton Ave S; 57th Ave S; 68th Pl S; 66th Ave S; 55th Ave S; 69th Pl S; 71st Pl S; Parkview Ave S; 68th Ave S; Woodward Ave S; 70th Pl S; S 119th St; S Eastwood Dr; 63rd Ave S; S Moore St; Rustic Rd S; S 112th Pl; 54th Ave S; Rowan Rd S; 62nd Ave S; 59th Ave S; S Hazel Ct; S Bangor St; S 120th St; S Bangor Ct; S 118th St; 56th Pl S; S 117th St; 61st Ave S; S Fountain Pl; S 114th St; Leo St.
Ranier View neighborhood detailed profile
Ravenna neighborhood in Seattle statistics: (Find on map)
Area: 1.285 square miles
Population: 20,280
Population density:
Median household income in 2021:
Median rent in in 2021:
Male vs Females
Median age
Average estimated value of detached houses in 2021 (68.8% of all units):
Most popular occupations of males: computer and mathematical occupations (18.2%); management occupations (except farmers) (14.9%); sales and office occupations (14.2%); education, training, and library occupations (9.5%); service occupations (6.7%); business and financial operations occupations (6.4%); architecture and engineering occupations (6.3%)
Most popular occupations of females: management occupations (except farmers) (14.7%); education, training, and library occupations (14.5%); sales and office occupations (13.8%); healthcare practitioners and technical occupations (11.4%); business and financial operations occupations (9.6%); life, physical, and social science occupations (7.7%); service occupations (7.1%)
Roads and streets: NE 65th St; NE 68th St; Ravenna Ave NE; 30th Ave NE; 35th Ave NE; 25th Ave NE; NE 70th St; 36th Ave NE; 27th Ave NE; NE 62nd St; NE 75th St; 21st Ave NE; 29th Ave NE; 23rd Ave NE; 34th Ave NE; 24th Ave NE; 28th Ave NE; NE 60th St; 26th Ave NE; 31st Ave NE; 33rd Ave NE; 20th Ave NE; NE 73rd St; NE 55th St; 17th Ave NE; 19th Ave NE; 32nd Ave NE; 18th Ave NE; NE 57th St; NE 63rd St; NE 50th St; NE Blakeley St; 22nd Ave NE; NE 77th St; University View Pl NE; NE 80th St; NE 82nd St; NE 61st St; NE Naomi Pl; NE 72nd St; NE 83rd St; NE 52nd St; NE 53rd St; NE 54th St; 22nd Pl NE; NE 81st St; NE 81st Pl; NE 79th St; 23rd Ct NE; NE 45th Pl; NE 74th St; NE 48th St; 20th Pl NE; 37th Ave NE; Twin Maple Ln NE.
Ravenna neighborhood detailed profile
Area: 1.285 square miles
Population: 20,280
Population density:
| Ravenna: | 15,780 people per square mile |
| Seattle: | 8,750 people per square mile |
Median household income in 2021:
| Ravenna: | $137,868 |
| Seattle: | $110,781 |
Median rent in in 2021:
| Ravenna: | $2,083 |
| Seattle: | $1,670 |
Male vs Females
| Males: | 10,425 |
| Females: | 9,854 |
Median age
| Males: | 36.4 years |
| Females: | 32.6 years |
Average estimated value of detached houses in 2021 (68.8% of all units):
| Ravenna: | $926,918 |
| Seattle: | $906,138 |
Most popular occupations of males: computer and mathematical occupations (18.2%); management occupations (except farmers) (14.9%); sales and office occupations (14.2%); education, training, and library occupations (9.5%); service occupations (6.7%); business and financial operations occupations (6.4%); architecture and engineering occupations (6.3%)
Most popular occupations of females: management occupations (except farmers) (14.7%); education, training, and library occupations (14.5%); sales and office occupations (13.8%); healthcare practitioners and technical occupations (11.4%); business and financial operations occupations (9.6%); life, physical, and social science occupations (7.7%); service occupations (7.1%)
Roads and streets: NE 65th St; NE 68th St; Ravenna Ave NE; 30th Ave NE; 35th Ave NE; 25th Ave NE; NE 70th St; 36th Ave NE; 27th Ave NE; NE 62nd St; NE 75th St; 21st Ave NE; 29th Ave NE; 23rd Ave NE; 34th Ave NE; 24th Ave NE; 28th Ave NE; NE 60th St; 26th Ave NE; 31st Ave NE; 33rd Ave NE; 20th Ave NE; NE 73rd St; NE 55th St; 17th Ave NE; 19th Ave NE; 32nd Ave NE; 18th Ave NE; NE 57th St; NE 63rd St; NE 50th St; NE Blakeley St; 22nd Ave NE; NE 77th St; University View Pl NE; NE 80th St; NE 82nd St; NE 61st St; NE Naomi Pl; NE 72nd St; NE 83rd St; NE 52nd St; NE 53rd St; NE 54th St; 22nd Pl NE; NE 81st St; NE 81st Pl; NE 79th St; 23rd Ct NE; NE 45th Pl; NE 74th St; NE 48th St; 20th Pl NE; 37th Ave NE; Twin Maple Ln NE.
Ravenna neighborhood detailed profile
Riverton neighborhood in Seattle statistics: (Find on map)
Area: 0.443 square miles
Population: 3,141
Population density:
Median household income in 2021:
Median rent in in 2021:
Male vs Females
Median age
Average estimated value of detached houses in 2021 (46.5% of all units):
Most popular occupations of males: production occupations (24.0%); service occupations (19.3%); transportation occupations (10.9%); material moving occupations (10.0%); sales and office occupations (7.0%); construction, extraction, and maintenance occupations (6.3%); education, training, and library occupations (5.5%)
Most popular occupations of females: service occupations (30.0%); sales and office occupations (19.5%); education, training, and library occupations (12.7%); material moving occupations (9.2%); production occupations (7.9%); business and financial operations occupations (7.6%); management occupations (except farmers) (7.2%)
Highways in this neighborhood: State Rte 99.
Roads and streets: Military Rd S; 34th Ave S; 37th Ave S; S 140th St; 35th Ave S; S 135th St; S 133rd St; S 144th St; 32nd Ave S; 33rd Ave S; S 137th St; S 130th St; S 142nd St; S 141st St; S 132nd St; S 136th St; S 143rd St; 38th Ave S; 133rd St; 31st Ave S; 34th Pl S; S 142nd Pl; S 138th St; S 134th St; 33rd Pl S; 30th Pl S; Pacific Hwy S.
Riverton neighborhood detailed profile
Area: 0.443 square miles
Population: 3,141
Population density:
| Riverton: | 7,098 people per square mile |
| Seattle: | 8,750 people per square mile |
Median household income in 2021:
| Riverton: | $67,507 |
| Seattle: | $110,781 |
Median rent in in 2021:
| Riverton: | $1,220 |
| Seattle: | $1,670 |
Male vs Females
| Males: | 1,517 |
| Females: | 1,624 |
Median age
| Males: | 36.7 years |
| Females: | 38.2 years |
Average estimated value of detached houses in 2021 (46.5% of all units):
| Riverton: | $388,858 |
| Seattle: | $906,138 |
Most popular occupations of males: production occupations (24.0%); service occupations (19.3%); transportation occupations (10.9%); material moving occupations (10.0%); sales and office occupations (7.0%); construction, extraction, and maintenance occupations (6.3%); education, training, and library occupations (5.5%)
Most popular occupations of females: service occupations (30.0%); sales and office occupations (19.5%); education, training, and library occupations (12.7%); material moving occupations (9.2%); production occupations (7.9%); business and financial operations occupations (7.6%); management occupations (except farmers) (7.2%)
Highways in this neighborhood: State Rte 99.
Roads and streets: Military Rd S; 34th Ave S; 37th Ave S; S 140th St; 35th Ave S; S 135th St; S 133rd St; S 144th St; 32nd Ave S; 33rd Ave S; S 137th St; S 130th St; S 142nd St; S 141st St; S 132nd St; S 136th St; S 143rd St; 38th Ave S; 133rd St; 31st Ave S; 34th Pl S; S 142nd Pl; S 138th St; S 134th St; 33rd Pl S; 30th Pl S; Pacific Hwy S.
Riverton neighborhood detailed profile
Riverview neighborhood in Seattle statistics: (Find on map)
Area: 1.126 square miles
Population: 2,998
Population density:
Median household income in 2021:
Median rent in in 2021:
Male vs Females
Median age
Housing prices:
Average estimated value of detached houses in 2021 (85.1% of all units):
Average estimated value of townhouses or other attached units in 2021 (4.9% of all units):
Average estimated '21 value of housing units in 5-or-more-unit structures (94.2% of all units):
Most popular occupations of males: sales and office occupations (24.3%); service occupations (21.7%); management occupations (except farmers) (13.6%); computer and mathematical occupations (8.5%); transportation occupations (6.0%); business and financial operations occupations (4.7%); construction, extraction, and maintenance occupations (4.5%)
Most popular occupations of females: sales and office occupations (30.2%); business and financial operations occupations (11.4%); healthcare practitioners and technical occupations (10.6%); service occupations (10.6%); education, training, and library occupations (10.4%); management occupations (except farmers) (8.8%); material moving occupations (4.6%)
Roads and streets: 16th Ave SW; 18th Ave SW; 17th Ave SW; 21st Ave SW; SW Myrtle St; 12th Ave SW; SW Webster St; SW Orchard St; 14th Ave SW; SW Holly St; 13th Ave SW; SW Juneau St; SW Othello St; SW Graham St; Croft Pl SW; SW Hudson St; 15th Ave SW; SW Brandon St; SW Holden St; SW Dawson St; 19th Ave SW; Highland Park Way SW; 23rd Ave SW; 11th Ave SW; SW Morgan St; SW Austin St; Puget Blvd SW; SW Findlay St.
Riverview neighborhood detailed profile
Area: 1.126 square miles
Population: 2,998
Population density:
| Riverview: | 2,663 people per square mile |
| Seattle: | 8,750 people per square mile |
Median household income in 2021:
| Riverview: | $102,094 |
| Seattle: | $110,781 |
Median rent in in 2021:
| Riverview: | $1,953 |
| Seattle: | $1,670 |
Male vs Females
| Males: | 1,518 |
| Females: | 1,480 |
Median age
| Males: | 38.8 years |
| Females: | 40.4 years |
Housing prices:
Average estimated value of detached houses in 2021 (85.1% of all units):
| Riverview: | $583,544 |
| Seattle: | $906,138 |
Average estimated value of townhouses or other attached units in 2021 (4.9% of all units):
| This neighborhood: | $546,351 |
| city: | $615,733 |
Average estimated '21 value of housing units in 5-or-more-unit structures (94.2% of all units):
| Riverview: | $360,091 |
| Seattle: | $570,782 |
Most popular occupations of males: sales and office occupations (24.3%); service occupations (21.7%); management occupations (except farmers) (13.6%); computer and mathematical occupations (8.5%); transportation occupations (6.0%); business and financial operations occupations (4.7%); construction, extraction, and maintenance occupations (4.5%)
Most popular occupations of females: sales and office occupations (30.2%); business and financial operations occupations (11.4%); healthcare practitioners and technical occupations (10.6%); service occupations (10.6%); education, training, and library occupations (10.4%); management occupations (except farmers) (8.8%); material moving occupations (4.6%)
Roads and streets: 16th Ave SW; 18th Ave SW; 17th Ave SW; 21st Ave SW; SW Myrtle St; 12th Ave SW; SW Webster St; SW Orchard St; 14th Ave SW; SW Holly St; 13th Ave SW; SW Juneau St; SW Othello St; SW Graham St; Croft Pl SW; SW Hudson St; 15th Ave SW; SW Brandon St; SW Holden St; SW Dawson St; 19th Ave SW; Highland Park Way SW; 23rd Ave SW; 11th Ave SW; SW Morgan St; SW Austin St; Puget Blvd SW; SW Findlay St.
Riverview neighborhood detailed profile
Roosevelt neighborhood in Seattle statistics: (Find on map)
Area: 0.746 square miles
Population: 9,815
Population density:
Median household income in 2021:
Median rent in in 2021:
Male vs Females
Median age
Housing prices:
Average estimated value of detached houses in 2021 (79.0% of all units):
Average estimated '21 value of housing units in 5-or-more-unit structures (15.2% of all units):
Most popular occupations of males: computer and mathematical occupations (16.3%); management occupations (except farmers) (15.9%); sales and office occupations (11.1%); education, training, and library occupations (9.4%); business and financial operations occupations (8.8%); construction, extraction, and maintenance occupations (6.0%); architecture and engineering occupations (5.6%)
Most popular occupations of females: sales and office occupations (21.4%); management occupations (except farmers) (13.7%); education, training, and library occupations (12.6%); business and financial operations occupations (11.6%); healthcare practitioners and technical occupations (11.5%); service occupations (7.9%); arts, design, entertainment, sports, and media occupations (6.4%)
Highways in this neighborhood: State Rte 522.
Roads and streets: NE 82nd St; NE 80th St; 15th Ave NE; Roosevelt Way NE; 12th Ave NE; NE 77th St; Lake City Way NE; 16th Ave NE; NE 75th St; Brooklyn Ave NE; NE 81st St; NE 63rd St; NE 65th St; NE 78th St; NE 70th St; Banner Way NE; 14th Ave NE; 8th Ave NE; NE 68th St; 9th Ave NE; 11th Ave NE; NE 62nd St; NE 66th St; NE 69th St; NE 79th St; NE 83rd St; NE 84th St; 17th Ave NE; 18th Ave NE; NE 73rd St; 5th Ave NE; NE 64th St; NE 76th St; 19th Ave NE; 20th Ave NE; NE 61st St; NE 71st St; NE 72nd St; NE Elk Pl; NE Banner Pl; 4th Ave NE; NE 67th St; 6th Ave NE; Latona Ave NE; NE 74th St; Perkins Pl.
Roosevelt neighborhood detailed profile
Area: 0.746 square miles
Population: 9,815
Population density:
| Roosevelt: | 13,156 people per square mile |
| Seattle: | 8,750 people per square mile |
Median household income in 2021:
| Roosevelt: | $140,731 |
| Seattle: | $110,781 |
Median rent in in 2021:
| Roosevelt: | $2,027 |
| Seattle: | $1,670 |
Male vs Females
| Males: | 4,996 |
| Females: | 4,819 |
Median age
| Males: | 38.9 years |
| Females: | 34.3 years |
Housing prices:
Average estimated value of detached houses in 2021 (79.0% of all units):
| Roosevelt: | $889,315 |
| Seattle: | $906,138 |
Average estimated '21 value of housing units in 5-or-more-unit structures (15.2% of all units):
| Roosevelt: | $343,923 |
| Seattle: | $570,782 |
Most popular occupations of males: computer and mathematical occupations (16.3%); management occupations (except farmers) (15.9%); sales and office occupations (11.1%); education, training, and library occupations (9.4%); business and financial operations occupations (8.8%); construction, extraction, and maintenance occupations (6.0%); architecture and engineering occupations (5.6%)
Most popular occupations of females: sales and office occupations (21.4%); management occupations (except farmers) (13.7%); education, training, and library occupations (12.6%); business and financial operations occupations (11.6%); healthcare practitioners and technical occupations (11.5%); service occupations (7.9%); arts, design, entertainment, sports, and media occupations (6.4%)
Highways in this neighborhood: State Rte 522.
Roads and streets: NE 82nd St; NE 80th St; 15th Ave NE; Roosevelt Way NE; 12th Ave NE; NE 77th St; Lake City Way NE; 16th Ave NE; NE 75th St; Brooklyn Ave NE; NE 81st St; NE 63rd St; NE 65th St; NE 78th St; NE 70th St; Banner Way NE; 14th Ave NE; 8th Ave NE; NE 68th St; 9th Ave NE; 11th Ave NE; NE 62nd St; NE 66th St; NE 69th St; NE 79th St; NE 83rd St; NE 84th St; 17th Ave NE; 18th Ave NE; NE 73rd St; 5th Ave NE; NE 64th St; NE 76th St; 19th Ave NE; 20th Ave NE; NE 61st St; NE 71st St; NE 72nd St; NE Elk Pl; NE Banner Pl; 4th Ave NE; NE 67th St; 6th Ave NE; Latona Ave NE; NE 74th St; Perkins Pl.
Roosevelt neighborhood detailed profile
Roxhill neighborhood in Seattle statistics: (Find on map)
Area: 0.650 square miles
Population: 8,434
Population density:
Median household income in 2021:
Median rent in in 2021:
Male vs Females
Median age
Average estimated value of detached houses in 2021 (85.8% of all units):
Most popular occupations of males: management occupations (except farmers) (22.1%); sales and office occupations (13.0%); service occupations (11.6%); business and financial operations occupations (9.8%); arts, design, entertainment, sports, and media occupations (8.5%); education, training, and library occupations (6.6%); computer and mathematical occupations (5.5%)
Most popular occupations of females: sales and office occupations (20.7%); business and financial operations occupations (19.1%); service occupations (16.8%); healthcare practitioners and technical occupations (10.6%); management occupations (except farmers) (9.6%); education, training, and library occupations (6.3%); production occupations (3.6%)
Roads and streets: 32nd Ave SW; 30th Ave SW; 34th Ave SW; 31st Ave SW; 29th Ave SW; SW Barton St; SW Trenton St; 28th Ave SW; SW Webster St; SW Roxbury St; SW Elmgrove St; SW Kenyon St; SW Thistle St; SW Henderson St; SW Holden St; SW Cloverdale St; 27th Ave SW; 25th Ave SW; 31st Pl SW; SW Cambridge St; Holden Pl SW; Westwood Village Mall SW; Westwood Village Ct SW; Westwood Village Pl SW; 26th Ave SW.
Roxhill neighborhood detailed profile
Area: 0.650 square miles
Population: 8,434
Population density:
| Roxhill: | 12,969 people per square mile |
| Seattle: | 8,750 people per square mile |
Median household income in 2021:
| Roxhill: | $105,285 |
| Seattle: | $110,781 |
Median rent in in 2021:
| Roxhill: | $1,633 |
| Seattle: | $1,670 |
Male vs Females
| Males: | 3,740 |
| Females: | 4,693 |
Median age
| Males: | 39.7 years |
| Females: | 43.0 years |
Average estimated value of detached houses in 2021 (85.8% of all units):
| Roxhill: | $754,748 |
| Seattle: | $906,138 |
Most popular occupations of males: management occupations (except farmers) (22.1%); sales and office occupations (13.0%); service occupations (11.6%); business and financial operations occupations (9.8%); arts, design, entertainment, sports, and media occupations (8.5%); education, training, and library occupations (6.6%); computer and mathematical occupations (5.5%)
Most popular occupations of females: sales and office occupations (20.7%); business and financial operations occupations (19.1%); service occupations (16.8%); healthcare practitioners and technical occupations (10.6%); management occupations (except farmers) (9.6%); education, training, and library occupations (6.3%); production occupations (3.6%)
Roads and streets: 32nd Ave SW; 30th Ave SW; 34th Ave SW; 31st Ave SW; 29th Ave SW; SW Barton St; SW Trenton St; 28th Ave SW; SW Webster St; SW Roxbury St; SW Elmgrove St; SW Kenyon St; SW Thistle St; SW Henderson St; SW Holden St; SW Cloverdale St; 27th Ave SW; 25th Ave SW; 31st Pl SW; SW Cambridge St; Holden Pl SW; Westwood Village Mall SW; Westwood Village Ct SW; Westwood Village Pl SW; 26th Ave SW.
Roxhill neighborhood detailed profile
Sand Point neighborhood in Seattle statistics: (Find on map)
Area: 0.787 square miles
Population: 655
Population density:
Median household income in 2021:
Median rent in in 2021:
Male vs Females
Median age
Housing prices:
Average estimated value of detached houses in 2021 (24.4% of all units):
Average estimated '21 value of housing units in 5-or-more-unit structures (23.2% of all units):
Most popular occupations of males: management occupations (except farmers) (23.7%); service occupations (13.0%); healthcare practitioners and technical occupations (12.6%); sales and office occupations (11.7%); education, training, and library occupations (8.9%); computer and mathematical occupations (8.4%); arts, design, entertainment, sports, and media occupations (7.2%)
Most popular occupations of females: healthcare practitioners and technical occupations (20.4%); sales and office occupations (16.2%); education, training, and library occupations (15.1%); management occupations (except farmers) (11.2%); computer and mathematical occupations (9.4%); legal occupations (7.5%); service occupations (6.8%)
Roads and streets: NE Noaa Dr; NE 65th St; NE 74th St; 63rd Ave NE.
Sand Point neighborhood detailed profile
Area: 0.787 square miles
Population: 655
Population density:
| Sand Point: | 832 people per square mile |
| Seattle: | 8,750 people per square mile |
Median household income in 2021:
| Sand Point: | $78,977 |
| Seattle: | $110,781 |
Median rent in in 2021:
| Sand Point: | $1,375 |
| Seattle: | $1,670 |
Male vs Females
| Males: | 337 |
| Females: | 318 |
Median age
| Males: | 47.5 years |
| Females: | 45.8 years |
Housing prices:
Average estimated value of detached houses in 2021 (24.4% of all units):
| Sand Point: | $1,441,057 |
| Seattle: | $906,138 |
Average estimated '21 value of housing units in 5-or-more-unit structures (23.2% of all units):
| Sand Point: | $699,091 |
| Seattle: | $570,782 |
Most popular occupations of males: management occupations (except farmers) (23.7%); service occupations (13.0%); healthcare practitioners and technical occupations (12.6%); sales and office occupations (11.7%); education, training, and library occupations (8.9%); computer and mathematical occupations (8.4%); arts, design, entertainment, sports, and media occupations (7.2%)
Most popular occupations of females: healthcare practitioners and technical occupations (20.4%); sales and office occupations (16.2%); education, training, and library occupations (15.1%); management occupations (except farmers) (11.2%); computer and mathematical occupations (9.4%); legal occupations (7.5%); service occupations (6.8%)
Roads and streets: NE Noaa Dr; NE 65th St; NE 74th St; 63rd Ave NE.
Sand Point neighborhood detailed profile
Seaview neighborhood in Seattle statistics: (Find on map)
Area: 0.947 square miles
Population: 5,841
Population density:
Median household income in 2021:
Median rent in in 2021:
Male vs Females
Median age
Housing prices:
Average estimated value of detached houses in 2021 (84.1% of all units):
Average estimated value of townhouses or other attached units in 2021 (4.8% of all units):
Average estimated '21 value of housing units in 5-or-more-unit structures (11.7% of all units):
Most popular occupations of males: management occupations (except farmers) (28.5%); computer and mathematical occupations (13.3%); sales and office occupations (11.6%); material moving occupations (9.6%); construction, extraction, and maintenance occupations (6.0%); education, training, and library occupations (5.9%); service occupations (5.1%)
Most popular occupations of females: management occupations (except farmers) (28.0%); service occupations (14.6%); community and social services occupations (12.1%); sales and office occupations (11.4%); computer and mathematical occupations (9.9%); healthcare practitioners and technical occupations (6.0%); transportation occupations (5.3%)
Roads and streets: Beach Dr SW; 48th Ave SW; 47th Ave SW; 49th Ave SW; 46th Ave SW; 45th Ave SW; California Ave SW; SW Hudson St; 44th Ave SW; SW Dawson St; SW Juneau St; SW Graham St; SW Findlay St; SW Raymond St; Erskine Way SW; SW Brandon St; 50th Ave SW; Atlas Pl SW; Fauntleroy Way SW; SW Jacobsen Rd; Holly Pl SW; SW Eddy St; SW Bruce St; SW Holly St; Beveridge Pl SW; SW Canada Dr; 51st Ave SW; 56th Ave SW; Marshall Ave SW; 57th Ave SW; Lewis Pl SW; SW Frontenac St; SW Angeline St; SW Beveridge Pl; Seaview Ter SW; SW Heinze Way; SW Maple Way; 47th Pl SW; SW Shore Pl; SW Beach Dr Ter; SW Willow St; SW Edmunds St; SW Oregon St; SW Morgan St; Holly Ct SW; SW Snoqualmie St; SW Englewood St; Gold Ct SW; SW Alaska St; 54th Ave SW; 55th Ave SW; Ocean Ct SW; SW Pelly Pl; Murray Ave SW; Autumn Ln SW; SW Villa Pl; SW Beach Drive Ter.
Seaview neighborhood detailed profile
Area: 0.947 square miles
Population: 5,841
Population density:
| Seaview: | 6,165 people per square mile |
| Seattle: | 8,750 people per square mile |
Median household income in 2021:
| Seaview: | $134,868 |
| Seattle: | $110,781 |
Median rent in in 2021:
| Seaview: | $2,257 |
| Seattle: | $1,670 |
Male vs Females
| Males: | 3,156 |
| Females: | 2,684 |
Median age
| Males: | 44.4 years |
| Females: | 43.5 years |
Housing prices:
Average estimated value of detached houses in 2021 (84.1% of all units):
| Seaview: | $946,642 |
| Seattle: | $906,138 |
Average estimated value of townhouses or other attached units in 2021 (4.8% of all units):
| This neighborhood: | $850,000 |
| city: | $615,733 |
Average estimated '21 value of housing units in 5-or-more-unit structures (11.7% of all units):
| Seaview: | $560,458 |
| Seattle: | $570,782 |
Most popular occupations of males: management occupations (except farmers) (28.5%); computer and mathematical occupations (13.3%); sales and office occupations (11.6%); material moving occupations (9.6%); construction, extraction, and maintenance occupations (6.0%); education, training, and library occupations (5.9%); service occupations (5.1%)
Most popular occupations of females: management occupations (except farmers) (28.0%); service occupations (14.6%); community and social services occupations (12.1%); sales and office occupations (11.4%); computer and mathematical occupations (9.9%); healthcare practitioners and technical occupations (6.0%); transportation occupations (5.3%)
Roads and streets: Beach Dr SW; 48th Ave SW; 47th Ave SW; 49th Ave SW; 46th Ave SW; 45th Ave SW; California Ave SW; SW Hudson St; 44th Ave SW; SW Dawson St; SW Juneau St; SW Graham St; SW Findlay St; SW Raymond St; Erskine Way SW; SW Brandon St; 50th Ave SW; Atlas Pl SW; Fauntleroy Way SW; SW Jacobsen Rd; Holly Pl SW; SW Eddy St; SW Bruce St; SW Holly St; Beveridge Pl SW; SW Canada Dr; 51st Ave SW; 56th Ave SW; Marshall Ave SW; 57th Ave SW; Lewis Pl SW; SW Frontenac St; SW Angeline St; SW Beveridge Pl; Seaview Ter SW; SW Heinze Way; SW Maple Way; 47th Pl SW; SW Shore Pl; SW Beach Dr Ter; SW Willow St; SW Edmunds St; SW Oregon St; SW Morgan St; Holly Ct SW; SW Snoqualmie St; SW Englewood St; Gold Ct SW; SW Alaska St; 54th Ave SW; 55th Ave SW; Ocean Ct SW; SW Pelly Pl; Murray Ave SW; Autumn Ln SW; SW Villa Pl; SW Beach Drive Ter.
Seaview neighborhood detailed profile
Seward Park neighborhood in Seattle statistics: (Find on map)
Area: 1.602 square miles
Population: 7,636
Population density:
Median household income in 2021:
Median rent in in 2021:
Male vs Females
Median age
Housing prices:
Average estimated value of detached houses in 2021 (88.8% of all units):
Average estimated value of townhouses or other attached units in 2021 (3.0% of all units):
Most popular occupations of males: management occupations (except farmers) (15.6%); sales and office occupations (14.6%); computer and mathematical occupations (9.9%); service occupations (9.2%); business and financial operations occupations (9.0%); healthcare practitioners and technical occupations (7.4%); construction, extraction, and maintenance occupations (6.4%)
Most popular occupations of females: sales and office occupations (16.8%); management occupations (except farmers) (13.9%); healthcare practitioners and technical occupations (9.8%); service occupations (9.4%); education, training, and library occupations (9.3%); business and financial operations occupations (7.7%); legal occupations (7.1%)
Roads and streets: Lake Washington Blvd S; Seward Park Ave S; 51st Ave S; 48th Ave S; 52nd Ave S; Wilson Ave S; S Orcas St; Seward Park Rd; 55th Ave S; 47th Ave S; 50th Ave S; 57th Ave S; 46th Ave S; 49th Ave S; S Alaska St; 54th Ave S; S Ferdinand St; S Angeline St; S Brandon St; S Genesee St; S Dawson St; S Juneau St; S Holly St; S Morgan St; S Lucile St; S Hudson St; S Findlay St; S Willow St; S Mayflower St; S Adams St; S Snoqualmie St; S Oregon St; S Graham St; S Mead St; 43rd Ave S; S Hawthorne Rd; South Dakota St; Oakhurst Rd S; S Spencer St; Upland Ter S; S Brighton St; S Raymond St; 51st Pl S; S Eddy St; S Farrar St; 56th Ave S; S Pearl St; Lakeshore Dr S; 53rd Ave S; S Upland Rd; S Bateman St; S Warsaw St; Hampton Rd S; 45th Ave S; S Othello St; S Myrtle St; S Andover St; S Genesee Way; S Frontenac St; S Kenny St; S Oakhurst Pl; S Orchard Ter; Chatham Dr S; S Van Dyke Rd; 52nd Ter S; Bowlyn Pl S; Hampton Rd; S Bradford St; S Pearl St S; Blair Ter S; S Oaklawn Pl; Brighton Ln S; S Morgan Pl; S Lawrence Pl; Hudson St; Dawson St; Holly Ter S; Lucile St; 60th Pl S.
Seward Park neighborhood detailed profile
Area: 1.602 square miles
Population: 7,636
Population density:
| Seward Park: | 4,767 people per square mile |
| Seattle: | 8,750 people per square mile |
Median household income in 2021:
| Seward Park: | $139,835 |
| Seattle: | $110,781 |
Median rent in in 2021:
| Seward Park: | $2,199 |
| Seattle: | $1,670 |
Male vs Females
| Males: | 4,134 |
| Females: | 3,502 |
Median age
| Males: | 40.5 years |
| Females: | 44.4 years |
Housing prices:
Average estimated value of detached houses in 2021 (88.8% of all units):
| Seward Park: | $1,286,766 |
| Seattle: | $906,138 |
Average estimated value of townhouses or other attached units in 2021 (3.0% of all units):
| This neighborhood: | $600,533 |
| city: | $615,733 |
Most popular occupations of males: management occupations (except farmers) (15.6%); sales and office occupations (14.6%); computer and mathematical occupations (9.9%); service occupations (9.2%); business and financial operations occupations (9.0%); healthcare practitioners and technical occupations (7.4%); construction, extraction, and maintenance occupations (6.4%)
Most popular occupations of females: sales and office occupations (16.8%); management occupations (except farmers) (13.9%); healthcare practitioners and technical occupations (9.8%); service occupations (9.4%); education, training, and library occupations (9.3%); business and financial operations occupations (7.7%); legal occupations (7.1%)
Roads and streets: Lake Washington Blvd S; Seward Park Ave S; 51st Ave S; 48th Ave S; 52nd Ave S; Wilson Ave S; S Orcas St; Seward Park Rd; 55th Ave S; 47th Ave S; 50th Ave S; 57th Ave S; 46th Ave S; 49th Ave S; S Alaska St; 54th Ave S; S Ferdinand St; S Angeline St; S Brandon St; S Genesee St; S Dawson St; S Juneau St; S Holly St; S Morgan St; S Lucile St; S Hudson St; S Findlay St; S Willow St; S Mayflower St; S Adams St; S Snoqualmie St; S Oregon St; S Graham St; S Mead St; 43rd Ave S; S Hawthorne Rd; South Dakota St; Oakhurst Rd S; S Spencer St; Upland Ter S; S Brighton St; S Raymond St; 51st Pl S; S Eddy St; S Farrar St; 56th Ave S; S Pearl St; Lakeshore Dr S; 53rd Ave S; S Upland Rd; S Bateman St; S Warsaw St; Hampton Rd S; 45th Ave S; S Othello St; S Myrtle St; S Andover St; S Genesee Way; S Frontenac St; S Kenny St; S Oakhurst Pl; S Orchard Ter; Chatham Dr S; S Van Dyke Rd; 52nd Ter S; Bowlyn Pl S; Hampton Rd; S Bradford St; S Pearl St S; Blair Ter S; S Oaklawn Pl; Brighton Ln S; S Morgan Pl; S Lawrence Pl; Hudson St; Dawson St; Holly Ter S; Lucile St; 60th Pl S.
Seward Park neighborhood detailed profile
Skyway neighborhood in Seattle statistics: (Find on map)
Area: 0.550 square miles
Population: 1,843
Population density:
Median household income in 2021:
Median rent in in 2021:
Male vs Females
Median age
Average estimated value of detached houses in 2021 (100.0% of all units):
Most popular occupations of males: sales and office occupations (21.4%); transportation occupations (16.7%); community and social services occupations (15.4%); production occupations (14.1%); computer and mathematical occupations (8.5%); business and financial operations occupations (7.3%); service occupations (7.3%)
Most popular occupations of females: service occupations (27.2%); sales and office occupations (18.0%); production occupations (15.1%); material moving occupations (8.6%); business and financial operations occupations (8.4%); computer and mathematical occupations (6.9%); management occupations (except farmers) (6.7%)
Roads and streets: Waters Ave S; Rainier Ave; Renton Ave S; S Roxbury St; S Norfolk St; S Cooper St; S Ryan St; 57th Ave S; 59th Ave S; S Fletcher St; Arrowsmith Ave S; S Pilgrim St; 61st Ave S; 54th Ave S; 56th Ave S; 62nd Ave S; 60th Ave S; 53rd Ave S; 52nd Ave S; Waters Aly S (Arrowsmith Aly S); 63rd Ave S; 55th Ave S; Sturtevant Ave S; 51st Ave S; 64th Ave S; 58th Ave S; S Gazelle St; 65th Ave S; S Carver St; S Keppler St; S Redwing St; Lima Ter S; 66th Ave S; 67th Ave S; Mayes Ct S; S Perry St; Ithaca Pl S; Seward Park Ave S; S Thayer St; Lindsay Pl S; Cooper Pl S; Holyoke Way S.
Skyway neighborhood detailed profile
Area: 0.550 square miles
Population: 1,843
Population density:
| Skyway (Ranier Beach): | 3,353 people per square mile |
| Seattle: | 8,750 people per square mile |
Median household income in 2021:
| Skyway (Ranier Beach): | $83,681 |
| Seattle: | $110,781 |
Median rent in in 2021:
| Skyway (Ranier Beach): | $1,646 |
| Seattle: | $1,670 |
Male vs Females
| Males: | 920 |
| Females: | 922 |
Median age
| Males: | 33.4 years |
| Females: | 49.4 years |
Average estimated value of detached houses in 2021 (100.0% of all units):
| Skyway (Ranier Beach): | $541,753 |
| Seattle: | $906,138 |
Most popular occupations of males: sales and office occupations (21.4%); transportation occupations (16.7%); community and social services occupations (15.4%); production occupations (14.1%); computer and mathematical occupations (8.5%); business and financial operations occupations (7.3%); service occupations (7.3%)
Most popular occupations of females: service occupations (27.2%); sales and office occupations (18.0%); production occupations (15.1%); material moving occupations (8.6%); business and financial operations occupations (8.4%); computer and mathematical occupations (6.9%); management occupations (except farmers) (6.7%)
Roads and streets: Waters Ave S; Rainier Ave; Renton Ave S; S Roxbury St; S Norfolk St; S Cooper St; S Ryan St; 57th Ave S; 59th Ave S; S Fletcher St; Arrowsmith Ave S; S Pilgrim St; 61st Ave S; 54th Ave S; 56th Ave S; 62nd Ave S; 60th Ave S; 53rd Ave S; 52nd Ave S; Waters Aly S (Arrowsmith Aly S); 63rd Ave S; 55th Ave S; Sturtevant Ave S; 51st Ave S; 64th Ave S; 58th Ave S; S Gazelle St; 65th Ave S; S Carver St; S Keppler St; S Redwing St; Lima Ter S; 66th Ave S; 67th Ave S; Mayes Ct S; S Perry St; Ithaca Pl S; Seward Park Ave S; S Thayer St; Lindsay Pl S; Cooper Pl S; Holyoke Way S.
Skyway neighborhood detailed profile
SoDo neighborhood in Seattle statistics: (Find on map)
Area: 0.278 square miles
Population: 1,555
Population density:
Median household income in 2021:
Median rent in in 2021:
Male vs Females
Median age
Housing prices:
Average estimated value of detached houses in 2021 (1.8% of all units):
Average estimated '21 value of housing units in 5-or-more-unit structures (65.9% of all units):
Most popular occupations of males: service occupations (19.8%); management occupations (except farmers) (18.7%); computer and mathematical occupations (11.8%); sales and office occupations (11.0%); legal occupations (7.5%); arts, design, entertainment, sports, and media occupations (6.4%); material moving occupations (6.2%)
Most popular occupations of females: management occupations (except farmers) (24.8%); service occupations (21.1%); healthcare practitioners and technical occupations (13.6%); sales and office occupations (10.3%); education, training, and library occupations (9.3%); business and financial operations occupations (8.5%); computer and mathematical occupations (3.1%)
Limited-access highways (interstate or state) in this neighborhood: I- 5; I- 90.
Highways in this neighborhood: Alaskan Way Viaduct (Alaska Fwy, State Rte 99).
Roads and streets: 4th Ave S; 1st Ave S; Occidental Ave S; Yesler Way; James St; S Main St; S Jackson St; S Washington St; S King St; 2nd Avenue Extended S; 2nd Ave S; S Railroad Way; 3rd Ave S; 6th Ave; Jefferson St; 4th Ave; 5th Ave; 1st Ave; Columbia St; 3rd Ave; Post Ave; Prefontaine Pl S; S Dearborn St; Weller St Walk; Terrace St; Western Ave; Dilling Way; 2nd Ave; Cherry St; Railroad Way S.
Railroad features: Burlington Northern Santa Fe Rlwy; Amtrak (Burlington Northern Santa Fe Rlwy).
SoDo neighborhood detailed profile
Area: 0.278 square miles
Population: 1,555
Population density:
| SoDo: | 5,584 people per square mile |
| Seattle: | 8,750 people per square mile |
Median household income in 2021:
| SoDo: | $46,132 |
| Seattle: | $110,781 |
Median rent in in 2021:
| SoDo: | $1,156 |
| Seattle: | $1,670 |
Male vs Females
| Males: | 1,177 |
| Females: | 377 |
Median age
| Males: | 35.8 years |
| Females: | 51.7 years |
Housing prices:
Average estimated value of detached houses in 2021 (1.8% of all units):
| SoDo: | $754,688 |
| Seattle: | $906,138 |
Average estimated '21 value of housing units in 5-or-more-unit structures (65.9% of all units):
| SoDo: | $632,346 |
| Seattle: | $570,782 |
Most popular occupations of males: service occupations (19.8%); management occupations (except farmers) (18.7%); computer and mathematical occupations (11.8%); sales and office occupations (11.0%); legal occupations (7.5%); arts, design, entertainment, sports, and media occupations (6.4%); material moving occupations (6.2%)
Most popular occupations of females: management occupations (except farmers) (24.8%); service occupations (21.1%); healthcare practitioners and technical occupations (13.6%); sales and office occupations (10.3%); education, training, and library occupations (9.3%); business and financial operations occupations (8.5%); computer and mathematical occupations (3.1%)
Limited-access highways (interstate or state) in this neighborhood: I- 5; I- 90.
Highways in this neighborhood: Alaskan Way Viaduct (Alaska Fwy, State Rte 99).
Roads and streets: 4th Ave S; 1st Ave S; Occidental Ave S; Yesler Way; James St; S Main St; S Jackson St; S Washington St; S King St; 2nd Avenue Extended S; 2nd Ave S; S Railroad Way; 3rd Ave S; 6th Ave; Jefferson St; 4th Ave; 5th Ave; 1st Ave; Columbia St; 3rd Ave; Post Ave; Prefontaine Pl S; S Dearborn St; Weller St Walk; Terrace St; Western Ave; Dilling Way; 2nd Ave; Cherry St; Railroad Way S.
Railroad features: Burlington Northern Santa Fe Rlwy; Amtrak (Burlington Northern Santa Fe Rlwy).
SoDo neighborhood detailed profile
South Beacon Hill neighborhood in Seattle statistics: (Find on map)
Area: 1.376 square miles
Population: 4,901
Population density:
Median household income in 2021:
Median rent in in 2021:
Male vs Females
Median age
Housing prices:
Average estimated value of detached houses in 2021 (93.2% of all units):
Average estimated value of townhouses or other attached units in 2021 (3.0% of all units):
Most popular occupations of males: service occupations (31.6%); sales and office occupations (22.3%); material moving occupations (6.0%); construction, extraction, and maintenance occupations (5.2%); business and financial operations occupations (4.5%); architecture and engineering occupations (4.4%); management occupations (except farmers) (4.3%)
Most popular occupations of females: sales and office occupations (26.1%); service occupations (22.3%); business and financial operations occupations (13.2%); production occupations (8.1%); community and social services occupations (5.6%); computer and mathematical occupations (4.9%); education, training, and library occupations (4.3%)
Limited-access highways (interstate or state) in this neighborhood: I- 5.
Roads and streets: Beacon Ave S; Airport Way S; 39th Ave S; 37th Ave S; 42nd Ave S; Boeing Field King Co Intl; 38th Ave S; Military Rd S; S Webster St; S Rose St; S Cloverdale St; S Kenyon St; S Holden St; S Portland St; 36th Ave S; S Austin St; Carkeek Dr S; S Othello St; S Thistle St; Corgiat Dr S; 41st Ave S; S Chicago St; S Perry St; S Pilgrim St; 32nd Ave S; S Burns St; S Sullivan St; S Benefit St; 35th Ave S; S Trenton St; S Roxbury St; Cecil Ave S; S Myrtle St; S Barton St; 34th Ave S; 33rd Ave S; Perimeter Rd S; S Monroe St; S Cambridge St; Swift Ave S; S Myrtle Pl; S Norfolk St; S Ronald Dr; 40th Ave S; S Fontanelle St; Martin Luther King Way S; Holly Park Dr S; Ursula Pl S; Merton Way S; S Graham St; Sunny View Dr S; 30th Ave S; Thistle St; S Henderson St; Sunny View Dr; Haraden Pl S; Edward Dr S; 29th Ave S; 16th Ave S; S Dedham St; 18th Ave S; Kenyon Way S; S Corgiat Dr; S Donovan St; S Fairbanks St; 17th Ave S; Albro Pl; Leroy Pl S.
Railroad features: Union Pacific RR (Burlington Northern Santa Fe Rlwy).
South Beacon Hill neighborhood detailed profile
Area: 1.376 square miles
Population: 4,901
Population density:
| South Beacon Hill: | 3,563 people per square mile |
| Seattle: | 8,750 people per square mile |
Median household income in 2021:
| South Beacon Hill: | $79,972 |
| Seattle: | $110,781 |
Median rent in in 2021:
| South Beacon Hill: | $1,777 |
| Seattle: | $1,670 |
Male vs Females
| Males: | 2,419 |
| Females: | 2,482 |
Median age
| Males: | 41.5 years |
| Females: | 49.6 years |
Housing prices:
Average estimated value of detached houses in 2021 (93.2% of all units):
| South Beacon Hill: | $524,810 |
| Seattle: | $906,138 |
Average estimated value of townhouses or other attached units in 2021 (3.0% of all units):
| This neighborhood: | $607,063 |
| city: | $615,733 |
Most popular occupations of males: service occupations (31.6%); sales and office occupations (22.3%); material moving occupations (6.0%); construction, extraction, and maintenance occupations (5.2%); business and financial operations occupations (4.5%); architecture and engineering occupations (4.4%); management occupations (except farmers) (4.3%)
Most popular occupations of females: sales and office occupations (26.1%); service occupations (22.3%); business and financial operations occupations (13.2%); production occupations (8.1%); community and social services occupations (5.6%); computer and mathematical occupations (4.9%); education, training, and library occupations (4.3%)
Limited-access highways (interstate or state) in this neighborhood: I- 5.
Roads and streets: Beacon Ave S; Airport Way S; 39th Ave S; 37th Ave S; 42nd Ave S; Boeing Field King Co Intl; 38th Ave S; Military Rd S; S Webster St; S Rose St; S Cloverdale St; S Kenyon St; S Holden St; S Portland St; 36th Ave S; S Austin St; Carkeek Dr S; S Othello St; S Thistle St; Corgiat Dr S; 41st Ave S; S Chicago St; S Perry St; S Pilgrim St; 32nd Ave S; S Burns St; S Sullivan St; S Benefit St; 35th Ave S; S Trenton St; S Roxbury St; Cecil Ave S; S Myrtle St; S Barton St; 34th Ave S; 33rd Ave S; Perimeter Rd S; S Monroe St; S Cambridge St; Swift Ave S; S Myrtle Pl; S Norfolk St; S Ronald Dr; 40th Ave S; S Fontanelle St; Martin Luther King Way S; Holly Park Dr S; Ursula Pl S; Merton Way S; S Graham St; Sunny View Dr S; 30th Ave S; Thistle St; S Henderson St; Sunny View Dr; Haraden Pl S; Edward Dr S; 29th Ave S; 16th Ave S; S Dedham St; 18th Ave S; Kenyon Way S; S Corgiat Dr; S Donovan St; S Fairbanks St; 17th Ave S; Albro Pl; Leroy Pl S.
Railroad features: Union Pacific RR (Burlington Northern Santa Fe Rlwy).
South Beacon Hill neighborhood detailed profile
South Delridge neighborhood in Seattle statistics: (Find on map)
Area: 0.644 square miles
Population: 3,683
Population density:
Median household income in 2021:
Median rent in in 2021:
Male vs Females
Median age
Housing prices:
Average estimated value of detached houses in 2021 (88.4% of all units):
Average estimated value of townhouses or other attached units in 2021 (3.2% of all units):
Most popular occupations of males: service occupations (16.6%); sales and office occupations (13.3%); business and financial operations occupations (9.8%); management occupations (except farmers) (7.7%); construction, extraction, and maintenance occupations (6.8%); architecture and engineering occupations (6.7%); material moving occupations (6.3%)
Most popular occupations of females: sales and office occupations (28.1%); service occupations (21.1%); business and financial operations occupations (10.4%); management occupations (except farmers) (8.4%); education, training, and library occupations (6.9%); healthcare practitioners and technical occupations (6.2%); material moving occupations (4.7%)
Roads and streets: 20th Ave SW; 16th Ave SW; Delridge Way SW; 18th Ave SW; 17th Ave SW; 24th Ave SW; 22nd Ave SW; SW Cambridge St; SW Thistle St; SW Roxbury St; SW Cloverdale St; SW Barton St; SW Elmgrove St; SW Trenton St; SW Kenyon St; 21st Ave SW; SW Henderson St; SW Holden St; SW Barton Pl; Kelsey Ln SW; 23rd Ave SW; 25th Ave SW; 26th Ave SW; SW Austin St; 19th Ave SW; SW Webster St; SW Portland Ct; SW Chicago Ct.
South Delridge neighborhood detailed profile
Area: 0.644 square miles
Population: 3,683
Population density:
| South Delridge: | 5,720 people per square mile |
| Seattle: | 8,750 people per square mile |
Median household income in 2021:
| South Delridge: | $113,928 |
| Seattle: | $110,781 |
Median rent in in 2021:
| South Delridge: | $1,908 |
| Seattle: | $1,670 |
Male vs Females
| Males: | 1,966 |
| Females: | 1,717 |
Median age
| Males: | 35.5 years |
| Females: | 38.3 years |
Housing prices:
Average estimated value of detached houses in 2021 (88.4% of all units):
| South Delridge: | $559,427 |
| Seattle: | $906,138 |
Average estimated value of townhouses or other attached units in 2021 (3.2% of all units):
| This neighborhood: | $611,365 |
| city: | $615,733 |
Most popular occupations of males: service occupations (16.6%); sales and office occupations (13.3%); business and financial operations occupations (9.8%); management occupations (except farmers) (7.7%); construction, extraction, and maintenance occupations (6.8%); architecture and engineering occupations (6.7%); material moving occupations (6.3%)
Most popular occupations of females: sales and office occupations (28.1%); service occupations (21.1%); business and financial operations occupations (10.4%); management occupations (except farmers) (8.4%); education, training, and library occupations (6.9%); healthcare practitioners and technical occupations (6.2%); material moving occupations (4.7%)
Roads and streets: 20th Ave SW; 16th Ave SW; Delridge Way SW; 18th Ave SW; 17th Ave SW; 24th Ave SW; 22nd Ave SW; SW Cambridge St; SW Thistle St; SW Roxbury St; SW Cloverdale St; SW Barton St; SW Elmgrove St; SW Trenton St; SW Kenyon St; 21st Ave SW; SW Henderson St; SW Holden St; SW Barton Pl; Kelsey Ln SW; 23rd Ave SW; 25th Ave SW; 26th Ave SW; SW Austin St; 19th Ave SW; SW Webster St; SW Portland Ct; SW Chicago Ct.
South Delridge neighborhood detailed profile
South Lake Union neighborhood in Seattle statistics: (Find on map)
Area: 0.680 square miles
Population: 3,790
Population density:
Median household income in 2021:
Median rent in in 2021:
Male vs Females
Median age
Most popular occupations of males: computer and mathematical occupations (28.0%); sales and office occupations (17.5%); management occupations (except farmers) (15.2%); architecture and engineering occupations (9.9%); business and financial operations occupations (9.3%); arts, design, entertainment, sports, and media occupations (5.3%); community and social services occupations (3.9%)
Most popular occupations of females: management occupations (except farmers) (20.3%); sales and office occupations (17.3%); business and financial operations occupations (14.9%); healthcare practitioners and technical occupations (11.4%); service occupations (10.2%); education, training, and library occupations (9.9%); community and social services occupations (5.9%)
Limited-access highways (interstate or state) in this neighborhood: I- 5.
Highways in this neighborhood: State Rte 99 (Battery Street Tunl).
Roads and streets: John St; Thomas St; Eastlake Ave E; Harrison St; Mercer St; Fairview Ave N; Broad St; Republican St; Yale Ave N; Valley St; Aurora Ave N; 9th Ave N; 8th Ave N; Westlake Ave N; Dexter Ave N; Minor Ave N; Terry Ave N; 6th Ave N; Boren Ave N; Aloha St; Roy St; Pontius Ave N; Fairview Ave E; Lakeview Blvd E; E Galer St; Ward St; E Garfield St; Franklin Ave E; Taylor Ave N; E Blaine St; Monorail (5th Ave N); Stewart St; Fairview Pl N; E Nelson Pl.
Railroad features: Abandoned RR.
South Lake Union neighborhood detailed profile
Area: 0.680 square miles
Population: 3,790
Population density:
| South Lake Union: | 5,570 people per square mile |
| Seattle: | 8,750 people per square mile |
Median household income in 2021:
| South Lake Union: | $126,722 |
| Seattle: | $110,781 |
Median rent in in 2021:
| South Lake Union: | $2,018 |
| Seattle: | $1,670 |
Male vs Females
| Males: | 1,837 |
| Females: | 1,953 |
Median age
| Males: | 30.6 years |
| Females: | 31.2 years |
Most popular occupations of males: computer and mathematical occupations (28.0%); sales and office occupations (17.5%); management occupations (except farmers) (15.2%); architecture and engineering occupations (9.9%); business and financial operations occupations (9.3%); arts, design, entertainment, sports, and media occupations (5.3%); community and social services occupations (3.9%)
Most popular occupations of females: management occupations (except farmers) (20.3%); sales and office occupations (17.3%); business and financial operations occupations (14.9%); healthcare practitioners and technical occupations (11.4%); service occupations (10.2%); education, training, and library occupations (9.9%); community and social services occupations (5.9%)
Limited-access highways (interstate or state) in this neighborhood: I- 5.
Highways in this neighborhood: State Rte 99 (Battery Street Tunl).
Roads and streets: John St; Thomas St; Eastlake Ave E; Harrison St; Mercer St; Fairview Ave N; Broad St; Republican St; Yale Ave N; Valley St; Aurora Ave N; 9th Ave N; 8th Ave N; Westlake Ave N; Dexter Ave N; Minor Ave N; Terry Ave N; 6th Ave N; Boren Ave N; Aloha St; Roy St; Pontius Ave N; Fairview Ave E; Lakeview Blvd E; E Galer St; Ward St; E Garfield St; Franklin Ave E; Taylor Ave N; E Blaine St; Monorail (5th Ave N); Stewart St; Fairview Pl N; E Nelson Pl.
Railroad features: Abandoned RR.
South Lake Union neighborhood detailed profile
South Park neighborhood in Seattle statistics: (Find on map)
Area: 1.220 square miles
Population: 4,037
Population density:
Median household income in 2021:
Median rent in in 2021:
Male vs Females
Median age
Housing prices:
Average estimated value of detached houses in 2021 (56.1% of all units):
Average estimated value of townhouses or other attached units in 2021 (7.2% of all units):
Most popular occupations of males: service occupations (31.9%); sales and office occupations (11.1%); construction, extraction, and maintenance occupations (10.4%); management occupations (except farmers) (8.9%); material moving occupations (7.6%); production occupations (6.7%); computer and mathematical occupations (5.6%)
Most popular occupations of females: service occupations (33.2%); sales and office occupations (23.2%); healthcare practitioners and technical occupations (9.9%); material moving occupations (7.4%); management occupations (except farmers) (7.2%); community and social services occupations (5.2%); business and financial operations occupations (4.5%)
Highways in this neighborhood: State Rte 99 (W Marginal Way S); State Rte 509; State Rte 99; State Rte 509 (1st Avenue S Brg, State Rte 99); 2nd Ave SW (State Rte 99).
Roads and streets: S Cloverdale St; S Henderson St; S Donovan St; 5th Ave S; S Director St; S Trenton St; 8th Ave S; S Sullivan St; 7th Ave S; 10th Ave S; S Kenyon St; S 96th St; S Southern St; W Marginal Way; Dallas Ave S; S Rose St; 2nd Ave S; S Concord St; S Chicago St; 12th Ave S; S Portland St; S Elmgrove St; 14th Ave S; Occidental Ave S; S Thistle St; S Barton St; S Holden St; 3rd Ave S; 4th Ave S; S Monroe St; S Austin St; S Webster St; S Riverside Dr; SW Michigan St; S Fontanelle St; S Orr St; 16th Ave S; 1st Ave S; S Orchard St; S Cambridge St; W Marginal Way SW; 17th Ave S.
South Park neighborhood detailed profile
Area: 1.220 square miles
Population: 4,037
Population density:
| South Park: | 3,308 people per square mile |
| Seattle: | 8,750 people per square mile |
Median household income in 2021:
| South Park: | $67,256 |
| Seattle: | $110,781 |
Median rent in in 2021:
| South Park: | $1,071 |
| Seattle: | $1,670 |
Male vs Females
| Males: | 2,196 |
| Females: | 1,841 |
Median age
| Males: | 42.0 years |
| Females: | 45.5 years |
Housing prices:
Average estimated value of detached houses in 2021 (56.1% of all units):
| South Park: | $479,272 |
| Seattle: | $906,138 |
Average estimated value of townhouses or other attached units in 2021 (7.2% of all units):
| This neighborhood: | $1,000,332 |
| city: | $615,733 |
Most popular occupations of males: service occupations (31.9%); sales and office occupations (11.1%); construction, extraction, and maintenance occupations (10.4%); management occupations (except farmers) (8.9%); material moving occupations (7.6%); production occupations (6.7%); computer and mathematical occupations (5.6%)
Most popular occupations of females: service occupations (33.2%); sales and office occupations (23.2%); healthcare practitioners and technical occupations (9.9%); material moving occupations (7.4%); management occupations (except farmers) (7.2%); community and social services occupations (5.2%); business and financial operations occupations (4.5%)
Highways in this neighborhood: State Rte 99 (W Marginal Way S); State Rte 509; State Rte 99; State Rte 509 (1st Avenue S Brg, State Rte 99); 2nd Ave SW (State Rte 99).
Roads and streets: S Cloverdale St; S Henderson St; S Donovan St; 5th Ave S; S Director St; S Trenton St; 8th Ave S; S Sullivan St; 7th Ave S; 10th Ave S; S Kenyon St; S 96th St; S Southern St; W Marginal Way; Dallas Ave S; S Rose St; 2nd Ave S; S Concord St; S Chicago St; 12th Ave S; S Portland St; S Elmgrove St; 14th Ave S; Occidental Ave S; S Thistle St; S Barton St; S Holden St; 3rd Ave S; 4th Ave S; S Monroe St; S Austin St; S Webster St; S Riverside Dr; SW Michigan St; S Fontanelle St; S Orr St; 16th Ave S; 1st Ave S; S Orchard St; S Cambridge St; W Marginal Way SW; 17th Ave S.
South Park neighborhood detailed profile
Southeast Magnolia neighborhood in Seattle statistics: (Find on map)
Area: 0.659 square miles
Population: 6,563
Population density:
Median household income in 2021:
Median rent in in 2021:
Male vs Females
Median age
Housing prices:
Average estimated value of detached houses in 2021 (70.5% of all units):
Average estimated value of townhouses or other attached units in 2021 (6.2% of all units):
Average estimated '21 value of housing units in 5-or-more-unit structures (31.9% of all units):
Most popular occupations of males: management occupations (except farmers) (28.9%); sales and office occupations (11.2%); computer and mathematical occupations (8.7%); healthcare practitioners and technical occupations (8.7%); architecture and engineering occupations (7.7%); legal occupations (6.1%); production occupations (5.3%)
Most popular occupations of females: healthcare practitioners and technical occupations (19.5%); management occupations (except farmers) (17.3%); sales and office occupations (16.5%); business and financial operations occupations (15.3%); service occupations (14.5%); computer and mathematical occupations (9.1%); life, physical, and social science occupations (4.8%)
Roads and streets: W Armour St; 29th Ave W; 28th Ave W; W Smith St; W Raye St; W Mc Graw St; 26th Ave W; 30th Ave W; W Lynn St; 31st Ave W; 25th Ave W; Condon Way W; 27th Ave W; W Crockett St; W Boston St; W Barrett St; 24th Ave W; W Halladay St; 32nd Ave W; 34th Ave W; W Howe St; W Blaine St; W Newton St; W Hayes St; W Garfield St; 23rd Ave W; W Lynn Pl; W Fulton St; W Eaton St; Thorndyke Ave W; W Plymouth St; Clise Pl W; W Wheeler St; 22nd Ave W; 21st Ave W; 33rd Ave W; W Galer St; Thorndyke Pl W; Patten Pl W.
Southeast Magnolia neighborhood detailed profile
Area: 0.659 square miles
Population: 6,563
Population density:
| Southeast Magnolia: | 9,954 people per square mile |
| Seattle: | 8,750 people per square mile |
Median household income in 2021:
| Southeast Magnolia: | $159,343 |
| Seattle: | $110,781 |
Median rent in in 2021:
| Southeast Magnolia: | $1,607 |
| Seattle: | $1,670 |
Male vs Females
| Males: | 3,117 |
| Females: | 3,446 |
Median age
| Males: | 42.2 years |
| Females: | 45.9 years |
Housing prices:
Average estimated value of detached houses in 2021 (70.5% of all units):
| Southeast Magnolia: | $1,033,511 |
| Seattle: | $906,138 |
Average estimated value of townhouses or other attached units in 2021 (6.2% of all units):
| This neighborhood: | $666,821 |
| city: | $615,733 |
Average estimated '21 value of housing units in 5-or-more-unit structures (31.9% of all units):
| Southeast Magnolia: | $338,748 |
| Seattle: | $570,782 |
Most popular occupations of males: management occupations (except farmers) (28.9%); sales and office occupations (11.2%); computer and mathematical occupations (8.7%); healthcare practitioners and technical occupations (8.7%); architecture and engineering occupations (7.7%); legal occupations (6.1%); production occupations (5.3%)
Most popular occupations of females: healthcare practitioners and technical occupations (19.5%); management occupations (except farmers) (17.3%); sales and office occupations (16.5%); business and financial operations occupations (15.3%); service occupations (14.5%); computer and mathematical occupations (9.1%); life, physical, and social science occupations (4.8%)
Roads and streets: W Armour St; 29th Ave W; 28th Ave W; W Smith St; W Raye St; W Mc Graw St; 26th Ave W; 30th Ave W; W Lynn St; 31st Ave W; 25th Ave W; Condon Way W; 27th Ave W; W Crockett St; W Boston St; W Barrett St; 24th Ave W; W Halladay St; 32nd Ave W; 34th Ave W; W Howe St; W Blaine St; W Newton St; W Hayes St; W Garfield St; 23rd Ave W; W Lynn Pl; W Fulton St; W Eaton St; Thorndyke Ave W; W Plymouth St; Clise Pl W; W Wheeler St; 22nd Ave W; 21st Ave W; 33rd Ave W; W Galer St; Thorndyke Pl W; Patten Pl W.
Southeast Magnolia neighborhood detailed profile
Stevens neighborhood in Seattle statistics: (Find on map)
Area: 0.929 square miles
Population: 13,411
Population density:
Median household income in 2021:
Median rent in in 2021:
Male vs Females
Median age
Housing prices:
Average estimated value of detached houses in 2021 (48.3% of all units):
Average estimated value of townhouses or other attached units in 2021 (11.2% of all units):
Average estimated '21 value of housing units in 5-or-more-unit structures (12.4% of all units):
Most popular occupations of males: computer and mathematical occupations (17.1%); management occupations (except farmers) (15.8%); sales and office occupations (11.2%); healthcare practitioners and technical occupations (9.2%); business and financial operations occupations (7.1%); education, training, and library occupations (6.9%); service occupations (6.7%)
Most popular occupations of females: sales and office occupations (16.2%); management occupations (except farmers) (16.0%); healthcare practitioners and technical occupations (16.0%); business and financial operations occupations (9.1%); arts, design, entertainment, sports, and media occupations (8.1%); service occupations (7.7%); education, training, and library occupations (6.9%)
Roads and streets: E Madison St; E Roy St; 22nd Ave E; E Aloha St; 16th Ave E; 21st Ave E; 17th Ave E; 18th Ave E; E Mercer St; E Galer St; 19th Ave E; 24th Ave E; 23rd Ave E; 20th Ave E; E Thomas St; E Highland Dr; E Prospect St; 26th Ave E; E John St; 25th Ave E; E Republican St; E Ward St; E Denny Way; E Valley St; 28th Ave E; Interlaken Pl E; E Crescent Dr; E Harrison St; E Helen St; E Boston Ter; E Howell St; E Interlaken Blvd; E Garfield St; 16th Ave; E Lee St; 17th Ave; 27th Ave E; 29th Ave E; E Olive St; 18th Ave; Grandview Pl E; Auburn Pl E; 19th Ave; E Glen St; Peach Ct E; 20th Ave; Turner Way E; Lake Washington Blvd E; Coryell Ct E; E Jansen Ct; Arboretum Pl E.
Stevens neighborhood detailed profile
Area: 0.929 square miles
Population: 13,411
Population density:
| Stevens: | 14,433 people per square mile |
| Seattle: | 8,750 people per square mile |
Median household income in 2021:
| Stevens: | $145,771 |
| Seattle: | $110,781 |
Median rent in in 2021:
| Stevens: | $1,820 |
| Seattle: | $1,670 |
Male vs Females
| Males: | 6,444 |
| Females: | 6,966 |
Median age
| Males: | 38.7 years |
| Females: | 37.9 years |
Housing prices:
Average estimated value of detached houses in 2021 (48.3% of all units):
| Stevens: | $1,455,633 |
| Seattle: | $906,138 |
Average estimated value of townhouses or other attached units in 2021 (11.2% of all units):
| This neighborhood: | $154,441 |
| city: | $615,733 |
Average estimated '21 value of housing units in 5-or-more-unit structures (12.4% of all units):
| Stevens: | $109,932 |
| Seattle: | $570,782 |
Most popular occupations of males: computer and mathematical occupations (17.1%); management occupations (except farmers) (15.8%); sales and office occupations (11.2%); healthcare practitioners and technical occupations (9.2%); business and financial operations occupations (7.1%); education, training, and library occupations (6.9%); service occupations (6.7%)
Most popular occupations of females: sales and office occupations (16.2%); management occupations (except farmers) (16.0%); healthcare practitioners and technical occupations (16.0%); business and financial operations occupations (9.1%); arts, design, entertainment, sports, and media occupations (8.1%); service occupations (7.7%); education, training, and library occupations (6.9%)
Roads and streets: E Madison St; E Roy St; 22nd Ave E; E Aloha St; 16th Ave E; 21st Ave E; 17th Ave E; 18th Ave E; E Mercer St; E Galer St; 19th Ave E; 24th Ave E; 23rd Ave E; 20th Ave E; E Thomas St; E Highland Dr; E Prospect St; 26th Ave E; E John St; 25th Ave E; E Republican St; E Ward St; E Denny Way; E Valley St; 28th Ave E; Interlaken Pl E; E Crescent Dr; E Harrison St; E Helen St; E Boston Ter; E Howell St; E Interlaken Blvd; E Garfield St; 16th Ave; E Lee St; 17th Ave; 27th Ave E; 29th Ave E; E Olive St; 18th Ave; Grandview Pl E; Auburn Pl E; 19th Ave; E Glen St; Peach Ct E; 20th Ave; Turner Way E; Lake Washington Blvd E; Coryell Ct E; E Jansen Ct; Arboretum Pl E.
Stevens neighborhood detailed profile
Sunset Hill neighborhood in Seattle statistics: (Find on map)
Area: 1.028 square miles
Population: 21,323
Population density:
Median household income in 2021:
Median rent in in 2021:
Male vs Females
Median age
Most popular occupations of males: sales and office occupations (23.8%); management occupations (except farmers) (20.5%); service occupations (10.7%); business and financial operations occupations (9.4%); computer and mathematical occupations (6.3%); construction, extraction, and maintenance occupations (6.2%); transportation occupations (6.2%)
Most popular occupations of females: sales and office occupations (20.9%); business and financial operations occupations (16.6%); service occupations (13.1%); management occupations (except farmers) (12.1%); community and social services occupations (9.5%); arts, design, entertainment, sports, and media occupations (8.9%); healthcare practitioners and technical occupations (7.6%)
Roads and streets: Seaview Ave NW; 32nd Ave NW; 34th Ave NW; 30th Ave NW; 28th Ave NW; NW 65th St; NW 68th St; NW 67th St; NW 70th St; Golden Gardens Dr NW; NW 71st St; 36th Ave NW; NW 72nd St; 33rd Ave NW; NW 73rd St; NW 74th St; 31st Ave NW; 29th Ave NW; NW 66th St; NW 75th St; NW 77th St; NW 80th St; NW 69th St; Loyal Way NW; NW 62nd St; NW 61st St; NW 64th St; NW 60th St; 35th Ave NW; NW 85th St; NW 57th St; NW 59th St; NW Market St; 37th Ave NW; NW 56th St; Overflow Parking Lot; Seaview Pl NW; Golden Gardens Park Rd; NW 57th Pl; NW 83rd St; 35th Pl NW; View Ave NW; NW 58th St; NW Golden Pl; 38th Ave NW; 33rd Pl NW; Stanton Pl NW; Parker Ct NW.
Railroad features: Burlington Northern Santa Fe Rlwy; Ballard Terminal RR.
Sunset Hill neighborhood detailed profile
Area: 1.028 square miles
Population: 21,323
Population density:
| Sunset Hill: | 20,741 people per square mile |
| Seattle: | 8,750 people per square mile |
Median household income in 2021:
| Sunset Hill: | $177,704 |
| Seattle: | $110,781 |
Median rent in in 2021:
| Sunset Hill: | $2,154 |
| Seattle: | $1,670 |
Male vs Females
| Males: | 11,115 |
| Females: | 10,207 |
Median age
| Males: | 40.0 years |
| Females: | 44.6 years |
Most popular occupations of males: sales and office occupations (23.8%); management occupations (except farmers) (20.5%); service occupations (10.7%); business and financial operations occupations (9.4%); computer and mathematical occupations (6.3%); construction, extraction, and maintenance occupations (6.2%); transportation occupations (6.2%)
Most popular occupations of females: sales and office occupations (20.9%); business and financial operations occupations (16.6%); service occupations (13.1%); management occupations (except farmers) (12.1%); community and social services occupations (9.5%); arts, design, entertainment, sports, and media occupations (8.9%); healthcare practitioners and technical occupations (7.6%)
Roads and streets: Seaview Ave NW; 32nd Ave NW; 34th Ave NW; 30th Ave NW; 28th Ave NW; NW 65th St; NW 68th St; NW 67th St; NW 70th St; Golden Gardens Dr NW; NW 71st St; 36th Ave NW; NW 72nd St; 33rd Ave NW; NW 73rd St; NW 74th St; 31st Ave NW; 29th Ave NW; NW 66th St; NW 75th St; NW 77th St; NW 80th St; NW 69th St; Loyal Way NW; NW 62nd St; NW 61st St; NW 64th St; NW 60th St; 35th Ave NW; NW 85th St; NW 57th St; NW 59th St; NW Market St; 37th Ave NW; NW 56th St; Overflow Parking Lot; Seaview Pl NW; Golden Gardens Park Rd; NW 57th Pl; NW 83rd St; 35th Pl NW; View Ave NW; NW 58th St; NW Golden Pl; 38th Ave NW; 33rd Pl NW; Stanton Pl NW; Parker Ct NW.
Railroad features: Burlington Northern Santa Fe Rlwy; Ballard Terminal RR.
Sunset Hill neighborhood detailed profile
University District neighborhood in Seattle statistics: (Find on map)
Area: 1.948 square miles
Population: 25,912
Population density:
Median household income in 2021:
Median rent in in 2021:
Male vs Females
Median age
Average estimated value of detached houses in 2021 (73.2% of all units):
Most popular occupations of males: service occupations (29.0%); computer and mathematical occupations (23.2%); education, training, and library occupations (20.7%); life, physical, and social science occupations (9.3%); healthcare practitioners and technical occupations (9.3%); architecture and engineering occupations (8.4%); arts, design, entertainment, sports, and media occupations (8.0%)
Most popular occupations of females: sales and office occupations (36.9%); service occupations (24.0%); education, training, and library occupations (8.7%); production occupations (6.4%); legal occupations (5.8%); architecture and engineering occupations (4.6%); computer and mathematical occupations (3.9%)
Highways in this neighborhood: Montlake Blvd NE (State Rte 513).
Roads and streets: Burke Gilman Trl; NE Ravenna Blvd; NE 45th St; NE Pacific St; 15th Ave NE; NE 55th St; 17th Ave NE; Stevens Way; University Way NE; 8th Ave NE; Brooklyn Ave NE; NE 47th St; Roosevelt Way NE; 11th Ave NE; 12th Ave NE; NE 41st St; NE 50th St; 7th Ave NE; Walla Walla Rd; 9th Ave NE; NE Campus Pkwy; NE 56th St; NE 42nd St; NE 43rd St; NE 52nd St; NE 58th St; 16th Ave NE; NE 40th St; 25th Ave NE; 20th Ave NE; Mason Rd; Rainier Vis; Ravenna Ave NE; 21st Ave NE; 18th Ave NE; 19th Ave NE; NE Blakeley St; NE 54th St; Memorial Way; 22nd Ave NE; NE Pacific Pl; Pend Oreille Rd; NE 53rd St; Grant Ln; Union Bay Pl NE (Mary Gates Memorial Dr NE); Whitman Ct; NE 59th St; George Washington Ln; Chelan Ln; Ravenna Pl NE; Pierce Ln; 24th Ave NE; Benton Ln; Skagit Ln; Whatcom Ln; Okanogan Ln; NE Northlake Pl; NE 44th St; Snohomish Ln; Cowlitz Rd NE; 37th Ave NE; NE 57th St; Jefferson Rd; Spokane Ln; 36th Ave NE; NE Park Rd; Columbia Rd; 26th Ave NE; Wahkiakum Ln; NE 48th St; NE 60th St; Surber Dr NE; NE Northlake Way; Klickitat Ln; Lewis Ln; NE 45th Pl; University Brg; Asotin Pl; NE 46th St; NE 51st St; NE 38th St; NE Boat St; Adams Ln; NE 62nd St; 21st Pl NE; NE 55th Pl; Cowlitz Rd; Pasadena Pl NE; 40th Ave NE; NE 49th St; Park Rd NE; NE 22nd Ave; Lincoln Way; 38th Ave NE; Union Bay Cir NE; 10th Ave NE; Eastlake Ave NE; Garfield Ln; Eastlake Ave E; Adams Ln NE.
University District neighborhood detailed profile
Area: 1.948 square miles
Population: 25,912
Population density:
| University District (U District): | 13,302 people per square mile |
| Seattle: | 8,750 people per square mile |
Median household income in 2021:
| University District (U District): | $75,313 |
| Seattle: | $110,781 |
Median rent in in 2021:
| University District (U District): | $1,582 |
| Seattle: | $1,670 |
Male vs Females
| Males: | 12,702 |
| Females: | 13,210 |
Median age
| Males: | 26.1 years |
| Females: | 21.9 years |
Average estimated value of detached houses in 2021 (73.2% of all units):
| University District (U District): | $744,801 |
| Seattle: | $906,138 |
Most popular occupations of males: service occupations (29.0%); computer and mathematical occupations (23.2%); education, training, and library occupations (20.7%); life, physical, and social science occupations (9.3%); healthcare practitioners and technical occupations (9.3%); architecture and engineering occupations (8.4%); arts, design, entertainment, sports, and media occupations (8.0%)
Most popular occupations of females: sales and office occupations (36.9%); service occupations (24.0%); education, training, and library occupations (8.7%); production occupations (6.4%); legal occupations (5.8%); architecture and engineering occupations (4.6%); computer and mathematical occupations (3.9%)
Highways in this neighborhood: Montlake Blvd NE (State Rte 513).
Roads and streets: Burke Gilman Trl; NE Ravenna Blvd; NE 45th St; NE Pacific St; 15th Ave NE; NE 55th St; 17th Ave NE; Stevens Way; University Way NE; 8th Ave NE; Brooklyn Ave NE; NE 47th St; Roosevelt Way NE; 11th Ave NE; 12th Ave NE; NE 41st St; NE 50th St; 7th Ave NE; Walla Walla Rd; 9th Ave NE; NE Campus Pkwy; NE 56th St; NE 42nd St; NE 43rd St; NE 52nd St; NE 58th St; 16th Ave NE; NE 40th St; 25th Ave NE; 20th Ave NE; Mason Rd; Rainier Vis; Ravenna Ave NE; 21st Ave NE; 18th Ave NE; 19th Ave NE; NE Blakeley St; NE 54th St; Memorial Way; 22nd Ave NE; NE Pacific Pl; Pend Oreille Rd; NE 53rd St; Grant Ln; Union Bay Pl NE (Mary Gates Memorial Dr NE); Whitman Ct; NE 59th St; George Washington Ln; Chelan Ln; Ravenna Pl NE; Pierce Ln; 24th Ave NE; Benton Ln; Skagit Ln; Whatcom Ln; Okanogan Ln; NE Northlake Pl; NE 44th St; Snohomish Ln; Cowlitz Rd NE; 37th Ave NE; NE 57th St; Jefferson Rd; Spokane Ln; 36th Ave NE; NE Park Rd; Columbia Rd; 26th Ave NE; Wahkiakum Ln; NE 48th St; NE 60th St; Surber Dr NE; NE Northlake Way; Klickitat Ln; Lewis Ln; NE 45th Pl; University Brg; Asotin Pl; NE 46th St; NE 51st St; NE 38th St; NE Boat St; Adams Ln; NE 62nd St; 21st Pl NE; NE 55th Pl; Cowlitz Rd; Pasadena Pl NE; 40th Ave NE; NE 49th St; Park Rd NE; NE 22nd Ave; Lincoln Way; 38th Ave NE; Union Bay Cir NE; 10th Ave NE; Eastlake Ave NE; Garfield Ln; Eastlake Ave E; Adams Ln NE.
University District neighborhood detailed profile
Victory Heights neighborhood in Seattle statistics: (Find on map)
Area: 0.775 square miles
Population: 8,220
Population density:
Median household income in 2021:
Median rent in in 2021:
Male vs Females
Median age
Housing prices:
Average estimated value of detached houses in 2021 (56.4% of all units):
Average estimated '21 value of housing units in 5-or-more-unit structures (20.4% of all units):
Most popular occupations of males: sales and office occupations (17.7%); service occupations (14.4%); construction, extraction, and maintenance occupations (10.5%); management occupations (except farmers) (9.2%); computer and mathematical occupations (8.8%); education, training, and library occupations (7.6%); production occupations (7.1%)
Most popular occupations of females: service occupations (20.4%); sales and office occupations (19.8%); management occupations (except farmers) (12.6%); healthcare practitioners and technical occupations (12.6%); education, training, and library occupations (10.7%); business and financial operations occupations (9.8%); arts, design, entertainment, sports, and media occupations (2.8%)
Highways in this neighborhood: State Rte 522 (Lake City Way NE).
Roads and streets: 20th Ave NE; 17th Ave NE; 23rd Ave NE; NE 117th St; 24th Ave NE; 19th Ave NE; NE 120th St; NE 115th St; NE 123rd St; NE Northgate Way; NE 113th St; NE 105th St; NE 100th St; NE 104th St; 22nd Ave NE; NE 107th St; 25th Ave NE; NE 98th St; NE 102nd St; 16th Ave NE; NE 125th St; NE 103rd St; 26th Ave NE; Goodwin Way NE; Hiram Pl NE; Pinehurst Way NE; Victory Ln NE; NE 104th Way; NE 124th St; NE 106th St; Daniel Pl NE; NE Elshin Pl; 28th Ave NE; 23rd Pl NE; 27th Ave NE; NE 108th St; NE 122nd St; 21st Ave NE; Seward Pl NE; Lake View Ln NE; 18th Ave NE; 30th Ave NE; Fischer Pl NE.
Victory Heights neighborhood detailed profile
Area: 0.775 square miles
Population: 8,220
Population density:
| Victory Heights: | 10,600 people per square mile |
| Seattle: | 8,750 people per square mile |
Median household income in 2021:
| Victory Heights: | $107,976 |
| Seattle: | $110,781 |
Median rent in in 2021:
| Victory Heights: | $1,639 |
| Seattle: | $1,670 |
Male vs Females
| Males: | 4,254 |
| Females: | 3,966 |
Median age
| Males: | 38.2 years |
| Females: | 41.1 years |
Housing prices:
Average estimated value of detached houses in 2021 (56.4% of all units):
| Victory Heights: | $863,152 |
| Seattle: | $906,138 |
Average estimated '21 value of housing units in 5-or-more-unit structures (20.4% of all units):
| Victory Heights: | $343,923 |
| Seattle: | $570,782 |
Most popular occupations of males: sales and office occupations (17.7%); service occupations (14.4%); construction, extraction, and maintenance occupations (10.5%); management occupations (except farmers) (9.2%); computer and mathematical occupations (8.8%); education, training, and library occupations (7.6%); production occupations (7.1%)
Most popular occupations of females: service occupations (20.4%); sales and office occupations (19.8%); management occupations (except farmers) (12.6%); healthcare practitioners and technical occupations (12.6%); education, training, and library occupations (10.7%); business and financial operations occupations (9.8%); arts, design, entertainment, sports, and media occupations (2.8%)
Highways in this neighborhood: State Rte 522 (Lake City Way NE).
Roads and streets: 20th Ave NE; 17th Ave NE; 23rd Ave NE; NE 117th St; 24th Ave NE; 19th Ave NE; NE 120th St; NE 115th St; NE 123rd St; NE Northgate Way; NE 113th St; NE 105th St; NE 100th St; NE 104th St; 22nd Ave NE; NE 107th St; 25th Ave NE; NE 98th St; NE 102nd St; 16th Ave NE; NE 125th St; NE 103rd St; 26th Ave NE; Goodwin Way NE; Hiram Pl NE; Pinehurst Way NE; Victory Ln NE; NE 104th Way; NE 124th St; NE 106th St; Daniel Pl NE; NE Elshin Pl; 28th Ave NE; 23rd Pl NE; 27th Ave NE; NE 108th St; NE 122nd St; 21st Ave NE; Seward Pl NE; Lake View Ln NE; 18th Ave NE; 30th Ave NE; Fischer Pl NE.
Victory Heights neighborhood detailed profile
View Ridge neighborhood in Seattle statistics: (Find on map)
Area: 0.889 square miles
Population: 8,093
Population density:
Median household income in 2021:
Median rent in in 2021:
Male vs Females
Median age
Housing prices:
Average estimated value of detached houses in 2021 (85.0% of all units):
Average estimated '21 value of housing units in 5-or-more-unit structures (5.3% of all units):
Most popular occupations of males: management occupations (except farmers) (17.9%); sales and office occupations (14.3%); healthcare practitioners and technical occupations (12.3%); business and financial operations occupations (9.4%); computer and mathematical occupations (9.1%); education, training, and library occupations (8.4%); transportation occupations (7.5%)
Most popular occupations of females: healthcare practitioners and technical occupations (18.6%); service occupations (15.3%); business and financial operations occupations (13.5%); education, training, and library occupations (11.4%); sales and office occupations (10.0%); management occupations (except farmers) (9.2%); life, physical, and social science occupations (6.5%)
Roads and streets: NE 70th St; NE 68th St; NE 75th St; Sand Point Way NE; 58th Ave NE; Fairway Dr NE; NE 73rd St; Lakemont Dr NE; 51st Ave NE; NE 74th St; 55th Ave NE; 56th Ave NE; NE 85th St; 57th Ave NE; Burke Gilman Trl; 54th Ave NE; Ridge Dr NE; NE 86th St; 50th Ave NE; 52nd Ave NE; Forest Dr NE; Crest Dr NE; 45th Ave NE; NE Park Pl; NE Crown Pl; Club House Dr; Paisley Dr NE; 49th Ave NE; 48th Ave NE; 47th Ave NE; 53rd Ave NE; NE 77th St; 46th Ave NE; 43rd Ave NE; Inverness Dr NE; NE 71st St; NE Park Point Dr; NE 69th St; 44th Ave NE; 56th Pl NE; 44th Pl NE; NE 87th St; 57th Pl NE; Paisley Pl NE; Park Point Ln NE; Lakemont Vis NE; NE Sunrise Vis; NE Urban Vis; NE Forest Vis; 55th Pl NE; NE 67th St; 53rd Ct NE; 42nd Ave NE.
View Ridge neighborhood detailed profile
Area: 0.889 square miles
Population: 8,093
Population density:
| View Ridge: | 9,101 people per square mile |
| Seattle: | 8,750 people per square mile |
Median household income in 2021:
| View Ridge: | $137,923 |
| Seattle: | $110,781 |
Median rent in in 2021:
| View Ridge: | $1,895 |
| Seattle: | $1,670 |
Male vs Females
| Males: | 3,950 |
| Females: | 4,143 |
Median age
| Males: | 44.9 years |
| Females: | 43.3 years |
Housing prices:
Average estimated value of detached houses in 2021 (85.0% of all units):
| View Ridge: | $1,155,990 |
| Seattle: | $906,138 |
Average estimated '21 value of housing units in 5-or-more-unit structures (5.3% of all units):
| View Ridge: | $699,091 |
| Seattle: | $570,782 |
Most popular occupations of males: management occupations (except farmers) (17.9%); sales and office occupations (14.3%); healthcare practitioners and technical occupations (12.3%); business and financial operations occupations (9.4%); computer and mathematical occupations (9.1%); education, training, and library occupations (8.4%); transportation occupations (7.5%)
Most popular occupations of females: healthcare practitioners and technical occupations (18.6%); service occupations (15.3%); business and financial operations occupations (13.5%); education, training, and library occupations (11.4%); sales and office occupations (10.0%); management occupations (except farmers) (9.2%); life, physical, and social science occupations (6.5%)
Roads and streets: NE 70th St; NE 68th St; NE 75th St; Sand Point Way NE; 58th Ave NE; Fairway Dr NE; NE 73rd St; Lakemont Dr NE; 51st Ave NE; NE 74th St; 55th Ave NE; 56th Ave NE; NE 85th St; 57th Ave NE; Burke Gilman Trl; 54th Ave NE; Ridge Dr NE; NE 86th St; 50th Ave NE; 52nd Ave NE; Forest Dr NE; Crest Dr NE; 45th Ave NE; NE Park Pl; NE Crown Pl; Club House Dr; Paisley Dr NE; 49th Ave NE; 48th Ave NE; 47th Ave NE; 53rd Ave NE; NE 77th St; 46th Ave NE; 43rd Ave NE; Inverness Dr NE; NE 71st St; NE Park Point Dr; NE 69th St; 44th Ave NE; 56th Pl NE; 44th Pl NE; NE 87th St; 57th Pl NE; Paisley Pl NE; Park Point Ln NE; Lakemont Vis NE; NE Sunrise Vis; NE Urban Vis; NE Forest Vis; 55th Pl NE; NE 67th St; 53rd Ct NE; 42nd Ave NE.
View Ridge neighborhood detailed profile
Wallingford neighborhood in Seattle statistics: (Find on map)
Area: 1.506 square miles
Population: 24,355
Population density:
Median household income in 2021:
Median rent in in 2021:
Male vs Females
Median age
Average estimated value of detached houses in 2021 (55.3% of all units):
Most popular occupations of males: management occupations (except farmers) (13.8%); computer and mathematical occupations (13.3%); service occupations (10.8%); education, training, and library occupations (10.7%); sales and office occupations (10.2%); architecture and engineering occupations (9.0%); business and financial operations occupations (6.6%)
Most popular occupations of females: sales and office occupations (15.7%); healthcare practitioners and technical occupations (14.8%); management occupations (except farmers) (11.3%); education, training, and library occupations (10.5%); service occupations (10.4%); arts, design, entertainment, sports, and media occupations (8.5%); business and financial operations occupations (7.2%)
Limited-access highways (interstate or state) in this neighborhood: I- 5.
Roads and streets: Wallingford Ave N; Meridian Ave N; Woodlawn Ave N; N Northlake Way; Latona Ave NE; Burke Ave N; 1st Ave NE; N 46th St; Densmore Ave N; 5th Ave NE; Burke Gilman Trl; Interlake Ave N; Bagley Ave N; Sunnyside Ave N; N 40th St; N 38th St; N 50th St; N 39th St; Corliss Ave N; Eastern Ave N; N 42nd St; N 43rd St; 2nd Ave NE; N 45th St; N 47th St; N 48th St; N 41st St; N 49th St; N 36th St; 4th Ave NE; N 44th St; Ashworth Ave N; N 51st St; N 54th St; N 37th St; N 35th St; N 52nd St; NE 40th St; N 53rd St; N 55th St; N Pacific St; N 34th St; Thackeray Pl NE; Keystone Pl N; Kirkwood Pl N; NE 50th St; NE 45th St; Carr Pl N; Green Lake Way N; Kensington Pl N; N 57th St; NE Northlake Way; NE 52nd St; NE 51st St; NE 55th St; NE 56th St; NE 54th St; NE 57th St; NE 58th St; NE 59th St; NE 44th St; NE 43rd St; N 59th St; N Northlake Pl; NE 53rd St; NE Pacific St; NE 42nd St; N 56th St; NE 47th St; N 58th St; Midvale Ave N; Whitman Ave N; Woodland Park Ave N; Canfield Pl N; Stone Way N; Stone Ave N; NE 46th St; 6th Ave NE; N Midvale Pl; N Dorothy Pl; N 38th Ct; 49th St; 51st St.
Wallingford neighborhood detailed profile
Area: 1.506 square miles
Population: 24,355
Population density:
| Wallingford: | 16,169 people per square mile |
| Seattle: | 8,750 people per square mile |
Median household income in 2021:
| Wallingford: | $131,236 |
| Seattle: | $110,781 |
Median rent in in 2021:
| Wallingford: | $1,968 |
| Seattle: | $1,670 |
Male vs Females
| Males: | 11,665 |
| Females: | 12,690 |
Median age
| Males: | 35.2 years |
| Females: | 31.9 years |
Average estimated value of detached houses in 2021 (55.3% of all units):
| Wallingford: | $875,189 |
| Seattle: | $906,138 |
Most popular occupations of males: management occupations (except farmers) (13.8%); computer and mathematical occupations (13.3%); service occupations (10.8%); education, training, and library occupations (10.7%); sales and office occupations (10.2%); architecture and engineering occupations (9.0%); business and financial operations occupations (6.6%)
Most popular occupations of females: sales and office occupations (15.7%); healthcare practitioners and technical occupations (14.8%); management occupations (except farmers) (11.3%); education, training, and library occupations (10.5%); service occupations (10.4%); arts, design, entertainment, sports, and media occupations (8.5%); business and financial operations occupations (7.2%)
Limited-access highways (interstate or state) in this neighborhood: I- 5.
Roads and streets: Wallingford Ave N; Meridian Ave N; Woodlawn Ave N; N Northlake Way; Latona Ave NE; Burke Ave N; 1st Ave NE; N 46th St; Densmore Ave N; 5th Ave NE; Burke Gilman Trl; Interlake Ave N; Bagley Ave N; Sunnyside Ave N; N 40th St; N 38th St; N 50th St; N 39th St; Corliss Ave N; Eastern Ave N; N 42nd St; N 43rd St; 2nd Ave NE; N 45th St; N 47th St; N 48th St; N 41st St; N 49th St; N 36th St; 4th Ave NE; N 44th St; Ashworth Ave N; N 51st St; N 54th St; N 37th St; N 35th St; N 52nd St; NE 40th St; N 53rd St; N 55th St; N Pacific St; N 34th St; Thackeray Pl NE; Keystone Pl N; Kirkwood Pl N; NE 50th St; NE 45th St; Carr Pl N; Green Lake Way N; Kensington Pl N; N 57th St; NE Northlake Way; NE 52nd St; NE 51st St; NE 55th St; NE 56th St; NE 54th St; NE 57th St; NE 58th St; NE 59th St; NE 44th St; NE 43rd St; N 59th St; N Northlake Pl; NE 53rd St; NE Pacific St; NE 42nd St; N 56th St; NE 47th St; N 58th St; Midvale Ave N; Whitman Ave N; Woodland Park Ave N; Canfield Pl N; Stone Way N; Stone Ave N; NE 46th St; 6th Ave NE; N Midvale Pl; N Dorothy Pl; N 38th Ct; 49th St; 51st St.
Wallingford neighborhood detailed profile
Wedgwood neighborhood in Seattle statistics: (Find on map)
Area: 1.072 square miles
Population: 11,601
Population density:
Median household income in 2021:
Median rent in in 2021:
Male vs Females
Median age
Housing prices:
Average estimated value of detached houses in 2021 (75.2% of all units):
Average estimated '21 value of housing units in 5-or-more-unit structures (10.9% of all units):
Most popular occupations of males: management occupations (except farmers) (15.2%); education, training, and library occupations (13.9%); computer and mathematical occupations (11.5%); sales and office occupations (9.7%); life, physical, and social science occupations (8.2%); business and financial operations occupations (7.8%); service occupations (7.8%)
Most popular occupations of females: education, training, and library occupations (17.5%); sales and office occupations (14.4%); healthcare practitioners and technical occupations (14.3%); management occupations (except farmers) (11.1%); service occupations (8.2%); business and financial operations occupations (7.4%); life, physical, and social science occupations (7.0%)
Roads and streets: NE 92nd St; NE 85th St; NE 94th St; NE 88th St; NE 80th St; NE 86th St; NE 87th St; NE 90th St; NE 91st St; NE 77th St; NE 89th St; NE 82nd St; NE 75th St; 35th Ave NE; 40th Ave NE; 30th Ave NE; 38th Ave NE; 45th Ave NE; 32nd Ave NE; 42nd Ave NE; 43rd Ave NE; 27th Ave NE; 36th Ave NE; 39th Ave NE; 41st Ave NE; 44th Ave NE; 37th Ave NE; 34th Ave NE; 31st Ave NE; NE 93rd St; NE 84th St; 28th Ave NE; 25th Ave NE; 23rd Ave NE; NE 81st St; Ravenna Ave NE; 33rd Ave NE; NE 83rd St; 26th Ave NE; NE 95th St; 29th Ave NE; 25th Pl NE; 44th Pl NE.
Wedgwood neighborhood detailed profile
Area: 1.072 square miles
Population: 11,601
Population density:
| Wedgwood: | 10,819 people per square mile |
| Seattle: | 8,750 people per square mile |
Median household income in 2021:
| Wedgwood: | $143,747 |
| Seattle: | $110,781 |
Median rent in in 2021:
| Wedgwood: | $1,984 |
| Seattle: | $1,670 |
Male vs Females
| Males: | 6,087 |
| Females: | 5,513 |
Median age
| Males: | 40.6 years |
| Females: | 40.8 years |
Housing prices:
Average estimated value of detached houses in 2021 (75.2% of all units):
| Wedgwood: | $905,686 |
| Seattle: | $906,138 |
Average estimated '21 value of housing units in 5-or-more-unit structures (10.9% of all units):
| Wedgwood: | $203,093 |
| Seattle: | $570,782 |
Most popular occupations of males: management occupations (except farmers) (15.2%); education, training, and library occupations (13.9%); computer and mathematical occupations (11.5%); sales and office occupations (9.7%); life, physical, and social science occupations (8.2%); business and financial operations occupations (7.8%); service occupations (7.8%)
Most popular occupations of females: education, training, and library occupations (17.5%); sales and office occupations (14.4%); healthcare practitioners and technical occupations (14.3%); management occupations (except farmers) (11.1%); service occupations (8.2%); business and financial operations occupations (7.4%); life, physical, and social science occupations (7.0%)
Roads and streets: NE 92nd St; NE 85th St; NE 94th St; NE 88th St; NE 80th St; NE 86th St; NE 87th St; NE 90th St; NE 91st St; NE 77th St; NE 89th St; NE 82nd St; NE 75th St; 35th Ave NE; 40th Ave NE; 30th Ave NE; 38th Ave NE; 45th Ave NE; 32nd Ave NE; 42nd Ave NE; 43rd Ave NE; 27th Ave NE; 36th Ave NE; 39th Ave NE; 41st Ave NE; 44th Ave NE; 37th Ave NE; 34th Ave NE; 31st Ave NE; NE 93rd St; NE 84th St; 28th Ave NE; 25th Ave NE; 23rd Ave NE; NE 81st St; Ravenna Ave NE; 33rd Ave NE; NE 83rd St; 26th Ave NE; NE 95th St; 29th Ave NE; 25th Pl NE; 44th Pl NE.
Wedgwood neighborhood detailed profile
West Queen Anne neighborhood in Seattle statistics: (Find on map)
Area: 0.640 square miles
Population: 11,471
Population density:
Median household income in 2021:
Median rent in in 2021:
Male vs Females
Median age
Housing prices:
Average estimated value of detached houses in 2021 (47.5% of all units):
Average estimated '21 value of housing units in 5-or-more-unit structures (13.8% of all units):
Most popular occupations of males: management occupations (except farmers) (21.5%); sales and office occupations (17.4%); business and financial operations occupations (14.5%); computer and mathematical occupations (13.4%); arts, design, entertainment, sports, and media occupations (5.3%); life, physical, and social science occupations (4.1%); service occupations (3.2%)
Most popular occupations of females: sales and office occupations (31.1%); management occupations (except farmers) (19.3%); service occupations (10.4%); business and financial operations occupations (9.2%); community and social services occupations (5.6%); healthcare practitioners and technical occupations (5.6%); arts, design, entertainment, sports, and media occupations (5.4%)
Roads and streets: 8th Ave W; W Blaine St; W Howe St; 9th Ave W; W Garfield St; W Crockett St; W Mc Graw St; 7th Ave W; 6th Ave W; 5th Ave W; 10th Ave W; Gilman Dr W; 14th Ave W; 12th Ave W; 11th Ave W; 13th Ave W; W Galer St; W Prospect St; W Lee St; 3rd Ave W; 4th Ave W; W Boston St; W Highland Dr; 2nd Ave W; 1st Ave W; Queen Anne Ave N; Olympic Way W; W Olympic Pl; W Wheeler St; W Comstock St; W Kinnear Pl; Willard Ave W; 8th Pl W; W Newton St; S Warsaw St; Van Buren Ave W.
West Queen Anne neighborhood detailed profile
Area: 0.640 square miles
Population: 11,471
Population density:
| West Queen Anne: | 17,925 people per square mile |
| Seattle: | 8,750 people per square mile |
Median household income in 2021:
| West Queen Anne: | $173,198 |
| Seattle: | $110,781 |
Median rent in in 2021:
| West Queen Anne: | $2,049 |
| Seattle: | $1,670 |
Male vs Females
| Males: | 5,296 |
| Females: | 6,175 |
Median age
| Males: | 40.4 years |
| Females: | 41.3 years |
Housing prices:
Average estimated value of detached houses in 2021 (47.5% of all units):
| West Queen Anne: | $2,543,814 |
| Seattle: | $906,138 |
Average estimated '21 value of housing units in 5-or-more-unit structures (13.8% of all units):
| West Queen Anne: | $1,059,887 |
| Seattle: | $570,782 |
Most popular occupations of males: management occupations (except farmers) (21.5%); sales and office occupations (17.4%); business and financial operations occupations (14.5%); computer and mathematical occupations (13.4%); arts, design, entertainment, sports, and media occupations (5.3%); life, physical, and social science occupations (4.1%); service occupations (3.2%)
Most popular occupations of females: sales and office occupations (31.1%); management occupations (except farmers) (19.3%); service occupations (10.4%); business and financial operations occupations (9.2%); community and social services occupations (5.6%); healthcare practitioners and technical occupations (5.6%); arts, design, entertainment, sports, and media occupations (5.4%)
Roads and streets: 8th Ave W; W Blaine St; W Howe St; 9th Ave W; W Garfield St; W Crockett St; W Mc Graw St; 7th Ave W; 6th Ave W; 5th Ave W; 10th Ave W; Gilman Dr W; 14th Ave W; 12th Ave W; 11th Ave W; 13th Ave W; W Galer St; W Prospect St; W Lee St; 3rd Ave W; 4th Ave W; W Boston St; W Highland Dr; 2nd Ave W; 1st Ave W; Queen Anne Ave N; Olympic Way W; W Olympic Pl; W Wheeler St; W Comstock St; W Kinnear Pl; Willard Ave W; 8th Pl W; W Newton St; S Warsaw St; Van Buren Ave W.
West Queen Anne neighborhood detailed profile
West Seattle neighborhood in Seattle statistics: (Find on map)
Area: 8.337 square miles
Population: 61,668
Population density:
Median household income in 2021:
Median rent in in 2021:
Male vs Females
Median age
Housing prices:
Average estimated value of detached houses in 2021 (64.7% of all units):
Average estimated value of townhouses or other attached units in 2021 (6.4% of all units):
Average estimated '21 value of housing units in 5-or-more-unit structures (7.9% of all units):
Most popular occupations of males: management occupations (except farmers) (24.0%); sales and office occupations (14.7%); computer and mathematical occupations (13.1%); business and financial operations occupations (10.3%); construction, extraction, and maintenance occupations (5.1%); service occupations (5.0%); architecture and engineering occupations (4.4%)
Most popular occupations of females: sales and office occupations (18.9%); management occupations (except farmers) (18.2%); business and financial operations occupations (11.4%); education, training, and library occupations (11.0%); service occupations (9.1%); healthcare practitioners and technical occupations (8.9%); computer and mathematical occupations (5.1%)
Limited-access highways (interstate or state) in this neighborhood: W Seattle Fwy.
Roads and streets: California Ave SW; 37th Ave SW; 35th Ave SW; 44th Ave SW; 47th Ave SW; Alki Ave SW; 39th Ave SW; 41st Ave SW; 45th Ave SW; Fauntleroy Way SW; 42nd Ave SW; 46th Ave SW; SW Admiral Way; 36th Ave SW; 38th Ave SW; Beach Dr SW; 40th Ave SW; 48th Ave SW; 49th Ave SW; Harbor Ave SW; SW Andover St; SW Charlestown St; SW Stevens St; SW Hinds St; 50th Ave SW; SW Genesee St; SW Dakota St; SW Hanford St; 51st Ave SW; SW Alaska St; SW Spokane St; SW Lander St; Marine View Dr SW; 34th Ave SW; SW Edmunds St; SW Oregon St; SW Hudson St; SW Othello St; SW Graham St; SW Juneau St; SW Raymond St; SW 100th St; SW Dawson St; SW Findlay St; SW 102nd St; SW Manning St; Belvidere Ave SW; 53rd Ave SW; SW 106th St; SW 104th St; 52nd Ave SW; SW Myrtle St; SW Brandon St; Walnut Ave SW; 30th Ave SW; 59th Ave SW; SW Austin St; 32nd Ave SW; SW 97th St; Sunset Ave SW; SW College St; SW 98th St; SW Henderson St; SW Rose St; 33rd Ave SW; SW Hill St; 31st Ave SW; SW 108th St; 56th Ave SW; Fairmount Ave SW; SW Thistle St; SW Avalon Way; SW Holly St; Seola Beach Dr SW; SW Kenyon St; 55th Ave SW; SW Southern St; SW Webster St; SW Barton St; 57th Ave SW; SW Walker St; SW Monroe St; SW Holden St; SW Trenton St; SW Morgan St; SW Ida St; SW Frontenac St; SW Orleans St; SW Cloverdale St; SW 107th St; SW Willow St; 54th Ave SW; SW Holgate St; SW Elmgrove St; SW Bradford St; 60th Ave SW; Arroyo Beach Pl SW; SW 110th St; Ferry Ave SW; Palm Ave SW; SW Roxbury St; Bonair Dr SW; Erskine Way SW; SW Massachusetts St; SW Orchard St; SW Donovan St; 61st Ave SW; SW Concord St; SW Waite St; SW 105th St; California Way SW; SW Olga St; SW Grayson St; SW Brace Point Dr; Hillcrest Ave SW; SW Portland St; SW Director St; 62nd Ave SW; SW Seattle St; 58th Ave SW; Arroyo Dr SW; SW Cambridge St; 63rd Ave SW; SW 109th St; Glenridge Way SW; Garlough Ave SW; SW Atlantic St; SW 99th St; Clamar Pl SW; Atlas Pl SW; SW Prince St; 64th Ave SW; Halleck Ave SW; SW Pritchard St; SW 112th St; Fauntleroy Pl SW; Glenn Way SW; Fauntlee Crst SW; Murray Ave SW; Schmitz Blvd; Tillicum Rd SW; SW Wildwood Pl; Lincoln Park Way SW; SW Jacobsen Rd; Aikins Ave SW; SW Sullivan St; SW Ocean View Dr; Hughes Ave SW; SW Snoqualmie St; Maplewood Pl SW; SW Fletcher St; 51st Pl SW; SW Fontanelle St; California Ln SW; SW Warsaw St; SW Winthrop St; Holly Pl SW; SW Eddy St; SW Mills St; Arch Ave SW; SW Forest St; Chilberg Ave SW; 52nd Pl SW; 43rd Pl SW; Gatewood Rd SW; Fauntleroy Ave SW; SW Wilton Ct; SW Tillman St; SW Campbell Pl; Prescott Ave SW; SW Bruce St; SW City View St; Beveridge Pl SW; SW 101st St; SW Canada Dr; SW Forney St; 65th Ave SW; Bonair Pl SW; Forest Ct SW; SW Kenyon Pl; Parshall Pl SW; Woodside Pl SW; SW Donald St; Marshall Ave SW; 37th Pl SW; Northrop Pl SW; Lewis Pl SW; Farwell Pl SW; Frater Ave SW; California Dr SW; Arroyo Ct SW; Victoria Ave SW; Wright Ave SW; Hobart Ave SW; Ledroit Ct SW; SW 114th St; SW Carroll St; Vashon View Pl SW; SW Teig Pl; Chilberg Pl SW; Marine View Dr; SW Harbor Ln; 66th Ave SW; SW Angeline St; 58th Pl SW; SW Beveridge Pl; SW Niesz Ct; Seaview Ter SW; SW Prescott Pl; SW Heinze Way; SW Maple Way; Boyd Pl SW; Wickstrom Pl SW; 47th Pl SW; SW Shore Pl; SW Marguerite Ct; Brook Ave SW; Heights Ave SW; SW Beach Dr Ter; Kilbourne Ct SW; SW Horton St; SW Hemlock Way; 56th Pl SW; SW Bernice Pl; 54th Pl SW; SW 111th St; SW Seola Ln; Rutan Pl SW; Vashon Vw SW; Holly Ct SW; SW 103rd St; 32nd Pl SW; Edgewood Ave SW; SW Englewood St; Vashon Pl SW; Gold Ct SW; Blake Pl SW; Marine Ave SW; Benton Pl SW; SW Ledroit Pl; SW 113th St; Marine View Pl SW; 30th Pl SW; Sumner Ave SW; SW Lander Pl; Sylvan Ln SW; 44th Pl SW; SW Roxbury Pl; SW 112th Pl; SW Douglas Pl; 57th Pl SW; Bainbridge Pl SW; Ocean Ct SW; SW Director Pl; SW Pelly Pl; Elm Pl SW; Lotus Ave SW; Point Pl SW; SW Maryland Pl; SW Stevens; Schmitz Ave SW; Horton St; SW California Pl; 34th Pl SW; Autumn Ln SW; SW Villa Pl; 35th Ave SE; Fauntlee Cres SW; Heights Pl SW; 64th Pl SW; 46th Pl SW; View Ln SW; Edgewood.
Railroad features: .
Other features: Ferry Dock; Seattle-Vashon-Southworth Ferry Crossing; Water Taxi Route.
West Seattle neighborhood detailed profile
Area: 8.337 square miles
Population: 61,668
Population density:
| West Seattle: | 7,397 people per square mile |
| Seattle: | 8,750 people per square mile |
Median household income in 2021:
| West Seattle: | $134,234 |
| Seattle: | $110,781 |
Median rent in in 2021:
| West Seattle: | $1,721 |
| Seattle: | $1,670 |
Male vs Females
| Males: | 30,011 |
| Females: | 31,657 |
Median age
| Males: | 43.3 years |
| Females: | 44.9 years |
Housing prices:
Average estimated value of detached houses in 2021 (64.7% of all units):
| West Seattle: | $765,425 |
| Seattle: | $906,138 |
Average estimated value of townhouses or other attached units in 2021 (6.4% of all units):
| This neighborhood: | $850,000 |
| city: | $615,733 |
Average estimated '21 value of housing units in 5-or-more-unit structures (7.9% of all units):
| West Seattle: | $560,458 |
| Seattle: | $570,782 |
Most popular occupations of males: management occupations (except farmers) (24.0%); sales and office occupations (14.7%); computer and mathematical occupations (13.1%); business and financial operations occupations (10.3%); construction, extraction, and maintenance occupations (5.1%); service occupations (5.0%); architecture and engineering occupations (4.4%)
Most popular occupations of females: sales and office occupations (18.9%); management occupations (except farmers) (18.2%); business and financial operations occupations (11.4%); education, training, and library occupations (11.0%); service occupations (9.1%); healthcare practitioners and technical occupations (8.9%); computer and mathematical occupations (5.1%)
Limited-access highways (interstate or state) in this neighborhood: W Seattle Fwy.
Roads and streets: California Ave SW; 37th Ave SW; 35th Ave SW; 44th Ave SW; 47th Ave SW; Alki Ave SW; 39th Ave SW; 41st Ave SW; 45th Ave SW; Fauntleroy Way SW; 42nd Ave SW; 46th Ave SW; SW Admiral Way; 36th Ave SW; 38th Ave SW; Beach Dr SW; 40th Ave SW; 48th Ave SW; 49th Ave SW; Harbor Ave SW; SW Andover St; SW Charlestown St; SW Stevens St; SW Hinds St; 50th Ave SW; SW Genesee St; SW Dakota St; SW Hanford St; 51st Ave SW; SW Alaska St; SW Spokane St; SW Lander St; Marine View Dr SW; 34th Ave SW; SW Edmunds St; SW Oregon St; SW Hudson St; SW Othello St; SW Graham St; SW Juneau St; SW Raymond St; SW 100th St; SW Dawson St; SW Findlay St; SW 102nd St; SW Manning St; Belvidere Ave SW; 53rd Ave SW; SW 106th St; SW 104th St; 52nd Ave SW; SW Myrtle St; SW Brandon St; Walnut Ave SW; 30th Ave SW; 59th Ave SW; SW Austin St; 32nd Ave SW; SW 97th St; Sunset Ave SW; SW College St; SW 98th St; SW Henderson St; SW Rose St; 33rd Ave SW; SW Hill St; 31st Ave SW; SW 108th St; 56th Ave SW; Fairmount Ave SW; SW Thistle St; SW Avalon Way; SW Holly St; Seola Beach Dr SW; SW Kenyon St; 55th Ave SW; SW Southern St; SW Webster St; SW Barton St; 57th Ave SW; SW Walker St; SW Monroe St; SW Holden St; SW Trenton St; SW Morgan St; SW Ida St; SW Frontenac St; SW Orleans St; SW Cloverdale St; SW 107th St; SW Willow St; 54th Ave SW; SW Holgate St; SW Elmgrove St; SW Bradford St; 60th Ave SW; Arroyo Beach Pl SW; SW 110th St; Ferry Ave SW; Palm Ave SW; SW Roxbury St; Bonair Dr SW; Erskine Way SW; SW Massachusetts St; SW Orchard St; SW Donovan St; 61st Ave SW; SW Concord St; SW Waite St; SW 105th St; California Way SW; SW Olga St; SW Grayson St; SW Brace Point Dr; Hillcrest Ave SW; SW Portland St; SW Director St; 62nd Ave SW; SW Seattle St; 58th Ave SW; Arroyo Dr SW; SW Cambridge St; 63rd Ave SW; SW 109th St; Glenridge Way SW; Garlough Ave SW; SW Atlantic St; SW 99th St; Clamar Pl SW; Atlas Pl SW; SW Prince St; 64th Ave SW; Halleck Ave SW; SW Pritchard St; SW 112th St; Fauntleroy Pl SW; Glenn Way SW; Fauntlee Crst SW; Murray Ave SW; Schmitz Blvd; Tillicum Rd SW; SW Wildwood Pl; Lincoln Park Way SW; SW Jacobsen Rd; Aikins Ave SW; SW Sullivan St; SW Ocean View Dr; Hughes Ave SW; SW Snoqualmie St; Maplewood Pl SW; SW Fletcher St; 51st Pl SW; SW Fontanelle St; California Ln SW; SW Warsaw St; SW Winthrop St; Holly Pl SW; SW Eddy St; SW Mills St; Arch Ave SW; SW Forest St; Chilberg Ave SW; 52nd Pl SW; 43rd Pl SW; Gatewood Rd SW; Fauntleroy Ave SW; SW Wilton Ct; SW Tillman St; SW Campbell Pl; Prescott Ave SW; SW Bruce St; SW City View St; Beveridge Pl SW; SW 101st St; SW Canada Dr; SW Forney St; 65th Ave SW; Bonair Pl SW; Forest Ct SW; SW Kenyon Pl; Parshall Pl SW; Woodside Pl SW; SW Donald St; Marshall Ave SW; 37th Pl SW; Northrop Pl SW; Lewis Pl SW; Farwell Pl SW; Frater Ave SW; California Dr SW; Arroyo Ct SW; Victoria Ave SW; Wright Ave SW; Hobart Ave SW; Ledroit Ct SW; SW 114th St; SW Carroll St; Vashon View Pl SW; SW Teig Pl; Chilberg Pl SW; Marine View Dr; SW Harbor Ln; 66th Ave SW; SW Angeline St; 58th Pl SW; SW Beveridge Pl; SW Niesz Ct; Seaview Ter SW; SW Prescott Pl; SW Heinze Way; SW Maple Way; Boyd Pl SW; Wickstrom Pl SW; 47th Pl SW; SW Shore Pl; SW Marguerite Ct; Brook Ave SW; Heights Ave SW; SW Beach Dr Ter; Kilbourne Ct SW; SW Horton St; SW Hemlock Way; 56th Pl SW; SW Bernice Pl; 54th Pl SW; SW 111th St; SW Seola Ln; Rutan Pl SW; Vashon Vw SW; Holly Ct SW; SW 103rd St; 32nd Pl SW; Edgewood Ave SW; SW Englewood St; Vashon Pl SW; Gold Ct SW; Blake Pl SW; Marine Ave SW; Benton Pl SW; SW Ledroit Pl; SW 113th St; Marine View Pl SW; 30th Pl SW; Sumner Ave SW; SW Lander Pl; Sylvan Ln SW; 44th Pl SW; SW Roxbury Pl; SW 112th Pl; SW Douglas Pl; 57th Pl SW; Bainbridge Pl SW; Ocean Ct SW; SW Director Pl; SW Pelly Pl; Elm Pl SW; Lotus Ave SW; Point Pl SW; SW Maryland Pl; SW Stevens; Schmitz Ave SW; Horton St; SW California Pl; 34th Pl SW; Autumn Ln SW; SW Villa Pl; 35th Ave SE; Fauntlee Cres SW; Heights Pl SW; 64th Pl SW; 46th Pl SW; View Ln SW; Edgewood.
Railroad features: .
Other features: Ferry Dock; Seattle-Vashon-Southworth Ferry Crossing; Water Taxi Route.
West Seattle neighborhood detailed profile
West Woodland neighborhood in Seattle statistics: (Find on map)
Area: 0.839 square miles
Population: 9,389
Population density:
Median household income in 2021:
Median rent in in 2021:
Male vs Females
Median age
Housing prices:
Average estimated value of detached houses in 2021 (61.4% of all units):
Average estimated value of townhouses or other attached units in 2021 (13.0% of all units):
Most popular occupations of males: management occupations (except farmers) (15.4%); computer and mathematical occupations (14.5%); service occupations (14.3%); arts, design, entertainment, sports, and media occupations (12.3%); sales and office occupations (11.0%); business and financial operations occupations (9.2%); production occupations (6.2%)
Most popular occupations of females: management occupations (except farmers) (36.2%); sales and office occupations (12.4%); business and financial operations occupations (9.3%); healthcare practitioners and technical occupations (9.1%); life, physical, and social science occupations (7.6%); education, training, and library occupations (5.2%); service occupations (5.0%)
Roads and streets: 14th Ave NW; 8th Ave NW; 9th Ave NW; 11th Ave NW; NW Market St; NW 46th St; NW 60th St; NW 52nd St; NW 58th St; NW 51st St; NW 50th St; NW 62nd St; NW 56th St; NW 54th St; 3rd Ave NW; 6th Ave NW; NW 53rd St; NW 49th St; NW 48th St; NW 47th St; NW 64th St; NW 63rd St; NW 61st St; NW 59th St; NW 57th St; NW 45th St; Burke Gilman Trl; 7th Ave NW; 4th Ave NW; Leary Way NW; NW Ballard Way; NW Leary Way; 5th Ave NW; NW 43rd St; NW 42nd St; NW Fern Pl; NW 55th St; NW 55th Pl; NW Bright St; NW 41st St.
Railroad features: Ballard Terminal RR.
West Woodland neighborhood detailed profile
Area: 0.839 square miles
Population: 9,389
Population density:
| West Woodland: | 11,186 people per square mile |
| Seattle: | 8,750 people per square mile |
Median household income in 2021:
| West Woodland: | $139,971 |
| Seattle: | $110,781 |
Median rent in in 2021:
| West Woodland: | $1,695 |
| Seattle: | $1,670 |
Male vs Females
| Males: | 4,606 |
| Females: | 4,783 |
Median age
| Males: | 36.4 years |
| Females: | 37.4 years |
Housing prices:
Average estimated value of detached houses in 2021 (61.4% of all units):
| West Woodland: | $932,972 |
| Seattle: | $906,138 |
Average estimated value of townhouses or other attached units in 2021 (13.0% of all units):
| This neighborhood: | $807,046 |
| city: | $615,733 |
Most popular occupations of males: management occupations (except farmers) (15.4%); computer and mathematical occupations (14.5%); service occupations (14.3%); arts, design, entertainment, sports, and media occupations (12.3%); sales and office occupations (11.0%); business and financial operations occupations (9.2%); production occupations (6.2%)
Most popular occupations of females: management occupations (except farmers) (36.2%); sales and office occupations (12.4%); business and financial operations occupations (9.3%); healthcare practitioners and technical occupations (9.1%); life, physical, and social science occupations (7.6%); education, training, and library occupations (5.2%); service occupations (5.0%)
Roads and streets: 14th Ave NW; 8th Ave NW; 9th Ave NW; 11th Ave NW; NW Market St; NW 46th St; NW 60th St; NW 52nd St; NW 58th St; NW 51st St; NW 50th St; NW 62nd St; NW 56th St; NW 54th St; 3rd Ave NW; 6th Ave NW; NW 53rd St; NW 49th St; NW 48th St; NW 47th St; NW 64th St; NW 63rd St; NW 61st St; NW 59th St; NW 57th St; NW 45th St; Burke Gilman Trl; 7th Ave NW; 4th Ave NW; Leary Way NW; NW Ballard Way; NW Leary Way; 5th Ave NW; NW 43rd St; NW 42nd St; NW Fern Pl; NW 55th St; NW 55th Pl; NW Bright St; NW 41st St.
Railroad features: Ballard Terminal RR.
West Woodland neighborhood detailed profile
Westlake neighborhood in Seattle statistics: (Find on map)
Area: 0.150 square miles
Population: 1,635
Population density:
Median household income in 2021:
Median rent in in 2021:
Male vs Females
Median age
Most popular occupations of males: sales and office occupations (27.7%); service occupations (18.4%); computer and mathematical occupations (16.3%); business and financial operations occupations (11.1%); management occupations (except farmers) (9.5%); arts, design, entertainment, sports, and media occupations (3.5%); education, training, and library occupations (3.3%)
Most popular occupations of females: sales and office occupations (31.3%); service occupations (20.0%); business and financial operations occupations (18.1%); management occupations (except farmers) (12.3%); transportation occupations (5.8%); computer and mathematical occupations (5.0%); arts, design, entertainment, sports, and media occupations (4.3%)
Highways in this neighborhood: Aurora Ave N (State Rte 99).
Roads and streets: Westlake Ave N; Dexter Ave N; 8th Ave N; Newton St; Highland Dr; Garfield St; Hayes St; Prospect St; Howe St; Lee St; Galer St; Comstock St; Dexter Ct N.
Westlake neighborhood detailed profile
Area: 0.150 square miles
Population: 1,635
Population density:
| Westlake: | 10,931 people per square mile |
| Seattle: | 8,750 people per square mile |
Median household income in 2021:
| Westlake: | $100,294 |
| Seattle: | $110,781 |
Median rent in in 2021:
| Westlake: | $1,799 |
| Seattle: | $1,670 |
Male vs Females
| Males: | 808 |
| Females: | 826 |
Median age
| Males: | 29.5 years |
| Females: | 30.9 years |
Most popular occupations of males: sales and office occupations (27.7%); service occupations (18.4%); computer and mathematical occupations (16.3%); business and financial operations occupations (11.1%); management occupations (except farmers) (9.5%); arts, design, entertainment, sports, and media occupations (3.5%); education, training, and library occupations (3.3%)
Most popular occupations of females: sales and office occupations (31.3%); service occupations (20.0%); business and financial operations occupations (18.1%); management occupations (except farmers) (12.3%); transportation occupations (5.8%); computer and mathematical occupations (5.0%); arts, design, entertainment, sports, and media occupations (4.3%)
Highways in this neighborhood: Aurora Ave N (State Rte 99).
Roads and streets: Westlake Ave N; Dexter Ave N; 8th Ave N; Newton St; Highland Dr; Garfield St; Hayes St; Prospect St; Howe St; Lee St; Galer St; Comstock St; Dexter Ct N.
Westlake neighborhood detailed profile
Whittier Heights neighborhood in Seattle statistics: (Find on map)
Area: 0.508 square miles
Population: 8,932
Population density:
Median household income in 2021:
Median rent in in 2021:
Male vs Females
Median age
Housing prices:
Average estimated value of detached houses in 2021 (74.0% of all units):
Average estimated value of townhouses or other attached units in 2021 (2.5% of all units):
Average estimated '21 value of housing units in 5-or-more-unit structures (36.1% of all units):
Most popular occupations of males: management occupations (except farmers) (19.9%); computer and mathematical occupations (17.9%); sales and office occupations (14.4%); construction, extraction, and maintenance occupations (9.4%); arts, design, entertainment, sports, and media occupations (8.7%); service occupations (7.9%); healthcare practitioners and technical occupations (5.6%)
Most popular occupations of females: sales and office occupations (19.8%); service occupations (18.6%); management occupations (except farmers) (16.5%); business and financial operations occupations (15.7%); healthcare practitioners and technical occupations (8.3%); education, training, and library occupations (6.6%); arts, design, entertainment, sports, and media occupations (4.4%)
Roads and streets: 8th Ave NW; Dibble Ave NW; 9th Ave NW; 11th Ave NW; 10th Ave NW; 12th Ave NW; 13th Ave NW; 14th Ave NW; Mary Ave NW; NW 67th St; NW 70th St; NW 75th St; NW 73rd St; NW 83rd St; NW 80th St; NW 77th St; NW 65th St; Alonzo Ave NW; Division Ave NW.
Whittier Heights neighborhood detailed profile
Area: 0.508 square miles
Population: 8,932
Population density:
| Whittier Heights: | 17,587 people per square mile |
| Seattle: | 8,750 people per square mile |
Median household income in 2021:
| Whittier Heights: | $118,973 |
| Seattle: | $110,781 |
Median rent in in 2021:
| Whittier Heights: | $1,922 |
| Seattle: | $1,670 |
Male vs Females
| Males: | 4,581 |
| Females: | 4,351 |
Median age
| Males: | 36.4 years |
| Females: | 40.8 years |
Housing prices:
Average estimated value of detached houses in 2021 (74.0% of all units):
| Whittier Heights: | $771,596 |
| Seattle: | $906,138 |
Average estimated value of townhouses or other attached units in 2021 (2.5% of all units):
| This neighborhood: | $685,395 |
| city: | $615,733 |
Average estimated '21 value of housing units in 5-or-more-unit structures (36.1% of all units):
| Whittier Heights: | $380,000 |
| Seattle: | $570,782 |
Most popular occupations of males: management occupations (except farmers) (19.9%); computer and mathematical occupations (17.9%); sales and office occupations (14.4%); construction, extraction, and maintenance occupations (9.4%); arts, design, entertainment, sports, and media occupations (8.7%); service occupations (7.9%); healthcare practitioners and technical occupations (5.6%)
Most popular occupations of females: sales and office occupations (19.8%); service occupations (18.6%); management occupations (except farmers) (16.5%); business and financial operations occupations (15.7%); healthcare practitioners and technical occupations (8.3%); education, training, and library occupations (6.6%); arts, design, entertainment, sports, and media occupations (4.4%)
Roads and streets: 8th Ave NW; Dibble Ave NW; 9th Ave NW; 11th Ave NW; 10th Ave NW; 12th Ave NW; 13th Ave NW; 14th Ave NW; Mary Ave NW; NW 67th St; NW 70th St; NW 75th St; NW 73rd St; NW 83rd St; NW 80th St; NW 77th St; NW 65th St; Alonzo Ave NW; Division Ave NW.
Whittier Heights neighborhood detailed profile
Windermere neighborhood in Seattle statistics: (Find on map)
Area: 1.003 square miles
Population: 3,447
Population density:
Median household income in 2021:
Median rent in in 2021:
Male vs Females
Median age
Average estimated value of detached houses in 2021 (80.6% of all units):
Most popular occupations of males: management occupations (except farmers) (22.0%); sales and office occupations (18.4%); transportation occupations (10.1%); healthcare practitioners and technical occupations (9.6%); computer and mathematical occupations (9.3%); business and financial operations occupations (7.0%); education, training, and library occupations (6.7%)
Most popular occupations of females: service occupations (19.5%); healthcare practitioners and technical occupations (15.3%); education, training, and library occupations (14.6%); business and financial operations occupations (12.9%); sales and office occupations (7.8%); life, physical, and social science occupations (6.7%); management occupations (except farmers) (4.7%)
Highways in this neighborhood: Sand Point Way NE (State Rte 513).
Roads and streets: NE Windermere Rd; NE 60th St; NE 61st St; NE 65th St; 60th Ave NE; NE Keswick Dr; NE Radford Dr; Ann Arbor Ave NE; NE 57th St; Princeton Ave NE; NE 55th St; Pullman Ave NE; 57th Ave NE; Purdue Ave NE; 55th Ave NE; 65th Ave NE; NE 62nd St; 52nd Ave NE; NE Ambleside Rd; 53rd Ave NE; NE 63rd St; Stanford Ave NE; 50th Ave NE; Wellesley Way NE; NE 58th St; Vassar Ave NE; 64th Ave NE; NE 59th St; NE Penrith Rd; NE Kelden Pl; 63rd Ave NE; 59th Ave NE; NE Princeton Way; NE 50th St; Coniston Rd NE; 54th Ave NE; NE 64th St; NE 56th St; 61st Ave NE; 58th Ave NE; 56th Ave NE; Elleray Ln NE; University Cir NE; Park Point Dr NE; NE 41st St; Park Point Way NE.
Windermere neighborhood detailed profile
Area: 1.003 square miles
Population: 3,447
Population density:
| Windermere: | 3,435 people per square mile |
| Seattle: | 8,750 people per square mile |
Median household income in 2021:
| Windermere: | $149,323 |
| Seattle: | $110,781 |
Median rent in in 2021:
| Windermere: | $2,445 |
| Seattle: | $1,670 |
Male vs Females
| Males: | 1,694 |
| Females: | 1,752 |
Median age
| Males: | 41.8 years |
| Females: | 39.8 years |
Average estimated value of detached houses in 2021 (80.6% of all units):
| Windermere: | $1,120,536 |
| Seattle: | $906,138 |
Most popular occupations of males: management occupations (except farmers) (22.0%); sales and office occupations (18.4%); transportation occupations (10.1%); healthcare practitioners and technical occupations (9.6%); computer and mathematical occupations (9.3%); business and financial operations occupations (7.0%); education, training, and library occupations (6.7%)
Most popular occupations of females: service occupations (19.5%); healthcare practitioners and technical occupations (15.3%); education, training, and library occupations (14.6%); business and financial operations occupations (12.9%); sales and office occupations (7.8%); life, physical, and social science occupations (6.7%); management occupations (except farmers) (4.7%)
Highways in this neighborhood: Sand Point Way NE (State Rte 513).
Roads and streets: NE Windermere Rd; NE 60th St; NE 61st St; NE 65th St; 60th Ave NE; NE Keswick Dr; NE Radford Dr; Ann Arbor Ave NE; NE 57th St; Princeton Ave NE; NE 55th St; Pullman Ave NE; 57th Ave NE; Purdue Ave NE; 55th Ave NE; 65th Ave NE; NE 62nd St; 52nd Ave NE; NE Ambleside Rd; 53rd Ave NE; NE 63rd St; Stanford Ave NE; 50th Ave NE; Wellesley Way NE; NE 58th St; Vassar Ave NE; 64th Ave NE; NE 59th St; NE Penrith Rd; NE Kelden Pl; 63rd Ave NE; 59th Ave NE; NE Princeton Way; NE 50th St; Coniston Rd NE; 54th Ave NE; NE 64th St; NE 56th St; 61st Ave NE; 58th Ave NE; 56th Ave NE; Elleray Ln NE; University Cir NE; Park Point Dr NE; NE 41st St; Park Point Way NE.
Windermere neighborhood detailed profile
Woodland Park neighborhood in Seattle statistics: (Find on map)
Area: 0.862 square miles
Population: 1,994
Population density:
Median household income in 2021:
Median rent in in 2021:
Male vs Females
Median age
Most popular occupations of males: management occupations (except farmers) (16.2%); education, training, and library occupations (13.9%); computer and mathematical occupations (12.7%); sales and office occupations (12.5%); service occupations (8.9%); arts, design, entertainment, sports, and media occupations (5.6%); architecture and engineering occupations (4.1%)
Most popular occupations of females: sales and office occupations (19.0%); management occupations (except farmers) (13.1%); service occupations (11.9%); healthcare practitioners and technical occupations (10.6%); arts, design, entertainment, sports, and media occupations (9.8%); computer and mathematical occupations (8.8%); business and financial operations occupations (8.7%)
Roads and streets: E Green Lake Way N; W Green Lake Way N; E Green Lake Dr N; Green Lake Way N; N 50th St; N 63rd St.
Woodland Park neighborhood detailed profile
Area: 0.862 square miles
Population: 1,994
Population density:
| Woodland Park: | 2,314 people per square mile |
| Seattle: | 8,750 people per square mile |
Median household income in 2021:
| Woodland Park: | $158,997 |
| Seattle: | $110,781 |
Median rent in in 2021:
| Woodland Park: | $1,777 |
| Seattle: | $1,670 |
Male vs Females
| Males: | 986 |
| Females: | 1,008 |
Median age
| Males: | 39.3 years |
| Females: | 38.3 years |
Most popular occupations of males: management occupations (except farmers) (16.2%); education, training, and library occupations (13.9%); computer and mathematical occupations (12.7%); sales and office occupations (12.5%); service occupations (8.9%); arts, design, entertainment, sports, and media occupations (5.6%); architecture and engineering occupations (4.1%)
Most popular occupations of females: sales and office occupations (19.0%); management occupations (except farmers) (13.1%); service occupations (11.9%); healthcare practitioners and technical occupations (10.6%); arts, design, entertainment, sports, and media occupations (9.8%); computer and mathematical occupations (8.8%); business and financial operations occupations (8.7%)
Roads and streets: E Green Lake Way N; W Green Lake Way N; E Green Lake Dr N; Green Lake Way N; N 50th St; N 63rd St.
Woodland Park neighborhood detailed profile
Yesler Terrace neighborhood in Seattle statistics: (Find on map)
Area: 0.203 square miles
Population: 3,888
Population density:
Median household income in 2021:
Median rent in in 2021:
Male vs Females
Median age
Average estimated '21 value of housing units in 5-or-more-unit structures (60.1% of all units):
Most popular occupations of males: computer and mathematical occupations (22.7%); service occupations (15.9%); sales and office occupations (10.7%); business and financial operations occupations (10.5%); architecture and engineering occupations (9.9%); management occupations (except farmers) (6.9%); production occupations (5.4%)
Most popular occupations of females: sales and office occupations (29.4%); service occupations (22.9%); management occupations (except farmers) (9.5%); computer and mathematical occupations (6.0%); production occupations (5.9%); business and financial operations occupations (5.0%); education, training, and library occupations (5.0%)
Limited-access highways (interstate or state) in this neighborhood: I- 5.
Roads and streets: James St; Boren Ave; 11th Ave; Broadway Ave; Jefferson St; Terry Ave; 12th Ave; 10th Ave; E Jefferson St; E Terrace St; E Yesler Way; S Main St; Alder St; 9th Ave; E Alder St; Yesler Way; E Fir St; E Spruce St; 8th Ave; S Washington St; 12th Ave S; Terrace St; 7th Ave; Spruce St; E James St (E James Way); Boren Ave S; Minor Ave; 10th Ave S; 8th Ave S.
Yesler Terrace neighborhood detailed profile
Area: 0.203 square miles
Population: 3,888
Population density:
| Yesler Terrace: | 19,130 people per square mile |
| Seattle: | 8,750 people per square mile |
Median household income in 2021:
| Yesler Terrace: | $55,688 |
| Seattle: | $110,781 |
Median rent in in 2021:
| Yesler Terrace: | $1,011 |
| Seattle: | $1,670 |
Male vs Females
| Males: | 2,407 |
| Females: | 1,480 |
Median age
| Males: | 33.3 years |
| Females: | 42.0 years |
Average estimated '21 value of housing units in 5-or-more-unit structures (60.1% of all units):
| Yesler Terrace: | $137,831 |
| Seattle: | $570,782 |
Most popular occupations of males: computer and mathematical occupations (22.7%); service occupations (15.9%); sales and office occupations (10.7%); business and financial operations occupations (10.5%); architecture and engineering occupations (9.9%); management occupations (except farmers) (6.9%); production occupations (5.4%)
Most popular occupations of females: sales and office occupations (29.4%); service occupations (22.9%); management occupations (except farmers) (9.5%); computer and mathematical occupations (6.0%); production occupations (5.9%); business and financial operations occupations (5.0%); education, training, and library occupations (5.0%)
Limited-access highways (interstate or state) in this neighborhood: I- 5.
Roads and streets: James St; Boren Ave; 11th Ave; Broadway Ave; Jefferson St; Terry Ave; 12th Ave; 10th Ave; E Jefferson St; E Terrace St; E Yesler Way; S Main St; Alder St; 9th Ave; E Alder St; Yesler Way; E Fir St; E Spruce St; 8th Ave; S Washington St; 12th Ave S; Terrace St; 7th Ave; Spruce St; E James St (E James Way); Boren Ave S; Minor Ave; 10th Ave S; 8th Ave S.
Yesler Terrace neighborhood detailed profile