Mann neighborhood in Seattle, Washington (WA), 98112, 98122 detailed profile
Settings
X

Business Search - 14 Million verified businesses
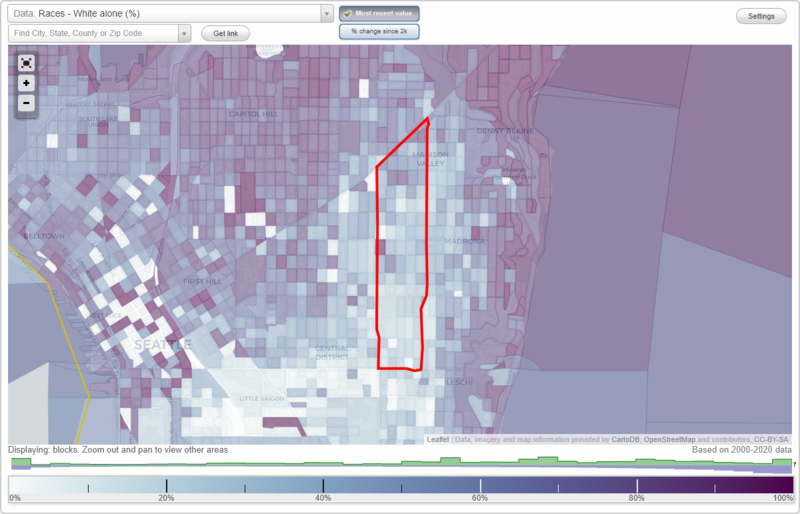
Area: 0.391 square miles
Population: 6,705
Population density:
| Mann: | 17,158 people per square mile |
| Seattle: | 8,933 people per square mile |

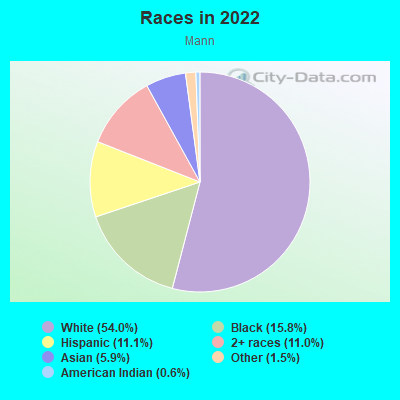
- 3,89254.0%White
- 1,13615.8%Black
- 79811.1%Hispanic or Latino
- 79611.0%Two or more races
- 4275.9%Asian
- 1091.5%Some other race
- 460.6%American Indian
Median household income in 2022:
| Mann: | $133,028 |
| Seattle: | $115,409 |
Distribution of median household income
![Distribution of median household income]()
- 173Less than $10,000
- 314$10,000 to $19,999
- 254$20,000 to $29,999
- 481$30,000 to $39,999
- 482$40,000 to $49,999
- 227$50,000 to $59,999
- 271$60,000 to $74,999
- 452$75,000 to $99,999
- 314$100,000 to $124,999
- 184$125,000 to $149,999
- 603$150,000 to $199,999
- 717$200,000 or more

Distribution of owner-occupied house/condo value
![Distribution of owner-occupied house/condo value]()
- 6Less than $50,000
- 4$50,000 to $99,999
- 161$100,000 to $149,999
- 8$200,000 to $249,999
- 6$250,000 to $299,999
- 222$300,000 to $399,999
- 100$400,000 to $499,999
- 181$500,000 to $749,999
- 590$750,000 to $999,999
- 597$1,000,000 or more

Distribution of rent paid by renters
![Distribution of rent paid by renters]()
- 76Less than $100
- 8$200 to $299
- 260$300 to $399
- 58$700 to $799
- 105$800 to $899
- 211$900 to $999
- 627$1,000 to $1,249
- 313$1,250 to $1,499
- 376$1,500 to $1,999
- 690$2,000 or more

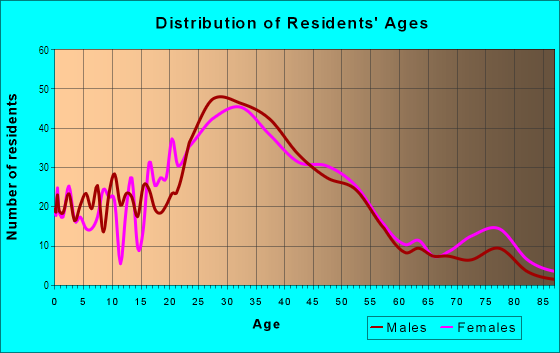
| Males: | 3,310 |
| Females: | 3,395 |
Males:
| This neighborhood: | 35.5 years |
| Whole city: | 35.7 years |
| This neighborhood: | 33.2 years |
| Whole city: | 36.2 years |
Average household size:
| Mann: | 2.4 people |
| Seattle: | 2.0 people |
Percentage of family households:
| Mann: | 35.9% |
| Seattle: | 30.9% |
| Here: | 24.6% |
| Seattle: | 33.2% |
Percentage of married-couple families with children (among all households):
| Mann: | 20.5% |
| Seattle: | 36.5% |
Percentage of single-mother households (among all households):
| Mann: | 13.2% |
| Seattle: | 9.3% |
Percentage of never married males 15 years old and over:
Percentage of never married females 15 years old and over:
| Mann: | 28.8% |
| Seattle: | 24.9% |
Percentage of never married females 15 years old and over:
| Mann: | 30.0% |
| city: | 22.3% |
Percentage of people that speak English not well or not at all:
| Mann: | 1.0% |
| Seattle: | 3.2% |
Percentage of people born in this state:
Percentage of people born in another U.S. state:
Percentage of native residents but born outside the U.S.:
Percentage of foreign born residents:
| Here: | 39.6% |
| Seattle: | 34.6% |
Percentage of people born in another U.S. state:
| Mann: | 43.1% |
| Seattle: | 42.9% |
Percentage of native residents but born outside the U.S.:
| Here: | 3.8% |
| city: | 2.2% |
Percentage of foreign born residents:
| Here: | 13.5% |
| Seattle: | 20.3% |
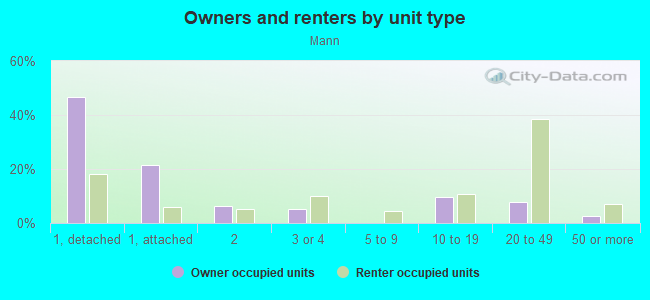
Owner-occupied
Renter-occupied

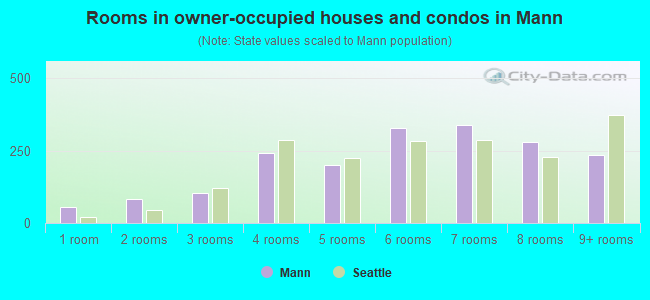
- Rooms in owner-occupied houses and condos in Mann
- 551 room
- 822 rooms
- 1033 rooms
- 2434 rooms
- 2025 rooms
- 3296 rooms
- 3397 rooms
- 2798 rooms
- 2359+ rooms
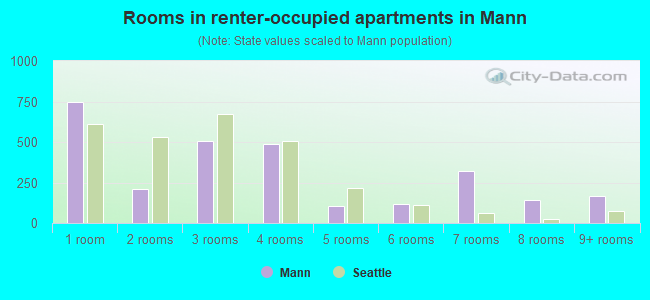
- Rooms in renter-occupied apartments in Mann
- 7481 room
- 2102 rooms
- 5093 rooms
- 4884 rooms
- 1085 rooms
- 1176 rooms
- 3197 rooms
- 1408 rooms
- 1689+ rooms
Owner-occupied
Renter-occupied
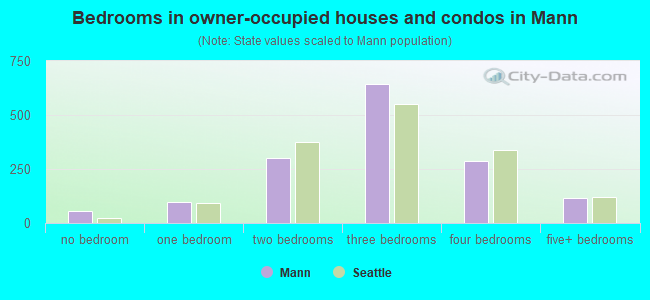
- Bedrooms in owner-occupied houses and condos in Mann
- 55no bedroom
- 971 bedroom
- 3022 bedrooms
- 6453 bedrooms
- 2894 bedrooms
- 1155+ bedrooms
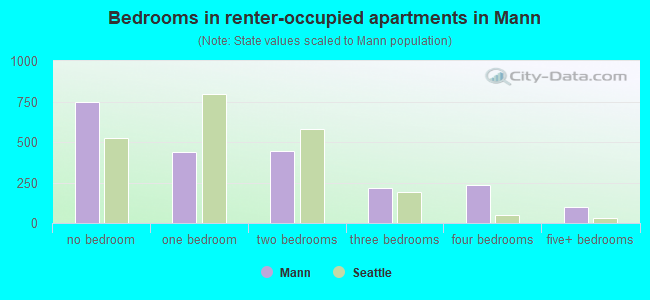
- Bedrooms in renter-occupied apartments in Mann
- 748no bedroom
- 4391 bedroom
- 4422 bedrooms
- 2183 bedrooms
- 2354 bedrooms
- 975+ bedrooms
Average number of cars or other vehicles available in houses/condos:
Average number of cars or other vehicles available in apartments:
| This neighborhood: | 1.6 |
| Seattle: | 1.7 |
Average number of cars or other vehicles available in apartments:
| Here: | 1.2 |
| city: | 0.9 |
Percentage of units with a mortgage:
| Mann: | 85.3% |
| Seattle: | 70.4% |
Average estimated value of detached houses in 2022 (37.6% of all units):
| Mann: | $1,103,851 |
| Seattle: | $1,274,185 |
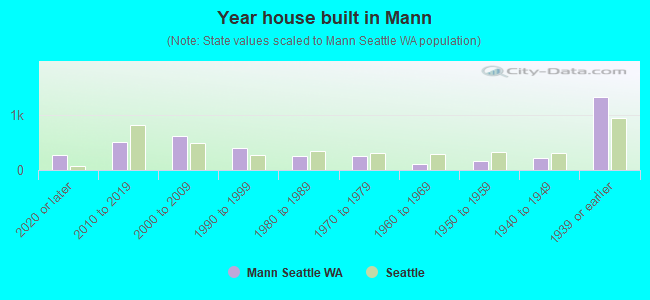
- Year house built in Mann
- 2792020 or later
- 5002010 to 2019
- 6212000 to 2009
- 3941990 to 1999
- 2471980 to 1989
- 2621970 to 1979
- 1171960 to 1969
- 1701950 to 1959
- 2091940 to 1949
- 1,3151939 or earlier
City-data.com crime index for city in 2020 (higher means more crime):
| City: | 440.8 |
| U.S. average: | 219.5 |
Travel time to work (commute)
![Travel time to work (commute)]()
- 36Less than 5 minutes
- 745 to 9 minutes
- 20410 to 14 minutes
- 36115 to 19 minutes
- 51220 to 24 minutes
- 27525 to 29 minutes
- 51930 to 34 minutes
- 7735 to 39 minutes
- 17740 to 44 minutes
- 35545 to 59 minutes
- 12360 to 89 minutes
- 5490 or more minutes

Means of transportation to work
![Means of transportation to work]()
- 31.7%1,403Drove a car alone
- 3.9%171Carpooled
- 26.1%1,157Bus
- 2.3%104Subway or elevated rail
- 3.0%131Taxi
- 0.6%25Motorcycle
- 3.5%154Bicycle
- 7.0%308Walked
- 2.3%104Other means
- 27.4%1,212Worked at home

Time leaving home to go to work
![Time leaving home to go to work]()
- 6512:00 a.m. to 4:59 a.m.
- 65:00 a.m. to 5:29 a.m.
- 825:30 a.m. to 5:59 a.m.
- 926:00 a.m. to 6:29 a.m.
- 2126:30 a.m. to 6:59 a.m.
- 3977:00 a.m. to 7:29 a.m.
- 3377:30 a.m. to 7:59 a.m.
- 5358:00 a.m. to 8:29 a.m.
- 3028:30 a.m. to 8:59 a.m.
- 1549:00 a.m. to 9:59 a.m.
- 13210:00 a.m. to 10:59 a.m.
- 5611:00 a.m. to 11:59 a.m.
- 17112:00 p.m. to 3:59 p.m.
- 1944:00 p.m. to 11:59 p.m.

Occupations of males:
- Percentage of males in management occupations (except farmers):
Here: 22.8% city: 16.0%
- Percentage of males in business and financial operations occupations:
Here: 9.1% city: 7.6%
- Percentage of males in computer and mathematical occupations:
Here: 12.0% city: 18.5%
- Percentage of males in architecture and engineering occupations:
Here: 1.9% city: 5.6%
- Percentage of males in life, physical, and social science occupations:
Here: 1.9% city: 2.5%
- Percentage of males in community and social services occupations:
Here: 1.9% city: 1.1%
- Percentage of males in legal occupations:
Here: 1.6% city: 2.0%
- Percentage of males in education, training, and library occupations:
Here: 4.8% city: 4.1%
- Percentage of males in arts, design, entertainment, sports, and media occupations:
Here: 6.6% city: 3.8%
- Percentage of males in healthcare practitioners and technical occupations:
Here: 4.2% city: 3.6%
- Percentage of males in service occupations:
Here: 5.6% city: 10.5%
- Percentage of males in sales and office occupations:
Here: 14.8% city: 12.0%
- Percentage of males in construction, extraction, and maintenance occupations:
Here: 3.7% city: 3.2%
- Percentage of males in material moving occupations:
Here: 4.5% city: 1.9%
Occupations of females:
- Percentage of females in management occupations (except farmers):
Here: 13.7% city: 14.2%
- Percentage of females in business and financial operations occupations:
Here: 7.0% city: 9.8%
- Percentage of females in computer and mathematical occupations:
Here: 11.2% city: 6.6%
- Percentage of females in architecture and engineering occupations:
Here: 2.9% city: 2.1%
- Percentage of females in life, physical, and social science occupations:
Here: 4.2% city: 3.0%
- Percentage of females in community and social services occupations:
Here: 3.7% city: 3.2%
- Percentage of females in education, training, and library occupations:
Here: 18.4% city: 8.7%
- Percentage of females in arts, design, entertainment, sports, and media occupations:
Here: 5.5% city: 5.0%
- Percentage of females in healthcare practitioners and technical occupations:
Here: 5.3% city: 9.6%
- Percentage of females in service occupations:
Here: 15.7% city: 13.7%
- Percentage of females in sales and office occupations:
Here: 10.1% city: 17.7%
- Percentage of females in transportation occupations:
Here: 1.4% city: 0.8%
Percentage of people 16-64 in Armed Forces:
| Mann: | 0.0% |
| Seattle: | 0.2% |
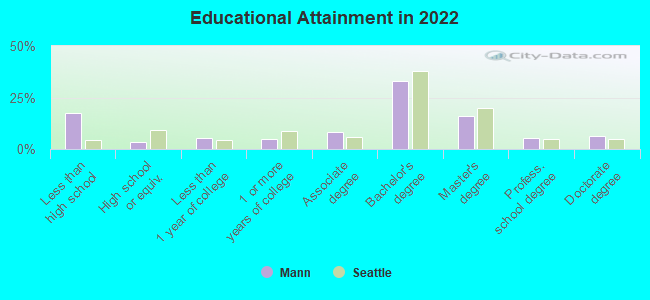
Education in this neighborhood (subdivision or community):
- Percentage of people 3 years and older in K-12 schools:
Mann: 26.7% Seattle: 9.8%
- Percentage of people 3 years and older in undergraduate colleges:
Mann: 18.7% Seattle: 6.3%
- Percentage of people 3 years and older in grad. or professional schools:
Mann: 4.3% Seattle: 3.0%
- Percentage of students K-12 enrolled in private schools:
Mann: 74.9% Seattle: 17.3%
Percentage of population below poverty level:
| Mann: | 11.8% |
| Seattle: | 10.1% |
Median year owner moved in (as recorded in 2022):
Median year renter moved in (as recorded in 2022):
| Mann: | 2010 |
| Seattle: | 2013 |
Median year renter moved in (as recorded in 2022):
| Mann: | 2017 |
| Seattle: | 2021 |
Percentage of married-couple families with both working:
| Mann: | 91.7% |
| Seattle: | 74.4% |
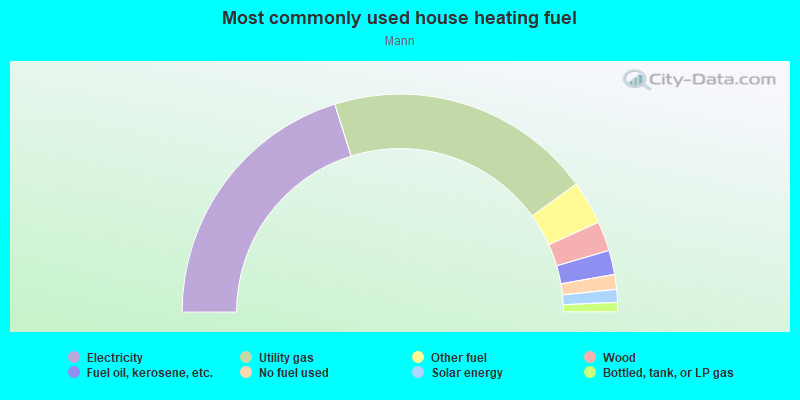
- 40.4%Electricity
- 39.7%Utility gas
- 6.5%Other fuel
- 4.4%Wood
- 3.6%Fuel oil, kerosene, etc.
- 2.2%No fuel used
- 1.9%Solar energy
- 1.4%Bottled, tank, or LP gas
Roads and streets:
Martin Luther King Way S
Length: 1.33 miles
Directions: N-S, SE-NW
Address range: 100 to 1899
Directions: N-S, SE-NW
Address range: 100 to 1899
27th Ave
Length: 1.19 miles
Direction: N-S
Address range: 100 to 1899
Direction: N-S
Address range: 100 to 1899
26th Ave
Length: 1.13 miles
Directions: E-W, N-S, SW-NE
Address range: 151 to 1899
Directions: E-W, N-S, SW-NE
Address range: 151 to 1899
25th Ave
Length: 1.12 miles
Direction: N-S
Address range: 151 to 1899
Direction: N-S
Address range: 151 to 1899
24th Ave
Length: 0.87 miles
Directions: E-W, N-S, SW-NE
Address range: 150 to 1899
Directions: E-W, N-S, SW-NE
Address range: 150 to 1899
E Howell St
Length: 0.36 miles
Direction: E-W
Address range: 2300 to 2799
Direction: E-W
Address range: 2300 to 2799
E Olive St
Length: 0.36 miles
Direction: E-W
Address range: 2400 to 2799
Direction: E-W
Address range: 2400 to 2799
E Marion St
Length: 0.36 miles
Direction: E-W
Address range: 2400 to 2799
Direction: E-W
Address range: 2400 to 2799
E Pine St
Length: 0.36 miles
Direction: E-W
Address range: 2400 to 2799
Direction: E-W
Address range: 2400 to 2799
E Cherry St
Length: 0.36 miles
Direction: E-W
Address range: 2400 to 2798
Direction: E-W
Address range: 2400 to 2798
E Pike St
Length: 0.36 miles
Direction: E-W
Address range: 2400 to 2799
Direction: E-W
Address range: 2400 to 2799
E Union St
Length: 0.36 miles
Direction: E-W
Address range: 2400 to 2799
Direction: E-W
Address range: 2400 to 2799
E Columbia St
Length: 0.36 miles
Direction: E-W
Address range: 2400 to 2799
Direction: E-W
Address range: 2400 to 2799
E Spring St
Length: 0.36 miles
Direction: E-W
Address range: 2400 to 2799
Direction: E-W
Address range: 2400 to 2799
E Denny Way
Length: 0.35 miles
Direction: E-W
Address range: 2400 to 2799
Direction: E-W
Address range: 2400 to 2799
E Fir St
Length: 0.30 miles
Direction: E-W
Address range: 2400 to 2799
Direction: E-W
Address range: 2400 to 2799
E Alder St
Length: 0.30 miles
Direction: E-W
Address range: 2400 to 2749
Direction: E-W
Address range: 2400 to 2749
E John St
Length: 0.26 miles
Direction: E-W
Address range: 2500 to 2799
Direction: E-W
Address range: 2500 to 2799
27th Ave E
Length: 0.24 miles
Directions: N-S, SW-NE
Address range: 100 to 349
Directions: N-S, SW-NE
Address range: 100 to 349
E Jefferson St
Length: 0.22 miles
Direction: E-W
Address range: 2500 to 2750
Direction: E-W
Address range: 2500 to 2750
26th Ave E
Length: 0.17 miles
Directions: N-S, SW-NE
Address range: 100 to 299
Directions: N-S, SW-NE
Address range: 100 to 299
E Thomas St
Length: 0.17 miles
Directions: E-W, SW-NE
Address range: 2601 to 2799
Directions: E-W, SW-NE
Address range: 2601 to 2799
Temple Pl
Length: 0.11 miles
Direction: N-S
Address range: 500 to 699
Direction: N-S
Address range: 500 to 699
25th Ave E
Length: 0.09 miles
Direction: N-S
Address range: 100 to 199
Direction: N-S
Address range: 100 to 199
E Spruce St
Length: 0.08 miles
Direction: E-W
Address range: 2400 to 2499
Direction: E-W
Address range: 2400 to 2499
E Yesler Way
Length: 0.08 miles
Direction: E-W
Address range: 2700 to 2750
Direction: E-W
Address range: 2700 to 2750
E Arthur Pl
Length: 0.07 miles
Direction: SW-NE
Address range: 2700 to 2799
Direction: SW-NE
Address range: 2700 to 2799
E Harrison St
Length: 0.04 miles
Direction: E-W
Address range: 2700 to 2799
Direction: E-W
Address range: 2700 to 2799