Estimated zip code population in 2022: 32,951 Zip code population in 2010: 26,881 Zip code population in 2000: 24,913
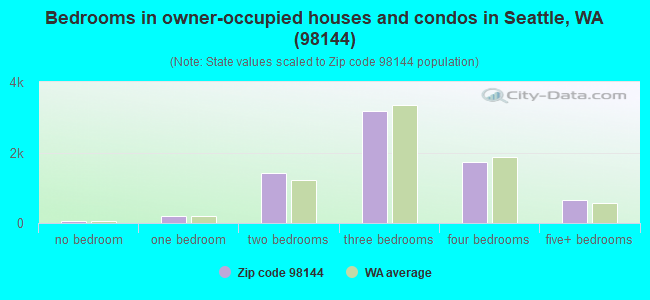
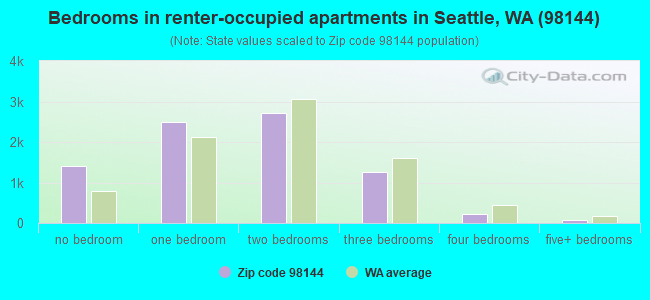
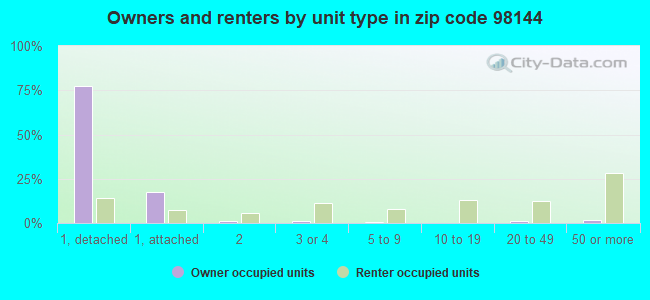
Houses and condos: 16,080 Renter-occupied apartments: 8,098
% of renters here:
53%
State:
36%
March 2022 cost of living index in zip code 98144: 117.1 (more than average, U.S. average is 100)
Land area: 3.4 sq. mi. Water area: 1.8 sq. mi.
Population density: 9,678 people per square mile
(high).
OSM Map
General Map
Google Map
MSN Map
OSM Map
General Map
Google Map
MSN Map
OSM Map
General Map
Google Map
MSN Map
OSM Map
General Map
Google Map
MSN Map
Please wait while loading the map...
Real estate property taxes paid for housing units in 2022:
This zip code:
0.6% ($6,506)
Washington:
0.8% ($4,283)
Median real estate property taxes paid for housing units with mortgages in 2022: $6,592 (0.6%) Median real estate property taxes paid for housing units with no mortgage in 2022: $6,362 (0.7%)
Averages for the 2020 tax year for zip code 98144, filed in 2021:
Average Adjusted Gross Income (AGI) in 2020: $123,804 (Individual Income Tax Returns)
Here:
$123,804
State:
$99,264
Salary/wage: $103,301 (reported on 86.8% of returns)
Here:
$103,301
State:
$80,347
(% of AGI for various income ranges: 1120.7% for AGIs below $25k, 3739.0% for AGIs $25k-50k, 6994.9% for AGIs $50k-75k, 10716.3% for AGIs $75k-100k, 20975.4% for AGIs $100k-200k, 113623.2% for AGIs over 200k)
Taxable interest for individuals: $1,903 (reported on 40.5% of returns)
This zip code:
$1,903
Washington:
$2,077
(% of AGI for various income ranges: 20.0% for AGIs below $25k, 17.2% for AGIs $25k-50k, 27.8% for AGIs $50k-75k, 52.7% for AGIs $75k-100k, 110.8% for AGIs $100k-200k, 1316.8% for AGIs over 200k)
Ordinary dividends: $9,564 (reported on 32.2% of returns)
Here:
$9,564
State:
$10,013
(% of AGI for various income ranges: 37.3% for AGIs below $25k, 45.9% for AGIs $25k-50k, 82.4% for AGIs $50k-75k, 164.2% for AGIs $75k-100k, 535.6% for AGIs $100k-200k, 5448.6% for AGIs over 200k)
Net capital gain/loss in AGI: +$45,552 (reported on 30.4% of returns)
Here:
+$45,552
State:
+$40,092
(% of AGI for various income ranges: 23.0% for AGIs below $25k, 51.5% for AGIs $25k-50k, 133.8% for AGIs $50k-75k, 192.9% for AGIs $75k-100k, 865.5% for AGIs $100k-200k, 30850.0% for AGIs over 200k)
Profit/loss from business: +$23,527 (reported on 16.2% of returns)
Here:
+$23,527
State:
+$18,312
(% of AGI for various income ranges: 170.3% for AGIs below $25k, 155.4% for AGIs $25k-50k, 253.1% for AGIs $50k-75k, 395.8% for AGIs $75k-100k, 857.8% for AGIs $100k-200k, 4710.7% for AGIs over 200k)
Taxable individual retirement arrangement distribution: $26,880 (reported on 6.3% of returns)
98144:
$26,880
Washington:
$24,221
(% of AGI for various income ranges: 36.3% for AGIs below $25k, 52.3% for AGIs $25k-50k, 111.4% for AGIs $50k-75k, 197.2% for AGIs $75k-100k, 457.2% for AGIs $100k-200k, 2115.4% for AGIs over 200k)
Self-employed (Keogh) retirement plans: $24,184 (reported on 1.4% of returns)
98144:
$24,184
Washington:
$24,166
(% of AGI for various income ranges: 23.2% for AGIs $50k-75k, 75.9% for AGIs $100k-200k, 608.2% for AGIs over 200k)
Total itemized deductions: $37,185 (reported on 17.1% of returns)
Here:
$37,185
State:
$39,068
(% of AGI for various income ranges: 77.7% for AGIs below $25k, 129.3% for AGIs $25k-50k, 264.0% for AGIs $50k-75k, 601.3% for AGIs $75k-100k, 1384.3% for AGIs $100k-200k, 9723.7% for AGIs over 200k)
Charity contributions: $11,653 (reported on 13.1% of returns)
Here:
$11,653
State:
$15,331
(% of AGI for various income ranges: 4.8% for AGIs below $25k, 12.8% for AGIs $25k-50k, 26.2% for AGIs $50k-75k, 72.9% for AGIs $75k-100k, 179.6% for AGIs $100k-200k, 3041.1% for AGIs over 200k)
Taxes paid: $8,354 (reported on 16.8% of returns)
98144:
$8,354
State:
$7,774
(% of AGI for various income ranges: 16.8% for AGIs below $25k, 33.5% for AGIs $25k-50k, 66.6% for AGIs $50k-75k, 164.2% for AGIs $75k-100k, 381.6% for AGIs $100k-200k, 1875.2% for AGIs over 200k)
Earned income credit: $1,621 (reported on 8.0% of returns)
Here:
$1,621
State:
$2,020
(% of AGI for various income ranges: 59.8% for AGIs below $25k, 26.1% for AGIs $25k-50k)
Percentage of individuals using paid preparers for their 2020 taxes: 93.4%
Here:
93%
State:
93%
(% for various income ranges: 90.1% for AGIs below $25k, 93.1% for AGIs $25k-50k, 93.5% for AGIs $50k-75k, 93.5% for AGIs $75k-100k, 94.8% for AGIs $100k-200k, 96.4% for AGIs over 200k)
Averages for the 2012 tax year for zip code 98144, filed in 2013:
Average Adjusted Gross Income (AGI) in 2012: $78,347 (Individual Income Tax Returns)
Here:
$78,347
State:
$69,533
Salary/wage: $62,305 (reported on 86.3% of returns)
Here:
$62,305
State:
$57,267
(% of AGI for various income ranges: 78.1% for AGIs below $25k, 86.4% for AGIs $25k-50k, 83.1% for AGIs $50k-75k, 82.9% for AGIs $75k-100k, 81.5% for AGIs $100k-200k, 49.7% for AGIs over 200k)
Taxable interest for individuals: $1,913 (reported on 39.3% of returns)
This zip code:
$1,913
Washington:
$1,816
(% of AGI for various income ranges: 0.8% for AGIs below $25k, 0.4% for AGIs $25k-50k, 0.5% for AGIs $50k-75k, 0.5% for AGIs $75k-100k, 0.5% for AGIs $100k-200k, 1.6% for AGIs over 200k)
Ordinary dividends: $9,004 (reported on 24.8% of returns)
Here:
$9,004
State:
$8,163
(% of AGI for various income ranges: 4.0% for AGIs below $25k, 1.5% for AGIs $25k-50k, 1.6% for AGIs $50k-75k, 1.7% for AGIs $75k-100k, 2.1% for AGIs $100k-200k, 4.0% for AGIs over 200k)
Net capital gain/loss in AGI: +$27,721 (reported on 20.1% of returns)
Here:
+$27,721
State:
+$21,568
(% of AGI for various income ranges: 0.2% for AGIs below $25k, 0.7% for AGIs $25k-50k, 1.0% for AGIs $50k-75k, 1.1% for AGIs $75k-100k, 2.1% for AGIs $100k-200k, 15.0% for AGIs over 200k)
Profit/loss from business: +$19,327 (reported on 15.8% of returns)
Here:
+$19,327
State:
+$16,521
(% of AGI for various income ranges: 8.4% for AGIs below $25k, 4.0% for AGIs $25k-50k, 3.7% for AGIs $50k-75k, 4.4% for AGIs $75k-100k, 3.8% for AGIs $100k-200k, 3.3% for AGIs over 200k)
Taxable individual retirement arrangement distribution: $20,742 (reported on 6.5% of returns)
98144:
$20,742
Washington:
$18,648
(% of AGI for various income ranges: 1.8% for AGIs below $25k, 1.1% for AGIs $25k-50k, 1.5% for AGIs $50k-75k, 1.7% for AGIs $75k-100k, 1.7% for AGIs $100k-200k, 1.9% for AGIs over 200k)
Self-employment retirement plans: $19,885 (reported on 1.4% of returns)
98144:
$19,885
Washington:
$20,087
(% of AGI for various income ranges: 0.2% for AGIs $25k-50k, 0.2% for AGIs $50k-75k, 0.3% for AGIs $100k-200k, 0.6% for AGIs over 200k)
Total itemized deductions: $25,205 (14% of AGI, reported on 30.6% of returns)
Here:
$25,205
State:
$23,872
Here:
14.5% of AGI
State:
18.2% of AGI
(% of AGI for various income ranges: 8.2% for AGIs below $25k, 7.1% for AGIs $25k-50k, 11.2% for AGIs $50k-75k, 14.2% for AGIs $75k-100k, 13.3% for AGIs $100k-200k, 8.0% for AGIs over 200k)
Charity contributions: $3,948 (reported on 25.2% of returns)
Here:
$3,948
State:
$4,465
(% of AGI for various income ranges: 0.5% for AGIs below $25k, 0.6% for AGIs $25k-50k, 1.0% for AGIs $50k-75k, 1.4% for AGIs $75k-100k, 1.5% for AGIs $100k-200k, 1.5% for AGIs over 200k)
Taxes paid: $7,092 (reported on 30.1% of returns)
98144:
$7,092
State:
$6,400
(% of AGI for various income ranges: 1.7% for AGIs below $25k, 1.7% for AGIs $25k-50k, 2.8% for AGIs $50k-75k, 3.7% for AGIs $75k-100k, 3.7% for AGIs $100k-200k, 2.4% for AGIs over 200k)
Earned income credit: $1,761 (reported on 13.8% of returns)
Here:
$1,761
State:
$2,073
(% of AGI for various income ranges: 4.2% for AGIs below $25k, 0.6% for AGIs $25k-50k)
Percentage of individuals using paid preparers for their 2012 taxes: 40.1%
Here:
40%
State:
43%
(% for various income ranges: 36.5% for AGIs below $25k, 36.3% for AGIs $25k-50k, 39.1% for AGIs $50k-75k, 41.4% for AGIs $75k-100k, 44.6% for AGIs $100k-200k, 70.6% for AGIs over 200k)
Averages for the 2004 tax year for zip code 98144, filed in 2005:
Average Adjusted Gross Income (AGI) in 2004: $56,329 (Individual Income Tax Returns)
Here:
$56,329
State:
$54,331
Salary/wage: $47,050 (reported on 84.9% of returns)
Here:
$47,050
State:
$45,761
(% of AGI for various income ranges: 404.1% for AGIs below $10k, 80.1% for AGIs $10k-25k, 86.7% for AGIs $25k-50k, 84.1% for AGIs $50k-75k, 79.0% for AGIs $75k-100k, 56.8% for AGIs over 100k)
Taxable interest for individuals: $1,998 (reported on 47.0% of returns)
This zip code:
$1,998
Washington:
$2,110
(% of AGI for various income ranges: 33.2% for AGIs below $10k, 1.8% for AGIs $10k-25k, 1.1% for AGIs $25k-50k, 0.9% for AGIs $50k-75k, 1.4% for AGIs $75k-100k, 1.9% for AGIs over 100k)
Taxable dividends: $8,070 (reported on 28.9% of returns)
Here:
$8,070
State:
$5,879
(% of AGI for various income ranges: 29.3% for AGIs below $10k, 1.9% for AGIs $10k-25k, 1.3% for AGIs $25k-50k, 1.8% for AGIs $50k-75k, 3.0% for AGIs $75k-100k, 6.1% for AGIs over 100k)
Net capital gain/loss: +$13,665 (reported on 24.0% of returns)
Here:
+$13,665
State:
+$15,835
(% of AGI for various income ranges: 40.2% for AGIs below $10k, 0.4% for AGIs $10k-25k, 0.3% for AGIs $25k-50k, 1.0% for AGIs $50k-75k, 1.7% for AGIs $75k-100k, 10.4% for AGIs over 100k)
Profit/loss from business: +$17,591 (reported on 14.8% of returns)
Here:
+$17,591
State:
+$13,994
(% of AGI for various income ranges: 28.0% for AGIs below $10k, 6.3% for AGIs $10k-25k, 3.4% for AGIs $25k-50k, 4.0% for AGIs $50k-75k, 5.2% for AGIs $75k-100k, 4.7% for AGIs over 100k)
IRA payment deduction: $2,920 (reported on 2.9% of returns)
98144:
$2,920
Washington:
$3,001
(% of AGI for various income ranges: 1.7% for AGIs below $10k, 0.4% for AGIs $10k-25k, 0.3% for AGIs $25k-50k, 0.2% for AGIs $50k-75k, 0.2% for AGIs $75k-100k, 0.0% for AGIs over 100k)
Self-employed pension: $15,876 (reported on 1.9% of returns)
Here:
$15,876
Washington:
$14,244
(% of AGI for various income ranges: 0.2% for AGIs $10k-25k, 0.2% for AGIs $25k-50k, 0.3% for AGIs $50k-75k, 0.4% for AGIs $75k-100k, 0.8% for AGIs over 100k)
Total itemized deductions: $22,038 (20% of AGI, reported on 33.0% of returns)
Here:
$22,038
State:
$19,669
Here:
19.6% of AGI
State:
20.7% of AGI
(% of AGI for various income ranges: 64.4% for AGIs below $10k, 9.0% for AGIs $10k-25k, 11.6% for AGIs $25k-50k, 16.3% for AGIs $50k-75k, 17.5% for AGIs $75k-100k, 11.8% for AGIs over 100k)
Charity contributions deductions: $4,167 (3% of AGI, reported on 28.2% of returns)
Here:
$4,167
State:
$3,569
Here:
3.4% of AGI
State:
3.5% of AGI
(% of AGI for various income ranges: 2.7% for AGIs below $10k, 0.9% for AGIs $10k-25k, 1.1% for AGIs $25k-50k, 1.7% for AGIs $50k-75k, 2.1% for AGIs $75k-100k, 2.7% for AGIs over 100k)
Total tax: $11,454 (reported on 77.0% of returns)
98144:
$11,454
State:
$9,065
(% of AGI for various income ranges: 13.9% for AGIs below $10k, 4.6% for AGIs $10k-25k, 8.0% for AGIs $25k-50k, 11.0% for AGIs $50k-75k, 12.3% for AGIs $75k-100k, 21.8% for AGIs over 100k)
Earned income credit: $1,455 (reported on 14.3% of returns)
Here:
$1,455
State:
$1,607
Percentage of individuals using paid preparers for their 2004 taxes: 51.2%
Here:
51%
State:
49%
(% for various income ranges: 50.2% for AGIs below $10k, 55.1% for AGIs $10k-25k, 46.6% for AGIs $25k-50k, 46.0% for AGIs $50k-75k, 49.5% for AGIs $75k-100k, 63.4% for AGIs over 100k)
Likely homosexual households (counted as self-reported same-sex unmarried-partner households)
Lesbian couples: 0.7% of all households
Gay men: 1.1% of all households
Household received Food Stamps/SNAP in the past 12 months: 1,893 Household did not receive Food Stamps/SNAP in the past 12 months: 13,475
Women who had a birth in the past 12 months: 205 (163 now married, 42 unmarried) Women who did not have a birth in the past 12 months: 7,780 (3,132 now married, 4,658 unmarried)
Housing units in zip code 98144 with a mortgage: 4,878 (757 second mortgage, 18 home equity loan, 667 both second mortgage and home equity loan) Houses without a mortgage: 56
Median monthly owner costs for units with a mortgage: $3,079 Median monthly owner costs for units without a mortgage: $925
Residents with income below the poverty level in 2022:
This zip code:
9.6%
Whole state:
10.0%
Residents with income below 50% of the poverty level in 2022:
This zip code:
4.5%
Whole state:
4.6%
Median number of rooms in houses and condos:
Here:
6.2
State:
6.5
Median number of rooms in apartments:
Here:
3.2
State:
3.9
Notable locations in this zip code not listed on our city pages
Notable locations in zip code 98144: Leschi South Moorage (A), Seattle Fire Department Station 6 Central District (B), Recovery Centers of King County Detoxification and Inpatient Facility (C), Washington Center for Comprehensive Rehabilitation (D), Cannon House Assisted Living Facility (E), Seattle Fire Department Station 30 Rainier Valley and Coleman Park (F), Beacon Hill Branch Seattle City Public Library (G). Display/hide their locations on the map
Churches in zip code 98144 include: Saint Marys Church (A), Beacon Hill First Baptist Church (B), Saint Matthew Missionary Baptist Church (C), Our Lady of Mount Virgin Church (D), Saint Peters Catholic Church (E), Saint Peters Episcopal Church (F), Saint Clements Episcopal Church (G), Seattle Buddhist Church (H), Beacon Lutheran Church (I). Display/hide their locations on the map
Parks in zip code 98144 include: Colman Park (1), Frink Park (2), Sayres Memorial Park (3), Mount Baker Park (4), Judkins Park (5), Sicks Stadium (6), Doctor Jose Rizal Park (7), Lake Washington Boulevard Park (8), Leschi Park (9). Display/hide their locations on the map
3,330 married couples with children.
1,001 single-parent households (450 men, 551 women).
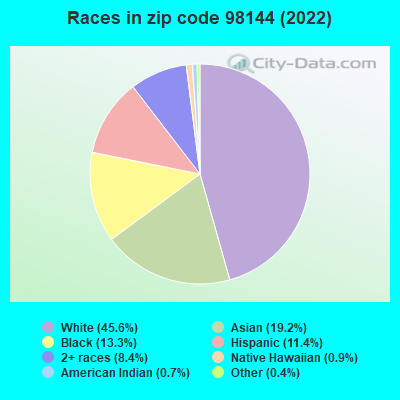
69.5% of residents of 98144 zip code speak English at home.
9.2% of residents speak Spanish at home (43% very well, 13% well, 24% not well, 21% not at all).
2.9% of residents speak other Indo-European language at home (91% very well, 7% well, 2% not well).
14.7% of residents speak Asian or Pacific Island language at home (50% very well, 17% well, 21% not well, 11% not at all).
4.1% of residents speak other language at home (76% very well, 8% well, 11% not well, 5% not at all).
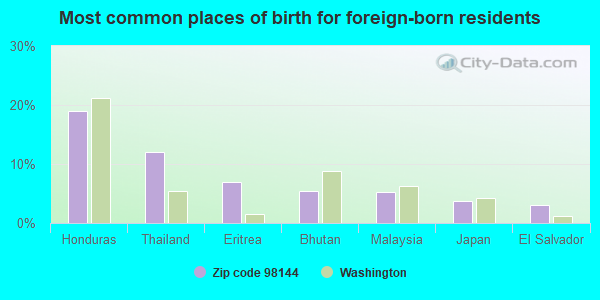
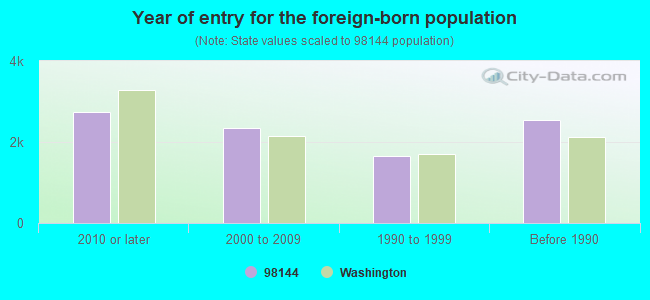
Foreign born population: 8,389 (25.5%) (59.8% of them are naturalized citizens)
Major facilities with environmental interests located in this zip code:
COLORGRAPHICS INC (1421 S DEAN ST in SEATTLE, WA)
AIR SYNTHETIC MINOR (AIRS/AFS) National Pollutant Discharge Elimination System NON-MAJOR (Tracking pollutant discharge elimination systems) - permit HAZARDOUS WASTE BIENNIAL REPORTER (Resource Conservation and Recovery Act (tracking hazardous waste)) (Resource Conservation and Recovery Act (tracking hazardous waste)) STATE MASTER (Washington State Department of Ecology's Facility/Site identification system) - HAZWASTE-WAD988487898, CESQG, WATQUAL-SO3003679, NPDES STORMWATER PERMIT, HAZWASTE-WAD988487898, HAZARDOUS WASTE PROGRAM, Business SIC classification: DAIRY FARMS; COMMERCIAL PRINTING, LITHOGRAPHIC; COMMERCIAL PRINTING Organizations: DAVID CARNS (CONTACT/OPERATOR)
, MADISON GRAHAM COLOR GRAPHICS INC (CONTACT/OWNER)
Alternative names: GROSSBERG TYLER LITHOGRAPHERS
AMERICAN BUILDING MAINTENANCE (1711 S JACKSON ST in SEATTLE, WA)
(Resource Conservation and Recovery Act (tracking hazardous waste)) STATE MASTER (Washington State Department of Ecology's Facility/Site identification system) - HAZWASTE-WAH000010983, HAZARDOUS WASTE PROGRAM Business SIC classification: BUILDING CLEANING AND MAINTENANCE SERVICES
CENTRAL PUGET SOUND REGIONAL TRANSIT AUT (2701 15TH AVE S in SEATTLE, WA)
HAZARDOUS WASTE BIENNIAL REPORTER (Resource Conservation and Recovery Act (tracking hazardous waste)) Large Quantity Generators, more that 1000 kg of hazardous waste/month (Resource Conservation and Recovery Act (tracking hazardous waste)) STATE MASTER (Washington State Department of Ecology's Facility/Site identification system) - TOXICS-NW1049, VOLUNTARY CLEAN UP PROGRAM, HAZWASTE-WAD092285592, HAZARDOUS WASTE PROGRAM, TOXICS-, GROUND WATER PROGRAM Business SIC classification: CROP PLANTING, CULTIVATING, AND PROTECTING; LOCAL AND SUBURBAN TRANSIT Business NAICS classification: MIXED MODE TRANSIT SYSTEMS.; MIXED MODE TRANSIT SYSTEMS. Organizations: DELITE BAKERY (CONTACT/OPERATOR)
Alternative names: KWIK CLEANERS INC, KWIK CLEANERS FORMER
BP OIL MARTIN LUTHER KING (2801 M L KING JR WAY S in SEATTLE, WA)
(Resource Conservation and Recovery Act (tracking hazardous waste)) STATE MASTER (Washington State Department of Ecology's Facility/Site identification system) - TOXICS-3145, UNDERGROUND STORAGE TANK PROGRAM Business SIC classification: GASOLINE SERVICE STATIONS; GENERAL AUTOMOTIVE REPAIR SHOPS; AUTOMOTIVE REPAIR SHOPS; AUTOMOTIVE SERVICES, EXCEPT REPAIR AND CARWASHES Organizations: ARTHUR HARRIS (CONTACT/OPERATOR)
BUDD & CO INC (800 RAINIER AVE S in SEATTLE, WA)
(Resource Conservation and Recovery Act (tracking hazardous waste)) STATE MASTER (Washington State Department of Ecology's Facility/Site identification system) - TOXICS-3211, UNDERGROUND STORAGE TANK PROGRAM, HAZWASTE-WAD988483491, HAZARDOUS WASTE PROGRAM Business SIC classification: GENERAL AUTOMOTIVE REPAIR SHOPS Business NAICS classification: GENERAL AUTOMOTIVE REPAIR.; GENERAL AUTOMOTIVE REPAIR. Organizations: DON GOEBEL (CONTACT/OPERATOR)
CITY VIEW ASSOCIATES LLC (2901 S JACKSON ST in SEATTLE, WA)
(Resource Conservation and Recovery Act (tracking hazardous waste)) STATE MASTER (Washington State Department of Ecology's Facility/Site identification system) - TOXICS-582294, LEAKING STORAGE TANK, TOXICS-, UNDERGROUND STORAGE TANK PROGRAM, VOLUNTARY CLEAN UP PROGRAM Business SIC classification: GENERAL AUTOMOTIVE REPAIR SHOPS Business NAICS classification: GENERAL AUTOMOTIVE REPAIR.
3A INDUSTRIES INC (3101 ML KING JR WAY S in SEATTLE, WA)
(Resource Conservation and Recovery Act (tracking hazardous waste)) STATE MASTER (Washington State Department of Ecology's Facility/Site identification system) - TOXICS-NW1310, VOLUNTARY CLEAN UP PROGRAM Business SIC classification: GENERAL CONTRACTORS-NONRESIDENTIAL BUILDINGS, OTHER THAN INDUSTRIAL BUILDINGS AND WAREHOUSES
ART PROCESS INC (501 12TH AVE S in SEATTLE, WA)
Small Quantity Generators, between 100 kg and 1000 kg of hazardous waste/month (Resource Conservation and Recovery Act (tracking hazardous waste)) STATE MASTER (Washington State Department of Ecology's Facility/Site identification system) - HAZWASTE-WAD046690442, SQG Business SIC classification: SIGNS AND ADVERTISING SPECIALTIES Organizations: BRIAN HATA (CONTACT/OPERATOR)
CHEVRON USA INC 90333 (2802 RAINIER AVE S in SEATTLE, WA)
Small Quantity Generators, between 100 kg and 1000 kg of hazardous waste/month (Resource Conservation and Recovery Act (tracking hazardous waste)) STATE MASTER (Washington State Department of Ecology's Facility/Site identification system) - TOXICS-5051, LEAKING STORAGE TANK, UNDERGROUND STORAGE TANK PROGRAM, HAZWASTE-WA0000015701, EPCRA, HAZARDOUS WASTE PROGRAM, TOXICS-NW1451, VOLUNTARY CLEAN UP PROGRAM Business SIC classification: GASOLINE SERVICE STATIONS Organizations: CHEVRON PRODUCTS (CONTACT/OPERATOR)
, CHEVRON INC (CONTACT/OWNER)
Alternative names: CHEVRON SS 90333
ARCTIC ICE CREAM NOVELTIES (1901 23RD AVENUE SOUTH in SEATTLE, WA)
TRI REPORTER (Tracking of toxic chemicals releasing facilities) STATE MASTER (Washington State Department of Ecology's Facility/Site identification system) - HAZWASTE-CRK000001380, EPCRA, WATQUAL-SO3000088, NPDES STORMWATER PERMIT Business SIC classification: ICE CREAM AND FROZEN DESSERTS Alternative names: ARTIC ICE CREAM NOVELTIES
BETHEL CHRISTIAN CHURCH (200 24TH AVE S in SEATTLE, WA)
(Integrated Compliance Information System) - ICIS-10-1999-0168, FORMAL ENFORCEMENT ACTION Business SIC classification: ELEMENTARY AND SECONDARY SCHOOLS
AMERICAN RED CROSS SEATTLE (1900 25TH AVE S in SEATTLE, WA)
(Resource Conservation and Recovery Act (tracking hazardous waste)) Business NAICS classification: ALL OTHER PUBLISHERS.
AMTECH LIGHTING SERVICES (1617 S JACKSON ST in SEATTLE, WA)
(Resource Conservation and Recovery Act (tracking hazardous waste)) Organizations: CHUAN TA INVESTMENTS INC (CONTACT/OWNER)
Housing units lacking complete kitchen facilities: 0.7%
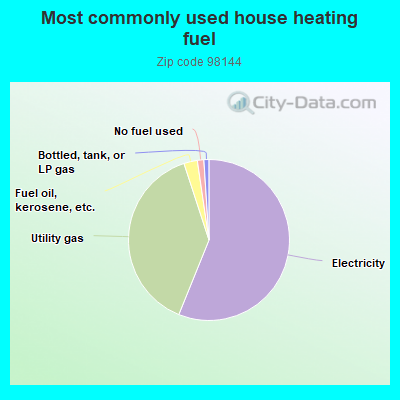
55.9%Electricity
38.7%Utility gas
2.7%Fuel oil, kerosene, etc.
1.3%No fuel used
1.0%Bottled, tank, or LP gas
Population in 1990: 23,333. Population change in the 1990s: +1,580 (+6.8%).
Place of birth for U.S.-born residents:
This state: 11,006
Northeast: 2,152
Midwest: 2,409
South: 3,526
West: 4,570
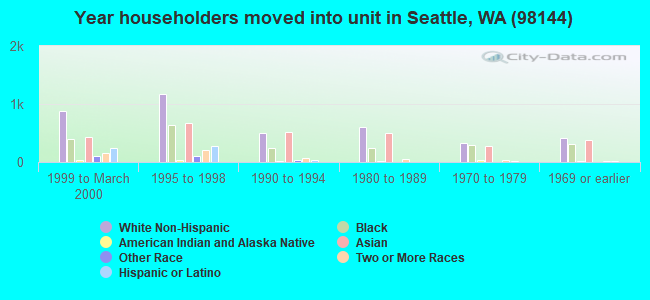
52% of the 98144 zip code residents lived in the same house 5 years ago. Out of people who lived in different houses, 72% lived in this county. Out of people who lived in different counties, 50% lived in Washington.
83% of the 98144 zip code residents lived in the same house 1 year ago. Out of people who lived in different houses, 70% moved from this county. Out of people who lived in different houses, 6% moved from different county within same state. Out of people who lived in different houses, 19% moved from different state. Out of people who lived in different houses, 1% moved from abroad.
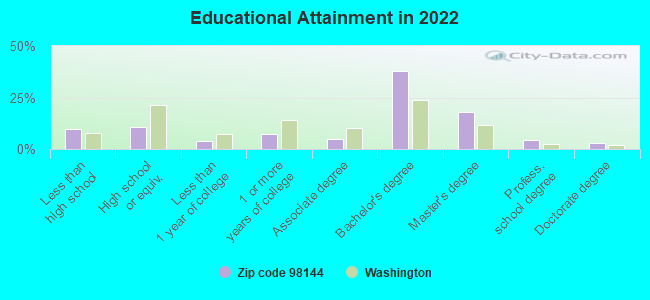
Private vs. public school enrollment:
Students in private schools in grades 1 to 8 (elementary and middle school): 524
Here:
23.1%
Washington:
12.4%
Students in private schools in grades 9 to 12 (high school): 170
Here:
15.5%
Washington:
9.2%
Students in private undergraduate colleges: 96
Here:
8.1%
Washington:
16.5%
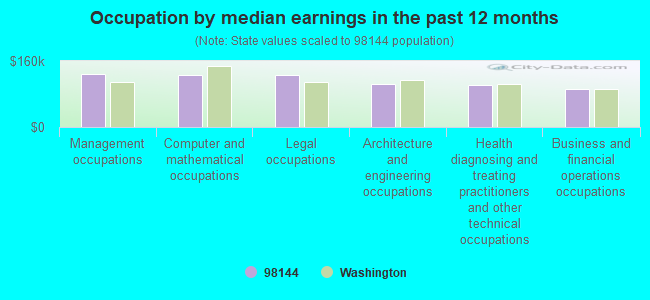
Occupation by median earnings in the past 12 months ($)
128,685Management occupations
126,931Computer and mathematical occupations
124,977Legal occupations
104,296Architecture and engineering occupations
101,769Health diagnosing and treating practitioners and other technical occupations
93,309Business and financial operations occupations
Companies with biggest federal contracts located in this zip code (SEATTLE, WA):
PACIFIC MEDICAL CENTER INC (1200 12TH AVE S) : $498,678,560 in 55 contractsfrom 1999 to 2006
Contracts for General Health Care Services, Medical and Health Studies, Other Professional Services by Army, Civilian Health and Medical Program of the Uniformed Services, Office of the, Office of Assistant Secretary for Health except national centers (disused code) Signed by year:2000: $67,331,196; 2001: $50,505,377; 2002: $99,202,369; 2003: $115,772,207; 2004: $20,877,345; 2005: $30,207,500; 2006: $84,427,411.
Biggest contracts:
$50,553,456 with Army for General Health Care Services. Signed on 2003-11-24. Completion date: 2004-05-30.
$42,942,727 with Civilian Health and Medical Program of the Uniformed Services, Office of the for Medical and Health Studies. Signed on 2006-01-05. Completion date: 2006-05-31.
$39,332,641, same as above.Signed on 2006-05-30. Completion date: 2007-05-31.
$35,200,000 with Army for General Health Care Services. Signed on 2002-03-24. Completion date: 2001-03-31.
BAUGH SKANSKA INC (900 POPLAR PLACE S) : $39,665,539 in 122 contractsfrom 2002 to 2006
Contracts for Construction of Structures and Facilities -- Office Buildings by Army Signed by year:2000: $0; 2001: $0; 2002: $35,464,834; 2003: $1,796,506; 2004: $479,960; 2005: $150,078; 2006: $1,774,161.
Biggest contracts:
$35,306,412 with Army for Construction of Structures and Facilities -- Office Buildings. Signed on 2002-06-07. Completion date: 2004-03-31.
$800,808, same as above.Signed on 2006-02-06. Completion date: 2004-03-31.
$750,000, same as above.Signed on 2003-02-10. Completion date: 2004-03-31.
$354,055, same as above.Signed on 2006-02-07. Completion date: 2004-03-31.
PEPSI COLA BOTTLING CO INC (2300 26TH AVE S) : $19,188,754 in 76 contractsfrom 1999 to 2006
Contracts for Food Items For Resale, Miscellaneous Items by Department of Defense, Defense Commissary Agency, Forest Service Signed by year:2000: $1,756,563; 2001: $3,639,916; 2002: $1,677,773; 2003: $1,825,483; 2004: $3,674,489; 2005: $4,404,345; 2006: $1,864,481.
Biggest contracts:
$1,691,839 with Department of Defense for Food Items For Resale. Signed on 2001-11-01. Completion date: 2002-08-31.
$1,098,329 with Defense Commissary Agency for Food Items For Resale. Signed on 2005-04-01. Completion date: 2005-08-31.
$945,233, same as above.Signed on 2006-01-01. Completion date: 2006-03-31.
$941,129 with Department of Defense for Food Items For Resale. Signed on 2002-10-01. Completion date: 2003-05-31.
UNITED STATES BAKERY (2006 S WELLER ST) : $4,708,481 in 121 contractsfrom 2000 to 2006
Contracts for Non-Food Items For Resale, Food Items For Resale, Bakery and Cereal Products, Drugs and Biologicals, and moreby Defense Commissary Agency, Department of Defense, Department of Veterans Affairs, Defense Logistics Agency, and others Signed by year:2000: $182,330; 2001: $53,950; 2002: $154,503; 2003: $209,792; 2004: $794,583; 2005: $2,162,485; 2006: $1,150,838.
Biggest contracts:
$1,022,945 with Defense Commissary Agency for Non-Food Items For Resale. Signed on 2006-01-01. Completion date: 2006-03-31.
$885,725 with Defense Commissary Agency for Food Items For Resale. Signed on 2005-04-01. Completion date: 2005-09-30.
$638,192, same as above.Signed on 2004-10-01. Completion date: 2005-02-28.
$527,247 with Defense Commissary Agency for Non-Food Items For Resale. Signed on 2005-10-01. Completion date: 2005-12-31.
PAINE ELECTRONICS, LLC (2401 S BAYVIEW ST; small business) : $2,644,292 in 22 contractsfrom 1999 to 2006
Contracts for Combination and Miscellaneous Instruments, Liquid and Gas Flow, Liquid Level, and Mechanical Motion Measuring Instruments, Pressure, Temperature, and Humidity Measuring and Controlling Instruments, Miscellaneous Communication Equipment by Army, Defense Logistics Agency, National Oceanic and Atmospheric Administration/Under Secretary for Oceans and Atmosphere, U.S. Coast Guard, and others Signed by year:2000: $96,600; 2001: $147,960; 2002: $52,200; 2003: $0; 2004: $749,107; 2005: $1,438,079; 2006: $57,650.
Biggest contracts:
$1,384,549 with Army for Combination and Miscellaneous Instruments. Signed on 2005-09-01. Completion date: 2007-02-28.
$470,400 with Defense Logistics Agency for Combination and Miscellaneous Instruments. Signed on 2004-05-25. Completion date: 2005-04-12.
$147,728 with Defense Logistics Agency for Liquid and Gas Flow, Liquid Level, and Mechanical Motion Measuring Instruments. Signed on 2004-01-27. Completion date: 2004-07-25.
$113,352, same as above.Signed on 2005-06-21. Completion date: 2005-11-30.
SNOWDEN COMPANY INC (2212 S JACKSON ST; small business) : $1,261,001 in 17 contractsfrom 1999 to 2003
Contracts for Custodial Janitorial Services, Food Services, Other Administrative Support Services, Communications Services by National Oceanic and Atmospheric Administration/Under Secretary for Oceans and Atmosphere, Navy Signed by year:2000: $428,759; 2001: $120,000; 2002: $54,234; 2003: $54,234; 2004: $0; 2005: $0; 2006: $0.
Biggest contracts:
$320,000 with National Oceanic and Atmospheric Administration/Under Secretary for Oceans and Atmosphere for Custodial Janitorial Services. Signed on 2000-10-15. Completion date: 2001-11-15.
$300,000, same as above.Signed on 1999-12-15. Completion date: 2000-11-15.
$155,829 with Navy for Food Services. Signed on 1999-12-01. Completion date: 1999-12-31.
$69,759 with Navy for Other Administrative Support Services. Signed on 2000-09-22. Completion date: 2001-09-30.
SOUND BUSINESS SYSTEMS INC (3031 S WALDEN ST STE 103; small business) : $304,415 in 18 contractsfrom 2000 to 2005
Contracts for Office Furniture, Miscellaneous Materials Handling Equipment, Specialized Shipping and Storage Containers, Visible Record Equipment, and moreby Public Buildings Service, Air Force, Army, U.S. Army Corps of Engineers - civil program financing only, and others Signed by year:2000: $63,445; 2001: $0; 2002: $0; 2003: $35,895; 2004: $185,510; 2005: $19,565; 2006: $0.
Biggest contracts:
$81,393 with Public Buildings Service for Office Furniture. Signed on 2004-03-17. Completion date: 2004-06-15.
$49,292, same as above.Signed on 2004-07-28. Completion date: 2004-06-15.
$38,027, same as above.Signed on 2004-01-22. Completion date: 2004-09-30.
$33,245 with Air Force for Miscellaneous Materials Handling Equipment. Taking place in AK. Signed on 2000-07-26. Completion date: 2000-09-15.
CONTROL CONTRACTORS, INC (1128 POPLAR PLACE S; small business) : $164,092 in 8 contractsfrom 2000 to 2005
Contracts for Maintenance, Repair and Rebuilding of Equipment -- Refrigeration, Air Conditioning, and Air Circulating Equipment, Other ADP and Telecommunications Services (includes data storage on tapes, compact disks, etc.), Maintenance, Repair and Rebuilding of Equipment -- Water Purification and Sewage Treatment Equipment, Other Architect and Engineering Services, and moreby Navy, Bureau of Prisoners/Federal Prison System, U.S. Fish and Wildlife Service Signed by year:2000: $33,680; 2001: $0; 2002: $44,995; 2003: $52,884; 2004: $0; 2005: $32,533; 2006: $0.
Biggest contracts:
$52,884 with Navy for Maintenance, Repair and Rebuilding of Equipment -- Refrigeration, Air Conditioning, and Air Circulating Equipment. Signed on 2003-09-24. Completion date: 2004-01-15.
$44,995 with Navy for Other ADP and Telecommunications Services (includes data storage on tapes, compact disks, etc.). Signed on 2002-09-30. Completion date: 2003-01-09.
$29,090 with Navy for Maintenance, Repair and Rebuilding of Equipment -- Water Purification and Sewage Treatment Equipment. Signed on 2005-06-10. Completion date: 2005-07-29.
$22,680 with Navy for Other Architect and Engineering Services. Signed on 2000-09-29. Completion date: 2001-01-23.
KDL HARDWARE SUPPLY, INC (850 POPLAR PL S; small business) : $141,809 in 10 contractsfrom 2003 to 2006
Contracts for Hardware, Commercial, Miscellaneous Items, Nuts and Washers, Miscellaneous Maintenance and Repair Shop Specialized Equipment, and moreby Bureau of Reclamation, Army, Navy, Department of Veterans Affairs, and others Signed by year:2000: $0; 2001: $0; 2002: $0; 2003: $37,217; 2004: $96,360; 2005: $5,219; 2006: $3,013.
Biggest contracts:
$96,360 with Bureau of Reclamation for Hardware, Commercial. Signed on 2004-04-01. Completion date: 2004-04-29.
$31,637 with Bureau of Reclamation for Hardware, Commercial. Taking place in CO. Signed on 2003-02-15. Completion date: 2003-03-15.
$5,580 with Army for Miscellaneous Items. Signed on 2003-08-12. Completion date: 2003-09-05.
$5,219 with Navy for Nuts and Washers. Signed on 2005-09-10. Completion date: 2005-09-30.
1-WORLD GLOBES & MAPS, LLC (1605 S JACKSON ST; small business) : $40,517 in 3 contractsfrom 2004 to 2005
$24,000 with Air Force for Training Aids. Signed on 2005-09-29. Completion date: 2005-11-30.
$11,000 with Army for Maps, Atlases, Charts, and Globes. Signed on 2004-09-28. Completion date: 2004-11-15.
$5,517, same as above.Signed on 2005-05-26. Completion date: 2005-06-24.
Top industries in this zip code by the number of employees in 2005:
2003 - 2018 National Fire Incident Reporting System (NFIRS) incidents
According to the data from the years 2003 - 2018 the average number of fire incidents per year is 88. The highest number of fires - 130 took place in 2016, and the least - 21 in 2003. The data has an increasing trend.
When looking into fire subcategories, the most incidents belonged to: Outside Fires (49.0%), and Structure Fires (29.9%).
Fire incident types reported to NFIRS in Zip Code 98144


 Nearest zip codes: 98122, 98104, 98164, 98154, 98134, 98174.


 According to the data from the years 2003 - 2018 the average number of fire incidents per year is 88. The highest number of fires - 130 took place in 2016, and the least - 21 in 2003. The data has an increasing trend.
 When looking into fire subcategories, the most incidents belonged to: Outside Fires (49.0%), and Structure Fires (29.9%).