Kirkland, Washington Submit your own pictures of this city and show them to the world
OSM Map
General Map
Google Map
MSN Map
OSM Map
General Map
Google Map
MSN Map
OSM Map
General Map
Google Map
MSN Map
OSM Map
General Map
Google Map
MSN Map
Please wait while loading the map...
Population in 2022: 92,151 (100% urban, 0% rural). Population change since 2000: +104.5%Males: 45,359 Females: 46,792
March 2022 cost of living index in Kirkland: 118.1 (more than average, U.S. average is 100) Percentage of residents living in poverty in 2022: 5.6%for White Non-Hispanic residents , 30.1% for Black residents , 9.5% for Hispanic or Latino residents , 5.9% for American Indian residents , 18.7% for other race residents , 6.9% for two or more races residents )
Profiles of local businesses
Business Search - 14 Million verified businesses
Data:
Median household income ($)
Median household income (% change since 2000)
Household income diversity
Ratio of average income to average house value (%)
Ratio of average income to average rent
Median household income ($) - White
Median household income ($) - Black or African American
Median household income ($) - Asian
Median household income ($) - Hispanic or Latino
Median household income ($) - American Indian and Alaska Native
Median household income ($) - Multirace
Median household income ($) - Other Race
Median household income for houses/condos with a mortgage ($)
Median household income for apartments without a mortgage ($)
Races - White alone (%)
Races - White alone (% change since 2000)
Races - Black alone (%)
Races - Black alone (% change since 2000)
Races - American Indian alone (%)
Races - American Indian alone (% change since 2000)
Races - Asian alone (%)
Races - Asian alone (% change since 2000)
Races - Hispanic (%)
Races - Hispanic (% change since 2000)
Races - Native Hawaiian and Other Pacific Islander alone (%)
Races - Native Hawaiian and Other Pacific Islander alone (% change since 2000)
Races - Two or more races (%)
Races - Two or more races (% change since 2000)
Races - Other race alone (%)
Races - Other race alone (% change since 2000)
Racial diversity
Unemployment (%)
Unemployment (% change since 2000)
Unemployment (%) - White
Unemployment (%) - Black or African American
Unemployment (%) - Asian
Unemployment (%) - Hispanic or Latino
Unemployment (%) - American Indian and Alaska Native
Unemployment (%) - Multirace
Unemployment (%) - Other Race
Population density (people per square mile)
Population - Males (%)
Population - Females (%)
Population - Males (%) - White
Population - Males (%) - Black or African American
Population - Males (%) - Asian
Population - Males (%) - Hispanic or Latino
Population - Males (%) - American Indian and Alaska Native
Population - Males (%) - Multirace
Population - Males (%) - Other Race
Population - Females (%) - White
Population - Females (%) - Black or African American
Population - Females (%) - Asian
Population - Females (%) - Hispanic or Latino
Population - Females (%) - American Indian and Alaska Native
Population - Females (%) - Multirace
Population - Females (%) - Other Race
Coronavirus confirmed cases (Apr 27, 2024)
Deaths caused by coronavirus (Apr 27, 2024)
Coronavirus confirmed cases (per 100k population) (Apr 27, 2024)
Deaths caused by coronavirus (per 100k population) (Apr 27, 2024)
Daily increase in number of cases (Apr 27, 2024)
Weekly increase in number of cases (Apr 27, 2024)
Cases doubled (in days) (Apr 27, 2024)
Hospitalized patients (Apr 18, 2022)
Negative test results (Apr 18, 2022)
Total test results (Apr 18, 2022)
COVID Vaccine doses distributed (per 100k population) (Sep 19, 2023)
COVID Vaccine doses administered (per 100k population) (Sep 19, 2023)
COVID Vaccine doses distributed (Sep 19, 2023)
COVID Vaccine doses administered (Sep 19, 2023)
Likely homosexual households (%)
Likely homosexual households (% change since 2000)
Likely homosexual households - Lesbian couples (%)
Likely homosexual households - Lesbian couples (% change since 2000)
Likely homosexual households - Gay men (%)
Likely homosexual households - Gay men (% change since 2000)
Cost of living index
Median gross rent ($)
Median contract rent ($)
Median monthly housing costs ($)
Median house or condo value ($)
Median house or condo value ($ change since 2000)
Mean house or condo value by units in structure - 1, detached ($)
Mean house or condo value by units in structure - 1, attached ($)
Mean house or condo value by units in structure - 2 ($)
Mean house or condo value by units in structure by units in structure - 3 or 4 ($)
Mean house or condo value by units in structure - 5 or more ($)
Mean house or condo value by units in structure - Boat, RV, van, etc. ($)
Mean house or condo value by units in structure - Mobile home ($)
Median house or condo value ($) - White
Median house or condo value ($) - Black or African American
Median house or condo value ($) - Asian
Median house or condo value ($) - Hispanic or Latino
Median house or condo value ($) - American Indian and Alaska Native
Median house or condo value ($) - Multirace
Median house or condo value ($) - Other Race
Median resident age
Resident age diversity
Median resident age - Males
Median resident age - Females
Median resident age - White
Median resident age - Black or African American
Median resident age - Asian
Median resident age - Hispanic or Latino
Median resident age - American Indian and Alaska Native
Median resident age - Multirace
Median resident age - Other Race
Median resident age - Males - White
Median resident age - Males - Black or African American
Median resident age - Males - Asian
Median resident age - Males - Hispanic or Latino
Median resident age - Males - American Indian and Alaska Native
Median resident age - Males - Multirace
Median resident age - Males - Other Race
Median resident age - Females - White
Median resident age - Females - Black or African American
Median resident age - Females - Asian
Median resident age - Females - Hispanic or Latino
Median resident age - Females - American Indian and Alaska Native
Median resident age - Females - Multirace
Median resident age - Females - Other Race
Commute - mean travel time to work (minutes)
Travel time to work - Less than 5 minutes (%)
Travel time to work - Less than 5 minutes (% change since 2000)
Travel time to work - 5 to 9 minutes (%)
Travel time to work - 5 to 9 minutes (% change since 2000)
Travel time to work - 10 to 19 minutes (%)
Travel time to work - 10 to 19 minutes (% change since 2000)
Travel time to work - 20 to 29 minutes (%)
Travel time to work - 20 to 29 minutes (% change since 2000)
Travel time to work - 30 to 39 minutes (%)
Travel time to work - 30 to 39 minutes (% change since 2000)
Travel time to work - 40 to 59 minutes (%)
Travel time to work - 40 to 59 minutes (% change since 2000)
Travel time to work - 60 to 89 minutes (%)
Travel time to work - 60 to 89 minutes (% change since 2000)
Travel time to work - 90 or more minutes (%)
Travel time to work - 90 or more minutes (% change since 2000)
Marital status - Never married (%)
Marital status - Now married (%)
Marital status - Separated (%)
Marital status - Widowed (%)
Marital status - Divorced (%)
Median family income ($)
Median family income (% change since 2000)
Median non-family income ($)
Median non-family income (% change since 2000)
Median per capita income ($)
Median per capita income (% change since 2000)
Median family income ($) - White
Median family income ($) - Black or African American
Median family income ($) - Asian
Median family income ($) - Hispanic or Latino
Median family income ($) - American Indian and Alaska Native
Median family income ($) - Multirace
Median family income ($) - Other Race
Median year house/condo built
Median year apartment built
Year house built - Built 2005 or later (%)
Year house built - Built 2000 to 2004 (%)
Year house built - Built 1990 to 1999 (%)
Year house built - Built 1980 to 1989 (%)
Year house built - Built 1970 to 1979 (%)
Year house built - Built 1960 to 1969 (%)
Year house built - Built 1950 to 1959 (%)
Year house built - Built 1940 to 1949 (%)
Year house built - Built 1939 or earlier (%)
Average household size
Household density (households per square mile)
Average household size - White
Average household size - Black or African American
Average household size - Asian
Average household size - Hispanic or Latino
Average household size - American Indian and Alaska Native
Average household size - Multirace
Average household size - Other Race
Occupied housing units (%)
Vacant housing units (%)
Owner occupied housing units (%)
Renter occupied housing units (%)
Vacancy status - For rent (%)
Vacancy status - For sale only (%)
Vacancy status - Rented or sold, not occupied (%)
Vacancy status - For seasonal, recreational, or occasional use (%)
Vacancy status - For migrant workers (%)
Vacancy status - Other vacant (%)
Residents with income below the poverty level (%)
Residents with income below 50% of the poverty level (%)
Children below poverty level (%)
Poor families by family type - Married-couple family (%)
Poor families by family type - Male, no wife present (%)
Poor families by family type - Female, no husband present (%)
Poverty status for native-born residents (%)
Poverty status for foreign-born residents (%)
Poverty among high school graduates not in families (%)
Poverty among people who did not graduate high school not in families (%)
Residents with income below the poverty level (%) - White
Residents with income below the poverty level (%) - Black or African American
Residents with income below the poverty level (%) - Asian
Residents with income below the poverty level (%) - Hispanic or Latino
Residents with income below the poverty level (%) - American Indian and Alaska Native
Residents with income below the poverty level (%) - Multirace
Residents with income below the poverty level (%) - Other Race
Air pollution - Air Quality Index (AQI)
Air pollution - CO
Air pollution - NO2
Air pollution - SO2
Air pollution - Ozone
Air pollution - PM10
Air pollution - PM25
Air pollution - Pb
Crime - Murders per 100,000 population
Crime - Rapes per 100,000 population
Crime - Robberies per 100,000 population
Crime - Assaults per 100,000 population
Crime - Burglaries per 100,000 population
Crime - Thefts per 100,000 population
Crime - Auto thefts per 100,000 population
Crime - Arson per 100,000 population
Crime - City-data.com crime index
Crime - Violent crime index
Crime - Property crime index
Crime - Murders per 100,000 population (5 year average)
Crime - Rapes per 100,000 population (5 year average)
Crime - Robberies per 100,000 population (5 year average)
Crime - Assaults per 100,000 population (5 year average)
Crime - Burglaries per 100,000 population (5 year average)
Crime - Thefts per 100,000 population (5 year average)
Crime - Auto thefts per 100,000 population (5 year average)
Crime - Arson per 100,000 population (5 year average)
Crime - City-data.com crime index (5 year average)
Crime - Violent crime index (5 year average)
Crime - Property crime index (5 year average)
1996 Presidential Elections Results (%) - Democratic Party (Clinton)
1996 Presidential Elections Results (%) - Republican Party (Dole)
1996 Presidential Elections Results (%) - Other
2000 Presidential Elections Results (%) - Democratic Party (Gore)
2000 Presidential Elections Results (%) - Republican Party (Bush)
2000 Presidential Elections Results (%) - Other
2004 Presidential Elections Results (%) - Democratic Party (Kerry)
2004 Presidential Elections Results (%) - Republican Party (Bush)
2004 Presidential Elections Results (%) - Other
2008 Presidential Elections Results (%) - Democratic Party (Obama)
2008 Presidential Elections Results (%) - Republican Party (McCain)
2008 Presidential Elections Results (%) - Other
2012 Presidential Elections Results (%) - Democratic Party (Obama)
2012 Presidential Elections Results (%) - Republican Party (Romney)
2012 Presidential Elections Results (%) - Other
2016 Presidential Elections Results (%) - Democratic Party (Clinton)
2016 Presidential Elections Results (%) - Republican Party (Trump)
2016 Presidential Elections Results (%) - Other
2020 Presidential Elections Results (%) - Democratic Party (Biden)
2020 Presidential Elections Results (%) - Republican Party (Trump)
2020 Presidential Elections Results (%) - Other
Ancestries Reported - Arab (%)
Ancestries Reported - Czech (%)
Ancestries Reported - Danish (%)
Ancestries Reported - Dutch (%)
Ancestries Reported - English (%)
Ancestries Reported - French (%)
Ancestries Reported - French Canadian (%)
Ancestries Reported - German (%)
Ancestries Reported - Greek (%)
Ancestries Reported - Hungarian (%)
Ancestries Reported - Irish (%)
Ancestries Reported - Italian (%)
Ancestries Reported - Lithuanian (%)
Ancestries Reported - Norwegian (%)
Ancestries Reported - Polish (%)
Ancestries Reported - Portuguese (%)
Ancestries Reported - Russian (%)
Ancestries Reported - Scotch-Irish (%)
Ancestries Reported - Scottish (%)
Ancestries Reported - Slovak (%)
Ancestries Reported - Subsaharan African (%)
Ancestries Reported - Swedish (%)
Ancestries Reported - Swiss (%)
Ancestries Reported - Ukrainian (%)
Ancestries Reported - United States (%)
Ancestries Reported - Welsh (%)
Ancestries Reported - West Indian (%)
Ancestries Reported - Other (%)
Educational Attainment - No schooling completed (%)
Educational Attainment - Less than high school (%)
Educational Attainment - High school or equivalent (%)
Educational Attainment - Less than 1 year of college (%)
Educational Attainment - 1 or more years of college (%)
Educational Attainment - Associate degree (%)
Educational Attainment - Bachelor's degree (%)
Educational Attainment - Master's degree (%)
Educational Attainment - Professional school degree (%)
Educational Attainment - Doctorate degree (%)
School Enrollment - Nursery, preschool (%)
School Enrollment - Kindergarten (%)
School Enrollment - Grade 1 to 4 (%)
School Enrollment - Grade 5 to 8 (%)
School Enrollment - Grade 9 to 12 (%)
School Enrollment - College undergrad (%)
School Enrollment - Graduate or professional (%)
School Enrollment - Not enrolled in school (%)
School enrollment - Public schools (%)
School enrollment - Private schools (%)
School enrollment - Not enrolled (%)
Median number of rooms in houses and condos
Median number of rooms in apartments
Housing units lacking complete plumbing facilities (%)
Housing units lacking complete kitchen facilities (%)
Density of houses
Urban houses (%)
Rural houses (%)
Households with people 60 years and over (%)
Households with people 65 years and over (%)
Households with people 75 years and over (%)
Households with one or more nonrelatives (%)
Households with no nonrelatives (%)
Population in households (%)
Family households (%)
Nonfamily households (%)
Population in families (%)
Family households with own children (%)
Median number of bedrooms in owner occupied houses
Mean number of bedrooms in owner occupied houses
Median number of bedrooms in renter occupied houses
Mean number of bedrooms in renter occupied houses
Median number of vehichles in owner occupied houses
Mean number of vehichles in owner occupied houses
Median number of vehichles in renter occupied houses
Mean number of vehichles in renter occupied houses
Mortgage status - with mortgage (%)
Mortgage status - with second mortgage (%)
Mortgage status - with home equity loan (%)
Mortgage status - with both second mortgage and home equity loan (%)
Mortgage status - without a mortgage (%)
Average family size
Average family size - White
Average family size - Black or African American
Average family size - Asian
Average family size - Hispanic or Latino
Average family size - American Indian and Alaska Native
Average family size - Multirace
Average family size - Other Race
Geographical mobility - Same house 1 year ago (%)
Geographical mobility - Moved within same county (%)
Geographical mobility - Moved from different county within same state (%)
Geographical mobility - Moved from different state (%)
Geographical mobility - Moved from abroad (%)
Place of birth - Born in state of residence (%)
Place of birth - Born in other state (%)
Place of birth - Native, outside of US (%)
Place of birth - Foreign born (%)
Housing units in structures - 1, detached (%)
Housing units in structures - 1, attached (%)
Housing units in structures - 2 (%)
Housing units in structures - 3 or 4 (%)
Housing units in structures - 5 to 9 (%)
Housing units in structures - 10 to 19 (%)
Housing units in structures - 20 to 49 (%)
Housing units in structures - 50 or more (%)
Housing units in structures - Mobile home (%)
Housing units in structures - Boat, RV, van, etc. (%)
House/condo owner moved in on average (years ago)
Renter moved in on average (years ago)
Year householder moved into unit - Moved in 1999 to March 2000 (%)
Year householder moved into unit - Moved in 1995 to 1998 (%)
Year householder moved into unit - Moved in 1990 to 1994 (%)
Year householder moved into unit - Moved in 1980 to 1989 (%)
Year householder moved into unit - Moved in 1970 to 1979 (%)
Year householder moved into unit - Moved in 1969 or earlier (%)
Means of transportation to work - Drove car alone (%)
Means of transportation to work - Carpooled (%)
Means of transportation to work - Public transportation (%)
Means of transportation to work - Bus or trolley bus (%)
Means of transportation to work - Streetcar or trolley car (%)
Means of transportation to work - Subway or elevated (%)
Means of transportation to work - Railroad (%)
Means of transportation to work - Ferryboat (%)
Means of transportation to work - Taxicab (%)
Means of transportation to work - Motorcycle (%)
Means of transportation to work - Bicycle (%)
Means of transportation to work - Walked (%)
Means of transportation to work - Other means (%)
Working at home (%)
Industry diversity
Most Common Industries - Agriculture, forestry, fishing and hunting, and mining (%)
Most Common Industries - Agriculture, forestry, fishing and hunting (%)
Most Common Industries - Mining, quarrying, and oil and gas extraction (%)
Most Common Industries - Construction (%)
Most Common Industries - Manufacturing (%)
Most Common Industries - Wholesale trade (%)
Most Common Industries - Retail trade (%)
Most Common Industries - Transportation and warehousing, and utilities (%)
Most Common Industries - Transportation and warehousing (%)
Most Common Industries - Utilities (%)
Most Common Industries - Information (%)
Most Common Industries - Finance and insurance, and real estate and rental and leasing (%)
Most Common Industries - Finance and insurance (%)
Most Common Industries - Real estate and rental and leasing (%)
Most Common Industries - Professional, scientific, and management, and administrative and waste management services (%)
Most Common Industries - Professional, scientific, and technical services (%)
Most Common Industries - Management of companies and enterprises (%)
Most Common Industries - Administrative and support and waste management services (%)
Most Common Industries - Educational services, and health care and social assistance (%)
Most Common Industries - Educational services (%)
Most Common Industries - Health care and social assistance (%)
Most Common Industries - Arts, entertainment, and recreation, and accommodation and food services (%)
Most Common Industries - Arts, entertainment, and recreation (%)
Most Common Industries - Accommodation and food services (%)
Most Common Industries - Other services, except public administration (%)
Most Common Industries - Public administration (%)
Occupation diversity
Most Common Occupations - Management, business, science, and arts occupations (%)
Most Common Occupations - Management, business, and financial occupations (%)
Most Common Occupations - Management occupations (%)
Most Common Occupations - Business and financial operations occupations (%)
Most Common Occupations - Computer, engineering, and science occupations (%)
Most Common Occupations - Computer and mathematical occupations (%)
Most Common Occupations - Architecture and engineering occupations (%)
Most Common Occupations - Life, physical, and social science occupations (%)
Most Common Occupations - Education, legal, community service, arts, and media occupations (%)
Most Common Occupations - Community and social service occupations (%)
Most Common Occupations - Legal occupations (%)
Most Common Occupations - Education, training, and library occupations (%)
Most Common Occupations - Arts, design, entertainment, sports, and media occupations (%)
Most Common Occupations - Healthcare practitioners and technical occupations (%)
Most Common Occupations - Health diagnosing and treating practitioners and other technical occupations (%)
Most Common Occupations - Health technologists and technicians (%)
Most Common Occupations - Service occupations (%)
Most Common Occupations - Healthcare support occupations (%)
Most Common Occupations - Protective service occupations (%)
Most Common Occupations - Fire fighting and prevention, and other protective service workers including supervisors (%)
Most Common Occupations - Law enforcement workers including supervisors (%)
Most Common Occupations - Food preparation and serving related occupations (%)
Most Common Occupations - Building and grounds cleaning and maintenance occupations (%)
Most Common Occupations - Personal care and service occupations (%)
Most Common Occupations - Sales and office occupations (%)
Most Common Occupations - Sales and related occupations (%)
Most Common Occupations - Office and administrative support occupations (%)
Most Common Occupations - Natural resources, construction, and maintenance occupations (%)
Most Common Occupations - Farming, fishing, and forestry occupations (%)
Most Common Occupations - Construction and extraction occupations (%)
Most Common Occupations - Installation, maintenance, and repair occupations (%)
Most Common Occupations - Production, transportation, and material moving occupations (%)
Most Common Occupations - Production occupations (%)
Most Common Occupations - Transportation occupations (%)
Most Common Occupations - Material moving occupations (%)
People in Group quarters - Institutionalized population (%)
People in Group quarters - Correctional institutions (%)
People in Group quarters - Federal prisons and detention centers (%)
People in Group quarters - Halfway houses (%)
People in Group quarters - Local jails and other confinement facilities (including police lockups) (%)
People in Group quarters - Military disciplinary barracks (%)
People in Group quarters - State prisons (%)
People in Group quarters - Other types of correctional institutions (%)
People in Group quarters - Nursing homes (%)
People in Group quarters - Hospitals/wards, hospices, and schools for the handicapped (%)
People in Group quarters - Hospitals/wards and hospices for chronically ill (%)
People in Group quarters - Hospices or homes for chronically ill (%)
People in Group quarters - Military hospitals or wards for chronically ill (%)
People in Group quarters - Other hospitals or wards for chronically ill (%)
People in Group quarters - Hospitals or wards for drug/alcohol abuse (%)
People in Group quarters - Mental (Psychiatric) hospitals or wards (%)
People in Group quarters - Schools, hospitals, or wards for the mentally retarded (%)
People in Group quarters - Schools, hospitals, or wards for the physically handicapped (%)
People in Group quarters - Institutions for the deaf (%)
People in Group quarters - Institutions for the blind (%)
People in Group quarters - Orthopedic wards and institutions for the physically handicapped (%)
People in Group quarters - Wards in general hospitals for patients who have no usual home elsewhere (%)
People in Group quarters - Wards in military hospitals for patients who have no usual home elsewhere (%)
People in Group quarters - Juvenile institutions (%)
People in Group quarters - Long-term care (%)
People in Group quarters - Homes for abused, dependent, and neglected children (%)
People in Group quarters - Residential treatment centers for emotionally disturbed children (%)
People in Group quarters - Training schools for juvenile delinquents (%)
People in Group quarters - Short-term care, detention or diagnostic centers for delinquent children (%)
People in Group quarters - Type of juvenile institution unknown (%)
People in Group quarters - Noninstitutionalized population (%)
People in Group quarters - College dormitories (includes college quarters off campus) (%)
People in Group quarters - Military quarters (%)
People in Group quarters - On base (%)
People in Group quarters - Barracks, unaccompanied personnel housing (UPH), (Enlisted/Officer), ;and similar group living quarters for military personnel (%)
People in Group quarters - Transient quarters for temporary residents (%)
People in Group quarters - Military ships (%)
People in Group quarters - Group homes (%)
People in Group quarters - Homes or halfway houses for drug/alcohol abuse (%)
People in Group quarters - Homes for the mentally ill (%)
People in Group quarters - Homes for the mentally retarded (%)
People in Group quarters - Homes for the physically handicapped (%)
People in Group quarters - Other group homes (%)
People in Group quarters - Religious group quarters (%)
People in Group quarters - Dormitories (%)
People in Group quarters - Agriculture workers' dormitories on farms (%)
People in Group quarters - Job Corps and vocational training facilities (%)
People in Group quarters - Other workers' dormitories (%)
People in Group quarters - Crews of maritime vessels (%)
People in Group quarters - Other nonhousehold living situations (%)
People in Group quarters - Other noninstitutional group quarters (%)
Residents speaking English at home (%)
Residents speaking English at home - Born in the United States (%)
Residents speaking English at home - Native, born elsewhere (%)
Residents speaking English at home - Foreign born (%)
Residents speaking Spanish at home (%)
Residents speaking Spanish at home - Born in the United States (%)
Residents speaking Spanish at home - Native, born elsewhere (%)
Residents speaking Spanish at home - Foreign born (%)
Residents speaking other language at home (%)
Residents speaking other language at home - Born in the United States (%)
Residents speaking other language at home - Native, born elsewhere (%)
Residents speaking other language at home - Foreign born (%)
Class of Workers - Employee of private company (%)
Class of Workers - Self-employed in own incorporated business (%)
Class of Workers - Private not-for-profit wage and salary workers (%)
Class of Workers - Local government workers (%)
Class of Workers - State government workers (%)
Class of Workers - Federal government workers (%)
Class of Workers - Self-employed workers in own not incorporated business and Unpaid family workers (%)
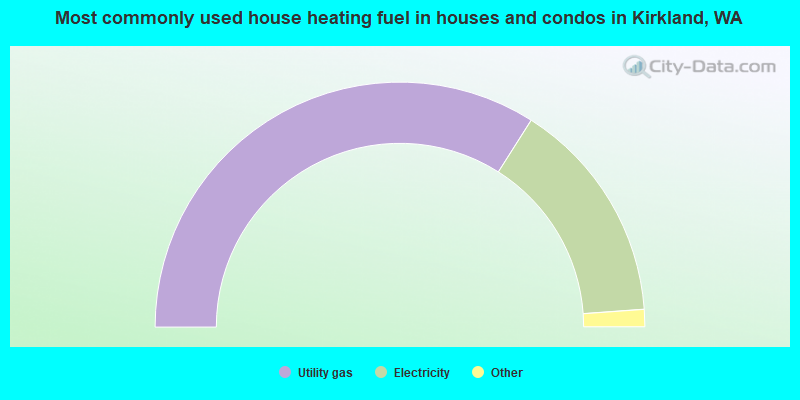
House heating fuel used in houses and condos - Utility gas (%)
House heating fuel used in houses and condos - Bottled, tank, or LP gas (%)
House heating fuel used in houses and condos - Electricity (%)
House heating fuel used in houses and condos - Fuel oil, kerosene, etc. (%)
House heating fuel used in houses and condos - Coal or coke (%)
House heating fuel used in houses and condos - Wood (%)
House heating fuel used in houses and condos - Solar energy (%)
House heating fuel used in houses and condos - Other fuel (%)
House heating fuel used in houses and condos - No fuel used (%)
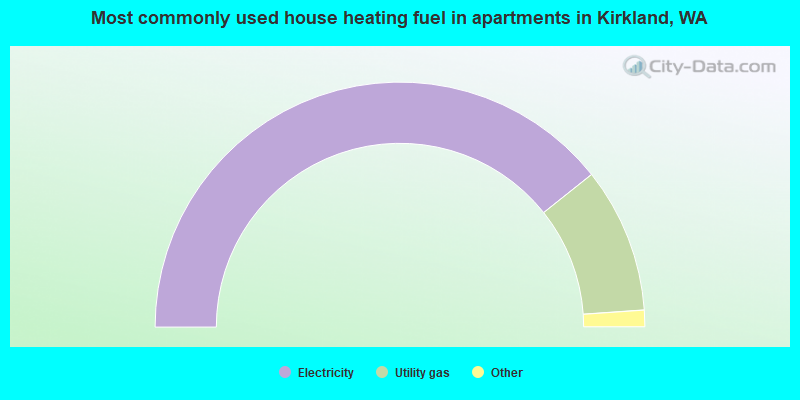
House heating fuel used in apartments - Utility gas (%)
House heating fuel used in apartments - Bottled, tank, or LP gas (%)
House heating fuel used in apartments - Electricity (%)
House heating fuel used in apartments - Fuel oil, kerosene, etc. (%)
House heating fuel used in apartments - Coal or coke (%)
House heating fuel used in apartments - Wood (%)
House heating fuel used in apartments - Solar energy (%)
House heating fuel used in apartments - Other fuel (%)
House heating fuel used in apartments - No fuel used (%)
Armed forces status - In Armed Forces (%)
Armed forces status - Civilian (%)
Armed forces status - Civilian - Veteran (%)
Armed forces status - Civilian - Nonveteran (%)
Fatal accidents locations in years 2005-2021
Fatal accidents locations in 2005
Fatal accidents locations in 2006
Fatal accidents locations in 2007
Fatal accidents locations in 2008
Fatal accidents locations in 2009
Fatal accidents locations in 2010
Fatal accidents locations in 2011
Fatal accidents locations in 2012
Fatal accidents locations in 2013
Fatal accidents locations in 2014
Fatal accidents locations in 2015
Fatal accidents locations in 2016
Fatal accidents locations in 2017
Fatal accidents locations in 2018
Fatal accidents locations in 2019
Fatal accidents locations in 2020
Fatal accidents locations in 2021
Alcohol use - People drinking some alcohol every month (%)
Alcohol use - People not drinking at all (%)
Alcohol use - Average days/month drinking alcohol
Alcohol use - Average drinks/week
Alcohol use - Average days/year people drink much
Audiometry - Average condition of hearing (%)
Audiometry - People that can hear a whisper from across a quiet room (%)
Audiometry - People that can hear normal voice from across a quiet room (%)
Audiometry - Ears ringing, roaring, buzzing (%)
Audiometry - Had a job exposure to loud noise (%)
Audiometry - Had off-work exposure to loud noise (%)
Blood Pressure & Cholesterol - Has high blood pressure (%)
Blood Pressure & Cholesterol - Checking blood pressure at home (%)
Blood Pressure & Cholesterol - Frequently checking blood cholesterol (%)
Blood Pressure & Cholesterol - Has high cholesterol level (%)
Consumer Behavior - Money monthly spent on food at supermarket/grocery store
Consumer Behavior - Money monthly spent on food at other stores
Consumer Behavior - Money monthly spent on eating out
Consumer Behavior - Money monthly spent on carryout/delivered foods
Consumer Behavior - Income spent on food at supermarket/grocery store (%)
Consumer Behavior - Income spent on food at other stores (%)
Consumer Behavior - Income spent on eating out (%)
Consumer Behavior - Income spent on carryout/delivered foods (%)
Current Health Status - General health condition (%)
Current Health Status - Blood donors (%)
Current Health Status - Has blood ever tested for HIV virus (%)
Current Health Status - Left-handed people (%)
Dermatology - People using sunscreen (%)
Diabetes - Diabetics (%)
Diabetes - Had a blood test for high blood sugar (%)
Diabetes - People taking insulin (%)
Diet Behavior & Nutrition - Diet health (%)
Diet Behavior & Nutrition - Milk product consumption (# of products/month)
Diet Behavior & Nutrition - Meals not home prepared (#/week)
Diet Behavior & Nutrition - Meals from fast food or pizza place (#/week)
Diet Behavior & Nutrition - Ready-to-eat foods (#/month)
Diet Behavior & Nutrition - Frozen meals/pizza (#/month)
Drug Use - People that ever used marijuana or hashish (%)
Drug Use - Ever used hard drugs (%)
Drug Use - Ever used any form of cocaine (%)
Drug Use - Ever used heroin (%)
Drug Use - Ever used methamphetamine (%)
Health Insurance - People covered by health insurance (%)
Kidney Conditions-Urology - Avg. # of times urinating at night
Medical Conditions - People with asthma (%)
Medical Conditions - People with anemia (%)
Medical Conditions - People with psoriasis (%)
Medical Conditions - People with overweight (%)
Medical Conditions - Elderly people having difficulties in thinking or remembering (%)
Medical Conditions - People who ever received blood transfusion (%)
Medical Conditions - People having trouble seeing even with glass/contacts (%)
Medical Conditions - People with arthritis (%)
Medical Conditions - People with gout (%)
Medical Conditions - People with congestive heart failure (%)
Medical Conditions - People with coronary heart disease (%)
Medical Conditions - People with angina pectoris (%)
Medical Conditions - People who ever had heart attack (%)
Medical Conditions - People who ever had stroke (%)
Medical Conditions - People with emphysema (%)
Medical Conditions - People with thyroid problem (%)
Medical Conditions - People with chronic bronchitis (%)
Medical Conditions - People with any liver condition (%)
Medical Conditions - People who ever had cancer or malignancy (%)
Mental Health - People who have little interest in doing things (%)
Mental Health - People feeling down, depressed, or hopeless (%)
Mental Health - People who have trouble sleeping or sleeping too much (%)
Mental Health - People feeling tired or having little energy (%)
Mental Health - People with poor appetite or overeating (%)
Mental Health - People feeling bad about themself (%)
Mental Health - People who have trouble concentrating on things (%)
Mental Health - People moving or speaking slowly or too fast (%)
Mental Health - People having thoughts they would be better off dead (%)
Oral Health - Average years since last visit a dentist
Oral Health - People embarrassed because of mouth (%)
Oral Health - People with gum disease (%)
Oral Health - General health of teeth and gums (%)
Oral Health - Average days a week using dental floss/device
Oral Health - Average days a week using mouthwash for dental problem
Oral Health - Average number of teeth
Pesticide Use - Households using pesticides to control insects (%)
Pesticide Use - Households using pesticides to kill weeds (%)
Physical Activity - People doing vigorous-intensity work activities (%)
Physical Activity - People doing moderate-intensity work activities (%)
Physical Activity - People walking or bicycling (%)
Physical Activity - People doing vigorous-intensity recreational activities (%)
Physical Activity - People doing moderate-intensity recreational activities (%)
Physical Activity - Average hours a day doing sedentary activities
Physical Activity - Average hours a day watching TV or videos
Physical Activity - Average hours a day using computer
Physical Functioning - People having limitations keeping them from working (%)
Physical Functioning - People limited in amount of work they can do (%)
Physical Functioning - People that need special equipment to walk (%)
Physical Functioning - People experiencing confusion/memory problems (%)
Physical Functioning - People requiring special healthcare equipment (%)
Prescription Medications - Average number of prescription medicines taking
Preventive Aspirin Use - Adults 40+ taking low-dose aspirin (%)
Reproductive Health - Vaginal deliveries (%)
Reproductive Health - Cesarean deliveries (%)
Reproductive Health - Deliveries resulted in a live birth (%)
Reproductive Health - Pregnancies resulted in a delivery (%)
Reproductive Health - Women breastfeeding newborns (%)
Reproductive Health - Women that had a hysterectomy (%)
Reproductive Health - Women that had both ovaries removed (%)
Reproductive Health - Women that have ever taken birth control pills (%)
Reproductive Health - Women taking birth control pills (%)
Reproductive Health - Women that have ever used Depo-Provera or injectables (%)
Reproductive Health - Women that have ever used female hormones (%)
Sexual Behavior - People 18+ that ever had sex (vaginal, anal, or oral) (%)
Sexual Behavior - Males 18+ that ever had vaginal sex with a woman (%)
Sexual Behavior - Males 18+ that ever performed oral sex on a woman (%)
Sexual Behavior - Males 18+ that ever had anal sex with a woman (%)
Sexual Behavior - Males 18+ that ever had any sex with a man (%)
Sexual Behavior - Females 18+ that ever had vaginal sex with a man (%)
Sexual Behavior - Females 18+ that ever performed oral sex on a man (%)
Sexual Behavior - Females 18+ that ever had anal sex with a man (%)
Sexual Behavior - Females 18+ that ever had any kind of sex with a woman (%)
Sexual Behavior - Average age people first had sex
Sexual Behavior - Average number of female sex partners in lifetime (males 18+)
Sexual Behavior - Average number of female vaginal sex partners in lifetime (males 18+)
Sexual Behavior - Average age people first performed oral sex on a woman (18+)
Sexual Behavior - Average number of woman performed oral sex on in lifetime (18+)
Sexual Behavior - Average number of male sex partners in lifetime (males 18+)
Sexual Behavior - Average number of male anal sex partners in lifetime (males 18+)
Sexual Behavior - Average age people first performed oral sex on a man (18+)
Sexual Behavior - Average number of male oral sex partners in lifetime (18+)
Sexual Behavior - People using protection when performing oral sex (%)
Sexual Behavior - Average number of times people have vaginal or anal sex a year
Sexual Behavior - People having sex without condom (%)
Sexual Behavior - Average number of male sex partners in lifetime (females 18+)
Sexual Behavior - Average number of male vaginal sex partners in lifetime (females 18+)
Sexual Behavior - Average number of female sex partners in lifetime (females 18+)
Sexual Behavior - Circumcised males 18+ (%)
Sleep Disorders - Average hours sleeping at night
Sleep Disorders - People that has trouble sleeping (%)
Smoking-Cigarette Use - People smoking cigarettes (%)
Taste & Smell - People 40+ having problems with smell (%)
Taste & Smell - People 40+ having problems with taste (%)
Taste & Smell - People 40+ that ever had wisdom teeth removed (%)
Taste & Smell - People 40+ that ever had tonsils teeth removed (%)
Taste & Smell - People 40+ that ever had a loss of consciousness because of a head injury (%)
Taste & Smell - People 40+ that ever had a broken nose or other serious injury to face or skull (%)
Taste & Smell - People 40+ that ever had two or more sinus infections (%)
Weight - Average height (inches)
Weight - Average weight (pounds)
Weight - Average BMI
Weight - People that are obese (%)
Weight - People that ever were obese (%)
Weight - People trying to lose weight (%)
According to our research of Washington and other state lists, there were 7 registered sex offenders living in Kirkland, Washington as of April 27, 2024 . The ratio of all residents to sex offenders in Kirkland is 12,674 to 1.The ratio of registered sex offenders to all residents in this city is much lower than the state average.
The City-Data.com crime index weighs serious crimes and violent crimes more heavily. Higher means more crime, U.S. average is 246.1. It adjusts for the number of visitors and daily workers commuting into cities.
- means the value is smaller than the state average.
- means the value is about the same as the state average.
- means the value is bigger than the state average.
- means the value is much bigger than the state average.
Crime rate in Kirkland detailed stats: murders, rapes, robberies, assaults, burglaries, thefts, arson Officers per 1,000 residents here:
1.08Washington average:
1.35
Latest news from Kirkland, WA collected exclusively by city-data.com from local newspapers, TV, and radio stations
Ancestries: American (6.5%), German (6.1%), English (5.5%), European (5.2%), Irish (4.0%), Iranian (2.6%).
Current Local Time:
Land area: 10.7 square miles.
Population density: 8,632 people per square mile (high).
23,491 residents are foreign born (13.8% Asia , 4.6% Europe , 3.9% Latin America ).
This city:
25.4%Washington:
14.9%
Median real estate property taxes paid for housing units with mortgages in 2022: $6,535 (0.6%)Median real estate property taxes paid for housing units with no mortgage in 2022: $7,627 (0.7%)
Nearest city with pop. 50,000+: East Seattle, WA (5.0 miles
Nearest city with pop. 1,000,000+: Los Angeles, CA
Nearest cities:
Latitude: 47.69 N, Longitude: 122.19 W
Nickname or alias (official or unofficial): Gateway to Seattle - adopted in 1926
Daytime population change due to commuting: +1,214 (+1.3%)Workers who live and work in this city: 28,781 (56.3%)
Property values in Kirkland, WA
Kirkland tourist attractions:
Single-family new house construction building permits:
2022: 299 buildings , average cost: $334,7002021: 327 buildings , average cost: $359,4002020: 419 buildings , average cost: $297,9002019: 291 buildings , average cost: $500,0002018: 288 buildings , average cost: $495,9002017: 328 buildings , average cost: $471,1002016: 312 buildings , average cost: $449,2002015: 313 buildings , average cost: $529,6002014: 241 buildings , average cost: $418,9002013: 235 buildings , average cost: $338,0002012: 171 buildings , average cost: $345,2002011: 97 buildings , average cost: $356,5002010: 74 buildings , average cost: $356,1002009: 42 buildings , average cost: $419,5002008: 127 buildings , average cost: $346,6002007: 227 buildings , average cost: $376,4002006: 236 buildings , average cost: $366,0002005: 227 buildings , average cost: $342,9002004: 191 buildings , average cost: $307,0002003: 172 buildings , average cost: $319,3002002: 137 buildings , average cost: $320,5002001: 163 buildings , average cost: $288,7002000: 142 buildings , average cost: $277,1001999: 210 buildings , average cost: $259,2001998: 124 buildings , average cost: $244,4001997: 193 buildings , average cost: $204,300Unemployment in December 2023:
Population change in the 1990s: +3,430 (+8.2%).
Most common occupations in Kirkland, WA (%)
Both Males Females
Computer specialists (10.5%)
Other management occupations, except farmers and farm managers (9.7%)
Cooks and food preparation workers (4.5%)
Engineers (3.4%)
Top executives (2.9%)
Building and grounds cleaning and maintenance occupations (2.6%)
Advertising, marketing, promotions, public relations, and sales managers (1.9%)
Computer specialists (15.9%)
Other management occupations, except farmers and farm managers (10.8%)
Engineers (5.4%)
Cooks and food preparation workers (4.1%)
Top executives (4.0%)
Building and grounds cleaning and maintenance occupations (3.2%)
Operations specialties managers, except financial managers (2.6%)
Other management occupations, except farmers and farm managers (8.4%)
Cooks and food preparation workers (4.9%)
Computer specialists (3.8%)
Secretaries and administrative assistants (3.1%)
Other office and administrative support workers, including supervisors (3.1%)
Registered nurses (3.0%)
Supervisors and other personal care and service workers, except child care workers (2.6%)
Earthquake activity:
Kirkland-area historical earthquake activity is significantly above Washington state average. It is 1286% greater than the overall U.S. average. On 4/13/1949 at 19:55:42, a magnitude 7.0 (7.0 UK, Class: Major, Intensity: VIII - XII) earthquake occurred 33.4 miles away from Kirkland center, causing $80,000,000 total damage On 2/28/2001 at 18:54:32, a magnitude 6.8 (6.8 MD, Depth: 32.2 mi, Class: Strong, Intensity: VII - IX) earthquake occurred 44.8 miles away from the city center On 2/28/2001 at 18:54:32, a magnitude 6.8 (6.5 MB, 6.6 MS, 6.8 MW) earthquake occurred 45.0 miles away from the city center, causing $2,000,000,000 total damage and $305,000,000 insured lossesOn 4/29/1965 at 15:28:43, a magnitude 6.6 (6.6 UK) earthquake occurred 26.4 miles away from the city center, causing $28,000,000 total damage On 7/3/1999 at 01:43:54, a magnitude 5.8 (5.4 MB, 5.5 MS, 5.8 MW, 5.3 ME, Depth: 25.2 mi, Class: Moderate, Intensity: VI - VII) earthquake occurred 65.2 miles away from the city center On 5/3/1996 at 04:04:22, a magnitude 5.5 (5.2 MB, 5.3 MD, 5.5 ML, Depth: 2.5 mi) earthquake occurred 23.2 miles away from the city center Magnitude types: body-wave magnitude (MB), duration magnitude (MD), energy magnitude (ME), local magnitude (ML), surface-wave magnitude (MS), moment magnitude (MW) Natural disasters: The number of natural disasters in King County (30) is a lot greater than the US average (15).Major Disasters (Presidential) Declared: 27Emergencies Declared: 1Floods: 21, Storms: 16, Mudslides: 11, Landslides: 9, Winter Storms: 7, Earthquakes: 2, Heavy Rains: 2, Winds: 2, Hurricane: 1, Snow: 1, Volcanic Eruption: 1, Other: 1 (Note: some incidents may be assigned to more than one category). Main business address for: CELEBRATE EXPRESS, INC. RETAIL-MISC GENERAL MERCHANDISE STORES ), NEXTEL PARTNERS INC RADIO TELEPHONE COMMUNICATIONS ), HouseValues, Inc. REAL ESTATE AGENTS & MANAGERS (FOR OTHERS) ), CAPTARIS INC SERVICES-PREPACKAGED SOFTWARE ), AMERICAN UNITED GLOBAL INC WHOLESALE-CONSTRUCTION & MINING (NO PETRO) MACHINERY & EQUIP ).
Hospitals and medical centers in Kirkland: EVERGREEN HOSPICE SERVICES (12822 124TH LANE NE) EVERGREEN HOSPITAL MEDICAL CENTER (Government - Hospital District or Authority, provides emergency services, 12040 NE 128TH STREET) FAIRFAX HOSPITAL (10200 NE 132ND STREET) EVERGREEN VISTA CONVALESCENT CENTER (11800 NORTHEAST 128TH STREET)
KIRKLAND CONVALESCENT CENTER (6505 LAKEVIEW DRIVE)
LAKE VUE GARDENS CONVALESCENT CENTER (10101 NE 120TH)
LIFE CARE CENTER OF KIRKLAND (10101 NORTHEAST 120TH STREET)
NKC TOTEM LAKE KIDNEY CENTER (12303 NE 130TH LN, SUITE 300)
EVERGREEN HOME HEALTH SERVICES (13905 NE 128TH ST)
Heliports located in Kirkland: Amtrak stations near Kirkland: 9 miles: SEATTLE (303 S. JACKSON ST.) Services: ticket office, fully wheelchair accessible, enclosed waiting area, public restrooms, public payphones, vending machines, paid short-term parking, paid long-term parking, call for car rental service, taxi stand, intercity bus service, public transit connection.
13 miles: EDMONDS (211 RAILROAD AVE.) Services: ticket office, fully wheelchair accessible, enclosed waiting area, public restrooms, public payphones, vending machines, paid short-term parking, paid long-term parking, call for taxi service, public transit connection.
16 miles: MONROE (RED BARN UNOCAL) - Bus Station
Colleges/Universities in Kirkland: Lake Washington Institute of Technology Full-time enrollment: 2,947; Location: 11605 132nd Ave NE; Public; Website: www.lwtech.edu)
Northwest University Full-time enrollment: 1,462; Location: 5520 108th Ave NE; Private, not-for-profit; Website: www.northwestu.edu; Offers Doctor's degree )
Other colleges/universities with over 2000 students near Kirkland:
Cascadia Community College (about 6 miles; Bothell, WA ; Full-time enrollment: 2,238)
University of Washington-Bothell Campus (about 6 miles; Bothell, WA ; FT enrollment: 3,902)
University of Washington-Seattle Campus (about 7 miles; Seattle, WA ; FT enrollment: 39,445)
Seattle Community College-North Campus (about 7 miles; Seattle, WA ; FT enrollment: 4,220)
Bellevue College (about 8 miles; Bellevue, WA ; FT enrollment: 10,940)
Seattle Central College (about 8 miles; Seattle, WA ; FT enrollment: 5,825)
Seattle University (about 8 miles; Seattle, WA ; FT enrollment: 5,808)
Biggest public high schools in Kirkland: LAKE WASHINGTON TECHNICAL ACADEMY Location: 11605 132ND AVE NE, Grades: 11-12)
GATEWAY TO COLLEGE AT LWIT Location: 11605 132ND AVE NE, Grades: 11-12)LWIT 1418 CONTRACT BELLEVUE COLLEGE CEO Location: 11605 132ND AVE NE, Grades: 11-12)
FINN HILL MIDDLE SCHOOL Location: 8040 NE 132ND ST, Grades: 6-9)JUANITA HIGH Location: 10601 NE 132ND, Grades: 9-12)KAMIAKIN MIDDLE SCHOOL Location: 14111 132ND AVE NE, Grades: 6-9)
KIRKLAND MIDDLE SCHOOL Location: 430 18TH AVE, Grades: 6-9)
LAKE WASHINGTON HIGH Location: 12033 NE 80TH, Grades: 9-12)EMERSON HIGH SCHOOL Location: 10903 NE 53RD ST, Grades: 9-12)
NORTHSTAR MIDDLE SCHOOL Location: 10903 NE 53RD ST, Grades: 6-9)Private high school in Kirkland: EASTSIDE PREPARATORY SCHOOL Students: 240, Location: 10635 NE 38TH PL, Grades: 5-12)
Biggest public elementary/middle schools in Kirkland: BELL ELEMENTARY Location: 11212 NE 112TH, Grades: KG-6)FRANKLIN ELEMENTARY Location: 12434 NE 60TH, Grades: KG-6)SANDBURG ELEMENTARY Location: 12801 - 84TH AVE NE, Grades: KG-6)KELLER ELEMENTARY Location: 13820 - 108TH NE, Grades: KG-6)MUIR ELEMENTARY Location: 14012 132ND AVE NE, Grades: KG-6)JUANITA ELEMENTARY Location: 9635 NE 132ND, Grades: KG-6)COMMUNITY SCHOOL Location: 11133 NE 65TH, Grades: 1-6)LAKEVIEW ELEMENTARY Location: 10400 NE 68TH, Grades: KG-6)TWAIN ELEMENTARY Location: 9525 130TH AVE NE, Grades: KG-6)KIRK ELEMENTARY Location: 1312 6TH STREET, Grades: KG-6)Private elementary/middle schools in Kirkland: HOLY FAMILY PARISH SCHOOL Students: 265, Location: 7300 120TH AVE NE, Grades: PK-8)
KIRKLAND SEVENTH-DAY ADVENTIST SCHOOL Students: 119, Location: 5320 108TH AVE NE, Grades: KG-8)
COUNTRYSIDE MONTESSORI SCHOOL Students: 87, Location: 13630 100TH AVE NE, Grades: PK-1)
CEDAR CREST ACADEMY KIRKLAND Students: 80, Location: 10406 NE 37TH CIR, Grades: PK-1)
See full list of schools located in Kirkland User-submitted facts and corrections:
Other colleges/universities with over 2000 students near Kirkland: University of Washington (about 10 miles; SEATTLE, WA; Full-time enrollment: 39,000)
Notable locations in Kirkland: (A) , Hassett Business Park (B) , Houghton Plaza (C) , Houghton Park and Ride (D) , Kingsgate Park and Ride (E) , South Kirkland Park and Ride (F) , Rose Hill Village (G) , Kirkland Parkplace (H) , Houghton Center (I) , Totem Square (J) , Kirkland Yacht Club (K) , Kirkland Marina Park (L) , Carillon Point Marina (M) , Yarrow Bay Marina (N) , King County Fire Protection District 34 Redmond Fire Department Medic 23 Quarters Evergreen Hospital (O) , Joshua Sears Building (P) , Peter Kirk Building (Q) , Campbell Building (R) , Northwest University Amundsen Music Center (S) , Kirkland Performance Center (T) . Display/hide their locations on the map
Shopping Centers: (1) , Juanita Village Shopping Center (2) , Totem Lake Shopping Center (3) . Display/hide their locations on the map
Main business address in Kirkland include: (A) , NEXTEL PARTNERS INC (B) , HouseValues, Inc. (C) , CAPTARIS INC (D) , AMERICAN UNITED GLOBAL INC (E) . Display/hide their locations on the map
Churches in Kirkland include: (A) , Juanita Community Church (B) , The City Church (C) , Holy Spirit Lutheran Church (D) , Northlake Unitarian Universalist Church (E) , Kirkland Congregational United Church of Christ (F) , Kirkland Church of the Nazarene (G) , Trinity Lutheran Church (H) , Lake Washington Christian Church (I) . Display/hide their locations on the map
Cemetery: (1) . Display/hide its location on the map
Lakes and reservoirs: (A) , Forbes Lake (B) , Kirkland Reservoir (C) . Display/hide their locations on the map
Creek: (A) . Display/hide its location on the map
Parks in Kirkland include: (1) , Houghton Beach Park (2) , Waverly Park (3) , Kiwanis Park (4) , Peter Kirk Memorial Park (5) , Crestwoods Park (6) , Mark Twain Park (7) . Display/hide their locations on the map
Tourist attractions:
Hotels:
Courts:
Birthplace of: JoAnne Carner - Professional golfer, Layne Staley - Musician, Ryan Hall (runner) - Athletics competitor, Caros Fodor - Martial artist, Jennie Reed - Racing cyclist, Del Bates - Baseball player, Duke Welker - Baseball player, Elizabeth McCagg - Rower, Micah Downs - College basketball player (Kansas Jayhawks), Michael O'Hearn - Bodybuilder.
King County has a predicted average indoor radon screening level less than 2 pCi/L (pico curies per liter) - Low Potential Average household size: This city:
2.1 peopleWashington:
2.5 people
Percentage of family households: This city:
53.5%Whole state:
64.4%
Percentage of households with unmarried partners: This city:
6.9%Whole state:
7.7%
Likely homosexual households (counted as self-reported same-sex unmarried-partner households)
Lesbian couples: 0.3% of all households Gay men: 0.3% of all households
People in group quarters in Kirkland in 2010:
396 people in college/university student housing
150 people in nursing facilities/skilled-nursing facilities
33 people in group homes intended for adults
17 people in local jails and other municipal confinement facilities
16 people in other noninstitutional facilities
7 people in workers' group living quarters and job corps centers
6 people in in-patient hospice facilities
3 people in residential treatment centers for adults
2 people in hospitals with patients who have no usual home elsewhere
People in group quarters in Kirkland in 2000:
378 people in college dormitories (includes college quarters off campus)
266 people in nursing homes
187 people in other noninstitutional group quarters
9 people in institutions for the blind
4 people in local jails and other confinement facilities (including police lockups)
4 people in religious group quarters
Banks with most branches in Kirkland (2011 data):
JPMorgan Chase Bank, National Association: Kingsgate, Kirkland Branch, Bridle Trails, Totem Hill Branch, Totem Lake Branch. Info updated 2011/11/10: Bank assets: $1,811,678.0 mil, Deposits: $1,190,738.0 mil, headquarters in Columbus, OH, positive income , International Specialization, 5577 total offices , Holding Company: Jpmorgan Chase & Co.
Bank of America, National Association: Kirkland Branch, Kingsgate Safeway Branch, Juanita Branch, Totem Lake Branch, Houghton Branch. Info updated 2009/11/18: Bank assets: $1,451,969.3 mil, Deposits: $1,077,176.8 mil, headquarters in Charlotte, NC, positive income , 5782 total offices , Holding Company: Bank Of America Corporation
Wells Fargo Bank, National Association: Totem Lake Branch, Juanita Village Branch, Kirkland Branch, Bridle Trails Branch. Info updated 2011/04/05: Bank assets: $1,161,490.0 mil, Deposits: $905,653.0 mil, headquarters in Sioux Falls, SD, positive income , 6395 total offices , Holding Company: Wells Fargo & Company
Washington Federal: Kirkland Branch, Juanita Branch, Kirkland Branch. Info updated 2011/12/19: Bank assets: $13,653.0 mil, Deposits: $8,905.8 mil, headquarters in Seattle, WA, positive income , Mortgage Lending Specialization, 174 total offices
Union Bank, National Association: Totem Lake Branch at 12507 116th Avenue Ne, branch established on 2001/07/09; Kirkland Branch at 132 Kirkland Avenue, branch established on 1993/12/31. Info updated 2011/09/01: Bank assets: $88,967.5 mil, Deposits: $65,286.4 mil, headquarters in San Francisco, CA, positive income , Commercial Lending Specialization, 403 total offices , Holding Company: Mitsubishi Ufj Financial Group, Inc.
U.S. Bank National Association: Kirkland Branch at 177 Central Way, branch established on 1960/12/22; Juanita Branch at 13233 100th Avenue Northeast, branch established on 1971/03/17. Info updated 2012/01/30: Bank assets: $330,470.8 mil, Deposits: $236,091.5 mil, headquarters in Cincinnati, OH, positive income , 3121 total offices , Holding Company: U.S. Bancorp
KeyBank National Association: Totem Lake Branch at 12604 Totem Lake Blvd, branch established on 1996/02/20; Kirkland Branch at 327 Park Place Center, branch established on 1989/10/16. Info updated 2008/03/03: Bank assets: $86,198.8 mil, Deposits: $64,214.8 mil, headquarters in Cleveland, OH, positive income , Commercial Lending Specialization, 1067 total offices , Holding Company: Keycorp
Banner Bank: Kirkland Branch at 202 Kirkland Ave, branch established on 1999/02/01. Info updated 2011/05/03: Bank assets: $4,048.2 mil, Deposits: $3,348.4 mil, headquarters in Walla Walla, WA, positive income , Commercial Lending Specialization, 87 total offices , Holding Company: Banner Corporation
Sterling Savings Bank: Kirkland Branch at 230 Main Street, branch established on 2006/03/01. Info updated 2012/03/21: Bank assets: $9,207.8 mil, Deposits: $6,454.1 mil, headquarters in Spokane, WA, positive income , Commercial Lending Specialization, 192 total offices , Holding Company: Sterling Financial Corporation
For population 15 years and over in Kirkland:
Never married: 32.6%Now married: 51.6%Separated: 0.3%Widowed: 3.0%Divorced: 12.5% For population 25 years and over in Kirkland:
High school or higher: 96.7%Bachelor's degree or higher: 67.4%Graduate or professional degree: 30.1%Unemployed: 3.1%Mean travel time to work (commute): 14.3 minutes
Education Gini index (Inequality in education) Here:
9.9Washington average:
11.6
Religion statistics for Kirkland, WA (based on King County data)
Religion Adherents Congregations Catholic 278,340 71 Evangelical Protestant 204,523 711 Other 119,713 329 Mainline Protestant 104,806 304 Orthodox 12,257 20 Black Protestant 7,030 24 None 1,204,580 -
Source: Clifford Grammich, Kirk Hadaway, Richard Houseal, Dale E.Jones, Alexei Krindatch, Richie Stanley and Richard H.Taylor. 2012. 2010 U.S.Religion Census: Religious Congregations & Membership Study. Association of Statisticians of American Religious Bodies. Jones, Dale E., et al. 2002. Congregations and Membership in the United States 2000. Nashville, TN: Glenmary Research Center. Graphs represent county-level data
Food Environment Statistics: Number of grocery stores : 439King County :
2.37 / 10,000 pop.State :
2.06 / 10,000 pop.
Number of supercenters and club stores : 29This county :
0.16 / 10,000 pop.Washington :
0.19 / 10,000 pop.
Number of convenience stores (no gas) : 220Here :
1.19 / 10,000 pop.Washington :
1.18 / 10,000 pop.
Number of convenience stores (with gas) : 399This county :
2.16 / 10,000 pop.Washington :
2.67 / 10,000 pop.
Number of full-service restaurants : 2,027King County :
10.95 / 10,000 pop.State :
8.26 / 10,000 pop.
Adult obesity rate : King County :
20.5%Washington :
25.7%
Low-income preschool obesity rate : King County :
14.6%Washington :
13.9%
Health and Nutrition: Healthy diet rate : Kirkland:
51.8%Washington:
49.9%
Average overall health of teeth and gums : Here:
49.8%Washington:
47.2%
Average BMI : Kirkland:
28.1Washington:
28.4
People feeling badly about themselves : Here:
20.0%Washington:
20.9%
People not drinking alcohol at all : Kirkland:
10.4%Washington:
10.5%
Average hours sleeping at night : Kirkland:
6.8Washington:
6.8
Overweight people : Here:
31.8%Washington:
32.8%
General health condition : This city:
59.1%Washington:
56.8%
Average condition of hearing : Kirkland:
80.8%Washington:
79.4%
More about Health and Nutrition of Kirkland, WA Residents
Local government employment and payroll (March 2022)
Function
Full-time employees
Monthly full-time payroll
Average yearly full-time wage
Part-time employees
Monthly part-time payroll
Other and Unallocable
111 $970,858 $104,958 5 $16,850 Firefighters
108 $1,230,040 $136,671 0 $0 Police Protection - Officers
101 $913,195 $108,498 0 $0 Other Government Administration
77 $703,192 $109,588 11 $22,913 Financial Administration
62 $520,126 $100,670 4 $12,148 Parks and Recreation
61 $472,232 $92,898 29 $59,902 Police - Other
28 $261,488 $112,066 0 $0 Judicial and Legal
21 $170,488 $97,422 5 $15,867 Correction
16 $125,256 $93,942 0 $0 Natural Resources
14 $88,753 $76,074 0 $0 Sewerage
14 $90,800 $77,829 1 $3,838 Streets and Highways
12 $95,704 $95,704 0 $0 Fire - Other
7 $74,135 $127,089 0 $0 Solid Waste Management
3 $25,331 $101,324 1 $6,249
Totals for Government
635 $5,741,599 $108,503 56 $137,767
Kirkland government finances - Expenditure in 2021 (per resident):
Construction - Regular Highways: $22,221,000 ($241.14)
Parks and Recreation: $7,406,000 ($80.37)Local Fire Protection: $3,965,000 ($43.03)General - Other: $3,382,000 ($36.70)Police Protection: $83,000 ($0.90)Transit Utilities: $59,000 ($0.64)Current Operations - Police Protection: $27,320,000 ($296.47)
Local Fire Protection: $24,339,000 ($264.12)Sewerage: $23,115,000 ($250.84)Solid Waste Management: $20,174,000 ($218.92)Water Utilities: $14,629,000 ($158.75)Central Staff Services: $11,846,000 ($128.55)Regular Highways: $10,388,000 ($112.73)Parks and Recreation: $7,426,000 ($80.59)Financial Administration: $6,098,000 ($66.17)General - Other: $4,699,000 ($50.99)Housing and Community Development: $3,590,000 ($38.96)Correctional Institutions: $3,410,000 ($37.00)Public Welfare - Other: $2,964,000 ($32.16)Judicial and Legal Services: $2,769,000 ($30.05)Protective Inspection and Regulation - Other: $2,018,000 ($21.90)Natural Resources - Other: $1,967,000 ($21.35)Health - Other: $270,000 ($2.93)Parking Facilities: $74,000 ($0.80)Miscellaneous Commercial Activities - Other: $67,000 ($0.73)General - Interest on Debt: $1,651,000 ($17.92)
Other Capital Outlay - General - Other: $47,000 ($0.51)
Police Protection: $11,000 ($0.12)Miscellaneous Commercial Activities - Other: $1,000 ($0.01)Total Salaries and Wages: $64,577,000 ($700.77)
Water Utilities - Interest on Debt: $18,000 ($0.20)
Kirkland government finances - Revenue in 2021 (per resident):
Charges - Sewerage: $26,509,000 ($287.67)
Other: $19,715,000 ($213.94)Solid Waste Management: $18,289,000 ($198.47)Natural Resources - Other: $476,000 ($5.17)Miscellaneous Commercial Activities: $66,000 ($0.72)Regular Highways: $57,000 ($0.62)Parks and Recreation: $55,000 ($0.60)Federal Intergovernmental - Other: $302,000 ($3.28)
Health and Hospitals: $21,000 ($0.23)Local Intergovernmental - Other: $1,399,000 ($15.18)
Miscellaneous - Interest Earnings: $6,121,000 ($66.42)
Fines and Forfeits: $1,934,000 ($20.99)Donations From Private Sources: $1,714,000 ($18.60)Rents: $683,000 ($7.41)General Revenue - Other: $462,000 ($5.01)Sale of Property: $343,000 ($3.72)Revenue - Water Utilities: $14,597,000 ($158.40)
State Intergovernmental - Other: $7,741,000 ($84.00)
Highways: $2,604,000 ($28.26)Health and Hospitals: $2,068,000 ($22.44)General Local Government Support: $1,302,000 ($14.13)Housing and Community Development: $78,000 ($0.85)Tax - General Sales and Gross Receipts: $37,741,000 ($409.56)
Property: $32,115,000 ($348.50)Public Utilities Sales: $17,577,000 ($190.74)Documentary and Stock Transfer: $12,964,000 ($140.68)Other License: $8,671,000 ($94.10)Occupation and Business License - Other: $4,239,000 ($46.00)Amusements Sales: $680,000 ($7.38)Other Selective Sales: $201,000 ($2.18)
Kirkland government finances - Debt in 2021 (per resident):
Long Term Debt - Beginning Outstanding - Unspecified Public Purpose: $55,759,000 ($605.08)
Outstanding Unspecified Public Purpose: $51,550,000 ($559.41)Retired Unspecified Public Purpose: $33,573,000 ($364.33)Issue, Unspecified Public Purpose: $29,363,000 ($318.64)
6.69% of this county's 2021 resident taxpayers lived in other counties in 2020 ($106,002 average adjusted gross income )
Here:
6.69%Washington average:
7.53%
0.02% of residents moved from foreign countries ($181 average AGI )King County:
0.02%Washington average:
0.05%
Top counties from which taxpayers relocated into this county between 2020 and 2021:
7.71% of this county's 2020 resident taxpayers moved to other counties in 2021 ($123,052 average adjusted gross income )
Here:
7.71%Washington average:
7.40%
0.01% of residents moved to foreign countries ($183 average AGI )King County:
0.01%Washington average:
0.04%
Top counties to which taxpayers relocated from this county between 2020 and 2021:
Businesses in Kirkland, WA
Name Count Name Count
24 Hour Fitness 1 La Quinta 1 7-Eleven 5 Little Caesars Pizza 1 AT&T 2 Marriott 1 Ace Hardware 1 MasterBrand Cabinets 2 Albertsons 1 Mazda 1 Baskin-Robbins 2 McDonald's 4 Baymont Inn 1 Motel 6 1 Ben & Jerry's 1 Nike 8 Big O Tires 1 OfficeMax 1 Blockbuster 2 Olive Garden 1 Burger King 1 Outback 1 Chevrolet 1 Outback Steakhouse 1 Comfort Inn 1 Papa John's Pizza 1 Costco 1 Pizza Hut 2 Curves 2 Quiznos 1 DHL 1 RadioShack 1 Dairy Queen 2 Rite Aid 2 Dennys 1 Safeway 3 Discount Tire 1 Starbucks 13 Famous Footwear 1 Subaru 1 FedEx 10 Subway 7 Firestone Complete Auto Care 1 T-Mobile 3 Ford 1 Taco Bell 1 GNC 2 Toyota 1 H&R Block 2 Trader Joe's 1 Honda 1 U-Haul 2 Jack In The Box 1 UPS 9 Jamba Juice 1 Volkswagen 1 Jimmy John's 1 Vons 3 Jones New York 3 Walgreens 2 KFC 1 Wendy's 2 Kroger 4
Strongest AM radio stations in Kirkland:
KARR (1460 AM; 5 kW; KIRKLAND, WA; Owner: FAMILY STATIONS, INC.)
KIXI (880 AM; 50 kW; MERCER ISLAND/SEATTL, WA; Owner: BELLEVUE RADIO, INC.)
KRKO (1380 AM; 50 kW; EVERETT, WA; Owner: S-R BROADCASTING, CO.)
KKNW (1150 AM; 10 kW; SEATTLE, WA; Owner: ORCA RADIO, INC.)
KKOL (1300 AM; 50 kW; SEATTLE, WA; Owner: INSPIRATION MEDIA, INC.)
KOMO (1000 AM; 50 kW; SEATTLE, WA; Owner: FISHER BROADCASTING - SEATTLE RADIO, L.L.C.)
KIRO (710 AM; 50 kW; SEATTLE, WA; Owner: ENTERCOM SEATTLE LICENSE, LLC)
KGNW (820 AM; 50 kW; BURIEN-SEATTLE, WA; Owner: INSPIRATION MEDIA, INC.)
KTTH (770 AM; 50 kW; SEATTLE, WA; Owner: ENTERCOM SEATTLE LICENSE, LLC)
KYCW (1090 AM; 50 kW; SEATTLE, WA; Owner: INFINITY RADIO SUBSIDIARY OPERATIONS INC.)
KCIS (630 AM; 5 kW; EDMONDS, WA; Owner: CRISTA MINISTRIES)
KXPA (1540 AM; 5 kW; BELLEVUE, WA; Owner: MULTICULTURAL RADIO BROADCASTING, INC.)
KJR (950 AM; 50 kW; SEATTLE, WA)
Strongest FM radio stations in Kirkland:
KISW (99.9 FM; SEATTLE, WA; Owner: ENTERCOM SEATTLE LICENSE, LLC)
KQBZ (100.7 FM; SEATTLE, WA; Owner: ENTERCOM SEATTLE LICENSE, LLC)
KMTT (103.7 FM; TACOMA, WA; Owner: ENTERCOM SEATTLE LICENSE, LLC)
KNDD (107.7 FM; SEATTLE, WA; Owner: ENTERCOM SEATTLE LICENSE, LLC)
KYPT (96.5 FM; SEATTLE, WA; Owner: INFINITY RADIO SUBSIDIARY OPERATIONS INC.)
KRWM (106.9 FM; BREMERTON, WA; Owner: SEASCAPE RADIO, INC.)
KBSG-FM (97.3 FM; TACOMA, WA; Owner: ENTERCOM SEATTLE LICENSE, LLC)
KCMS (105.3 FM; EDMONDS, WA; Owner: CRISTA MINISTRIES, INC.)
KBKS (106.1 FM; TACOMA, WA; Owner: INFINITY RADIO SUBSIDIARY OPERATIONS INC.)
KING-FM (98.1 FM; SEATTLE, WA; Owner: CLASSIC RADIO, INC.)
KLSY-FM (92.5 FM; BELLEVUE, WA; Owner: BELLEVUE RADIO INC.)
KPLU-FM (88.5 FM; TACOMA, WA; Owner: PACIFIC LUTHERAN UNIVERSITY, INC.)
KWJZ (98.9 FM; SEATTLE, WA; Owner: ORCA RADIO, INC.)
KZOK-FM (102.5 FM; SEATTLE, WA; Owner: INFINITY RADIO SUBSIDIARY OPERATIONS INC.)
KMPS-FM (94.1 FM; SEATTLE, WA; Owner: INFINITY RADIO SUBSIDIARY OPERATIONS INC.)
KJR-FM (95.7 FM; SEATTLE, WA; Owner: ACKERLEY MEDIA GROUP, INC.)
KUBE (93.3 FM; SEATTLE, WA; Owner: ACKERLEY MEDIA GROUP, INC.)
KPLZ-FM (101.5 FM; SEATTLE, WA; Owner: FISHER BROADCASTING - SEATTLE RADIO, L.L.C.)
KUOW (94.9 FM; SEATTLE, WA; Owner: THE UNIVERSITY OF WASHINGTON)
KNHC (89.5 FM; SEATTLE, WA; Owner: SEATTLE PUBLIC SCHOOLS)
TV broadcast stations around Kirkland:
KSTW (Channel 11; TACOMA, WA; Owner: UPN TELEVISION STATIONS INC.)
KING-TV (Channel 5; SEATTLE, WA; Owner: KING BROADCASTING COMPANY)
KTWB-TV (Channel 22; SEATTLE, WA; Owner: TRIBUNE TELEVISION HOLDINGS, INC.)
K58DP (Channel 58; SEATTLE, WA; Owner: WORD OF GOD FELLOWSHIP, INC.)
KCTS-TV (Channel 9; SEATTLE, WA; Owner: KCTS TELEVISION)
KOMO-TV (Channel 4; SEATTLE, WA; Owner: FISHER BROADCASTING - SEATTLE TV, L.L.C.)
KIRO-TV (Channel 7; SEATTLE, WA; Owner: KIRO-TV HOLDINGS, INC.)
K57HB (Channel 57; EUREKA, CA; Owner: MS COMMUNICATIONS, LLC)
KONG-TV (Channel 16; EVERETT, WA; Owner: KONG-TV, INC.)
K68DL (Channel 68; SEATTLE, WA; Owner: THREE ANGELS BROADCASTING NETWORK)
KHCV (Channel 45; SEATTLE, WA; Owner: NORTH PACIFIC INTERNATIONAL TELEVISION, INC.)
KWPX (Channel 33; BELLEVUE, WA; Owner: PAXSON COMMUNICATIONS LICENSE COMPANY, LLC)
KWDK (Channel 56; TACOMA, WA; Owner: PUGET SOUND EDUCATIONAL TV, INC.)
KCPQ (Channel 13; TACOMA, WA; Owner: TRIBUNE TELEVISION NORTHWEST, INC.)
KWOG (Channel 51; BELLEVUE, WA; Owner: AFRICAN-AMERICAN BROADCASTING CO.OF BELLEVUE, INC.)
National Bridge Inventory (NBI) Statistics 31 Number of bridges325ft / 99.3m Total length $80,519,000 Total costs1,979,641 Total average daily traffic112,676 Total average daily truck traffic
New bridges - historical statistics
2 1900-1909 1 1950-1959 3 1960-1969 14 1970-1979 1 1980-1989 2 1990-1999 7 2000-2009 1 2010-2019
See full National Bridge Inventory statistics for Kirkland, WA
Home Mortgage Disclosure Act Aggregated Statistics For Year 2009(Based on 6 full and 6 partial tracts) A) FHA, FSA/RHS & VA B) Conventional C) Refinancings D) Home Improvement Loans E) Loans on Dwellings For 5+ Families F) Non-occupant Loans on Number Average Value Number Average Value Number Average Value Number Average Value Number Average Value Number Average Value
LOANS ORIGINATED 138 $316,978 357 $413,392 2,051 $309,811 45 $192,454 6 $3,112,223 153 $298,161 APPLICATIONS APPROVED, NOT ACCEPTED 9 $317,588 48 $416,401 230 $309,299 8 $167,719 0 $0 16 $210,658 APPLICATIONS DENIED 32 $347,568 53 $419,869 547 $369,694 11 $205,003 0 $0 64 $249,927 APPLICATIONS WITHDRAWN 18 $314,262 53 $402,964 387 $347,190 11 $215,325 0 $0 29 $293,412 FILES CLOSED FOR INCOMPLETENESS 6 $286,177 11 $493,222 74 $344,520 4 $296,515 0 $0 4 $343,715
Aggregated Statistics For Year 2008(Based on 6 full and 6 partial tracts) A) FHA, FSA/RHS & VA B) Conventional C) Refinancings D) Home Improvement Loans E) Loans on Dwellings For 5+ Families F) Non-occupant Loans on G) Loans On Manufactured Number Average Value Number Average Value Number Average Value Number Average Value Number Average Value Number Average Value Number Average Value
LOANS ORIGINATED 59 $297,278 536 $414,221 1,035 $338,468 64 $215,937 2 $1,013,385 142 $321,967 5 $48,200 APPLICATIONS APPROVED, NOT ACCEPTED 5 $295,466 84 $396,465 174 $326,479 13 $129,860 0 $0 26 $318,793 2 $97,595 APPLICATIONS DENIED 11 $316,861 113 $473,731 393 $380,632 35 $153,241 0 $0 60 $273,263 2 $199,965 APPLICATIONS WITHDRAWN 8 $320,964 71 $467,889 236 $345,412 13 $199,579 0 $0 32 $325,868 0 $0 FILES CLOSED FOR INCOMPLETENESS 0 $0 14 $409,987 39 $332,727 5 $158,424 0 $0 7 $302,730 0 $0
Aggregated Statistics For Year 2007(Based on 6 full and 6 partial tracts) A) FHA, FSA/RHS & VA B) Conventional C) Refinancings D) Home Improvement Loans E) Loans on Dwellings For 5+ Families F) Non-occupant Loans on G) Loans On Manufactured Number Average Value Number Average Value Number Average Value Number Average Value Number Average Value Number Average Value Number Average Value
LOANS ORIGINATED 4 $270,678 1,259 $374,008 1,299 $346,709 97 $180,519 8 $10,045,750 282 $312,033 2 $154,625 APPLICATIONS APPROVED, NOT ACCEPTED 0 $0 175 $361,349 194 $336,401 23 $175,684 0 $0 41 $426,012 1 $16,550 APPLICATIONS DENIED 2 $203,960 270 $357,696 388 $350,789 49 $226,186 1 $10,206,000 96 $361,314 2 $137,235 APPLICATIONS WITHDRAWN 0 $0 119 $379,331 242 $330,345 24 $184,444 0 $0 39 $337,675 0 $0 FILES CLOSED FOR INCOMPLETENESS 0 $0 28 $421,164 63 $335,333 10 $182,690 0 $0 5 $207,890 0 $0
Aggregated Statistics For Year 2006(Based on 6 full and 6 partial tracts) A) FHA, FSA/RHS & VA B) Conventional C) Refinancings D) Home Improvement Loans E) Loans on Dwellings For 5+ Families F) Non-occupant Loans on G) Loans On Manufactured Number Average Value Number Average Value Number Average Value Number Average Value Number Average Value Number Average Value Number Average Value
LOANS ORIGINATED 5 $221,260 2,318 $274,953 1,331 $295,602 117 $174,662 11 $3,149,070 491 $264,677 1 $179,210 APPLICATIONS APPROVED, NOT ACCEPTED 1 $96,720 300 $269,825 190 $287,989 25 $170,415 0 $0 67 $240,334 1 $23,760 APPLICATIONS DENIED 1 $316,980 429 $277,229 415 $308,032 49 $131,155 1 $21,780 117 $257,890 2 $221,065 APPLICATIONS WITHDRAWN 1 $186,510 284 $263,176 316 $291,011 27 $189,395 0 $0 65 $301,182 0 $0 FILES CLOSED FOR INCOMPLETENESS 2 $301,455 52 $276,643 51 $285,795 9 $145,753 0 $0 13 $255,894 0 $0
Aggregated Statistics For Year 2005(Based on 6 full and 6 partial tracts) A) FHA, FSA/RHS & VA B) Conventional C) Refinancings D) Home Improvement Loans E) Loans on Dwellings For 5+ Families F) Non-occupant Loans on G) Loans On Manufactured Number Average Value Number Average Value Number Average Value Number Average Value Number Average Value Number Average Value Number Average Value
LOANS ORIGINATED 7 $152,211 1,888 $253,841 1,463 $274,763 101 $204,610 8 $10,760,421 303 $251,649 0 $0 APPLICATIONS APPROVED, NOT ACCEPTED 2 $198,310 219 $277,728 198 $296,383 10 $248,699 2 $1,266,365 44 $194,208 0 $0 APPLICATIONS DENIED 4 $142,328 325 $260,692 424 $277,443 60 $118,788 0 $0 57 $286,280 3 $33,397 APPLICATIONS WITHDRAWN 1 $321,790 224 $279,066 319 $268,600 28 $156,644 0 $0 60 $225,032 1 $306,130 FILES CLOSED FOR INCOMPLETENESS 0 $0 29 $230,810 113 $267,907 6 $351,395 0 $0 8 $305,051 1 $215,000
Aggregated Statistics For Year 2004(Based on 6 full and 6 partial tracts) A) FHA, FSA/RHS & VA B) Conventional C) Refinancings D) Home Improvement Loans E) Loans on Dwellings For 5+ Families F) Non-occupant Loans on G) Loans On Manufactured Number Average Value Number Average Value Number Average Value Number Average Value Number Average Value Number Average Value Number Average Value
LOANS ORIGINATED 26 $166,155 1,506 $265,457 1,622 $257,495 85 $89,226 6 $317,232 278 $217,812 4 $166,200 APPLICATIONS APPROVED, NOT ACCEPTED 0 $0 161 $262,918 211 $236,399 16 $114,280 2 $212,295 26 $184,001 0 $0 APPLICATIONS DENIED 4 $179,972 179 $245,869 449 $257,645 55 $104,296 0 $0 50 $204,723 4 $131,380 APPLICATIONS WITHDRAWN 2 $155,585 150 $271,385 304 $226,767 22 $131,452 0 $0 30 $218,258 0 $0 FILES CLOSED FOR INCOMPLETENESS 2 $132,315 35 $234,619 155 $257,580 10 $137,297 0 $0 13 $221,328 0 $0
Aggregated Statistics For Year 2003(Based on 6 full and 6 partial tracts) A) FHA, FSA/RHS & VA B) Conventional C) Refinancings D) Home Improvement Loans E) Loans on Dwellings For 5+ Families F) Non-occupant Loans on Number Average Value Number Average Value Number Average Value Number Average Value Number Average Value Number Average Value
LOANS ORIGINATED 70 $160,856 1,219 $243,083 4,384 $221,612 86 $67,106 8 $817,598 397 $187,912 APPLICATIONS APPROVED, NOT ACCEPTED 2 $168,915 129 $240,540 412 $210,550 28 $52,991 1 $1,245,000 32 $205,437 APPLICATIONS DENIED 10 $174,150 125 $220,477 658 $240,299 34 $41,608 2 $775,000 54 $169,978 APPLICATIONS WITHDRAWN 6 $182,308 130 $241,078 410 $224,993 9 $90,150 0 $0 30 $175,590 FILES CLOSED FOR INCOMPLETENESS 8 $165,540 34 $226,877 96 $207,865 6 $51,122 0 $0 11 $145,070
Aggregated Statistics For Year 2002(Based on 1 full and 3 partial tracts) A) FHA, FSA/RHS & VA B) Conventional C) Refinancings D) Home Improvement Loans E) Loans on Dwellings For 5+ Families F) Non-occupant Loans on Number Average Value Number Average Value Number Average Value Number Average Value Number Average Value Number Average Value
LOANS ORIGINATED 21 $189,639 459 $242,384 1,331 $233,355 26 $42,804 5 $590,278 129 $187,169 APPLICATIONS APPROVED, NOT ACCEPTED 2 $194,000 57 $256,609 166 $243,788 11 $15,636 0 $0 21 $248,477 APPLICATIONS DENIED 2 $144,080 71 $244,116 165 $216,836 19 $37,406 1 $1,327,000 16 $162,884 APPLICATIONS WITHDRAWN 3 $175,933 37 $237,419 162 $252,862 2 $31,595 0 $0 13 $144,271 FILES CLOSED FOR INCOMPLETENESS 1 $181,020 24 $246,406 56 $255,616 1 $85,000 0 $0 5 $267,052
Aggregated Statistics For Year 2001(Based on 1 full and 3 partial tracts) A) FHA, FSA/RHS & VA B) Conventional C) Refinancings D) Home Improvement Loans E) Loans on Dwellings For 5+ Families F) Non-occupant Loans on Number Average Value Number Average Value Number Average Value Number Average Value Number Average Value Number Average Value
LOANS ORIGINATED 26 $172,781 488 $231,356 994 $225,334 61 $50,794 2 $1,880,225 107 $186,453 APPLICATIONS APPROVED, NOT ACCEPTED 1 $224,150 47 $279,804 101 $226,601 12 $41,477 0 $0 7 $128,999 APPLICATIONS DENIED 0 $0 53 $228,560 170 $228,816 21 $58,128 1 $365,000 17 $167,062 APPLICATIONS WITHDRAWN 2 $174,040 53 $207,963 138 $234,512 5 $22,566 0 $0 5 $151,304 FILES CLOSED FOR INCOMPLETENESS 2 $160,500 17 $287,256 34 $226,850 2 $22,055 0 $0 1 $95,680
Aggregated Statistics For Year 2000(Based on 1 full and 3 partial tracts) A) FHA, FSA/RHS & VA B) Conventional C) Refinancings D) Home Improvement Loans E) Loans on Dwellings For 5+ Families F) Non-occupant Loans on Number Average Value Number Average Value Number Average Value Number Average Value Number Average Value Number Average Value
LOANS ORIGINATED 43 $162,019 508 $224,109 251 $191,967 69 $44,315 4 $527,150 76 $182,110 APPLICATIONS APPROVED, NOT ACCEPTED 1 $194,160 60 $247,484 43 $180,080 13 $36,002 0 $0 5 $162,088 APPLICATIONS DENIED 3 $192,750 61 $191,664 78 $185,143 31 $41,014 0 $0 8 $186,460 APPLICATIONS WITHDRAWN 20 $163,038 48 $258,520 47 $171,201 8 $134,520 0 $0 6 $269,123 FILES CLOSED FOR INCOMPLETENESS 1 $112,750 7 $297,811 16 $245,798 1 $42,730 1 $244,160 2 $100,790
Aggregated Statistics For Year 1999(Based on 2 full and 6 partial tracts) A) FHA, FSA/RHS & VA B) Conventional C) Refinancings D) Home Improvement Loans E) Loans on Dwellings For 5+ Families F) Non-occupant Loans on Number Average Value Number Average Value Number Average Value Number Average Value Number Average Value Number Average Value
LOANS ORIGINATED 99 $135,860 1,067 $214,369 1,026 $178,441 194 $40,264 9 $2,925,442 142 $168,469 APPLICATIONS APPROVED, NOT ACCEPTED 4 $123,702 103 $203,150 151 $176,727 30 $25,970 0 $0 12 $125,959 APPLICATIONS DENIED 9 $134,170 162 $166,098 244 $203,416 73 $43,297 1 $212,790 35 $148,218 APPLICATIONS WITHDRAWN 14 $141,483 131 $198,051 183 $182,657 16 $84,959 0 $0 23 $186,035 FILES CLOSED FOR INCOMPLETENESS 1 $188,370 35 $129,628 53 $190,661 4 $35,212 0 $0 4 $179,815
Detailed mortgage data for all 12 tracts in Kirkland, WA
Private Mortgage Insurance Companies Aggregated Statistics For Year 2009(Based on 5 full and 5 partial tracts) A) Conventional B) Refinancings Number Average Value Number Average Value
LOANS ORIGINATED 33 $335,446 31 $297,651 APPLICATIONS APPROVED, NOT ACCEPTED 11 $345,847 10 $307,849 APPLICATIONS DENIED 9 $282,013 9 $330,551 APPLICATIONS WITHDRAWN 10 $330,347 4 $275,375 FILES CLOSED FOR INCOMPLETENESS 0 $0 2 $172,835
Aggregated Statistics For Year 2008(Based on 6 full and 6 partial tracts) A) Conventional B) Refinancings C) Non-occupant Loans on Number Average Value Number Average Value Number Average Value
LOANS ORIGINATED 102 $310,422 49 $317,791 7 $387,946 APPLICATIONS APPROVED, NOT ACCEPTED 24 $300,859 17 $328,544 2 $289,415 APPLICATIONS DENIED 13 $478,376 8 $340,191 5 $424,528 APPLICATIONS WITHDRAWN 2 $303,580 2 $469,670 0 $0 FILES CLOSED FOR INCOMPLETENESS 3 $419,077 2 $455,285 0 $0
Aggregated Statistics For Year 2007(Based on 6 full and 6 partial tracts) A) Conventional B) Refinancings C) Non-occupant Loans on Number Average Value Number Average Value Number Average Value
LOANS ORIGINATED 120 $317,667 30 $317,496 5 $335,194 APPLICATIONS APPROVED, NOT ACCEPTED 17 $309,481 4 $370,158 1 $158,620 APPLICATIONS DENIED 3 $459,313 0 $0 0 $0 APPLICATIONS WITHDRAWN 4 $334,180 1 $339,980 0 $0 FILES CLOSED FOR INCOMPLETENESS 2 $462,115 1 $350,000 0 $0
Aggregated Statistics For Year 2006(Based on 6 full and 6 partial tracts) A) Conventional B) Refinancings C) Non-occupant Loans on Number Average Value Number Average Value Number Average Value
LOANS ORIGINATED 95 $293,990 22 $345,516 7 $321,601 APPLICATIONS APPROVED, NOT ACCEPTED 15 $294,445 9 $221,946 2 $226,000 APPLICATIONS DENIED 2 $546,000 0 $0 1 $549,000 APPLICATIONS WITHDRAWN 3 $256,603 1 $527,590 1 $321,750 FILES CLOSED FOR INCOMPLETENESS 0 $0 0 $0 0 $0
Aggregated Statistics For Year 2005(Based on 6 full and 6 partial tracts) A) Conventional B) Refinancings C) Non-occupant Loans on Number Average Value Number Average Value Number Average Value
LOANS ORIGINATED 76 $238,074 26 $263,430 7 $278,814 APPLICATIONS APPROVED, NOT ACCEPTED 9 $312,240 10 $280,824 2 $169,320 APPLICATIONS DENIED 2 $252,665 1 $261,000 1 $315,000 APPLICATIONS WITHDRAWN 1 $319,710 3 $259,243 0 $0 FILES CLOSED FOR INCOMPLETENESS 0 $0 1 $193,120 0 $0
Aggregated Statistics For Year 2004(Based on 6 full and 6 partial tracts) A) Conventional B) Refinancings C) Non-occupant Loans on Number Average Value Number Average Value Number Average Value
LOANS ORIGINATED 82 $242,273 36 $232,487 14 $182,379 APPLICATIONS APPROVED, NOT ACCEPTED 10 $238,989 16 $191,202 3 $223,480 APPLICATIONS DENIED 7 $654,890 1 $313,020 3 $399,780 APPLICATIONS WITHDRAWN 6 $227,155 2 $169,400 0 $0 FILES CLOSED FOR INCOMPLETENESS 2 $184,515 0 $0 0 $0
Aggregated Statistics For Year 2003(Based on 6 full and 6 partial tracts) A) Conventional B) Refinancings C) Non-occupant Loans on Number Average Value Number Average Value Number Average Value
LOANS ORIGINATED 143 $234,684 161 $221,954 9 $206,534 APPLICATIONS APPROVED, NOT ACCEPTED 23 $255,219 31 $214,443 4 $120,550 APPLICATIONS DENIED 2 $140,570 5 $246,880 0 $0 APPLICATIONS WITHDRAWN 4 $246,775 10 $230,270 1 $300,000 FILES CLOSED FOR INCOMPLETENESS 0 $0 0 $0 0 $0
Aggregated Statistics For Year 2002(Based on 1 full and 3 partial tracts) A) Conventional B) Refinancings C) Non-occupant Loans on Number Average Value Number Average Value Number Average Value
LOANS ORIGINATED 55 $220,381 51 $216,751 6 $190,623 APPLICATIONS APPROVED, NOT ACCEPTED 11 $214,180 25 $232,722 4 $168,332 APPLICATIONS DENIED 1 $222,350 1 $141,000 0 $0 APPLICATIONS WITHDRAWN 3 $214,820 3 $204,167 1 $123,610 FILES CLOSED FOR INCOMPLETENESS 0 $0 0 $0 0 $0
Aggregated Statistics For Year 2001(Based on 1 full and 3 partial tracts) A) Conventional B) Refinancings C) Non-occupant Loans on Number Average Value Number Average Value Number Average Value
LOANS ORIGINATED 88 $221,921 42 $217,930 4 $195,180 APPLICATIONS APPROVED, NOT ACCEPTED 10 $192,315 11 $240,195 3 $196,507 APPLICATIONS DENIED 4 $217,002 2 $226,290 1 $200,000 APPLICATIONS WITHDRAWN 0 $0 0 $0 0 $0 FILES CLOSED FOR INCOMPLETENESS 0 $0 0 $0 0 $0
Aggregated Statistics For Year 2000(Based on 1 full and 3 partial tracts) A) Conventional B) Refinancings C) Non-occupant Loans on Number Average Value Number Average Value Number Average Value
LOANS ORIGINATED 93 $209,967 12 $216,878 6 $149,547 APPLICATIONS APPROVED, NOT ACCEPTED 11 $193,835 4 $228,585 0 $0 APPLICATIONS DENIED 4 $192,802 2 $275,625 0 $0 APPLICATIONS WITHDRAWN 3 $271,267 1 $189,880 0 $0 FILES CLOSED FOR INCOMPLETENESS 2 $190,935 0 $0 0 $0
Aggregated Statistics For Year 1999(Based on 2 full and 6 partial tracts) A) Conventional B) Refinancings C) Non-occupant Loans on Number Average Value Number Average Value Number Average Value
LOANS ORIGINATED 271 $197,759 42 $184,587 6 $152,017 APPLICATIONS APPROVED, NOT ACCEPTED 28 $206,071 13 $188,660 1 $133,470 APPLICATIONS DENIED 10 $226,526 1 $254,530 1 $209,950 APPLICATIONS WITHDRAWN 9 $224,396 3 $184,157 1 $155,810 FILES CLOSED FOR INCOMPLETENESS 0 $0 0 $0 0 $0
Fire-safe hotels and motels in Kirkland, Washington:
Baymont Inn & Suites, 12223 NE 116TH St, Kirkland, Washington 98034 Phone: (425) 488-8734, Fax: (425) 889-9616
Carlton Inn, 12233 Totem Lk Way, Kirkland, Washington 98034 Phone: (425) 821-2202, Fax: (425) 820-3457
Motel 6 #687, 12010 120TH PL, Kirkland, Washington 98034 Phone: (425) 821-5618, Fax: (425) 821-7459
Comfort Inn, 12202 NE 124th St, Kirkland, Washington 98034 Phone: (425) 821-8300, Fax: (425) 823-1218
Courtyard-Seattle Kirkland, 11215 NE 124th St, Kirkland, Washington 98034 Phone: (425) 602-3200, Fax: (425) 602-3220
La Quinta Inn & Suites, 10530 NE Northup Way, Kirkland, Washington 98033 Phone: (425) 828-6585, Fax: (425) 822-8722
Woodmark Hotel, Yacht Club & Spa, 1200 Carillon Pt, Kirkland, Washington 98033 Phone: (425) 822-3700
Baymont by Wyndham, 12223 North E 116th St, Kirkland, Washington 98034 Phone: (425) 822-2300
The Heathman Hotel Kirkland, 220 Kirkland Ave, Kirkland, Washington 98033 Phone: (485) 284-5800, Fax: (425) 284-5888
All 9 fire-safe hotels and motels in Kirkland, Washington
Most common first names in Kirkland, WA among deceased individuals Name Count Lived (average)
John 236 74.8 years Mary 184 80.6 years Robert 178 71.9 years William 173 75.0 years James 144 73.2 years George 118 75.2 years Charles 116 77.2 years Dorothy 115 80.8 years Ruth 108 81.9 years Helen 107 82.0 years
Most common last names in Kirkland, WA among deceased individuals Last name Count Lived (average)
Smith 90 77.6 years Johnson 85 77.7 years Anderson 58 75.6 years Williams 46 78.0 years Miller 45 78.5 years Peterson 45 78.1 years Jones 43 77.0 years Davis 40 79.3 years Brown 39 72.9 years Nelson 38 77.0 years
Kirkland compared to Washington state average:
Median house value above state average. Unemployed percentage significantly below state average. Median age above state average. Foreign-born population percentage significantly above state average. Percentage of population with a bachelor's degree or higher significantly above state average.
#6 on the list of "Top 101 cities with the lowest maximum monthly sunshine amount (population 50,000+)"
#6 on the list of "Top 101 cities with the lowest minimum monthly sunshine amount (population 50,000+)"
#6 on the list of "Top 101 cities with the lowest average sunshine amount (population 50,000+)"
#7 on the list of "Top 101 cities with largest percentage of females in occupations: business and financial operations occupations (population 50,000+)"
#7 on the list of "Top 101 cities with largest percentage of males in industries: information (population 50,000+)"
#8 on the list of "Top 101 cities with largest percentage of males in occupations: management occupations (population 50,000+)"
#11 on the list of "Top 101 cities with largest percentage of males in occupations: computer and mathematical occupations (population 50,000+)"
#13 on the list of "Top 101 cities with the lowest average wind speeds (population 50,000+)"
#18 on the list of "Top 101 larger cities with the highest increase in household income from 2000 (population 50,000+)"
#18 on the list of "Top 101 cities with largest percentage of females in industries: professional, scientific, and technical services (population 50,000+)"
#20 on the list of "Top 101 cities with the most residents born in Born at sea (population 500+)"
#23 on the list of "Top 101 cities with largest percentage of males in industries: professional, scientific, and technical services (population 50,000+)"
#24 on the list of "Top 101 cities with the highest maximum monthly morning or afternoon humidity (population 50,000+)"
#33 on the list of "Top 101 cities with the largest percentage of people in institutions for the blind (population 1,000+)"
#33 on the list of "Top 101 cities with largest percentage of females in industries: arts, entertainment, and recreation (population 50,000+)"
#34 on the list of "Top 101 cities with the largest percentage population increase from 2000 (population 50,000+)"
#38 on the list of "Top 101 cities with the highest average humidity (population 50,000+)"
#38 on the list of "Top 101 cities with largest percentage of females in industries: real estate and rental and leasing (population 50,000+)"
#39 on the list of "Top 101 cities with largest percentage of males in industries: arts, entertainment, and recreation (population 50,000+)"
#45 on the list of "Top 101 cities with the most people taking a ferryboat to work (population 5,000+)"
#5 on the list of "Top 101 counties with the most Mainline Protestant congregations"
#8 on the list of "Top 101 counties with the lowest Ozone (1-hour) air pollution readings in 2012 (ppm)"
#9 on the list of "Top 101 counties with the most Other congregations"
#11 on the list of "Top 101 counties with the most Mainline Protestant adherents"
#11 on the list of "Top 101 counties with the highest percentage of residents that exercised in the past month"
Top Patent Applicants
Amer A. Hassan (132)
Alexander G. Gounares (116)
Venson Shaw (103)
Eric J. Horvitz (98)
Ranveer Chandra (82)
Venson M. Shaw (73)
Desney S. Tan (71)
Kathryn Stone Perez (67)
William Henry Mangione-Smith (66)
Xiaodong Li (65)
Total of 9822 patent applications in 2008-2024.


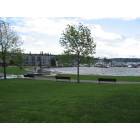
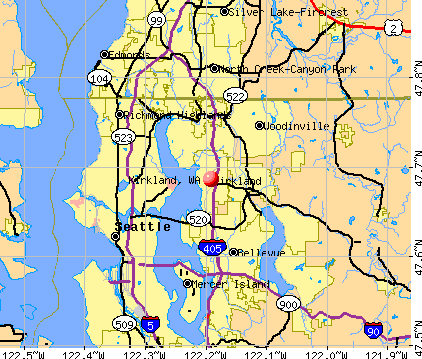


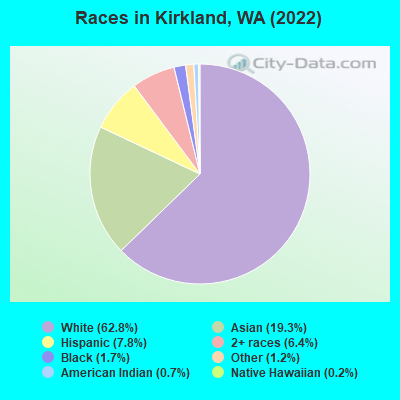
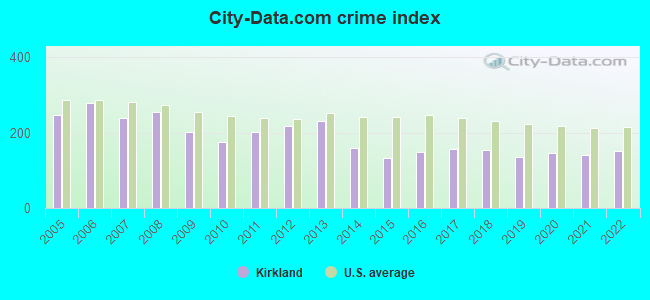
 Recent articles from our blog. Our writers, many of them Ph.D. graduates or candidates, create easy-to-read articles on a wide variety of topics.

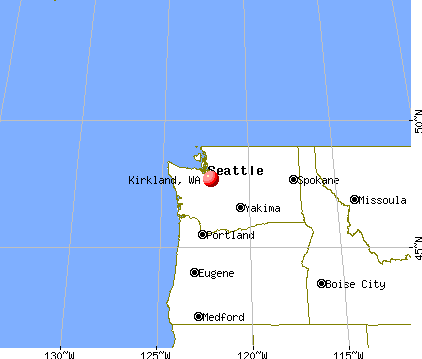
 , pop. 480,100).
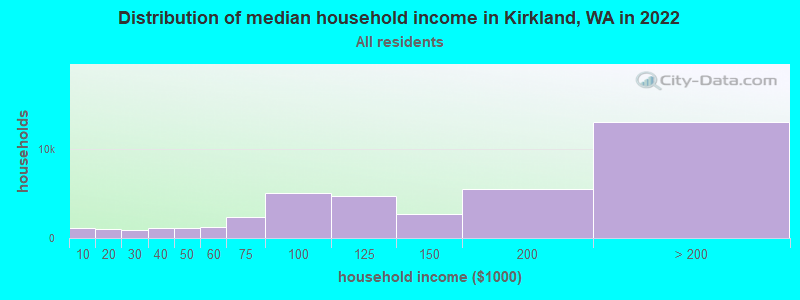
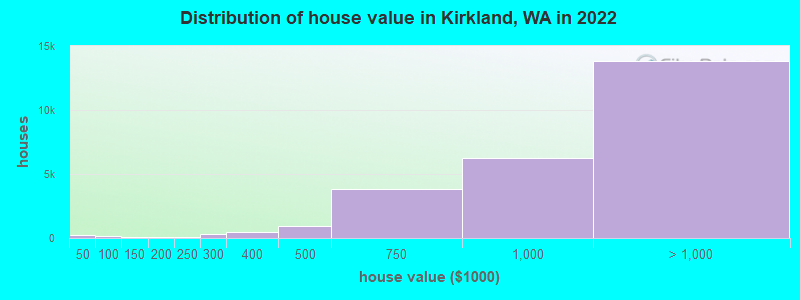
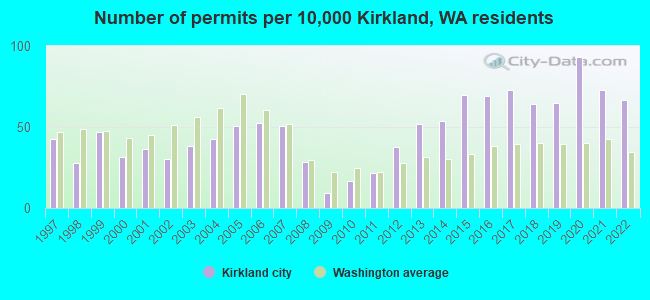
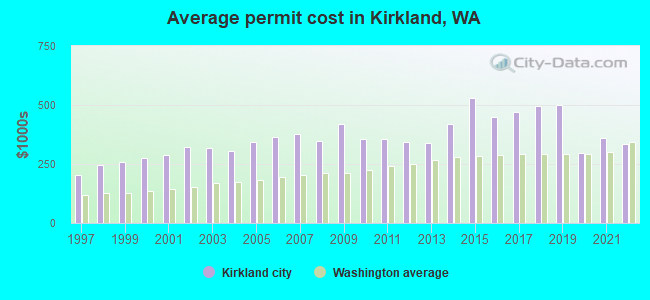
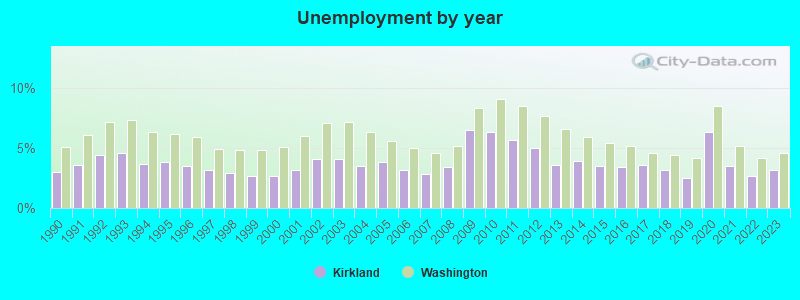
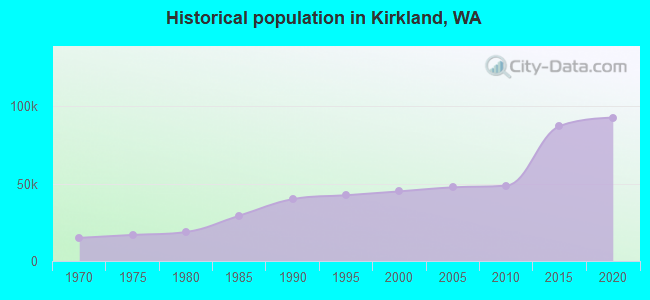
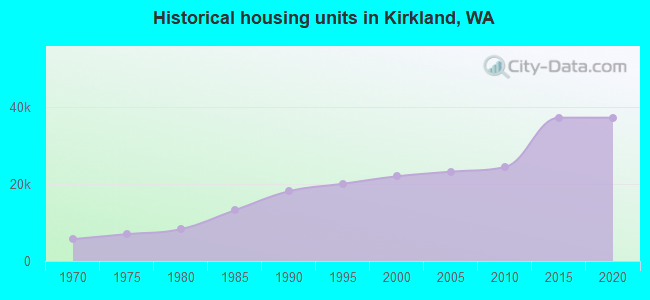
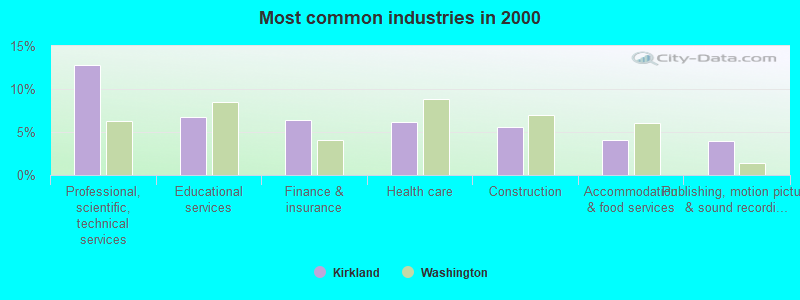
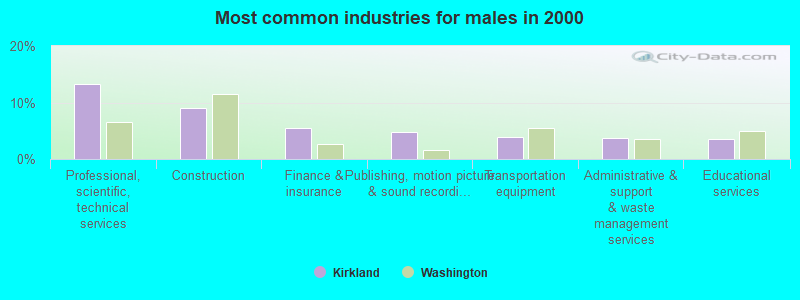
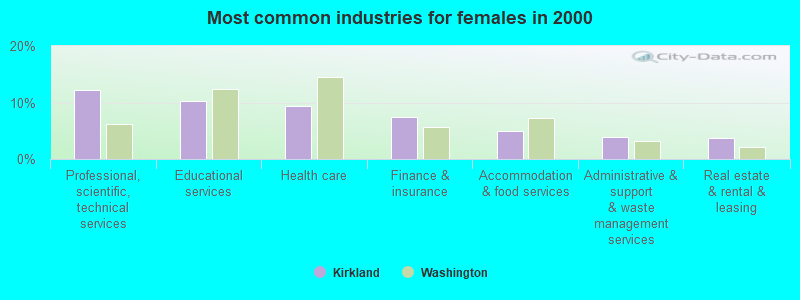
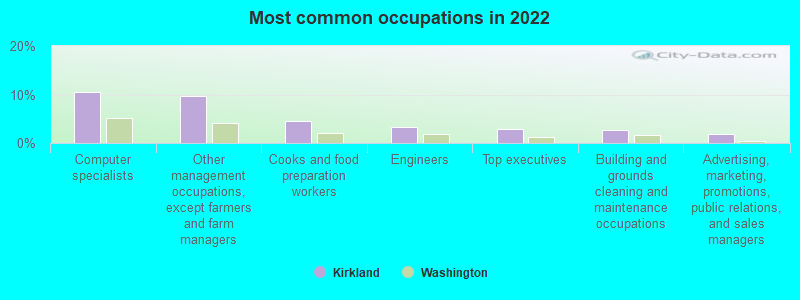
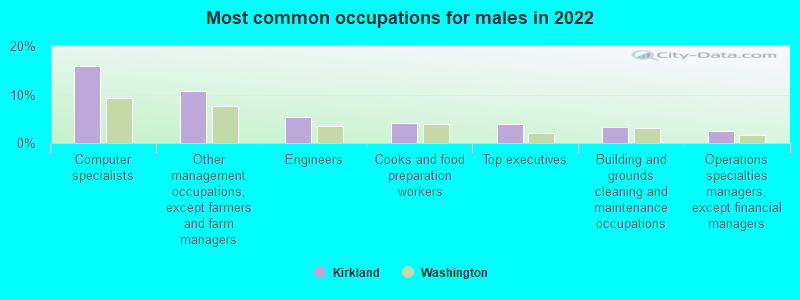
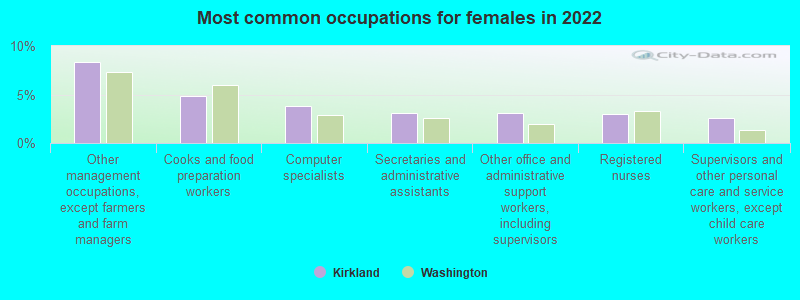
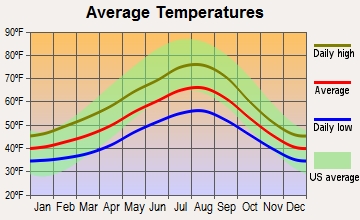
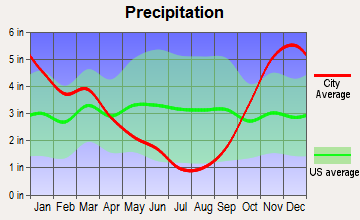
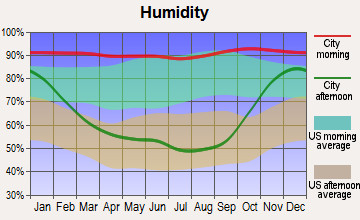
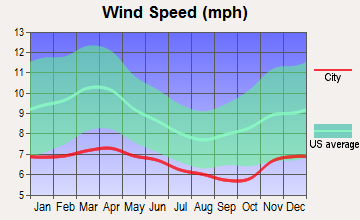
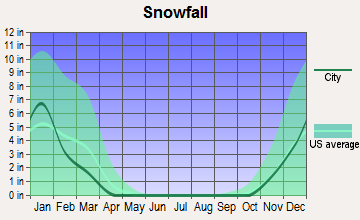
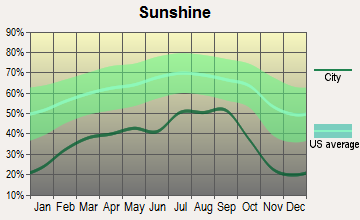
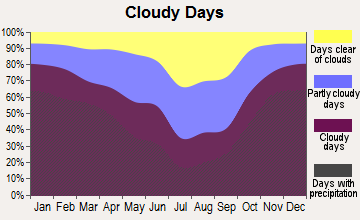
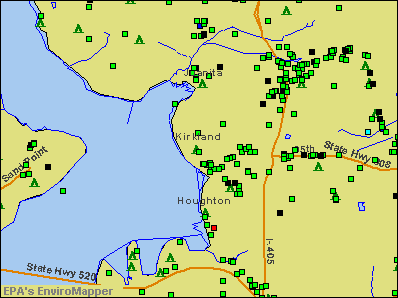

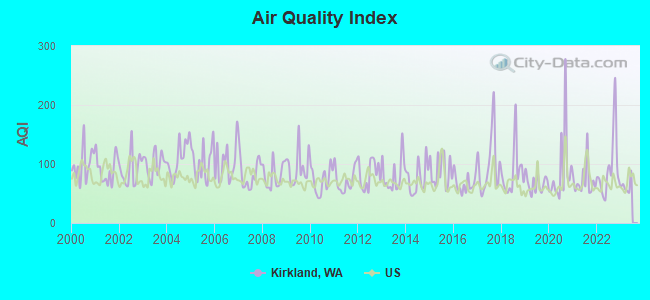
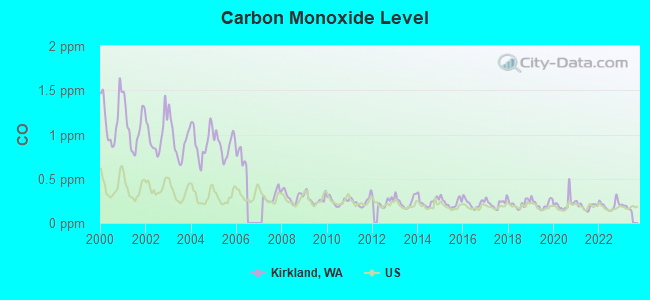
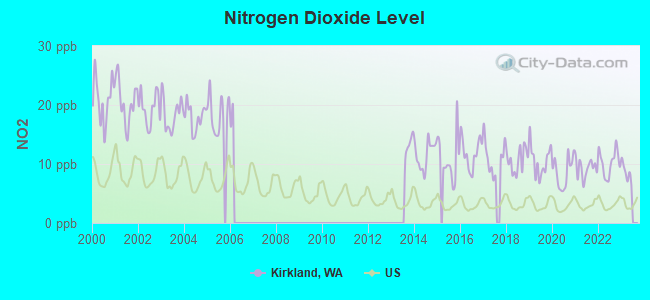
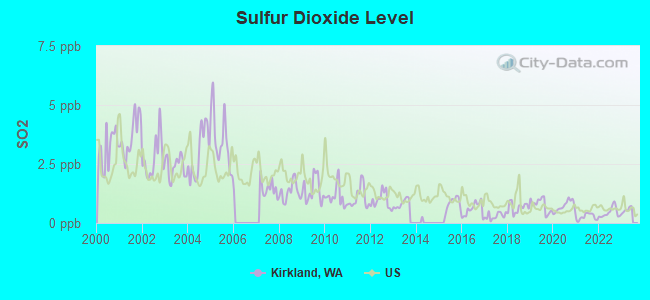
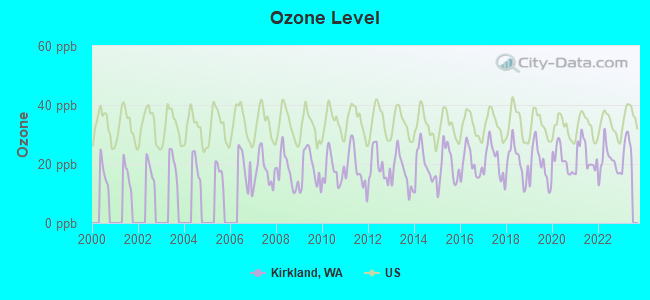
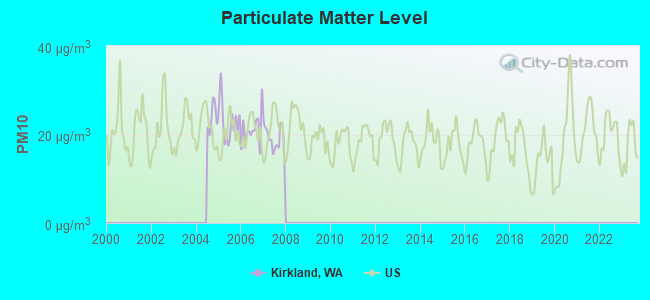
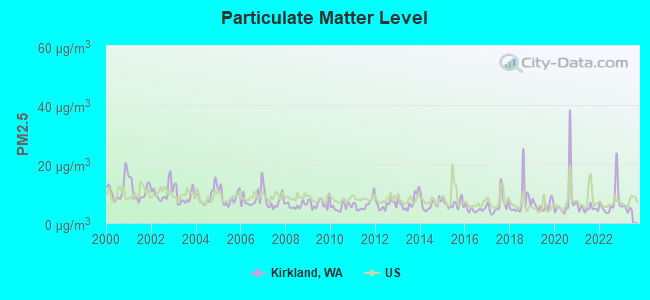
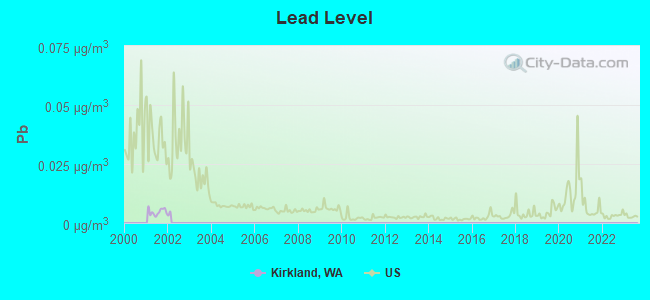
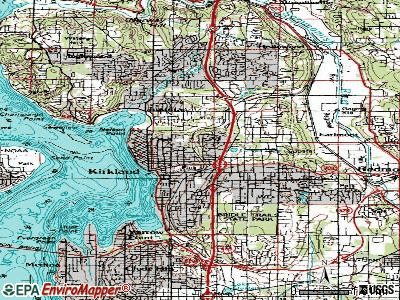
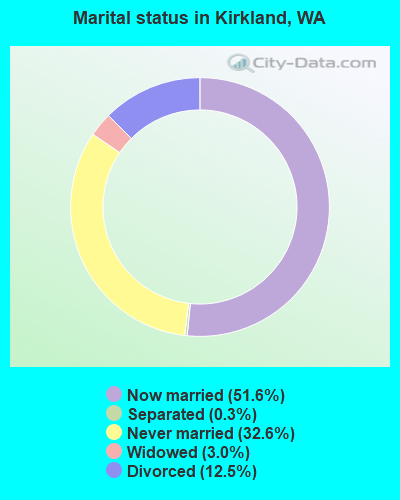
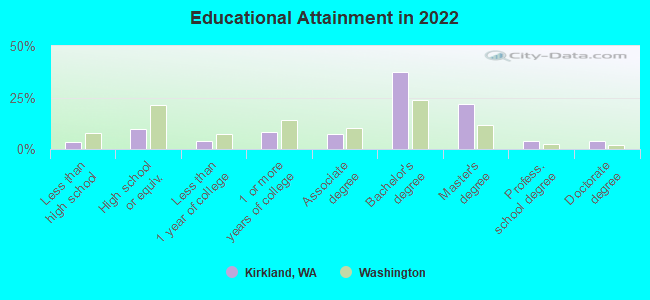
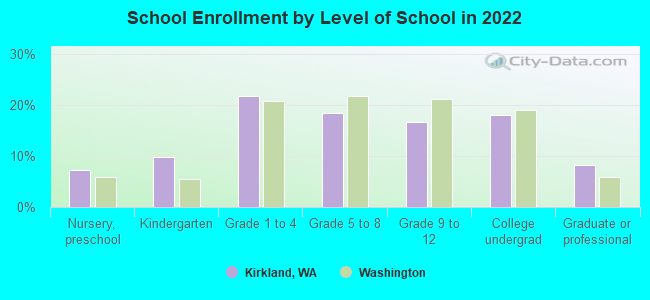
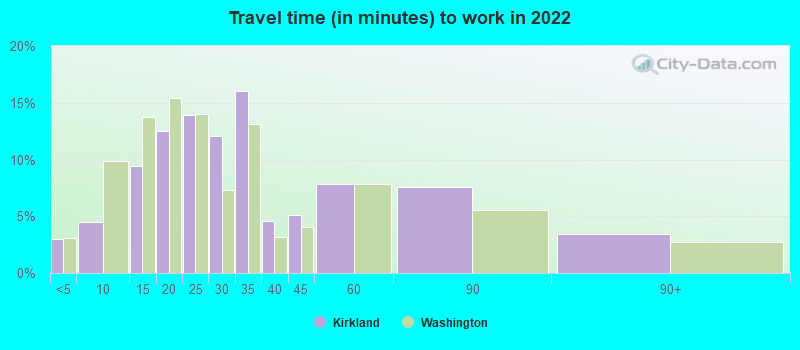
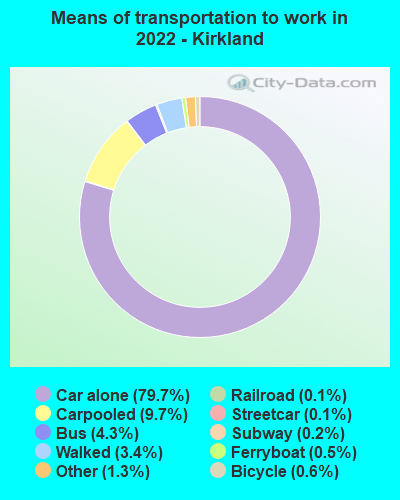
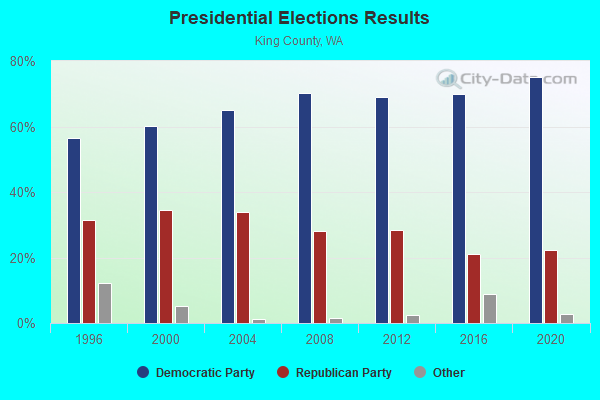
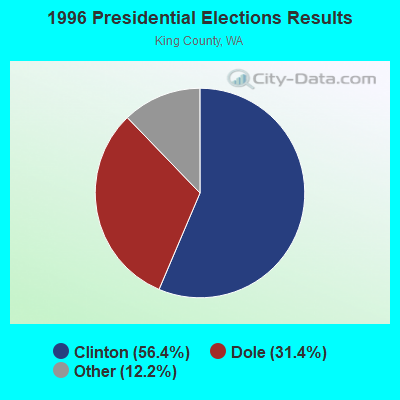
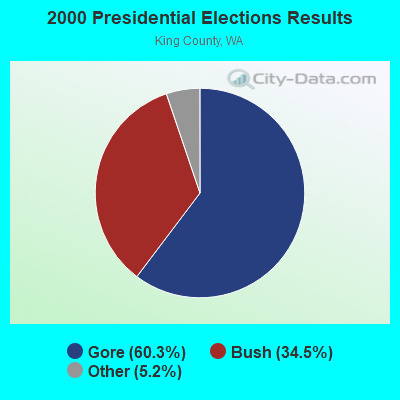
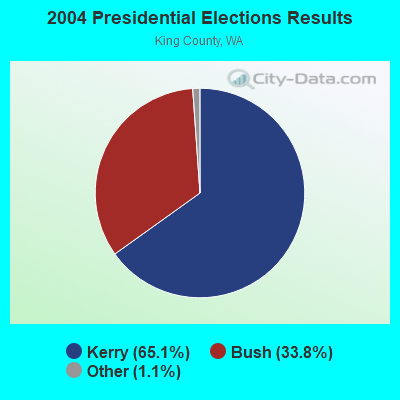
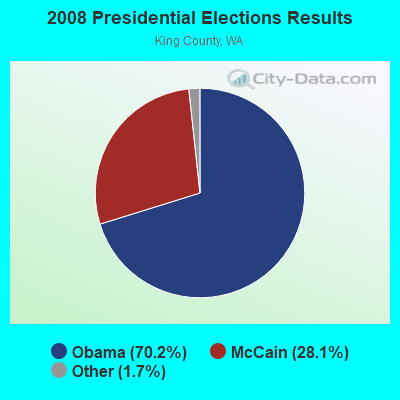
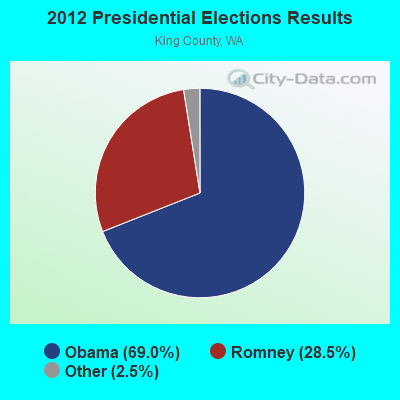
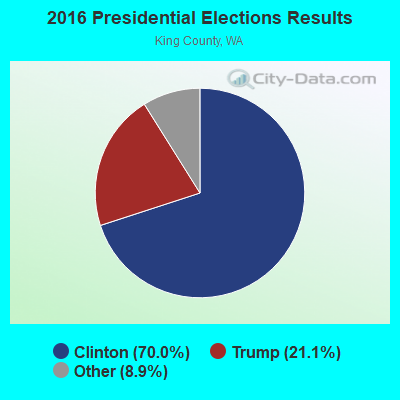
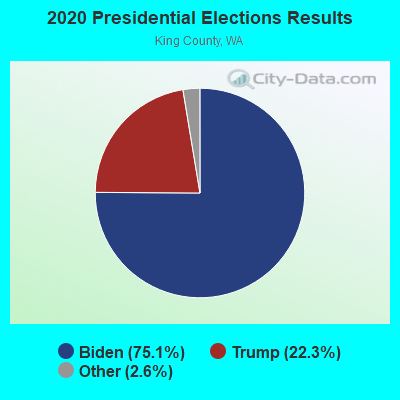
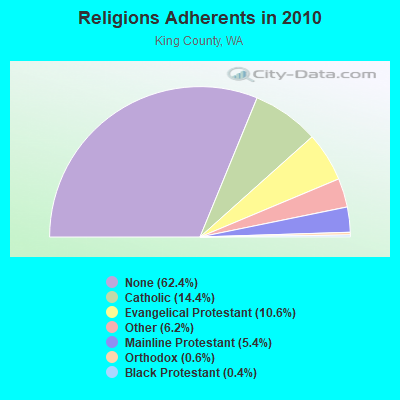
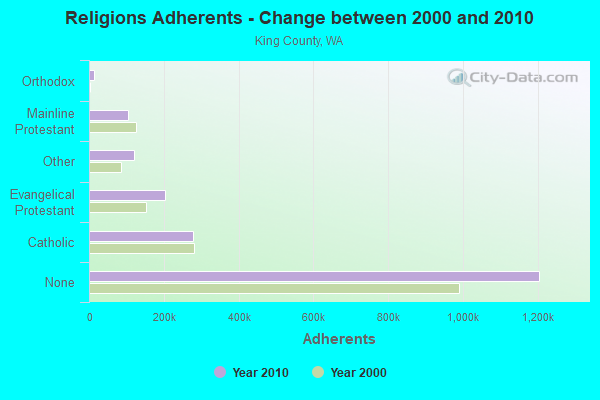
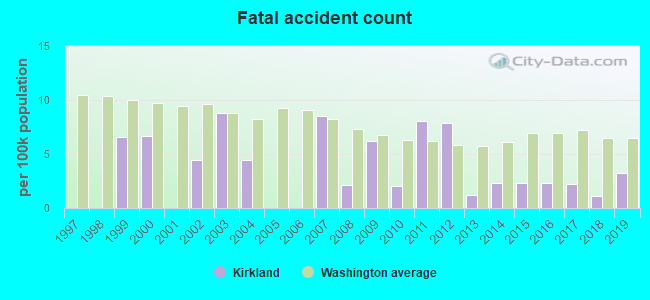
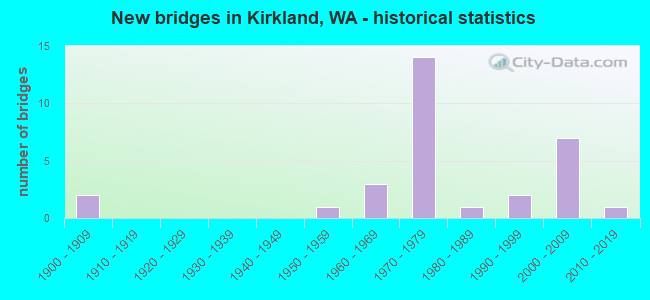
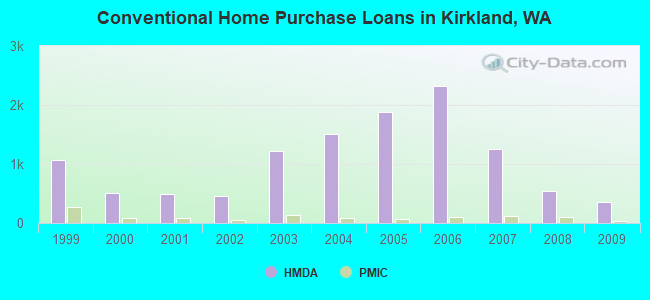
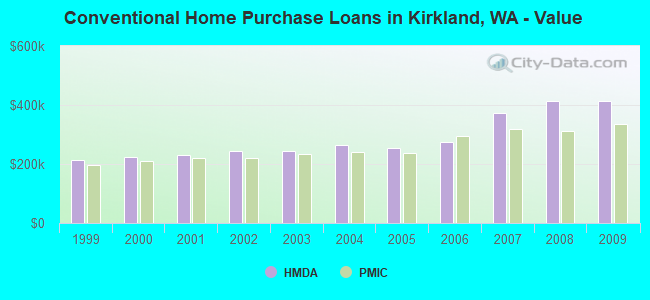
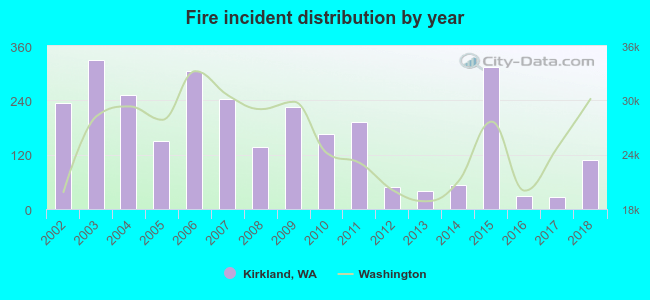 According to the data from the years 2002 - 2018 the average number of fires per year is 168. The highest number of fire incidents - 328 took place in 2003, and the least - 27 in 2017. The data has a declining trend.
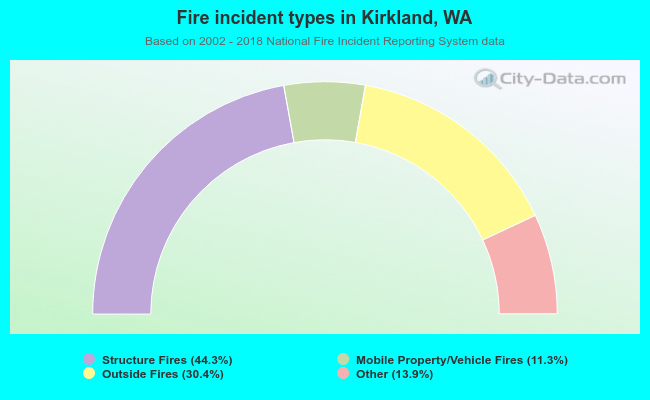 When looking into fire subcategories, the most incidents belonged to: Structure Fires (44.3%), and Outside Fires (30.4%).