


Relative area comparison
 Brooklyn, NY
 Washington, DC
This is a detailed comparison between living in Brooklyn, New York, and Washington DC, focusing on various essential factors that significantly affect the lifestyle of inhabitants or visitors of both cities. These factors, which include crime and safety, weather, cost of living, education system, economy, infrastructure, main industries and job opportunities, real-estate market conditions, neighborhoods, transportation or commuting options, tax system, food and cultural scene, sports teams, geographical conditions, and health care service, have been elaborately discussed in the following sections to provide a clear view of both cities.

 | Most "Walkable" City? (147 replies) |
| Walk Score Top 25 City Ranking for American Cities (68 replies) |
| America's Top 10 Downtown's (2290 replies) |
| Toughest City in America (449 replies) |
| Which Northeast city would be best for a black middle class family? (1852 replies) |
| Minneapolis vs Denver (29 replies) |
Brooklyn, NY and
Washington, DC : 202.0 miles
Brooklyn's population is larger by 279%. The population of Washington has grown by 97,991 people (17.1%) during that time.
| Population | ||
| Type | Brooklyn | Washington |
|---|---|---|
| Population | 2,538,705 | 670,050 |
| Female / male percentage | 53.1% / 46.9%
|
52.4% / 47.6%
|
Both Brooklyn, NY, and Washington, DC have areas that are safe and others that are less so. Historically, Washington DC has had higher crime rates than Brooklyn. However, crime rates in both regions have been reducing significantly over the years. It's advisable for both residents and visitors to stay informed about the safer neighborhoods and take standard precautions, as you would in any large metropolitan area.
The cost of living in Brooklyn is generally higher than in Washington, DC. This is particularly true when it comes to housing. While things like groceries, health, and transportation costs can be slightly lower or nearly the same in both cities, the overall cost of living in Brooklyn remains considerably higher.
New York has a progressive income tax system where the tax rate varies from 4% to 8.82%, depending on income level. Washington, DC also has a progressive tax system, with rates ranging from 4% to 8.95%.
Property taxes are more complex, but generally, Brooklyn has high property taxes compared to DC. The rates can vary greatly depending on the neighborhood in both cities.
The combined Sales tax in Brooklyn is currently 8.88% while in Washington, DC it is 6%. Thus, almost all goods and services are typically more expensive in Brooklyn compared to DC, given the difference in sales tax.
| Income | ||
| Type | Brooklyn | Washington |
|---|---|---|
| Estimated median household income | $67,567 | $90,088 |
| Estimated per capita income | $39,536 | $65,808 |
| Cost of living index (U.S. average is 100) | 185.4 | 124.2 |
If you make $50,000 in Washington, you will have to make $74,638 in Brooklyn to maintain the same standard of living.
Brooklyn is located on western Long Island and is largely flat. Its geography is marked by beaches along the Coney Island Peninsula. Washington, DC is located along the Potomac River and features a mix of flat land and rolling hills. It's known for its many parks, including the expansive Rock Creek Park.
| Geographical information | ||
| Type | Brooklyn | Washington |
|---|---|---|
| Land area | 70.6 sq. miles | 61.4 sq. miles |
| Population density | 35,956 people per sq. mile | 10,912 people per sq. mile |
Brooklyn, NY
Washington, DC
Both Brooklyn and DC are home to some excellent educational institutions. Washington DC is renowned for universities like Georgetown, Howard, and American University. Brooklyn has its merits with institutions like Brooklyn College and Pratt Institute. Further, the University of the District of Columbia is significantly more affordable than many institutions in Brooklyn, NY.
| Education level (25-year-olds and older) | ||
| Type | Brooklyn | Washington |
|---|---|---|
| Bachelor's degree or higher | 21.8% | 63% |
| Graduate or professional degree | 8.8% | 37.8% |
| High school or higher | 68.8% | 92.8% |
Washington, DC's economy is driven by the federal government, though it has diversified and now includes sectors like education, finance, public policy, and scientific research. Brooklyn's economy, on the other hand, is more varied, with strong retail, healthcare, manufacturing, and tech sectors. Unemployment rates are generally lower in Brooklyn.
In Washington, DC, the largest employers are usually the federal government, Georgetown University, and Washington Hospital Center. In Brooklyn, the top employers include JPMorgan Chase & Co., NewYork-Presbyterian Healthcare System, and the City of New York.
In Brooklyn (Kings County), 82.1% voted for Democrats and 16.9% for Republicans in 2012 Presidential Election. In Washington (District of Columbia), 90.9% voted for Democrats and 7.3% for Republicans.
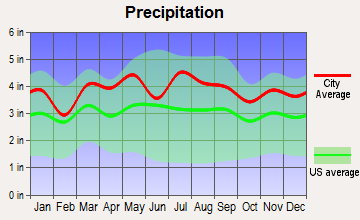
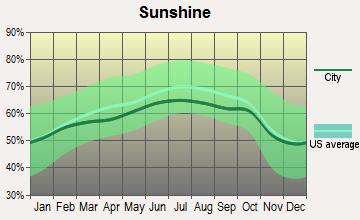
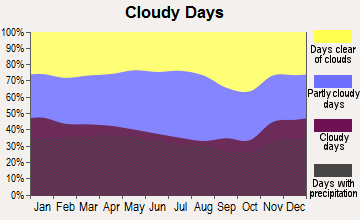
Brooklyn has a humid subtropical climate, with hot, humid summers and cold, wet winters, while Washington DC also experiences a humid subtropical climate but can experience more extreme temperatures, with hotter summers and colder winters. Both regions have a significant amount of rainfall throughout the year.
| Weather and climate | ||
| Type | Brooklyn | Washington |
|---|---|---|
| Temperature - Average | 55.1°F | 56.4°F |
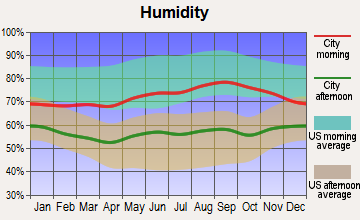
| Humidity - Average morning or afternoon humidity | 68.7% | 68.8% |
| Humidity - Differences between morning and afternoon humidity | 26.1% | 33% |
| Humidity - Maximum monthly morning or afternoon humidity | 76.8% | 81% |
| Humidity - Minimum monthly morning or afternoon humidity | 50.7% | 48% |
| Precipitation - Yearly average | 46.5 in | 42.7 in |
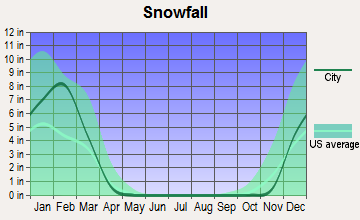
| Snowfall - Yearly average | 53.4 in | 32.4 in |
| Clouds - Number of days clear of clouds | 16.7% | 15.9% |
| Sunshine amount - Average | 60.2% | 61.5% |
| Sunshine amount - Differences during a year | 20% | 21% |
| Sunshine amount - Maximum monthly | 64% | 66% |
| Sunshine amount - Minimum monthly | 44% | 45% |
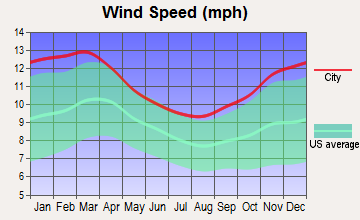
| Wind speed - Average | 10.6 mph | 9.7 mph |
| Natural disasters | ||
| Type | Brooklyn | Washington |
|---|---|---|
| Tornado activity compared to U.S. average | 56.4% | 110.6% |
| Earthquake activity compared to U.S. average | 30.8% | 42.9% |
| Natural disasters compared to U.S. average | 17% | 19% |
Both Brooklyn and Washington, DC, offer robust public transit systems. Brooklyn is connected by the New York Subway, buses, and ferries. Washington, DC, has Metrorail and Metrobus. Both cities are also bike-friendly and support green commuting initiatives.
| Transport | ||
| Type | Brooklyn | Washington |
|---|---|---|
| Amtrak stations | 0 | 1 |
| Amtrak stations nearby | 3 | 3 |
| FAA registered aircraft | 149 | 456 |
| FAA registered aircraft manufacturers and dealers | 2 | 3 |
| Means of transportation to work | ||
| Type | Brooklyn | Washington |
|---|---|---|
| Bicycle | 0.5% | 2% |
| Bus | 10.4% | 6.3% |
| Carpooled | 8% | 7.8% |
| Car alone | 22.4% | 62.5% |
| Railroad | 1.4% | 0.3% |
| Streetcar | 0.2% | 10.6% |
| Subway | 44.8% | 1.3% |
| Taxicab | 0.7% | 0.8% |
| Walked | 8.8% | 5.7% |
| Average travel time to work | ||
| Type | Brooklyn | Washington |
|---|---|---|
| Average | 44.5 min | 39.2 min |
Brooklyn's real estate market is more varied and expansive than Washington, DC's. However, both cities have seen rising property values over the past decade. The median home value in Washington, DC is generally lower than in Brooklyn.
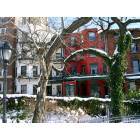
Brooklyn is known for its diverse and vibrant neighborhoods, including Williamsburg, Brooklyn Heights, and DUMBO. Each neighborhood has a unique character and culture. Washington, DC, also has a range of neighborhoods, with areas like Capitol Hill, Georgetown, and Adams Morgan offering a mix of history, culture, and amenities.
| Houses and residents | ||
| Type | Brooklyn | Washington |
|---|---|---|
| Houses | 930,866 | 357,482 |
| Average household size (people) | 2.7 | 2.1 |
| Houses occupied | 880,727 (94.6%) | 319,565 (89.4%) |
| Houses occupied by owners | 238,290 (27.1%) | 132,936 (41.6%) |
| Houses occupied by renters | 642,437 (72.9%) | 186,629 (58.4%) |
| Median rent asked for vacant for-rent units | $1,589 | $2,791 |
| Median price asked for vacant for-sale houses and condos | $1,621,117 | $996,150 |
| Estimated median house or condo value | $793,300 | $669,900 |
| Median number of rooms in apartments | 3.6 | 3.1 |
| Median number of rooms in houses and condos | 5.2 | 6 |
| Renting percentage | 72.3% | 58% |
| Housing density (houses/condos per square mile) | 13,184 | 5,821.9 |
| Household income disparities | 48.5% | 45.7% |
| Housing units without a mortgage | 29,251 (32.9%) | 777 (0.8%) |
| Housing units with both a second mortgage and home equity loan | 183 (0.2%) | 8,586 (8.5%) |
| Housing units with a mortgage | 59,793 (67.1%) | 100,122 (99.2%) |
| Housing units with a home equity loan | 4,512 (5.1%) | 1,057 (1%) |
| Housing units with a second mortgage | 5,098 (5.7%) | 12,793 (12.7%) |
| Housing units lacking complete kitchen facilities | 1.5% | 1.5% |
| Housing units lacking complete plumbing facilities | 1.7% | 1.5% |
In Brooklyn, the major industries include healthcare, retail trade, and manufacturing, and many residents work in these sectors. In Washington, DC, the largest industries are professional, scientific, tech services, public administration, and educational services.
| Health (county statistics) | ||
| Type | Brooklyn | Washington |
|---|---|---|
| General health status score of residents in this county from 1 (poor) to 5 (excellent) | 3.4 | 3.7 |
| Average weight of females (lbs) | 161.8 lbs | 160.6 lbs |
| Average weight of males (lbs) | 185.6 lbs | 185.7 lbs |
| Residents visited a dentist within the past year | 67.1% | 74.9% |
| Residents exercised in the past month | 69.9% | 79.2% |
| Residents keep firearms around their homes | 4% | 4% |
| Adult residents drank alcohol in the past 30 days | 71.7% | 81% |
| Residents smoked 100+ cigarettes in their lives | 39.2% | 43.6% |
Brooklyn boasts of the iconic Brooklyn Bridge and a robust transportation infrastructure that includes airports, rails, and buses. Washington DC is not far behind with modern infrastructure that includes an extensive Metrorail system, three surrounding airports, and a network of highways.
| Infrastructure | ||
| Type | Brooklyn | Washington |
|---|---|---|
| Hospitals | 104 | 114 |
| TV stations | 29 | 27 |
| Bank branches located here | 271 | 247 |
| Bank institutions located here | 41 | 34 |
| Main business address for public companies | 9 | 30 |
| Drinking water stations with no reported violations in the past | 12 | 5 |
| Drinking water stations with reported violations in the past | 75 | 10 |
Brooklyn has a rich cultural scene from large multicultural festivals to small neighborhood block parties. It's known for its food scene, which reflects its cultural diversity. Washington, DC also has a thriving cultural scene, particularly linked with its role as the nation's capital. Its food scene is a mix of international cuisines and southern comfort food.
Sports fans will find plenty to cheer for in both Brooklyn and DC. Brooklyn is home to the Brooklyn Nets (NBA) and the New York Islanders (NHL). Washington, DC is home to the Washington Wizards (NBA), Washington Capitals (NHL), Washington Nationals (MLB), and the Washington Football Team (NFL).