Charlotte, NC, known for its robust economy and cultural offerings, and Cape Coral, FL, celebrated for its beautiful weather and relaxed lifestyle, are both appealing cities in the United States but cater to different preferences and lifestyles. The following comparison explores various aspects such as crime and safety, weather, cost of living, education, work and economy, and more. As we delve into the unique characteristics and nuances of both cities, it becomes clear that each has its own distinct appeal, depending on the resident's or visitor's expectations and needs.
Distance between
Charlotte, NC and
Cape Coral, FL : 595.9 miles
Charlotte's population is larger by 330%. Its population has grown by 338,881 people (62.7%) since 2000. The population of Cape Coral has grown by 102,224 people (99.9%) during that time.
Charlotte, NC has a slightly higher crime rate compared to the national average. However, its rapidly improving downtown area is deemed relatively safe with specialty units allocated to patrol the zones. Conversely, Cape Coral, FL is rated one of the safest cities in Florida, with crime rates well below the national average. Both cities have responded proactively to the issue of crime and safety; but if safety is a primary factor, Cape Coral has a clear advantage.
Cost of Living
The cost of living in Charlotte, NC is slightly above the national average, reflected most starkly in the housing market. However, this is countered by its extensive job opportunities and relatively high wages. Meanwhile, Cape Coral, FL has a cost of living slightly below the national average, with housing being more affordable. For those looking for low-cost living, Cape Coral tends to be more economical.
Income Tax
North Carolina levies a flat state income tax rate of 5.25% on its residents. However, Florida does not have a state income tax, making it a more favorable location for those seeking to enhance their post-tax income.
Property Tax
Property taxes in Charlotte, NC average around 1.16% of a property's assessed fair market value. Comparatively, Cape Coral has an average property tax rate of around 0.97%. For homeowners, Cape Coral can provide potential savings in property taxation.
Sales Tax
North Carolina, where Charlotte is located, imposes a base state sales tax rate of 4.75%, plus a county rate of 2.25% for a total of 7%. In contrast, Florida, the home of Cape Coral, has a state sales tax rate of 6% along with a discretionary sales surtax that varies by county. Lee County, where Cape Coral is located, adds an additional 0.5% for a total of 6.5%.
Income
Type
Charlotte
Cape Coral
Estimated median household income
$70,869
$66,425
Estimated per capita income
$44,593
$35,788
Cost of living index (U.S. average is 100)
93.2
92.5
If you make $50,000 in Cape Coral, you will have to make $50,378 in Charlotte to maintain the same standard of living.
Geographical Conditions
Charlotte is located in the Piedmont region of North Carolina, surrounded by rolling hills. It's landlocked but within driving distance of both mountains and coast. Cape Coral is on Florida's southwest Gulf Coast and is famous for its extensive canal system. If proximity to the ocean or an affinity for water-based activities is a priority, Cape Coral is the city to consider.
Charlotte is known for its strong focus on education, with high-ranking public schools and renowned universities such as the University of North Carolina at Charlotte. In contrast, Cape Coral has commendable public schools but misses out on hosting a large university within its boundaries. For individuals seeking higher education opportunities, Charlotte is likely the more attractive choice.
Charlotte's strong economy is primarily driven by the banking industry, with large employers like Bank of America and Wells Fargo. There are also diverse opportunities in healthcare, tech, and energy sectors. Cape Coral has a more limited but stable economy focusing largely on healthcare, retail, and education sectors. If one is looking for lucrative job opportunities, Charlotte's diverse economy is more promising.
Biggest Employers
In Charlotte, the biggest employers are Bank of America, Atrium Health, and Wells Fargo. On the other hand, the School District of Lee County, Cape Coral Hospital, and the City of Cape Coral are the top employers in Cape Coral. As a result, job seekers from the Finance, Education, and Healthcare sectors may find comforting opportunities in these respective cities.
In Charlotte (Mecklenburg County), 60.8% voted for Democrats and 38.3% for Republicans in 2012 Presidential Election. In Cape Coral (Lee County), 41.5% voted for Democrats and 58.1% for Republicans.
Elections
Type
Democrats
Republicans
Other
Year
Charlotte
Cape Coral
Charlotte
Cape Coral
Charlotte
Cape Coral
2020
66.8%
40.1%
31.6%
59.4%
1.6%
0.5%
2016
62.3%
38.0%
32.9%
58.2%
4.8%
3.8%
2012
60.8%
41.5%
38.3%
58.1%
0.9%
0.4%
2008
62.0%
44.5%
37.6%
54.9%
0.5%
0.6%
2004
51.7%
39.2%
48.0%
60.2%
0.3%
0.6%
2000
48.4%
40.0%
51.1%
57.7%
0.5%
2.2%
1996
48.6%
39.6%
45.9%
48.7%
5.5%
11.7%
Breakdown of population affiliated with a religious congregation
Type
Adherents
Congregations
Religion
Charlotte
Cape Coral
Charlotte
Cape Coral
SOUTHERN BAPTIST CONVENTION
9.0%
4.0%
19.0%
15.8%
CATHOLIC CHURCH
8.5%
16.2%
1.8%
4.7%
AMERICAN BAPTIST CHURCHES IN THE USA
2.3%
0.0%
1.1%
0.0%
EPISCOPAL CHURCH
1.2%
0.6%
1.3%
2.8%
EVANGELICAL LUTHERAN CHURCH IN AMERICA
0.9%
0.5%
1.8%
1.9%
PRESBYTERIAN CHURCH IN AMERICA
0.6%
0.1%
1.9%
0.9%
SEVENTH DAY ADVENTIST CHURCH
0.5%
0.4%
1.5%
2.3%
LUTHERAN CHURCH
0.3%
0.6%
0.9%
1.6%
MUSLIM ESTIMATE
0.3%
0.9%
1.2%
0.9%
INTERNA PENTECO HOLINESS CHURCH
0.1%
0.3%
0.5%
3.0%
Weather
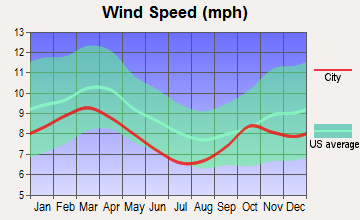
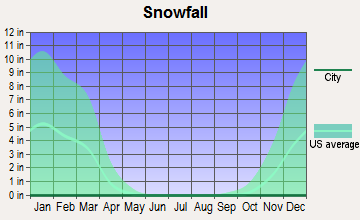
In Charlotte, NC, all four seasons are distinctly experienced, with hot summers and mildly cold winters. Snow is rare, but the city sees considerable rain throughout the year. On the other hand, Cape Coral has warm, humid weather marked by typical Florida sunshine most of the year and experiences a rainy season from June to September. For those who prefer a tropical climate, Cape Coral is the more suitable choice, while Charlotte would appeal to those who enjoy a temperate climate.
Weather and climate
Type
Charlotte
Cape Coral
Temperature - Average
61°F
74.7°F
Humidity - Average morning or afternoon humidity
72.3%
77.7%
Humidity - Differences between morning and afternoon humidity
41%
44%
Humidity - Maximum monthly morning or afternoon humidity
87%
91%
Humidity - Minimum monthly morning or afternoon humidity
46%
47%
Precipitation - Yearly average
44.5 in
53.1 in
Snowfall - Yearly average
10.2 in
0 in
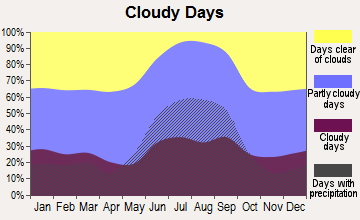
Clouds - Number of days clear of clouds
18.1%
16.4%
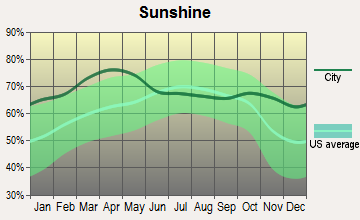
Sunshine amount - Average
69.8%
76.4%
Sunshine amount - Differences during a year
14%
15.3%
Sunshine amount - Maximum monthly
70%
80%
Sunshine amount - Minimum monthly
56%
64.7%
Wind speed - Average
6.9 mph
7.6 mph
Average climate in Charlotte, North Carolina
Average climate in Cape Coral, Florida
Air pollution
Type
AQI
CO
NO2
OZONE
PB
PM10
PM25
SO2
Year
Charlotte
Cape Coral
Charlotte
Charlotte
Charlotte
Cape Coral
Charlotte
Charlotte
Cape Coral
Charlotte
Cape Coral
Charlotte
2018
75
59
0.24
N/A
6.3
N/A
27.8
N/A
N/A
N/A
15.5
17.3
8.2
7.5
0.2
N/A
2017
77
51
0.25
N/A
7.0
N/A
28.0
N/A
N/A
N/A
16.3
15.6
8.8
8.6
0.2
N/A
2016
82
56
0.25
N/A
7.6
N/A
28.7
N/A
N/A
N/A
N/A
14.5
8.4
7.6
0.2
N/A
2015
76
56
0.25
N/A
8.1
N/A
27.6
N/A
N/A
N/A
N/A
14.3
8.6
7.6
0.2
N/A
2014
76
60
0.26
N/A
8.5
N/A
26.3
N/A
N/A
N/A
N/A
14.7
9.3
7.6
0.3
N/A
2013
71
56
0.29
N/A
8.4
N/A
25.5
N/A
N/A
N/A
N/A
14.7
8.6
7.7
0.3
N/A
2012
95
61
0.28
N/A
8.7
N/A
27.3
N/A
N/A
N/A
N/A
15.6
9.7
8.1
0.3
N/A
2011
94
58
0.34
N/A
10.1
N/A
28.9
N/A
N/A
N/A
N/A
15.8
11.2
8.3
0.6
N/A
2010
97
66
0.33
N/A
11.8
N/A
28.0
N/A
N/A
N/A
N/A
16.9
11.6
9.2
1.0
N/A
2009
82
59
0.30
N/A
10.0
N/A
25.4
N/A
N/A
N/A
N/A
16.2
11.1
8.5
0.9
N/A
2008
102
34
0.32
N/A
11.2
N/A
27.6
N/A
N/A
N/A
N/A
17.5
13.0
N/A
2.1
N/A
2007
108
36
0.37
N/A
13.9
N/A
29.1
N/A
0.001
N/A
N/A
20.5
14.5
N/A
3.0
N/A
2006
107
36
0.44
N/A
13.9
N/A
27.3
N/A
0.000
N/A
N/A
20.2
14.8
N/A
3.3
N/A
2005
109
33
0.53
N/A
14.6
N/A
30.6
N/A
0.000
N/A
N/A
18.6
15.2
N/A
2.7
N/A
2004
89
33
0.53
N/A
14.6
N/A
28.9
N/A
0.001
N/A
N/A
19.4
N/A
N/A
2.8
N/A
2003
85
30
0.57
N/A
15.6
N/A
27.6
N/A
0.003
N/A
N/A
18.4
N/A
N/A
3.0
N/A
2002
103
28
0.63
N/A
15.3
N/A
32.6
N/A
0.003
N/A
N/A
17.3
N/A
N/A
2.7
N/A
2001
108
44
0.72
N/A
17.5
N/A
32.3
N/A
0.005
N/A
N/A
19.5
N/A
N/A
3.9
N/A
2000
107
70
0.79
N/A
18.0
N/A
32.6
28.1
0.014
N/A
N/A
N/A
N/A
N/A
4.4
N/A
Natural disasters
Type
Charlotte
Cape Coral
Tornado activity compared to U.S. average
111.5%
76.8%
Earthquake activity compared to U.S. average
79%
7.2%
Natural disasters compared to U.S. average
9%
23%
Transportation
Charlotte is served by an extensive highway system and a rapidly-growing light rail system. The average commute time is similar to the national average. Cape Coral lacks a robust public transit system, and most residents rely on cars for transportation. Therefore, for those reliant on public transportation, Charlotte would offer better conveniences.
Transport
Type
Charlotte
Cape Coral
Amtrak stations
1
0
Amtrak stations nearby
2
1
FAA registered aircraft
439
115
FAA registered aircraft manufacturers and dealers
12
11
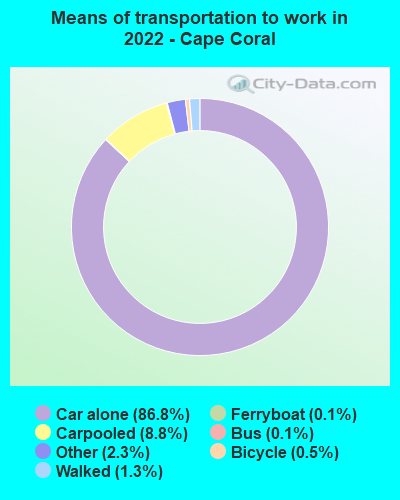
Means of transportation to work
Type
Charlotte
Cape Coral
Bicycle
0.1%
0.5%
Bus
1.2%
0.1%
Carpooled
8.7%
9.6%
Car alone
86.2%
85.7%
Motorcycle
0.1%
0.3%
Railroad
0.4%
0%
Taxicab
0.2%
0%
Walked
1.5%
1.5%
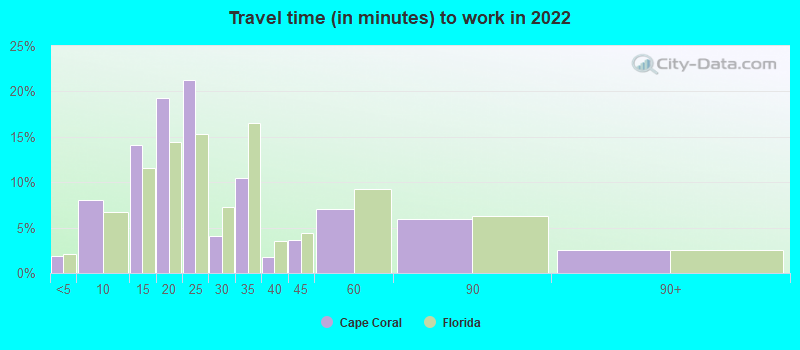
Average travel time to work
Type
Charlotte
Cape Coral
Average
29.6 min
23.6 min
Other means
24.9 min
25.4 min
Public transportation
44.1 min
51.3 min
Private vehicle occupancy
Type
Charlotte
Cape Coral
Average
1.2
1.1
Drove alone
90%
90.8%
In 2 person carpool
6.9%
6.8%
In 3 person carpool
1.8%
1.1%
In 4 person carpool
0.8%
0.6%
In 5-6 person carpool
0.5%
0.2%
In 7+ person carpool
0.1%
0.1%
How many people usually rode to work in the car, truck or van.
Real Estate
The real estate market in Charlotte is competitive, with home prices rising due to the city's rapid growth. However, a wider variety of housing types from apartments in the city to suburban homes are available. Cape Coral, though less frenzied, has a real estate market characterized by waterfront properties at reasonable prices. If waterfront living is desired, Cape Coral has a clear edge, while homebuyers seeking variety might be drawn to Charlotte.
Neighborhoods
Charlotte's neighborhoods are diverse and vibrant, from the urban Uptown to the historic Dilworth to the artsy NoDa. Cape Coral is composed primarily of residential neighborhoods, many with access to the city’s extensive canal system. For a bustling, lively neighborhood life, Charlotte takes precedence, while Cape Coral offers a tranquil, waterfront lifestyle.
Houses and residents
Type
Charlotte
Cape Coral
Houses
393,631
94,442
Average household size (people)
2.5
2.5
Median year apartment built
1998
1997
Median year house/condo built
1993
2000
Length of stay in the house since moving in
11.8 years
9.9 years
Houses occupied
365,269 (92.8%)
79,845 (84.5%)
Houses occupied by owners
193,930 (53.1%)
61,776 (77.4%)
Houses occupied by renters
171,339 (46.9%)
18,069 (22.6%)
Median rent asked for vacant for-rent units
$1,482
$1,772
Median monthly housing costs
$1,302
$1,349
Median price asked for vacant for-sale houses and condos
$445,491
$140,984
Estimated median house or condo value
$321,400
$291,600
Median numbers of rooms
5.3
5.6
Median number of rooms in apartments
4
5.1
Median number of rooms in houses and condos
6.6
5.9
Median house price - detached houses
$388,029
$339,568
Median house price - in 2-unit structures
$184,325
$324,517
Median house price - in 3-to-4-unit structures
$178,624
$137,148
Median house price - in 5 or more unit structures
$433,957
$255,183
Median house price - mobile homes
$52,977
$142,520
Median house price - Townhouses or other attached units
$296,370
$213,706
Median house price - All housing units
$378,423
$329,664
Median house age
26
23
Renting percentage
42.6%
27.5%
Housing density (houses/condos per square mile)
1,624.8
897.8
House value disparities
33.3%
28.3%
Household income disparities
44.1%
41.5%
Median household income for houses/condes with a mortgage
$105,905
$77,727
Median household income for apartments without a mortgage
$70,681
$61,759
Housing units without a mortgage
3,089 (2.1%)
1,461 (3.4%)
Housing units with both a second mortgage and home equity loan
10,553 (7.2%)
2,648 (6.2%)
Housing units with a mortgage
142,912 (97.9%)
41,286 (96.6%)
Housing units with a home equity loan
171 (0.1%)
126 (0.3%)
Housing units with a second mortgage
13,532 (9.3%)
3,257 (7.6%)
House/condo owner moved in on average (years ago)
9
6
House/condo renter moved in on average (years ago)
1
1
Housing units lacking complete kitchen facilities
0.8%
0.2%
Housing units lacking complete plumbing facilities
0.2%
0%
Housing units in structures
Housing units in structures
Charlotte
Cape Coral
One, detached
52.7%
78.8%
One, attached
9.1%
3.0%
Two
0.9%
4.4%
3 or 4
2.9%
2.4%
5 to 9
7.1%
4.9%
10 to 19
9.5%
3.2%
20 to 49
6.2%
1.7%
50 or more
10.3%
1.4%
Mobile homes
1.4%
0.4%
Median real estate property taxes paid for housing units
Self-employed workers in own not incorporated business
25,780
9,702
State government workers
16,519
1,062
Unpaid family workers
1,214
141
Industries and Occupations
Banking, healthcare, and technology dominate Charlotte's industrial landscape, offering a wide range of occupations. In contrast, Cape Coral's economy leans heavily on healthcare, retail, and education sectors, providing jobs suited for those industries. The healthcare sector is an overlapping industry in both cities, yet Charlotte offers a more diverse job market.
Charlotte is a major regional healthcare hub. Atrium Health, a nationally recognized leader in shaping health outcomes, is based here. Cape Coral supports a robust healthcare system with the Cape Coral Hospital being the largest employer. Health services in Charlotte may be more comprehensive due to the size and scope of the city’s healthcare facilities.
Health (county statistics)
Type
Charlotte
Cape Coral
General health status score of residents in this county from 1 (poor) to 5 (excellent)
Charlotte boasts impressive infrastructure, with a broad range of amenities and facilities. The city has a defined skyline comprised of high-rise buildings, hosting various corporate head offices. Cape Coral, on the other hand is more residential in nature with an emphasis on waterfront living. Cape Coral’s infrastructure leans towards providing living comfort, whereas Charlotte offers an urban, metropolitan lifestyle.
Infrastructure
Type
Charlotte
Cape Coral
Hospitals
37
3
TV stations
16
17
Bank branches located here
202
47
Bank institutions located here
26
17
Main business address for public companies
33
1
Nuclear power plants nearby
2
0
Drinking water stations with no reported violations in the past
24
0
Drinking water stations with reported violations in the past
HMDA - Conventional home purchase loans - Applications denied
Year
Charlotte
Cape Coral
1999
3,049
425
2000
1,568
291
2001
1,382
280
2002
1,275
328
2003
1,879
793
2004
2,415
1,337
2005
3,078
2,480
2006
3,864
3,246
2007
3,106
1,801
2008
1,287
656
2009
617
392
Culture and Food
Charlotte boasts a rich cultural scene, with a range of world-class museums, music venues, theaters, and diverse cuisine from food trucks to upscale dining. Cape Coral offers a more laid-back cultural vibe, with numerous outdoor festivals, art leagues, and variety of seafood dining options. Art and food lovers might find more options in Charlotte, while those who enjoy relaxing coastal vibes might prefer Cape Coral.
Sports Teams
Charlotte is home to two major sports teams, the Carolina Panthers (NFL) and the Charlotte Hornets (NBA), fueling a strong sports culture. Residents can also enjoy minor league baseball and hockey games. Cape Coral, while not home to any major sports teams, is within driving distance to the spring training facilities of the Boston Red Sox and Minnesota Twins. Charlotte might attract sports enthusiasts, while Cape Coral is ideal for those who enjoy minor league baseball and outdoor recreational activities.


 Charlotte, NC
 Cape Coral, FL