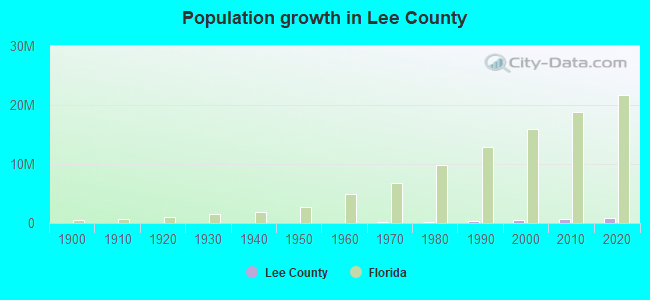
Lee County, Florida (FL)
County owner-occupied free and clear houses and condos in 2010: 71,269
County owner-occupied houses and condos in 2000: 144,256
Renter-occupied apartments: 75,341 (it was 44,343 in 2000)
| % of renters here: | 24% |
| State: | 33% |
Land area: 804 sq. mi.
Water area: 408.3 sq. mi.
Population density: 1023 people per square mile (very high).
Industries providing employment: Educational, health and social services (20.5%), Professional, scientific, management, administrative, and waste management services (14.5%), Retail trade (13.2%), Construction (11.6%), Arts, entertainment, recreation, accommodation and food services (11.4%).
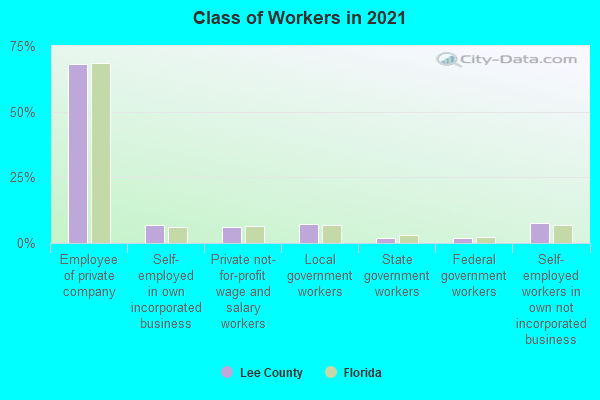
Type of workers:
- Private wage or salary: 83%
- Government: 10%
- Self-employed, not incorporated: 7%
- Unpaid family work: 0%
- OSM Map
- General Map
- Google Map
- MSN Map

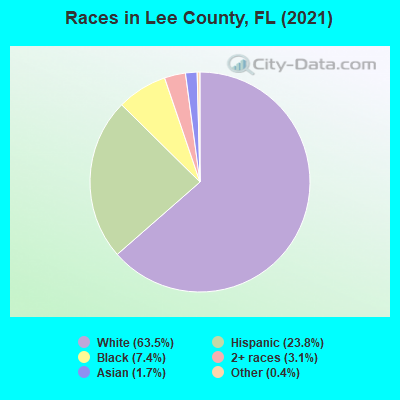
- 515,29862.7%White Non-Hispanic Alone
- 200,02424.3%Hispanic or Latino
- 60,6777.4%Black Non-Hispanic Alone
- 28,4753.5%Two or more races
- 14,3191.7%Asian alone
- 2,9150.4%Some other race alone
- 4960.06%American Indian and Alaska Native alone
- 2490.03%Native Hawaiian and Other
Pacific Islander alone
| Median resident age: | 49.5 years |
| Florida median age: | 42.7 years |
| Males: 405,001 | |
| Females: 417,452 |

 | WATER QUALITY - Lee County Impact Study (0 replies) |
| Recommendations for Lee County High Schools? (3 replies) |
| Coronavirus death in Lee County. (2 replies) |
| Irma - lee county (38 replies) |
| New Construction Building Inspector (19 replies) |
| What do you think of recent development in and around Lee County? (7 replies) |
| Lee County: | 2.0 people |
| Florida: | 2 people |
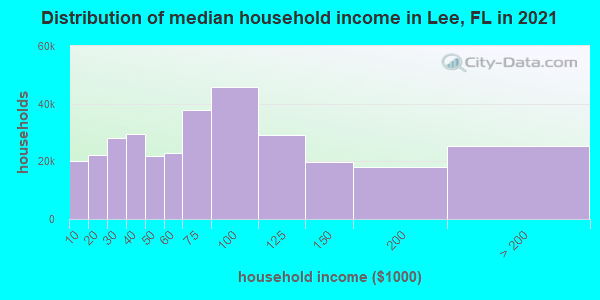
Estimated median household income in 2022: $71,072 ($40,319 in 1999)
| This county: | $71,072 |
| Florida: | $69,303 |
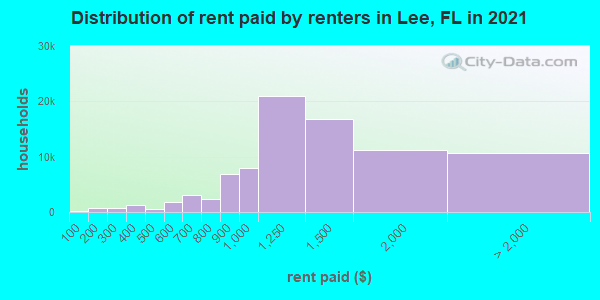
Median contract rent in 2022 for apartments: $1,441 (lower quartile is $1,094, upper quartile is $1,832)
| This county: | $1441 |
| State: | $1367 |
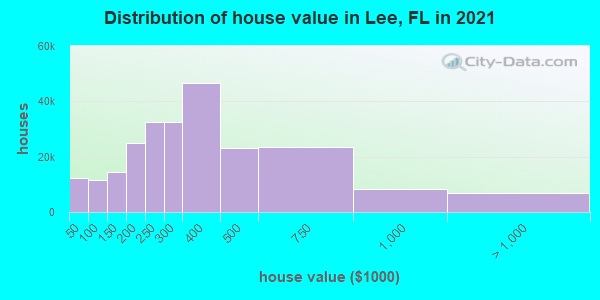
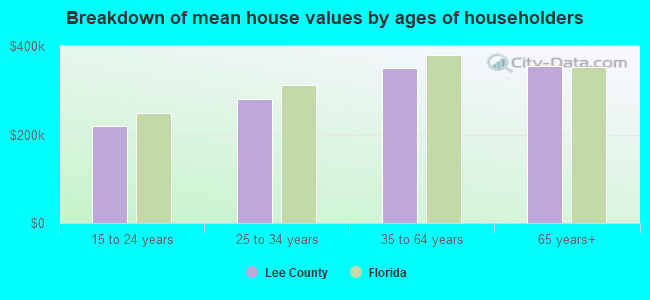
Estimated median house or condo value in 2022: $361,400 (it was $96,700 in 2000)
| Lee: | $361,400 |
| Florida: | $354,100 |
Mean price in 2022:
Median monthly housing costs for homes and condos with a mortgage: $1,678Detached houses: $494,058
Here: $494,058 State: $500,941 Townhouses or other attached units: $410,334
Here: $410,334 State: $370,869 In 2-unit structures: $372,716
Here: $372,716 State: $423,188 In 3-to-4-unit structures: $407,496
Here: $407,496 State: $309,944 In 5-or-more-unit structures: $372,763
Here: $372,763 State: $447,145 Mobile homes: $145,408
Here: $145,408 State: $113,202 Occupied boats, RVs, vans, etc.: $87,538
Here: $87,538 State: $73,933
Median monthly housing costs for units without a mortgage: $689
Institutionalized population: 4,259
Crime in 2020 (reported by the sheriff's office or county police, not the county total):
- Murders: 22
- Rapes: 179
- Robberies: 217
- Assaults: 949
- Burglaries: 677
- Thefts: 3029
- Auto thefts: 489
Crime in 2019 (reported by the sheriff's office or county police, not the county total):
- Murders: 9
- Rapes: 191
- Robberies: 256
- Assaults: 780
- Burglaries: 806
- Thefts: 3398
- Auto thefts: 428
Health of residents in Lee County based on CDC Behavioral Risk Factor Surveillance System Survey Questionnaires from 2003 to 2012:
General health status score of residents in this county from 1 (poor) to 5 (excellent) is 3.4. This is about average.72.0% of residents exercised in the past month. This is about average.
59.1% of residents smoked 100+ cigarettes in their lives. This is more than average.
99.7% of adult residents drank alcohol in the past 30 days. This is more than average.
69.6% of residents visited a dentist within the past year. This is about average.
Average weight of males is 194 pounds. This is about average.
Average weight of females is 152 pounds. This is less than average.
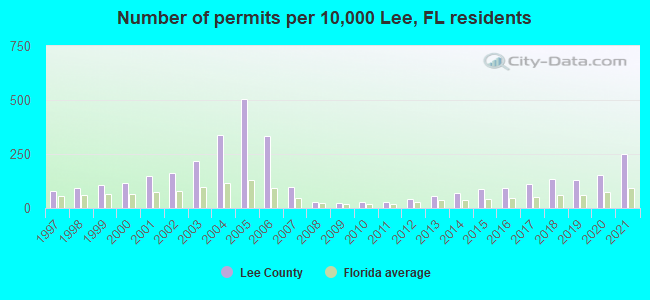
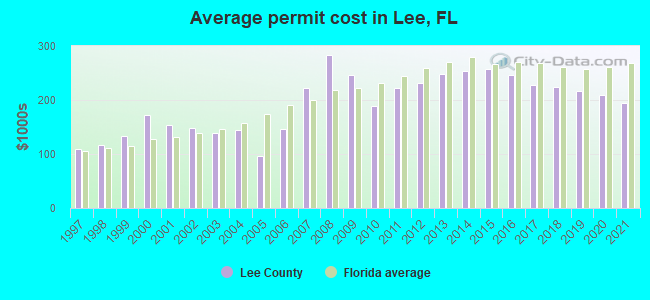
Single-family new house construction building permits:
- 2022: 9145 buildings, average cost: $234,800
- 2021: 11020 buildings, average cost: $194,900
- 2020: 6828 buildings, average cost: $210,300
- 2019: 5633 buildings, average cost: $216,400
- 2018: 5803 buildings, average cost: $223,800
- 2017: 4841 buildings, average cost: $227,800
- 2016: 4092 buildings, average cost: $247,000
- 2015: 3819 buildings, average cost: $258,100
- 2014: 3112 buildings, average cost: $254,400
- 2013: 2531 buildings, average cost: $248,800
- 2012: 1806 buildings, average cost: $231,100
- 2011: 1262 buildings, average cost: $222,300
- 2010: 1175 buildings, average cost: $189,200
- 2009: 906 buildings, average cost: $246,700
- 2008: 1216 buildings, average cost: $283,400
- 2007: 4356 buildings, average cost: $221,500
- 2006: 14700 buildings, average cost: $146,100
- 2005: 22211 buildings, average cost: $96,700
- 2004: 14958 buildings, average cost: $143,600
- 2003: 9668 buildings, average cost: $137,900
- 2002: 7149 buildings, average cost: $148,600
- 2001: 6534 buildings, average cost: $154,200
- 2000: 5152 buildings, average cost: $172,600
- 1999: 4722 buildings, average cost: $133,000
- 1998: 3995 buildings, average cost: $115,500
- 1997: 3534 buildings, average cost: $110,200
Median real estate property taxes paid for housing units with mortgages in 2022: $2,616 (0.7%)
Median real estate property taxes paid for housing units with no mortgage in 2022: $2,576 (0.7%)
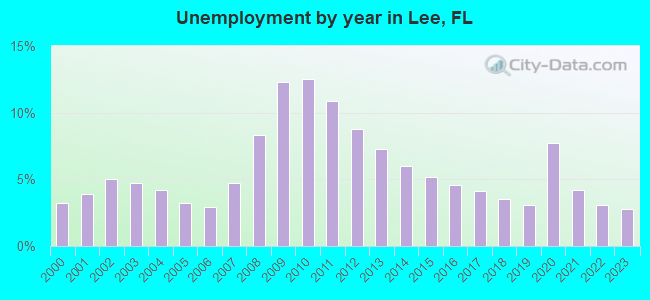
| Lee County: | 11.1% |
| Florida: | 12.7% |
Median age of residents in 2022: 49.5 years old
(Males: 48.2 years old, Females: 50.8 years old)
(Median age for: White residents: 59.9 years old, Black residents: 33.5 years old, American Indian residents: 22.6 years old, Asian residents: 42.5 years old, Hispanic or Latino residents: 34.4 years old, Other race residents: 35.3 years old)
Area name: Cape Coral-Fort Myers, FL MSA
Fair market rent in 2006 for a 1-bedroom apartment in Lee County is $639 a month.
Fair market rent for a 2-bedroom apartment is $728 a month.
Fair market rent for a 3-bedroom apartment is $989 a month.
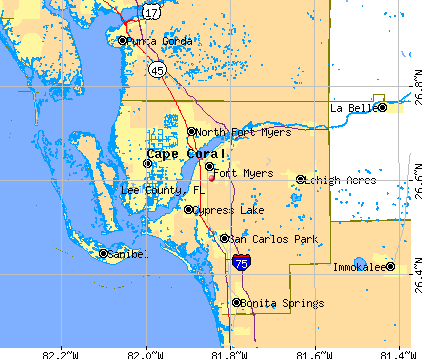
Cities in this county include: Cape Coral, Fort Myers, North Fort Myers, Lehigh Acres, Bonita Springs, San Carlos Park, Cypress Lake, Iona, Villas, Estero.
| Zip Code | City | Certified Residential Database | Mandatory Residential Database | Mandatory Non-Residential Database | |||
|---|---|---|---|---|---|---|---|
| Buildings Measured | Above 4 pCi/L (%) | Buildings Measured | Above 4 pCi/L (%) | Buildings Measured | Above 4 pCi/L (%) | ||
| 33901 | Fort Myers | 48 | 13 | 5 | 0 | 5 | 0 |
| 33903 | North Fort Myers | 16 | 6 | 11 | 0 | 11 | 0 |
| 33904 | Cape Coral | 48 | 15 | 3 | 0 | 3 | 0 |
| 33905 | Fort Myers | 17 | 24 | 6 | 0 | 6 | 0 |
| 33906 | Fort Myers | - | - | 1 | 0 | 1 | 0 |
| 33907 | Fort Myers | 429 | 79 | 2 | 0 | 2 | 0 |
| 33908 | Fort Myers | 229 | 5 | - | - | - | - |
| 33909 | Cape Coral | 9 | 33 | - | - | - | - |
| 33912 | Fort Myers | 122 | 15 | 5 | 20 | 5 | 20 |
| 33913 | Fort Myers | 48 | 33 | 1 | 0 | 1 | 0 |
| 33914 | Cape Coral | 48 | 19 | 2 | 0 | 2 | 0 |
| 33916 | Fort Myers | 7 | 0 | 5 | 0 | 5 | 0 |
| 33917 | North Fort Myers | 19 | 11 | 1 | 0 | 1 | 0 |
| 33919 | Fort Myers | 108 | 16 | 5 | 0 | 5 | 0 |
| 33920 | Alva | 3 | 0 | 1 | 0 | 1 | 0 |
| 33921 | Boca Grande | 2 | 0 | - | - | - | - |
| 33922 | Bokeelia | 1 | 0 | - | - | - | - |
| 33924 | Captiva | 2 | 0 | - | - | - | - |
| 33928 | Estero | 20 | 0 | - | - | - | - |
| 33931 | Fort Myers Beach | 6 | 0 | - | - | - | - |
| 33936 | Lehigh Acres | 13 | 8 | 5 | 0 | 5 | 0 |
| 33956 | Saint James City | 3 | 33 | - | - | - | - |
| 33957 | Sanibel | 29 | 3 | - | - | - | - |
| 33971 | Lehigh Acres | 4 | 0 | - | - | - | - |
| 33972 | Lehigh Acres | 12 | 17 | - | - | - | - |
| 33990 | Cape Coral | 20 | 25 | 2 | 0 | 2 | 0 |
| 33991 | Cape Coral | 11 | 9 | - | - | - | - |
| 33993 | Cape Coral | 3 | 33 | - | - | - | - |
| 33994 | Fort Myers | 1 | 0 | - | - | - | - |
| 34134 | Bonita Springs | 81 | 26 | - | - | - | - |
| 34135 | Bonita Springs | 31 | 10 | - | - | - | - |
Neighboring counties: DeSoto County  , Sarasota County
  , Kenedy County, Texas
  , Starr County, Texas .
| Here: | 3.0% |
| Florida: | 2.9% |
Current college students: 12,539
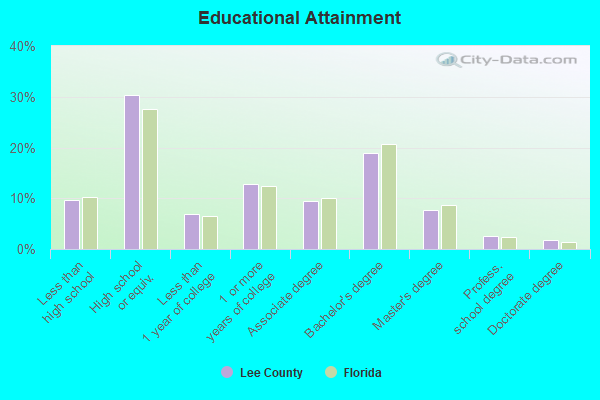
People 25 years of age or older with a high school degree or higher: 90.2%
People 25 years of age or older with a bachelor's degree or higher: 32.1%
Number of foreign born residents: 156,922 (49.5% naturalized citizens)
| Lee County: | 19.1% |
| Whole state: | 21.7% |
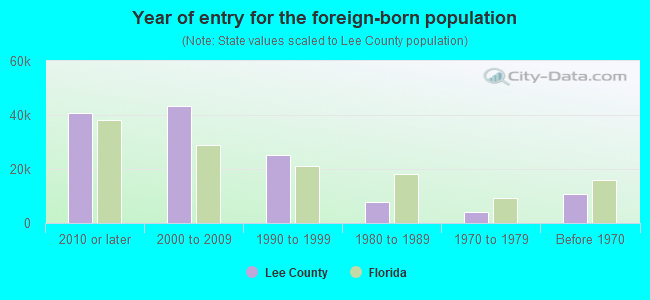
- Year of entry for the foreign-born population
- 65,0862010 or later
- 33,0682000 to 2009
- 24,8101990 to 1999
- 7,7331980 to 1989
- 4,0851970 to 1979
- 10,686Before 1970
Mean travel time to work (commute): minutes
Percentage of county residents living and working in this county: 98.4%
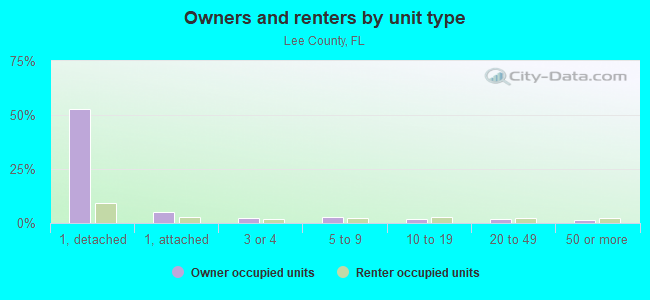
Housing units in structures:
- One, detached: 246,022
- One, attached: 32,978
- Two: 11,310
- 3 or 4: 19,195
- 5 to 9: 23,706
- 10 to 19: 26,439
- 20 to 49: 25,498
- 50 or more: 19,279
- Mobile homes: 37,025
- Boats, RVs, vans, etc.: 626
Housing units in Lee County with a mortgage: 128,907 (8,283 second mortgage, 680 home equity loan, 6,273 both second mortgage and home equity loan)
Houses without a mortgage: 2,676
| Here: | 98.5% with mortgage |
| State: | 97.6% with mortgage |
Religion statistics for Lee County
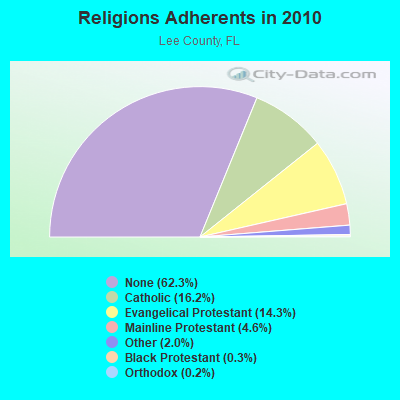

| Religion | Adherents | Congregations |
|---|---|---|
| Catholic | 100,300 | 20 |
| Evangelical Protestant | 88,687 | 288 |
| Mainline Protestant | 28,605 | 62 |
| Other | 12,684 | 45 |
| Black Protestant | 1,919 | 11 |
| Orthodox | 970 | 4 |
| None | 385,589 | - |
Source: Clifford Grammich, Kirk Hadaway, Richard Houseal, Dale E.Jones, Alexei Krindatch, Richie Stanley and Richard H.Taylor. 2012. 2010 U.S.Religion Census: Religious Congregations & Membership Study. Association of Statisticians of American Religious Bodies. Jones, Dale E., et al. 2002. Congregations and Membership in the United States 2000. Nashville, TN: Glenmary Research Center.
Food Environment Statistics:
| Lee County: | 1.96 / 10,000 pop. |
| State: | 2.04 / 10,000 pop. |
| Here: | 0.19 / 10,000 pop. |
| Florida: | 0.11 / 10,000 pop. |
| This county: | 0.85 / 10,000 pop. |
| Florida: | 1.28 / 10,000 pop. |
| Lee County: | 2.84 / 10,000 pop. |
| Florida: | 3.04 / 10,000 pop. |
| This county: | 8.64 / 10,000 pop. |
| State: | 7.45 / 10,000 pop. |
| Lee County: | 10.1% |
| Florida: | 9.2% |
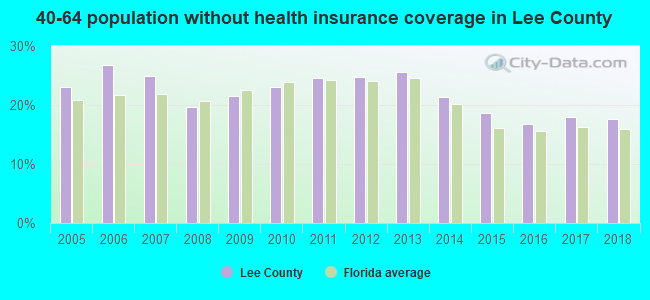
| Lee County: | 24.9% |
| State: | 23.7% |
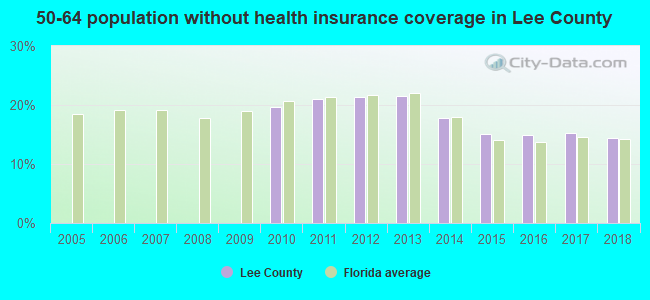
| Here: | 15.4% |
| State: | 14.0% |
Agriculture in Lee County:
Average size of farms: 197 acresAverage value of agricultural products sold per farm: $176,370
Average value of crops sold per acre for harvested cropland: $4236.72
The value of nursery, greenhouse, floriculture, and sod as a percentage of the total market value of agricultural products sold: 57.74%
The value of livestock, poultry, and their products as a percentage of the total market value of agricultural products sold: 3.76%
Average total farm production expenses per farm: $118,610
Harvested cropland as a percentage of land in farms: 20.37%
Irrigated harvested cropland as a percentage of land in farms: 88.48%
Average market value of all machinery and equipment per farm: $62,165
The percentage of farms operated by a family or individual: 81.18%
Average age of principal farm operators: 55 years
Average number of cattle and calves per 100 acres of all land in farms: 13.34
Vegetables: 3,254 harvested acres
Land in orchards: 17,101 acres
Earthquake activity:
Lee County-area historical earthquake activity is above Florida state average. It is 93% smaller than the overall U.S. average.On 9/10/2006 at 14:56:08, a magnitude 5.9 (5.9 MB, 5.5 MS, 5.8 MW, Class: Moderate, Intensity: VI - VII) earthquake occurred 297.3 miles away from Lee County center
On 3/31/1992 at 14:59:39, a magnitude 3.8 (3.8 MB, Depth: 3.1 mi, Class: Light, Intensity: II - III) earthquake occurred 244.2 miles away from the county center
On 6/23/2016 at 17:20:29, a magnitude 3.8 (3.8 ML) earthquake occurred 276.3 miles away from the county center
On 9/21/2016 at 16:30:52, a magnitude 3.8 (3.8 ML) earthquake occurred 279.3 miles away from the county center
On 9/4/2016 at 18:29:29, a magnitude 3.8 (3.8 ML) earthquake occurred 279.3 miles away from Lee County center
On 10/24/1997 at 08:35:17, a magnitude 4.9 (4.8 MB, 4.2 MS, 4.9 LG, Depth: 6.2 mi, Class: Light, Intensity: IV - V) earthquake occurred 453.5 miles away from the county center
Magnitude types: regional Lg-wave magnitude (LG), body-wave magnitude (MB), local magnitude (ML), surface-wave magnitude (MS), moment magnitude (MW)
Most recent natural disasters:
- Florida Covid-19 Pandemic, Incident Period: January 20, 2020, FEMA Id: 4486, Natural disaster type: Other
- Florida Hurricane Irma, Incident Period: September 4, 2017 - October 18, 2017, FEMA Id: 4337, Natural disaster type: Hurricane
- Florida Tropical Storm Debby, Incident Period: June 23, 2012 to July 26, 2012, Major Disaster (Presidential) Declared DR-4068: July 03, 2012, FEMA Id: 4068, Natural disaster type: Tropical Storm
- Florida Tropical Storm Fay, Incident Period: August 18, 2008 to September 12, 2008, Major Disaster (Presidential) Declared DR-1785: August 24, 2008, FEMA Id: 1785, Natural disaster type: Tropical Storm
- Florida Tropical Storm Fay, Incident Period: August 18, 2008 to September 12, 2008, Emergency Declared EM-3288: August 21, 2008, FEMA Id: 3288, Natural disaster type: Tropical Storm
- Florida Caloosahatchee Fire Complex, Incident Period: May 07, 2007 to December 31, 1969, Fire Management Assistance Declared: May 09, 2007, FEMA Id: 2692, Natural disaster type: Fire
- Florida Hurricane Wilma, Incident Period: October 23, 2005 to November 18, 2005, Major Disaster (Presidential) Declared DR-1609: October 24, 2005, FEMA Id: 1609, Natural disaster type: Hurricane
- Florida Hurricane Katrina Evacuation, Incident Period: August 29, 2005 to October 01, 2005, Emergency Declared EM-3220: September 05, 2005, FEMA Id: 3220, Natural disaster type: Hurricane
- Florida Hurricane Ivan, Incident Period: September 13, 2004 to November 17, 2004, Major Disaster (Presidential) Declared DR-1551: September 16, 2004, FEMA Id: 1551, Natural disaster type: Hurricane
- Florida Hurricane Frances, Incident Period: September 03, 2004 to October 08, 2004, Major Disaster (Presidential) Declared DR-1545: September 04, 2004, FEMA Id: 1545, Natural disaster type: Hurricane
- 13 other natural disasters have been reported since 1953.
The number of natural disasters in Lee County (23) is greater than the US average (15).
Major Disasters (Presidential) Declared: 13
Emergencies Declared: 5
Causes of natural disasters: Hurricanes: 11, Tropical Storms: 6, Fires: 5, Freeze: 1, Other: 1 (Note: some incidents may be assigned to more than one category).
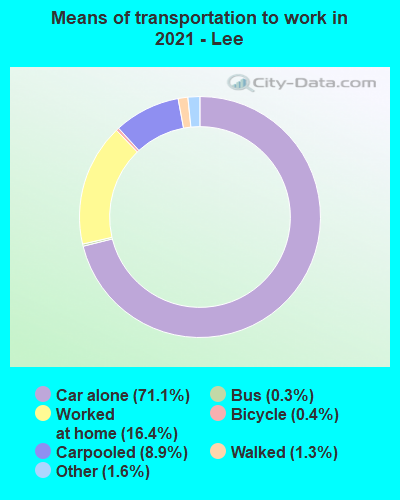
Means of transportation to work:
- Drove a car alone: 238,883 (70.0%)
- Carpooled: 37,530 (11.0%)
- Bus: 1,832 (0.5%)
- Long-distance train or commuter rail: 132 (0.0%)
- Taxicab, motorcycle, or other means: 4,123 (1.2%)
- Bicycle: 1,116 (0.3%)
- Walked: 3,979 (1.2%)
- Worked at home: 53,495 (15.7%)
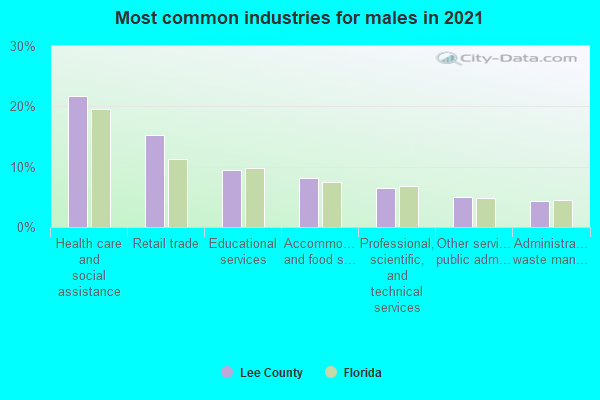
- Health care and social assistance (19%)
- Retail trade (11%)
- Educational services (10%)
- Accommodation and food services (8%)
- Professional, scientific, and technical services (7%)
- Administrative and support and waste management services (5%)
- Other services, except public administration (5%)
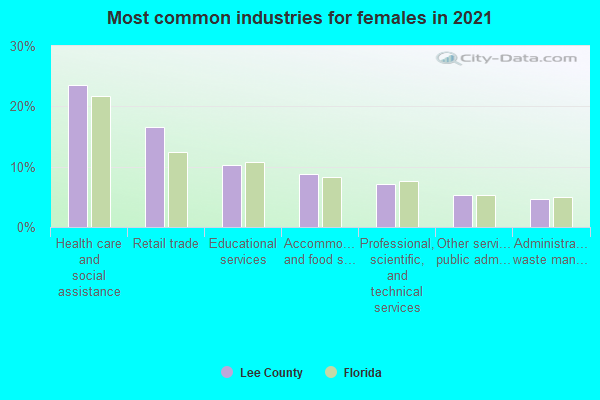
- Health care and social assistance (22%)
- Retail trade (13%)
- Educational services (12%)
- Accommodation and food services (10%)
- Professional, scientific, and technical services (8%)
- Administrative and support and waste management services (6%)
- Other services, except public administration (5%)
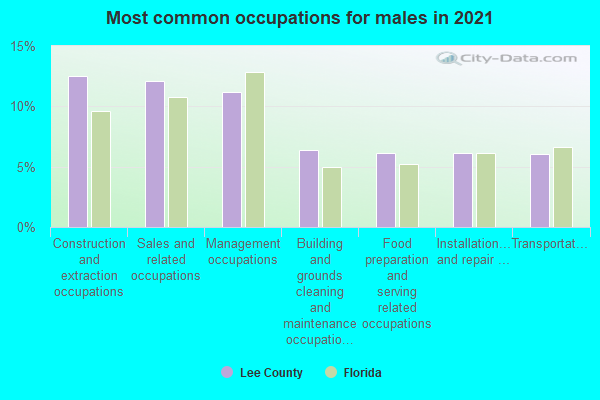
- Construction and extraction occupations (15%)
- Sales and related occupations (12%)
- Management occupations (12%)
- Transportation occupations (7%)
- Installation, maintenance, and repair occupations (7%)
- Building and grounds cleaning and maintenance occupations (7%)
- Food preparation and serving related occupations (5%)
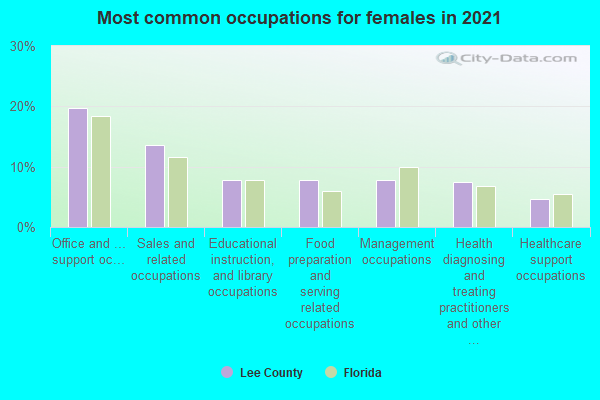
- Office and administrative support occupations (16%)
- Sales and related occupations (12%)
- Management occupations (11%)
- Food preparation and serving related occupations (8%)
- Educational instruction, and library occupations (8%)
- Business and financial operations occupations (7%)
- Health diagnosing and treating practitioners and other technical occupations (6%)
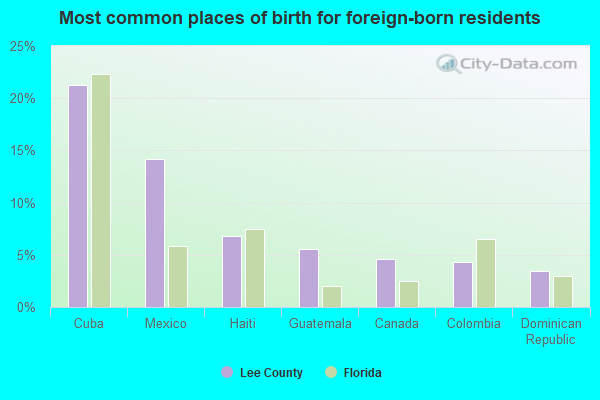
- Cuba (22%)
- Mexico (10%)
- Haiti (7%)
- Guatemala (6%)
- Canada (5%)
- Colombia (4%)
- Dominican Republic (3%)
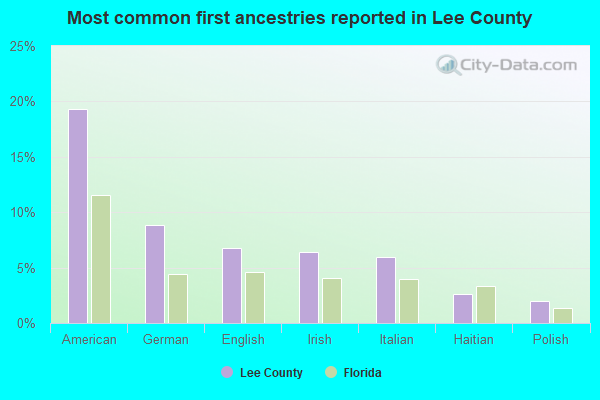
- American (15%)
- German (9%)
- English (7%)
- Irish (6%)
- Italian (6%)
- Haitian (3%)
- Polish (2%)
People in group quarters in Lee County, Florida in 2010:
- 2,677 people in college/university student housing
- 2,225 people in nursing facilities/skilled-nursing facilities
- 1,742 people in local jails and other municipal confinement facilities
- 406 people in other noninstitutional facilities
- 340 people in workers' group living quarters and job corps centers
- 302 people in group homes intended for adults
- 273 people in residential treatment centers for adults
- 222 people in emergency and transitional shelters (with sleeping facilities) for people experiencing homelessness
- 117 people in state prisons
- 81 people in group homes for juveniles (non-correctional)
- 49 people in correctional facilities intended for juveniles
- 33 people in in-patient hospice facilities
- 9 people in military barracks and dormitories (nondisciplinary)
- 7 people in residential treatment centers for juveniles (non-correctional)
- 5 people in correctional residential facilities
People in group quarters in Lee County, Florida in 2000:
- 2,767 people in nursing homes
- 738 people in other noninstitutional group quarters
- 655 people in local jails and other confinement facilities (including police lockups)
- 491 people in state prisons
- 238 people in college dormitories (includes college quarters off campus)
- 235 people in agriculture workers' dormitories on farms
- 102 people in short-term care, detention or diagnostic centers for delinquent children
- 78 people in mental (psychiatric) hospitals or wards
- 64 people in homes for the mentally retarded
- 55 people in other group homes
- 49 people in other types of correctional institutions
- 47 people in homes for the mentally ill
- 26 people in unknown juvenile institutions
- 20 people in homes for abused, dependent, and neglected children
- 15 people in other nonhousehold living situations
- 13 people in homes or halfway houses for drug/alcohol abuse
- 10 people in military ships
- 6 people in military barracks, etc.
- 4 people in religious group quarters
- 4 people in other workers' dormitories
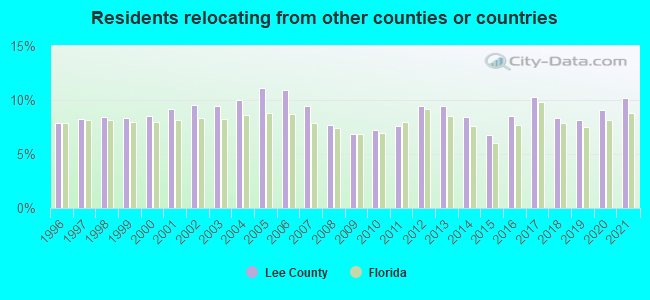
10.20% of this county's 2021 resident taxpayers lived in other counties in 2020 ($122,429 average adjusted gross income)
| Here: | 10.20% |
| Florida average: | 8.80% |
0.02% of residents moved from foreign countries ($105 average AGI)
Lee County: 0.02% Florida average: 0.05%
3.40% relocated from other counties in Florida ($24,123 average AGI)
6.78% relocated from other states ($98,201 average AGI)
Lee County: 6.78% Florida average: 4.38%
Top counties from which taxpayers relocated into this county between 2020 and 2021:
| from Collier County, FL | |
| from Miami-Dade County, FL | |
| from Broward County, FL | |
| from Cook County, IL | |
| from Charlotte County, FL | |
| from Palm Beach County, FL | |
| from Hillsborough County, FL |
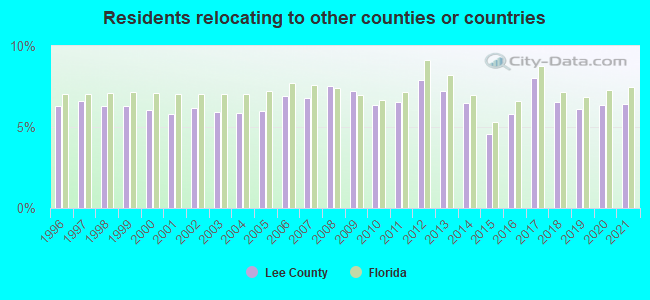
6.43% of this county's 2020 resident taxpayers moved to other counties in 2021 ($74,267 average adjusted gross income)
| Here: | 6.43% |
| Florida average: | 7.45% |
0.02% of residents moved to foreign countries ($109 average AGI)
Lee County: 0.02% Florida average: 0.04%
2.76% relocated to other counties in Florida ($31,627 average AGI)
3.65% relocated to other states ($42,531 average AGI)
Lee County: 3.65% Florida average: 2.97%
Top counties to which taxpayers relocated from this county between 2020 and 2021:
| to Collier County, FL | |
| to Charlotte County, FL | |
| to Hillsborough County, FL | |
| to Miami-Dade County, FL | |
| to Broward County, FL | |
| to Sarasota County, FL | |
| to Orange County, FL |
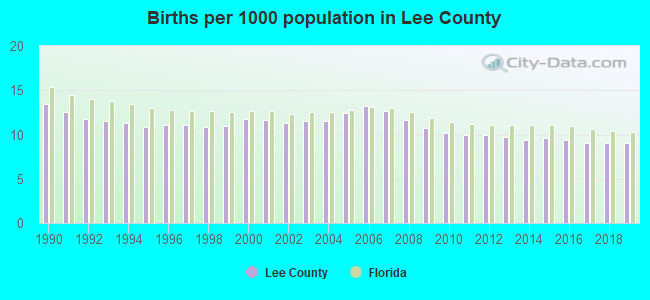
Births per 1000 population from 1990 to 1999: 11.6
Births per 1000 population from 2000 to 2009: 11.8
Births per 1000 population from 2010 to 2022: 8.0
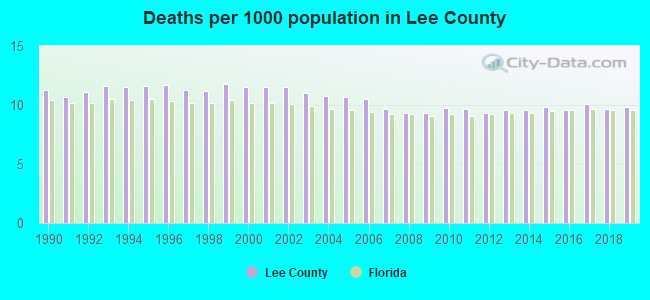
Deaths per 1000 population from 1990 to 1999: 11.4
Deaths per 1000 population from 2000 to 2009: 10.6
Deaths per 1000 population from 2010 to 2020: 9.8
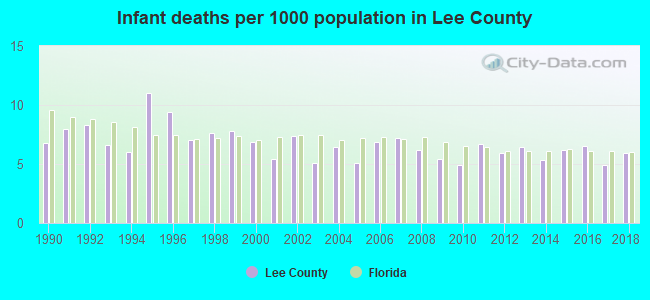
Infant deaths per 1000 live births from 1990 to 1999: 7.9
Infant deaths per 1000 live births from 2000 to 2009: 6.2
Infant deaths per 1000 live births from 2010 to 2021: 5.9
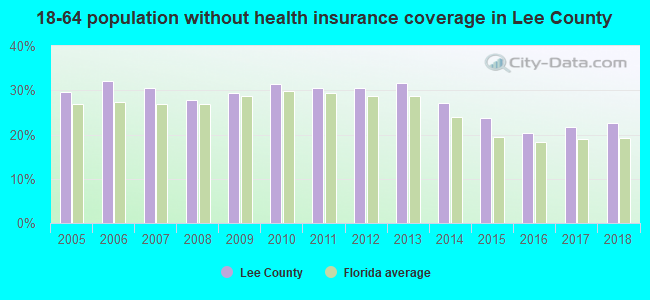
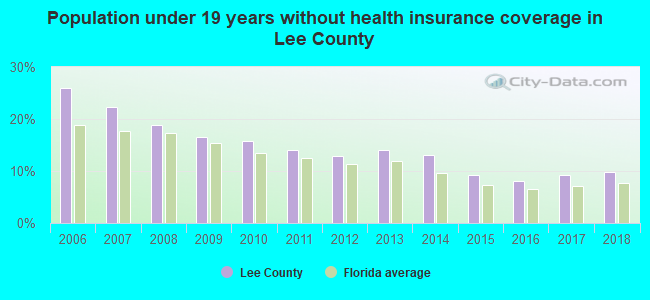
Persons under 19 years old without health insurance coverage in 2018: 9.8%
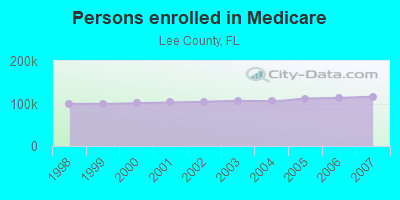
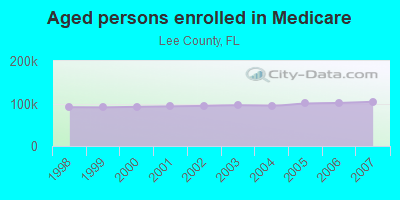
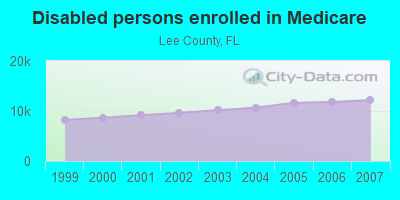
Persons enrolled in hospital insurance and/or supplemental medical insurance (Medicare) in July 1, 2007: 116,246 (104,049 aged, 12,197 disabled)
Children under 18 without health insurance coverage in 2007: 27,283 (21%)
Most common underlying causes of death in Lee County, Florida in 1999 - 2019:
- Atherosclerotic heart disease (13,425)
- Bronchus or lung, unspecified - Malignant neoplasms (9,349)
- Chronic obstructive pulmonary disease, unspecified (6,550)
- Atherosclerotic cardiovascular disease, so described (5,492)
- Acute myocardial infarction, unspecified (4,627)
- Unspecified dementia (3,961)
- Alzheimer disease, unspecified (3,132)
- Stroke, not specified as haemorrhage or infarction (2,987)
- Hypertensive heart disease without (congestive) heart failure (2,384)
- Colon, unspecified - Malignant neoplasms (2,124)
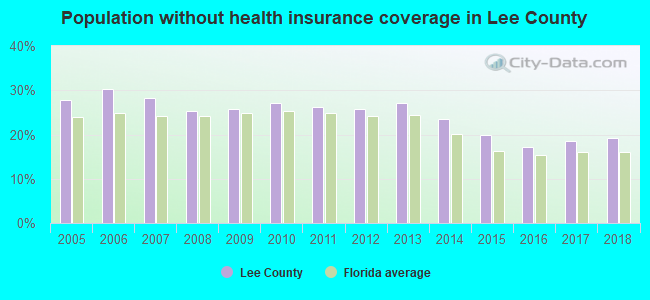
Population without health insurance coverage in 2000: 15%
Children under 18 without health insurance coverage in 2000: 15%
Short term general hospital admissions per 100,000 population in 2004: 15,158
Short term general hospital beds per 100,000 population in 2004: 311
Emergency room visits per 100,000 population in 2004: 34,172
General practice office based MDs per 100,000 population in 2005: 1,185
Medical specialist MDs per 100,000 population in 2005: 1,055
Dentists per 100,000 population in 1998: 6
Total births per 100,000 population, July 2005 - July 2006 : 41
Total deaths per 100,000 population, July 2005 - July 2006: 64
Limited-service eating places per 100,000 population in 2005 : 10
Homicides per 1,000,000 population from 2000 to 2006: 64.0. This is more than state average.
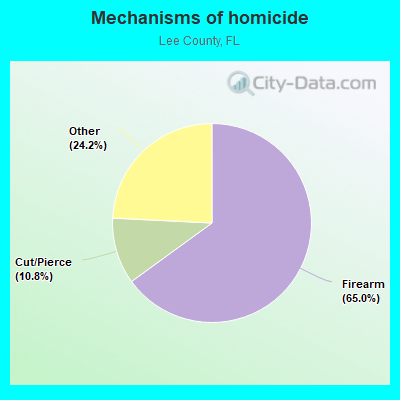
- Firearm - 41.6
- Cut/Pierce - 6.9
- Other - 15.5
Suicides per 1,000,000 population from 2000 to 2006: 167.9. This is more than state average.
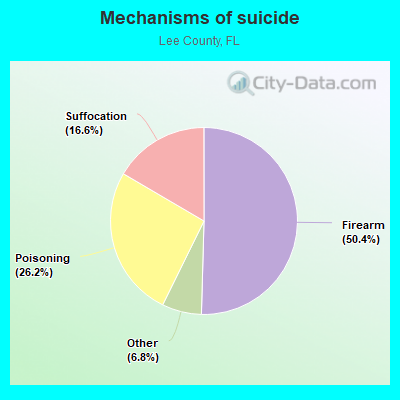
- Firearm - 84.7
- Poisoning - 43.9
- Suffocation - 27.8
- Other - 11.5
Household type by relationship:
Households: 822,453- Male householders: 171,934 (37,699 living alone), Female householders: 167,335 (53,949 living alone)
174,982 spouses (173,271 opposite-sex spouses), 29,349 unmarried partners, (28,500 opposite-sex unmarried partners), 189,933 children (175,421 natural, 5,181 adopted, 9,331 stepchildren), 15,328 grandchildren, 10,043 brothers or sisters, 15,677 parents, 0 foster children, 13,322 other relatives, 21,658 non-relatives
- In group quarters: 12,892
Size of family households: 135,337 2-persons, 38,012 3-persons, 28,695 4-persons, 13,888 5-persons, 4,862 6-persons, 2,261 7-or-more-persons.
Size of nonfamily households: 91,648 1-person, 21,132 2-persons, 2,322 3-persons, 967 4-persons, 145 5-persons.
80,658 married couples with children.
40,494 single-parent households (11,338 men, 29,156 women).
74.3% of residents of Lee speak English at home.
19.6% of residents speak Spanish at home (52% speak English very well, 19% speak English well, 15% speak English not well, 14% don't speak English at all).
4.8% of residents speak other Indo-European language at home (65% speak English very well, 21% speak English well, 12% speak English not well, 3% don't speak English at all).
0.8% of residents speak Asian or Pacific Island language at home (64% speak English very well, 18% speak English well, 15% speak English not well, 2% don't speak English at all).
0.5% of residents speak other language at home (75% speak English very well, 10% speak English well, 5% speak English not well, 10% don't speak English at all).
In fiscal year 2004:
Federal Government expenditure: $2,866,389,000 ($5,573 per capita)
Department of Defense expenditure: $100,578,000
Federal direct payments to individuals for retirement and disability: $1,657,251,000
Federal other direct payments to individuals: $775,992,000
Federal direct payments not to individuals: $15,524,000
Federal grants: $226,529,000
Federal procurement contracts: $52,180,000 ($12,338,000 Department of Defense)
Federal salaries and wages: $138,912,000 ($2,527,000 Department of Defense)
Federal Government direct loans: $14,449,000
Federal guaranteed/insured loans: $315,822,000
Federal Government insurance: $20,919,161,000
Population change from April 1, 2000 to July 1, 2005:
Births: 28,987| Here: | 53 per 1000 residents |
| State: | 63 per 1000 residents |
Deaths: 27,821
| Here: | 51 per 1000 residents |
| State: | 49 per 1000 residents |
Net international migration: +10,075
| Here: | +18 per 1000 residents |
| State: | +30 per 1000 residents |
Net internal migration: +93,478
| Here: | +172 per 1000 residents |
| State: | +59 per 1000 residents |
Total withdrawal of fresh water for public supply: 52.37 millions of gallons per day (94% from ground, 6% from surface)
| Here: | 5.5 |
| State: | 5.9 |
| Here: | 4.4 |
| State: | 4.2 |
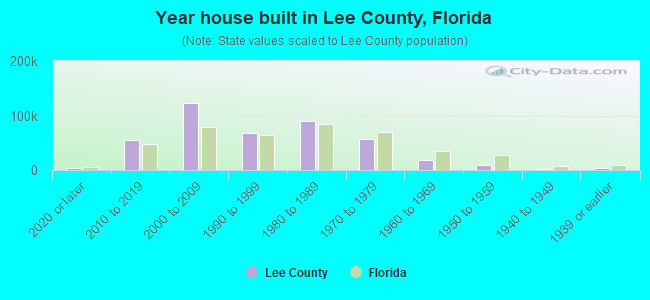
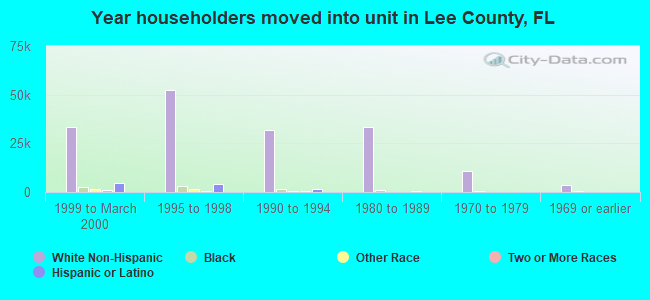
- Year house built in Lee County, Florida
- 14,1772020 or later
- 58,4582010 to 2019
- 130,1662000 to 2009
- 67,8601990 to 1999
- 83,5821980 to 1989
- 53,7991970 to 1979
- 21,1661960 to 1969
- 8,3421950 to 1959
- 1,6791940 to 1949
- 2,8491939 or earlier
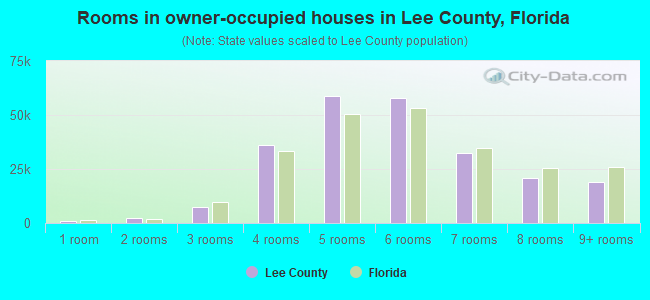
- Rooms in owner-occupied houses in Lee County, Florida
- 2041 room
- 2,5612 rooms
- 8,9663 rooms
- 42,1114 rooms
- 71,1765 rooms
- 53,2916 rooms
- 34,6327 rooms
- 21,0478 rooms
- 16,9709+ rooms
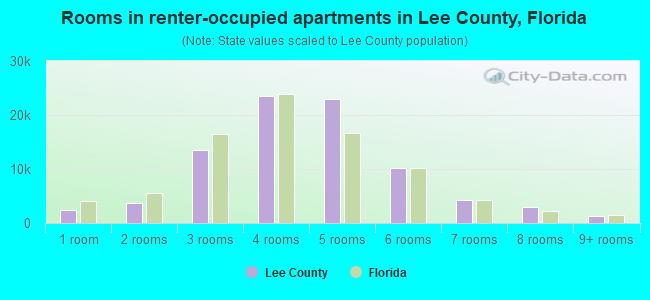
- Rooms in renter-occupied apartments in Lee County, Florida
- 4,0371 room
- 2,8432 rooms
- 15,0023 rooms
- 24,3384 rooms
- 23,1305 rooms
- 10,7946 rooms
- 4,0207 rooms
- 2,3888 rooms
- 1,7599+ rooms
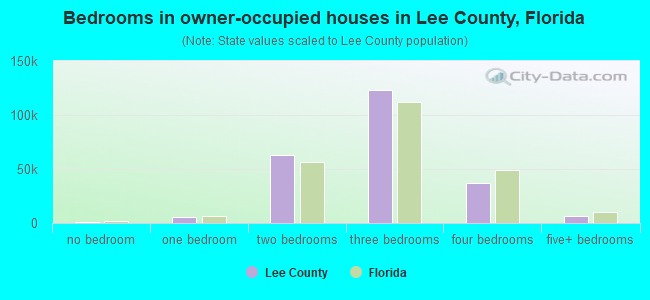
- Bedrooms in owner-occupied houses in Lee County, Florida
- 819no bedroom
- 6,3521 bedroom
- 69,0182 bedrooms
- 136,4443 bedrooms
- 33,2384 bedrooms
- 5,0875+ bedrooms
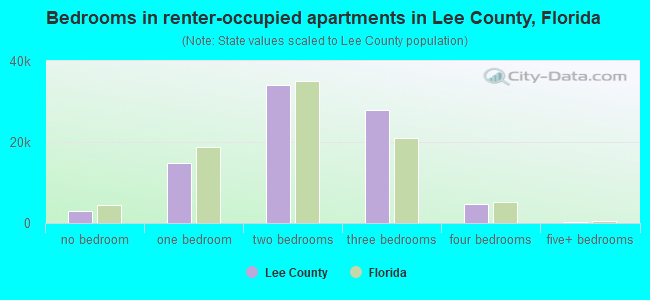
- Bedrooms in renter-occupied apartments in Lee County, Florida
- 4,395no bedroom
- 13,3341 bedroom
- 36,3192 bedrooms
- 29,8043 bedrooms
- 4,1914 bedrooms
- 2685+ bedrooms
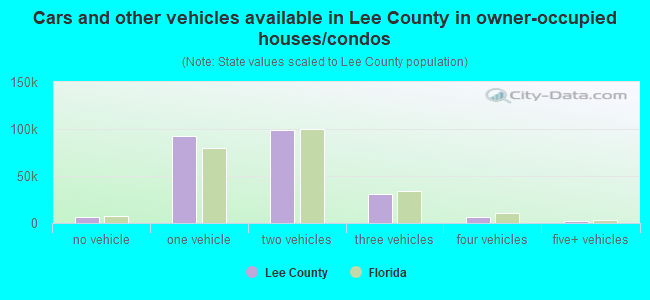
- Cars and other vehicles available in Lee County in owner-occupied houses/condos
- 5,925no vehicle
- 98,8261 vehicle
- 105,7642 vehicles
- 29,4193 vehicles
- 7,7444 vehicles
- 3,2805+ vehicles
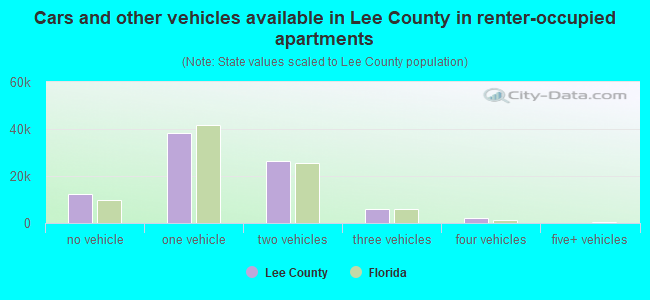
- Cars and other vehicles available in Lee County in renter-occupied apartments
- 10,054no vehicle
- 39,9681 vehicle
- 29,0662 vehicles
- 6,8103 vehicles
- 2,0204 vehicles
- 3935+ vehicles
87.3% of Lee County residents lived in the same house 1 years ago.
Out of people who lived in different houses, 29% lived in this county.
Out of people who lived in different counties, 32% lived in Florida.
| Lee County: | 87.3% |
| State average: | 86.3% |
Place of birth for U.S.-born residents:
- This state: 212,389
- Other state: 432,418
- Northeast: 170,139
- Midwest: 166,349
- South: 74,853
- West: 21,077
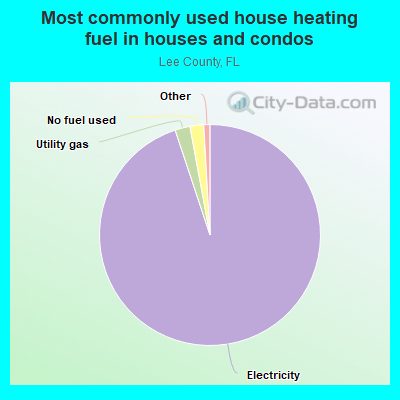
- 94.4%Electricity
- 2.3%Utility gas
- 2.2%No fuel used
- 0.6%Bottled, tank, or LP gas
- 0.3%Solar energy
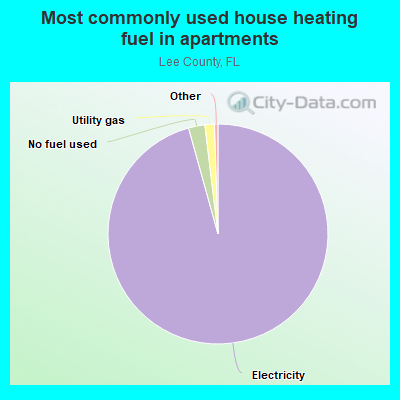
- 95.0%Electricity
- 2.4%No fuel used
- 2.0%Utility gas
- 0.3%Bottled, tank, or LP gas
- 0.1%Fuel oil, kerosene, etc.
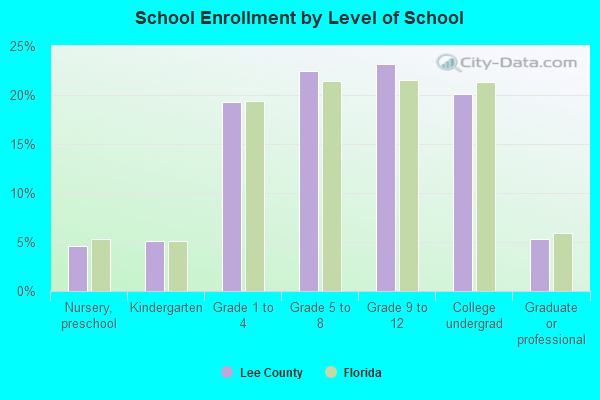
Private vs. public school enrollment:
| Here: | 11.6% |
| Florida: | 15.8% |
| Here: | 8.2% |
| Florida: | 12.9% |
| Here: | 18.7% |
| Florida: | 23.6% |
Lee County government finances - Expenditure in 2020:
- Bond Funds - Cash and Securities: $312,764,000
Cash and Securities: $282,355,000
- Charges - Air Transportation: $129,113,000
Air Transportation: $118,925,000
Solid Waste Management: $83,774,000
Other: $79,544,000
Other: $72,330,000
Solid Waste Management: $71,950,000
Sewerage: $60,706,000
Sewerage: $58,883,000
Toll Highways: $44,691,000
Toll Highways: $42,789,000
Parks and Recreation: $6,192,000
Parks and Recreation: $6,023,000
Natural Resources - Other: $2,635,000
Natural Resources - Other: $2,429,000
Regular Highways: $1,050,000
Regular Highways: $927,000
Parking Facilities: $557,000
Parking Facilities: $378,000
Miscellaneous Commercial Activities: $248,000
Miscellaneous Commercial Activities: $244,000
- Construction - Air Transportation: $46,511,000
Regular Highways: $44,036,000
Water Utilities: $43,297,000
Sewerage: $43,297,000
Air Transportation: $36,575,000
Regular Highways: $27,566,000
Sewerage: $20,050,000
Water Utilities: $20,050,000
General - Other: $19,614,000
General - Other: $11,856,000
Solid Waste Management: $6,624,000
Natural Resources - Other: $4,872,000
Parks and Recreation: $3,532,000
Solid Waste Management: $3,119,000
Parks and Recreation: $2,081,000
Natural Resources - Other: $1,454,000
- Current Operations - Financial Administration: $153,760,000
Police Protection: $148,236,000
Police Protection: $132,236,000
General - Other: $88,175,000
General - Other: $85,577,000
Solid Waste Management: $83,995,000
Air Transportation: $77,661,000
Air Transportation: $75,123,000
Solid Waste Management: $72,608,000
Financial Administration: $68,725,000
Correctional Institutions: $64,055,000
Regular Highways: $60,515,000
Correctional Institutions: $58,360,000
Health - Other: $52,592,000
Water Utilities: $52,253,000
Health - Other: $46,332,000
Regular Highways: $45,290,000
Water Utilities: $42,218,000
Parks and Recreation: $41,053,000
Parks and Recreation: $37,404,000
Judicial and Legal Services: $34,210,000
Central Staff Services: $31,452,000
Libraries: $30,271,000
Central Staff Services: $27,406,000
Judicial and Legal Services: $26,621,000
Libraries: $26,238,000
Transit Utilities: $24,997,000
Transit Utilities: $23,525,000
Sewerage: $22,294,000
Natural Resources - Other: $18,362,000
Sewerage: $18,013,000
General Public Buildings: $14,032,000
General Public Buildings: $13,913,000
Toll Highways: $13,624,000
Natural Resources - Other: $11,078,000
Protective Inspection and Regulation - Other: $10,885,000
Toll Highways: $10,283,000
Protective Inspection and Regulation - Other: $9,076,000
Housing and Community Development: $8,644,000
Housing and Community Development: $7,998,000
Public Welfare, Vendor Payments for Medical Care: $5,237,000
Public Welfare, Vendor Payments for Medical Care: $4,728,000
Public Welfare - Other: $3,827,000
Public Welfare - Other: $3,726,000
Corrections - Other: $2,060,000
Corrections - Other: $2,003,000
Local Fire Protection: $1,320,000
Local Fire Protection: $1,015,000
- Federal Intergovernmental - Other: $22,425,000
Air Transportation: $18,012,000
Other: $9,624,000
Transit Utilities: $8,437,000
Air Transportation: $6,829,000
Transit Utilities: $4,344,000
Public Welfare: $1,834,000
Public Welfare: $1,522,000
Highways: $280,000
Highways: $255,000
General Local Government Support: $70,000
General Local Government Support: $69,000
- General - Interest on Debt: $27,716,000
Interest on Debt: $25,709,000
- Intergovernmental to Local - Other - General - Other: $1,000
- Intergovernmental to State - Health - Other: $4,640,000
Health - Other: $4,640,000
General - Other: $1,000
- Local Intergovernmental - Other: $21,554,000
Other: $19,912,000
Highways: $1,890,000
Highways: $435,000
- Long Term Debt - Outstanding Unspecified Public Purpose: $944,961,000
Beginning Outstanding - Unspecified Public Purpose: $942,390,000
Beginning Outstanding - Unspecified Public Purpose: $920,605,000
Outstanding Unspecified Public Purpose: $873,927,000
Retired Unspecified Public Purpose: $94,772,000
Retired Unspecified Public Purpose: $87,316,000
Issue, Unspecified Public Purpose: $1,284,000
Issue, Unspecified Public Purpose: $617,000
- Miscellaneous - General Revenue - Other: $35,774,000
Interest Earnings: $32,057,000
General Revenue - Other: $27,267,000
Special Assessments: $15,175,000
Interest Earnings: $11,343,000
Special Assessments: $7,860,000
Fines and Forfeits: $5,347,000
Fines and Forfeits: $4,244,000
Donations From Private Sources: $1,802,000
Donations From Private Sources: $918,000
Rents: $850,000
Rents: $811,000
Sale of Property: $668,000
Sale of Property: $448,000
- Other Capital Outlay - Sewerage: $83,770,000
Sewerage: $39,534,000
Libraries: $15,820,000
Solid Waste Management: $7,131,000
Police Protection: $5,591,000
Transit Utilities: $5,118,000
Solid Waste Management: $3,283,000
Police Protection: $3,210,000
Central Staff Services: $3,075,000
Financial Administration: $1,799,000
Libraries: $1,586,000
Transit Utilities: $1,528,000
Housing and Community Development: $1,432,000
Health - Other: $698,000
Health - Other: $568,000
Financial Administration: $544,000
Correctional Institutions: $433,000
Judicial and Legal Services: $340,000
Judicial and Legal Services: $291,000
Housing and Community Development: $204,000
Central Staff Services: $198,000
Protective Inspection and Regulation - Other: $153,000
Protective Inspection and Regulation - Other: $144,000
Correctional Institutions: $80,000
General Public Building: $56,000
General Public Building: $12,000
Corrections - Other: $1,000
- Other Funds - Cash and Securities: $1,038,042,000
Cash and Securities: $987,583,000
- Revenue - Water Utilities: $54,729,000
Water Utilities: $52,903,000
Electric Utilities: $9,489,000
Electric Utilities: $9,147,000
Transit Utilities: $3,970,000
Transit Utilities: $3,822,000
- Sinking Funds - Cash and Securities: $22,702,000
Cash and Securities: $22,308,000
- State Intergovernmental - General Local Government Support: $70,812,000
General Local Government Support: $64,587,000
Other: $53,593,000
Other: $15,500,000
Highways: $13,817,000
Highways: $11,019,000
Transit Utilities: $5,018,000
Transit Utilities: $3,043,000
Housing and Community Development: $2,790,000
Housing and Community Development: $643,000
Public Welfare: $508,000
Public Welfare: $434,000
Health and Hospitals: $223,000
Health and Hospitals: $223,000
- Tax - Property: $375,080,000
Property: $330,560,000
Other Selective Sales: $42,584,000
Other Selective Sales: $39,651,000
Occupation and Business License - Other: $21,736,000
Motor Fuels Sales: $21,489,000
Motor Fuels Sales: $20,860,000
Occupation and Business License - Other: $20,560,000
Other License: $11,362,000
Public Utilities Sales: $9,470,000
Other License: $9,277,000
Public Utilities Sales: $7,349,000
Documentary and Stock Transfer: $4,046,000
Documentary and Stock Transfer: $3,866,000
- Transit Utilities - Interest on Debt: $3,666,000
Interest on Debt: $3,126,000
- Water Utilities - Interest on Debt: $8,255,000
Interest on Debt: $4,896,000
Lee County government finances - Revenue in 2020:
- Bond Funds - Cash and Securities: $312,764,000
Cash and Securities: $282,355,000
- Charges - Air Transportation: $129,113,000
Air Transportation: $118,925,000
Solid Waste Management: $83,774,000
Other: $79,544,000
Other: $72,330,000
Solid Waste Management: $71,950,000
Sewerage: $60,706,000
Sewerage: $58,883,000
Toll Highways: $44,691,000
Toll Highways: $42,789,000
Parks and Recreation: $6,192,000
Parks and Recreation: $6,023,000
Natural Resources - Other: $2,635,000
Natural Resources - Other: $2,429,000
Regular Highways: $1,050,000
Regular Highways: $927,000
Parking Facilities: $557,000
Parking Facilities: $378,000
Miscellaneous Commercial Activities: $248,000
Miscellaneous Commercial Activities: $244,000
- Construction - Air Transportation: $46,511,000
Regular Highways: $44,036,000
Water Utilities: $43,297,000
Sewerage: $43,297,000
Air Transportation: $36,575,000
Regular Highways: $27,566,000
Sewerage: $20,050,000
Water Utilities: $20,050,000
General - Other: $19,614,000
General - Other: $11,856,000
Solid Waste Management: $6,624,000
Natural Resources - Other: $4,872,000
Parks and Recreation: $3,532,000
Solid Waste Management: $3,119,000
Parks and Recreation: $2,081,000
Natural Resources - Other: $1,454,000
- Current Operations - Financial Administration: $153,760,000
Police Protection: $148,236,000
Police Protection: $132,236,000
General - Other: $88,175,000
General - Other: $85,577,000
Solid Waste Management: $83,995,000
Air Transportation: $77,661,000
Air Transportation: $75,123,000
Solid Waste Management: $72,608,000
Financial Administration: $68,725,000
Correctional Institutions: $64,055,000
Regular Highways: $60,515,000
Correctional Institutions: $58,360,000
Health - Other: $52,592,000
Water Utilities: $52,253,000
Health - Other: $46,332,000
Regular Highways: $45,290,000
Water Utilities: $42,218,000
Parks and Recreation: $41,053,000
Parks and Recreation: $37,404,000
Judicial and Legal Services: $34,210,000
Central Staff Services: $31,452,000
Libraries: $30,271,000
Central Staff Services: $27,406,000
Judicial and Legal Services: $26,621,000
Libraries: $26,238,000
Transit Utilities: $24,997,000
Transit Utilities: $23,525,000
Sewerage: $22,294,000
Natural Resources - Other: $18,362,000
Sewerage: $18,013,000
General Public Buildings: $14,032,000
General Public Buildings: $13,913,000
Toll Highways: $13,624,000
Natural Resources - Other: $11,078,000
Protective Inspection and Regulation - Other: $10,885,000
Toll Highways: $10,283,000
Protective Inspection and Regulation - Other: $9,076,000
Housing and Community Development: $8,644,000
Housing and Community Development: $7,998,000
Public Welfare, Vendor Payments for Medical Care: $5,237,000
Public Welfare, Vendor Payments for Medical Care: $4,728,000
Public Welfare - Other: $3,827,000
Public Welfare - Other: $3,726,000
Corrections - Other: $2,060,000
Corrections - Other: $2,003,000
Local Fire Protection: $1,320,000
Local Fire Protection: $1,015,000
- Federal Intergovernmental - Other: $22,425,000
Air Transportation: $18,012,000
Other: $9,624,000
Transit Utilities: $8,437,000
Air Transportation: $6,829,000
Transit Utilities: $4,344,000
Public Welfare: $1,834,000
Public Welfare: $1,522,000
Highways: $280,000
Highways: $255,000
General Local Government Support: $70,000
General Local Government Support: $69,000
- General - Interest on Debt: $27,716,000
Interest on Debt: $25,709,000
- Intergovernmental to Local - Other - General - Other: $1,000
- Intergovernmental to State - Health - Other: $4,640,000
Health - Other: $4,640,000
General - Other: $1,000
- Local Intergovernmental - Other: $21,554,000
Other: $19,912,000
Highways: $1,890,000
Highways: $435,000
- Long Term Debt - Outstanding Unspecified Public Purpose: $944,961,000
Beginning Outstanding - Unspecified Public Purpose: $942,390,000
Beginning Outstanding - Unspecified Public Purpose: $920,605,000
Outstanding Unspecified Public Purpose: $873,927,000
Retired Unspecified Public Purpose: $94,772,000
Retired Unspecified Public Purpose: $87,316,000
Issue, Unspecified Public Purpose: $1,284,000
Issue, Unspecified Public Purpose: $617,000
- Miscellaneous - General Revenue - Other: $35,774,000
Interest Earnings: $32,057,000
General Revenue - Other: $27,267,000
Special Assessments: $15,175,000
Interest Earnings: $11,343,000
Special Assessments: $7,860,000
Fines and Forfeits: $5,347,000
Fines and Forfeits: $4,244,000
Donations From Private Sources: $1,802,000
Donations From Private Sources: $918,000
Rents: $850,000
Rents: $811,000
Sale of Property: $668,000
Sale of Property: $448,000
- Other Capital Outlay - Sewerage: $83,770,000
Sewerage: $39,534,000
Libraries: $15,820,000
Solid Waste Management: $7,131,000
Police Protection: $5,591,000
Transit Utilities: $5,118,000
Solid Waste Management: $3,283,000
Police Protection: $3,210,000
Central Staff Services: $3,075,000
Financial Administration: $1,799,000
Libraries: $1,586,000
Transit Utilities: $1,528,000
Housing and Community Development: $1,432,000
Health - Other: $698,000
Health - Other: $568,000
Financial Administration: $544,000
Correctional Institutions: $433,000
Judicial and Legal Services: $340,000
Judicial and Legal Services: $291,000
Housing and Community Development: $204,000
Central Staff Services: $198,000
Protective Inspection and Regulation - Other: $153,000
Protective Inspection and Regulation - Other: $144,000
Correctional Institutions: $80,000
General Public Building: $56,000
General Public Building: $12,000
Corrections - Other: $1,000
- Other Funds - Cash and Securities: $1,038,042,000
Cash and Securities: $987,583,000
- Revenue - Water Utilities: $54,729,000
Water Utilities: $52,903,000
Electric Utilities: $9,489,000
Electric Utilities: $9,147,000
Transit Utilities: $3,970,000
Transit Utilities: $3,822,000
- Sinking Funds - Cash and Securities: $22,702,000
Cash and Securities: $22,308,000
- State Intergovernmental - General Local Government Support: $70,812,000
General Local Government Support: $64,587,000
Other: $53,593,000
Other: $15,500,000
Highways: $13,817,000
Highways: $11,019,000
Transit Utilities: $5,018,000
Transit Utilities: $3,043,000
Housing and Community Development: $2,790,000
Housing and Community Development: $643,000
Public Welfare: $508,000
Public Welfare: $434,000
Health and Hospitals: $223,000
Health and Hospitals: $223,000
- Tax - Property: $375,080,000
Property: $330,560,000
Other Selective Sales: $42,584,000
Other Selective Sales: $39,651,000
Occupation and Business License - Other: $21,736,000
Motor Fuels Sales: $21,489,000
Motor Fuels Sales: $20,860,000
Occupation and Business License - Other: $20,560,000
Other License: $11,362,000
Public Utilities Sales: $9,470,000
Other License: $9,277,000
Public Utilities Sales: $7,349,000
Documentary and Stock Transfer: $4,046,000
Documentary and Stock Transfer: $3,866,000
- Transit Utilities - Interest on Debt: $3,666,000
Interest on Debt: $3,126,000
- Water Utilities - Interest on Debt: $8,255,000
Interest on Debt: $4,896,000
Lee County government finances - Debt in 2020:
- Bond Funds - Cash and Securities: $312,764,000
Cash and Securities: $282,355,000
- Charges - Air Transportation: $129,113,000
Air Transportation: $118,925,000
Solid Waste Management: $83,774,000
Other: $79,544,000
Other: $72,330,000
Solid Waste Management: $71,950,000
Sewerage: $60,706,000
Sewerage: $58,883,000
Toll Highways: $44,691,000
Toll Highways: $42,789,000
Parks and Recreation: $6,192,000
Parks and Recreation: $6,023,000
Natural Resources - Other: $2,635,000
Natural Resources - Other: $2,429,000
Regular Highways: $1,050,000
Regular Highways: $927,000
Parking Facilities: $557,000
Parking Facilities: $378,000
Miscellaneous Commercial Activities: $248,000
Miscellaneous Commercial Activities: $244,000
- Construction - Air Transportation: $46,511,000
Regular Highways: $44,036,000
Water Utilities: $43,297,000
Sewerage: $43,297,000
Air Transportation: $36,575,000
Regular Highways: $27,566,000
Sewerage: $20,050,000
Water Utilities: $20,050,000
General - Other: $19,614,000
General - Other: $11,856,000
Solid Waste Management: $6,624,000
Natural Resources - Other: $4,872,000
Parks and Recreation: $3,532,000
Solid Waste Management: $3,119,000
Parks and Recreation: $2,081,000
Natural Resources - Other: $1,454,000
- Current Operations - Financial Administration: $153,760,000
Police Protection: $148,236,000
Police Protection: $132,236,000
General - Other: $88,175,000
General - Other: $85,577,000
Solid Waste Management: $83,995,000
Air Transportation: $77,661,000
Air Transportation: $75,123,000
Solid Waste Management: $72,608,000
Financial Administration: $68,725,000
Correctional Institutions: $64,055,000
Regular Highways: $60,515,000
Correctional Institutions: $58,360,000
Health - Other: $52,592,000
Water Utilities: $52,253,000
Health - Other: $46,332,000
Regular Highways: $45,290,000
Water Utilities: $42,218,000
Parks and Recreation: $41,053,000
Parks and Recreation: $37,404,000
Judicial and Legal Services: $34,210,000
Central Staff Services: $31,452,000
Libraries: $30,271,000
Central Staff Services: $27,406,000
Judicial and Legal Services: $26,621,000
Libraries: $26,238,000
Transit Utilities: $24,997,000
Transit Utilities: $23,525,000
Sewerage: $22,294,000
Natural Resources - Other: $18,362,000
Sewerage: $18,013,000
General Public Buildings: $14,032,000
General Public Buildings: $13,913,000
Toll Highways: $13,624,000
Natural Resources - Other: $11,078,000
Protective Inspection and Regulation - Other: $10,885,000
Toll Highways: $10,283,000
Protective Inspection and Regulation - Other: $9,076,000
Housing and Community Development: $8,644,000
Housing and Community Development: $7,998,000
Public Welfare, Vendor Payments for Medical Care: $5,237,000
Public Welfare, Vendor Payments for Medical Care: $4,728,000
Public Welfare - Other: $3,827,000
Public Welfare - Other: $3,726,000
Corrections - Other: $2,060,000
Corrections - Other: $2,003,000
Local Fire Protection: $1,320,000
Local Fire Protection: $1,015,000
- Federal Intergovernmental - Other: $22,425,000
Air Transportation: $18,012,000
Other: $9,624,000
Transit Utilities: $8,437,000
Air Transportation: $6,829,000
Transit Utilities: $4,344,000
Public Welfare: $1,834,000
Public Welfare: $1,522,000
Highways: $280,000
Highways: $255,000
General Local Government Support: $70,000
General Local Government Support: $69,000
- General - Interest on Debt: $27,716,000
Interest on Debt: $25,709,000
- Intergovernmental to Local - Other - General - Other: $1,000
- Intergovernmental to State - Health - Other: $4,640,000
Health - Other: $4,640,000
General - Other: $1,000
- Local Intergovernmental - Other: $21,554,000
Other: $19,912,000
Highways: $1,890,000
Highways: $435,000
- Long Term Debt - Outstanding Unspecified Public Purpose: $944,961,000
Beginning Outstanding - Unspecified Public Purpose: $942,390,000
Beginning Outstanding - Unspecified Public Purpose: $920,605,000
Outstanding Unspecified Public Purpose: $873,927,000
Retired Unspecified Public Purpose: $94,772,000
Retired Unspecified Public Purpose: $87,316,000
Issue, Unspecified Public Purpose: $1,284,000
Issue, Unspecified Public Purpose: $617,000
- Miscellaneous - General Revenue - Other: $35,774,000
Interest Earnings: $32,057,000
General Revenue - Other: $27,267,000
Special Assessments: $15,175,000
Interest Earnings: $11,343,000
Special Assessments: $7,860,000
Fines and Forfeits: $5,347,000
Fines and Forfeits: $4,244,000
Donations From Private Sources: $1,802,000
Donations From Private Sources: $918,000
Rents: $850,000
Rents: $811,000
Sale of Property: $668,000
Sale of Property: $448,000
- Other Capital Outlay - Sewerage: $83,770,000
Sewerage: $39,534,000
Libraries: $15,820,000
Solid Waste Management: $7,131,000
Police Protection: $5,591,000
Transit Utilities: $5,118,000
Solid Waste Management: $3,283,000
Police Protection: $3,210,000
Central Staff Services: $3,075,000
Financial Administration: $1,799,000
Libraries: $1,586,000
Transit Utilities: $1,528,000
Housing and Community Development: $1,432,000
Health - Other: $698,000
Health - Other: $568,000
Financial Administration: $544,000
Correctional Institutions: $433,000
Judicial and Legal Services: $340,000
Judicial and Legal Services: $291,000
Housing and Community Development: $204,000
Central Staff Services: $198,000
Protective Inspection and Regulation - Other: $153,000
Protective Inspection and Regulation - Other: $144,000
Correctional Institutions: $80,000
General Public Building: $56,000
General Public Building: $12,000
Corrections - Other: $1,000
- Other Funds - Cash and Securities: $1,038,042,000
Cash and Securities: $987,583,000
- Revenue - Water Utilities: $54,729,000
Water Utilities: $52,903,000
Electric Utilities: $9,489,000
Electric Utilities: $9,147,000
Transit Utilities: $3,970,000
Transit Utilities: $3,822,000
- Sinking Funds - Cash and Securities: $22,702,000
Cash and Securities: $22,308,000
- State Intergovernmental - General Local Government Support: $70,812,000
General Local Government Support: $64,587,000
Other: $53,593,000
Other: $15,500,000
Highways: $13,817,000
Highways: $11,019,000
Transit Utilities: $5,018,000
Transit Utilities: $3,043,000
Housing and Community Development: $2,790,000
Housing and Community Development: $643,000
Public Welfare: $508,000
Public Welfare: $434,000
Health and Hospitals: $223,000
Health and Hospitals: $223,000
- Tax - Property: $375,080,000
Property: $330,560,000
Other Selective Sales: $42,584,000
Other Selective Sales: $39,651,000
Occupation and Business License - Other: $21,736,000
Motor Fuels Sales: $21,489,000
Motor Fuels Sales: $20,860,000
Occupation and Business License - Other: $20,560,000
Other License: $11,362,000
Public Utilities Sales: $9,470,000
Other License: $9,277,000
Public Utilities Sales: $7,349,000
Documentary and Stock Transfer: $4,046,000
Documentary and Stock Transfer: $3,866,000
- Transit Utilities - Interest on Debt: $3,666,000
Interest on Debt: $3,126,000
- Water Utilities - Interest on Debt: $8,255,000
Interest on Debt: $4,896,000
Lee County government finances - Cash and Securities in 2020:
- Bond Funds - Cash and Securities: $312,764,000
Cash and Securities: $282,355,000
- Charges - Air Transportation: $129,113,000
Air Transportation: $118,925,000
Solid Waste Management: $83,774,000
Other: $79,544,000
Other: $72,330,000
Solid Waste Management: $71,950,000
Sewerage: $60,706,000
Sewerage: $58,883,000
Toll Highways: $44,691,000
Toll Highways: $42,789,000
Parks and Recreation: $6,192,000
Parks and Recreation: $6,023,000
Natural Resources - Other: $2,635,000
Natural Resources - Other: $2,429,000
Regular Highways: $1,050,000
Regular Highways: $927,000
Parking Facilities: $557,000
Parking Facilities: $378,000
Miscellaneous Commercial Activities: $248,000
Miscellaneous Commercial Activities: $244,000
- Construction - Air Transportation: $46,511,000
Regular Highways: $44,036,000
Water Utilities: $43,297,000
Sewerage: $43,297,000
Air Transportation: $36,575,000
Regular Highways: $27,566,000
Sewerage: $20,050,000
Water Utilities: $20,050,000
General - Other: $19,614,000
General - Other: $11,856,000
Solid Waste Management: $6,624,000
Natural Resources - Other: $4,872,000
Parks and Recreation: $3,532,000
Solid Waste Management: $3,119,000
Parks and Recreation: $2,081,000
Natural Resources - Other: $1,454,000
- Current Operations - Financial Administration: $153,760,000
Police Protection: $148,236,000
Police Protection: $132,236,000
General - Other: $88,175,000
General - Other: $85,577,000
Solid Waste Management: $83,995,000
Air Transportation: $77,661,000
Air Transportation: $75,123,000
Solid Waste Management: $72,608,000
Financial Administration: $68,725,000
Correctional Institutions: $64,055,000
Regular Highways: $60,515,000
Correctional Institutions: $58,360,000
Health - Other: $52,592,000
Water Utilities: $52,253,000
Health - Other: $46,332,000
Regular Highways: $45,290,000
Water Utilities: $42,218,000
Parks and Recreation: $41,053,000
Parks and Recreation: $37,404,000
Judicial and Legal Services: $34,210,000
Central Staff Services: $31,452,000
Libraries: $30,271,000
Central Staff Services: $27,406,000
Judicial and Legal Services: $26,621,000
Libraries: $26,238,000
Transit Utilities: $24,997,000
Transit Utilities: $23,525,000
Sewerage: $22,294,000
Natural Resources - Other: $18,362,000
Sewerage: $18,013,000
General Public Buildings: $14,032,000
General Public Buildings: $13,913,000
Toll Highways: $13,624,000
Natural Resources - Other: $11,078,000
Protective Inspection and Regulation - Other: $10,885,000
Toll Highways: $10,283,000
Protective Inspection and Regulation - Other: $9,076,000
Housing and Community Development: $8,644,000
Housing and Community Development: $7,998,000
Public Welfare, Vendor Payments for Medical Care: $5,237,000
Public Welfare, Vendor Payments for Medical Care: $4,728,000
Public Welfare - Other: $3,827,000
Public Welfare - Other: $3,726,000
Corrections - Other: $2,060,000
Corrections - Other: $2,003,000
Local Fire Protection: $1,320,000
Local Fire Protection: $1,015,000
- Federal Intergovernmental - Other: $22,425,000
Air Transportation: $18,012,000
Other: $9,624,000
Transit Utilities: $8,437,000
Air Transportation: $6,829,000
Transit Utilities: $4,344,000
Public Welfare: $1,834,000
Public Welfare: $1,522,000
Highways: $280,000
Highways: $255,000
General Local Government Support: $70,000
General Local Government Support: $69,000
- General - Interest on Debt: $27,716,000
Interest on Debt: $25,709,000
- Intergovernmental to Local - Other - General - Other: $1,000
- Intergovernmental to State - Health - Other: $4,640,000
Health - Other: $4,640,000
General - Other: $1,000
- Local Intergovernmental - Other: $21,554,000
Other: $19,912,000
Highways: $1,890,000
Highways: $435,000
- Long Term Debt - Outstanding Unspecified Public Purpose: $944,961,000
Beginning Outstanding - Unspecified Public Purpose: $942,390,000
Beginning Outstanding - Unspecified Public Purpose: $920,605,000
Outstanding Unspecified Public Purpose: $873,927,000
Retired Unspecified Public Purpose: $94,772,000
Retired Unspecified Public Purpose: $87,316,000
Issue, Unspecified Public Purpose: $1,284,000
Issue, Unspecified Public Purpose: $617,000
- Miscellaneous - General Revenue - Other: $35,774,000
Interest Earnings: $32,057,000
General Revenue - Other: $27,267,000
Special Assessments: $15,175,000
Interest Earnings: $11,343,000
Special Assessments: $7,860,000
Fines and Forfeits: $5,347,000
Fines and Forfeits: $4,244,000
Donations From Private Sources: $1,802,000
Donations From Private Sources: $918,000
Rents: $850,000
Rents: $811,000
Sale of Property: $668,000
Sale of Property: $448,000
- Other Capital Outlay - Sewerage: $83,770,000
Sewerage: $39,534,000
Libraries: $15,820,000
Solid Waste Management: $7,131,000
Police Protection: $5,591,000
Transit Utilities: $5,118,000
Solid Waste Management: $3,283,000
Police Protection: $3,210,000
Central Staff Services: $3,075,000
Financial Administration: $1,799,000
Libraries: $1,586,000
Transit Utilities: $1,528,000
Housing and Community Development: $1,432,000
Health - Other: $698,000
Health - Other: $568,000
Financial Administration: $544,000
Correctional Institutions: $433,000
Judicial and Legal Services: $340,000
Judicial and Legal Services: $291,000
Housing and Community Development: $204,000
Central Staff Services: $198,000
Protective Inspection and Regulation - Other: $153,000
Protective Inspection and Regulation - Other: $144,000
Correctional Institutions: $80,000
General Public Building: $56,000
General Public Building: $12,000
Corrections - Other: $1,000
- Other Funds - Cash and Securities: $1,038,042,000
Cash and Securities: $987,583,000
- Revenue - Water Utilities: $54,729,000
Water Utilities: $52,903,000
Electric Utilities: $9,489,000
Electric Utilities: $9,147,000
Transit Utilities: $3,970,000
Transit Utilities: $3,822,000
- Sinking Funds - Cash and Securities: $22,702,000
Cash and Securities: $22,308,000
- State Intergovernmental - General Local Government Support: $70,812,000
General Local Government Support: $64,587,000
Other: $53,593,000
Other: $15,500,000
Highways: $13,817,000
Highways: $11,019,000
Transit Utilities: $5,018,000
Transit Utilities: $3,043,000
Housing and Community Development: $2,790,000
Housing and Community Development: $643,000
Public Welfare: $508,000
Public Welfare: $434,000
Health and Hospitals: $223,000
Health and Hospitals: $223,000
- Tax - Property: $375,080,000
Property: $330,560,000
Other Selective Sales: $42,584,000
Other Selective Sales: $39,651,000
Occupation and Business License - Other: $21,736,000
Motor Fuels Sales: $21,489,000
Motor Fuels Sales: $20,860,000
Occupation and Business License - Other: $20,560,000
Other License: $11,362,000
Public Utilities Sales: $9,470,000
Other License: $9,277,000
Public Utilities Sales: $7,349,000
Documentary and Stock Transfer: $4,046,000
Documentary and Stock Transfer: $3,866,000
- Transit Utilities - Interest on Debt: $3,666,000
Interest on Debt: $3,126,000
- Water Utilities - Interest on Debt: $8,255,000
Interest on Debt: $4,896,000
Supplemental Security Income (SSI) in 2006:
- Total number of recipients: 7,583
- Number of aged recipients: 1,093
- Number of blind and disabled recipients: 6,490
- Number of recipients under 18: 1,926
- Number of recipients between 18 and 64: 3,942
- Number of recipients older than 64: 1,715
- Number of recipients also receiving OASDI: 2,305
- Amount of payments (thousands of dollars): 3,316
| Home Mortgage Disclosure Act Aggregated Statistics For Year 2009 (Based on 117 full tracts) | ||||||||||||||
| A) FHA, FSA/RHS & VA Home Purchase Loans | B) Conventional Home Purchase Loans | C) Refinancings | D) Home Improvement Loans | E) Loans on Dwellings For 5+ Families | F) Non-occupant Loans on < 5 Family Dwellings (A B C & D) | G) Loans On Manufactured Home Dwelling (A B C & D) | ||||||||
|---|---|---|---|---|---|---|---|---|---|---|---|---|---|---|
| Number | Average Value | Number | Average Value | Number | Average Value | Number | Average Value | Number | Average Value | Number | Average Value | Number | Average Value | |
| LOANS ORIGINATED | 3,045 | $114,412 | 5,043 | $161,433 | 5,077 | $213,956 | 164 | $110,329 | 14 | $3,364,571 | 4,232 | $189,204 | 98 | $91,245 |
| APPLICATIONS APPROVED, NOT ACCEPTED | 183 | $117,902 | 584 | $162,320 | 896 | $207,497 | 59 | $54,763 | 1 | $131,000 | 513 | $192,006 | 37 | $65,054 |
| APPLICATIONS DENIED | 988 | $108,284 | 1,437 | $144,024 | 4,274 | $211,472 | 279 | $58,964 | 1 | $32,095,000 | 1,767 | $197,810 | 140 | $77,336 |
| APPLICATIONS WITHDRAWN | 451 | $112,774 | 799 | $169,068 | 1,729 | $212,393 | 65 | $153,000 | 0 | $0 | 812 | $186,286 | 25 | $103,560 |
| FILES CLOSED FOR INCOMPLETENESS | 229 | $105,638 | 220 | $143,586 | 583 | $208,722 | 30 | $122,233 | 0 | $0 | 205 | $187,254 | 5 | $77,400 |
| Private Mortgage Insurance Companies Aggregated Statistics For Year 2009 (Based on 95 full tracts) | ||||||||
| A) Conventional Home Purchase Loans | B) Refinancings | C) Non-occupant Loans on < 5 Family Dwellings (A & B) | D) Loans On Manufactured Home Dwelling (A & B) | |||||
|---|---|---|---|---|---|---|---|---|
| Number | Average Value | Number | Average Value | Number | Average Value | Number | Average Value | |
| LOANS ORIGINATED | 208 | $164,024 | 34 | $212,353 | 33 | $172,939 | 1 | $64,000 |
| APPLICATIONS APPROVED, NOT ACCEPTED | 301 | $237,658 | 54 | $269,222 | 188 | $271,287 | 0 | $0 |
| APPLICATIONS DENIED | 53 | $188,170 | 31 | $219,645 | 14 | $154,214 | 0 | $0 |
| APPLICATIONS WITHDRAWN | 24 | $181,167 | 5 | $182,800 | 2 | $122,000 | 0 | $0 |
| FILES CLOSED FOR INCOMPLETENESS | 28 | $185,536 | 17 | $221,647 | 10 | $212,700 | 0 | $0 |
| Most common first names in Lee County, FL among deceased individuals | ||
| Name | Count | Lived (average) |
|---|---|---|
| John | 3,810 | 75.4 years |
| William | 3,188 | 75.3 years |
| Robert | 3,025 | 73.4 years |
| Mary | 2,558 | 79.9 years |
| James | 2,377 | 72.7 years |
| Charles | 1,971 | 76.3 years |
| George | 1,773 | 76.8 years |
| Joseph | 1,712 | 76.3 years |
| Helen | 1,452 | 81.5 years |
| Dorothy | 1,302 | 79.2 years |
| Most common last names in Lee County, FL among deceased individuals | ||
| Last name | Count | Lived (average) |
|---|---|---|
| Smith | 1,220 | 75.4 years |
| Johnson | 778 | 74.7 years |
| Miller | 611 | 77.0 years |
| Brown | 604 | 75.2 years |
| Williams | 595 | 75.6 years |
| Jones | 481 | 75.3 years |
| Davis | 443 | 76.2 years |
| Wilson | 370 | 76.2 years |
| Anderson | 325 | 77.9 years |
| Martin | 320 | 76.6 years |
| Businesses in Lee County, FL | ||||
| Name | Count | Name | Count | |
|---|---|---|---|---|
| 7-Eleven | 47 | Justice | 4 | |
| ALDO | 3 | KFC | 6 | |
| AT&T | 14 | Kincaid | 1 | |
| Ace Hardware | 8 | Kmart | 4 | |
| Advance Auto Parts | 19 | Kohl's | 2 | |
| Aeropostale | 3 | Kroger | 1 | |
| Aerosoles | 1 | LA Fitness | 3 | |
| American Eagle Outfitters | 2 | La Quinta | 3 | |
| Ann Taylor | 5 | La-Z-Boy | 2 | |
| Apple Store | 1 | Lane Bryant | 3 | |
| Applebee's | 5 | Lane Furniture | 13 | |
| Arby's | 7 | LensCrafters | 4 | |
| Ashley Furniture | 2 | Levi Strauss & Co. | 1 | |
| Audi | 1 | Little Caesars Pizza | 7 | |
| AutoZone | 7 | Long John Silver's | 1 | |
| Avenue | 1 | Lowe's | 5 | |
| BMW | 2 | Macy's | 1 | |
| Bakers | 1 | Marriott | 7 | |
| Banana Republic | 3 | Marshalls | 2 | |
| Barnes & Noble | 2 | MasterBrand Cabinets | 66 | |
| Baskin-Robbins | 2 | Mazda | 1 | |
| Bath & Body Works | 6 | McDonald's | 34 | |
| Bebe | 1 | Men's Wearhouse | 4 | |
| Bed Bath & Beyond | 5 | Microtel | 1 | |
| Best Western | 5 | Motel 6 | 1 | |
| Blockbuster | 10 | Motherhood Maternity | 4 | |
| Brooks Brothers | 1 | New Balance | 8 | |
| Brookstone | 2 | New York & Co | 1 | |
| Budget Car Rental | 4 | Nike | 43 | |
| Buffalo Wild Wings | 1 | Nissan | 1 | |
| Burger King | 16 | Office Depot | 4 | |
| CVS | 32 | OfficeMax | 5 | |
| Cache | 2 | Old Navy | 2 | |
| Casual Male XL | 1 | Olive Garden | 2 | |
| Catherines | 1 | Outback | 4 | |
| Charlotte Russe | 1 | Outback Steakhouse | 4 | |
| Chevrolet | 3 | Pac Sun | 3 | |
| Chick-Fil-A | 5 | Panda Express | 1 | |
| Chico's | 4 | Panera Bread | 5 | |
| Chuck E. Cheese's | 1 | Papa John's Pizza | 9 | |
| Cinnabon | 1 | Payless | 7 | |
| Circle K | 12 | Penske | 8 | |
| Clarion | 1 | PetSmart | 4 | |
| Clarks | 3 | Pier 1 Imports | 4 | |
| Cold Stone Creamery | 4 | Pizza Hut | 9 | |
| Coldwater Creek | 2 | Plato's Closet | 1 | |
| ColorTyme | 2 | Popeyes | 5 | |
| Comfort Inn | 4 | Publix Super Markets | 37 | |
| Costco | 2 | Quality | 1 | |
| Cracker Barrel | 2 | Quiznos | 5 | |
| Curves | 7 | RadioShack | 11 | |
| DHL | 15 | Red Lobster | 1 | |
| Dairy Queen | 12 | Red Robin | 1 | |
| Days Inn | 3 | Red Roof Inn | 1 | |
| Decora Cabinetry | 23 | Rite Aid | 1 | |
| Dennys | 3 | Rooms To Go | 2 | |
| Domino's Pizza | 13 | Ruby Tuesday | 4 | |
| DressBarn | 2 | Rue21 | 1 | |
| Dressbarn | 2 | Ryder Rental & Truck Leasing | 1 | |
| Dunkin Donuts | 33 | SAS Shoes | 2 | |
| Econo Lodge | 1 | SONIC Drive-In | 2 | |
| Eddie Bauer | 1 | Saks Fifth Avenue | 1 | |
| Ethan Allen | 1 | Sam's Club | 2 | |
| Express | 1 | Sears | 5 | |
| Famous Footwear | 4 | Sephora | 1 | |
| Fashion Bug | 1 | Skechers USA | 2 | |
| FedEx | 127 | Soma Intimates | 3 | |
| Finish Line | 2 | Spencer Gifts | 1 | |
| Firestone Complete Auto Care | 6 | Sprint Nextel | 9 | |
| Foot Locker | 1 | Staples | 7 | |
| Ford | 2 | Starbucks | 25 | |
| Fredericks Of Hollywood | 1 | Steak 'n Shake | 3 | |
| GNC | 14 | Subaru | 1 | |
| GameStop | 9 | Suburban | 1 | |
| Gap | 3 | Subway | 66 | |
| Goodwill | 5 | Super 8 | 1 | |
| Gymboree | 3 | T-Mobile | 19 | |
| H&R Block | 25 | T.G.I. Driday's | 2 | |
| Haagen-Dazs | 1 | T.J.Maxx | 3 | |
| Hardee's | 1 | Taco Bell | 10 | |
| Havertys Furniture | 2 | Talbots | 3 | |
| Hilton | 11 | Target | 9 | |
| Hobby Lobby | 1 | The Room Place | 2 | |
| Holiday Inn | 11 | Tire Kingdom | 7 | |
| Hollister Co. | 1 | Toyota | 1 | |
| Home Depot | 5 | Toys"R"Us | 6 | |
| Honda | 1 | Travelodge | 2 | |
| Hot Topic | 1 | True Value | 3 | |
| Howard Johnson | 1 | U-Haul | 31 | |
| Hyatt | 4 | UPS | 135 | |
| Hyundai | 1 | Value City Furniture | 1 | |
| IHOP | 3 | Vans | 8 | |
| IZOD | 2 | Verizon Wireless | 6 | |
| J. Jill | 1 | Victoria's Secret | 3 | |
| J.Crew | 2 | Volkswagen | 1 | |
| JCPenney | 3 | Waffle House | 3 | |
| Jamba Juice | 1 | Walgreens | 22 | |
| Jimmy John's | 2 | Walmart | 9 | |
| JoS. A. Bank | 2 | Wet Seal | 1 | |
| Johnny Rockets | 1 | World Gym | 2 | |
| Jones New York | 13 | YMCA | 2 | |
| Journeys | 4 | |||
Lee County on our top lists:
- #13 on the list of "Top 101 counties with the largest decrease in the number of deaths per 1000 residents 2000-2006 to 2007-2013 (pop. 50,000+)"
- #34 on the list of "Top 101 counties with the largest number of people moving in compared to moving out (pop. 50,000+)"
- #37 on the list of "Top 101 counties with the largest number of people without health insurance coverage in 2000 (pop. 50,000+)"
- #43 on the list of "Top 101 counties with the highest ground withdrawal of fresh water for public supply"
- #43 on the list of "Top 101 counties with the highest ground withdrawal of fresh water for public supply (pop. 50,000+)"
- #60 on the list of "Top 101 counties with the largest increase in the number of infant deaths per 1000 residents 2000-2006 to 2007-2013 (pop. 50,000+)"
- #81 on the list of "Top 101 counties with the most Evangelical Protestant congregations"
- #81 on the list of "Top 101 counties with the most Evangelical Protestant congregations (pop. 50,000+)"
- #84 on the list of "Top 101 counties with the lowest Particulate Matter (PM2.5) Annual air pollution readings in 2012 (µg/m3)"
- #88 on the list of "Top 101 counties with the most Evangelical Protestant adherents"
- #88 on the list of "Top 101 counties with the most Evangelical Protestant adherents (pop. 50,000+)"
- #92 on the list of "Top 101 counties with the lowest number of births per 1000 residents 2007-2013"
- #92 on the list of "Top 101 counties with the lowest number of births per 1000 residents 2007-2013 (pop 50,000+)"