Hillsborough County, Florida (FL)
County owner-occupied free and clear houses and condos in 2010: 74,621
County owner-occupied houses and condos in 2000: 251,023
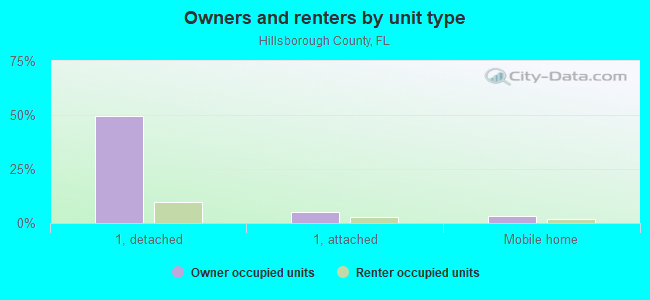
Renter-occupied apartments: 185,211 (it was 140,334 in 2000)
| % of renters here: | 36% |
| State: | 33% |
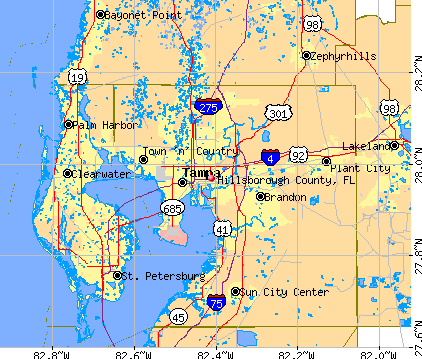
Land area: 1051 sq. mi.
Water area: 215.3 sq. mi.
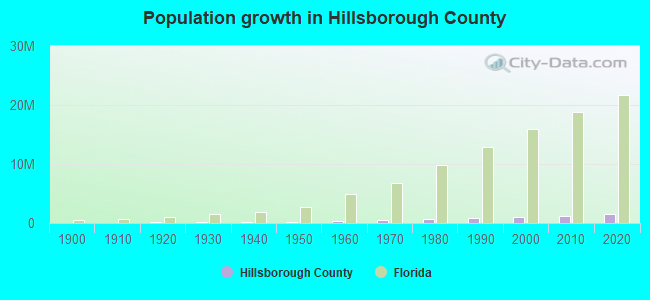
Population density: 1440 people per square mile (very high).
Industries providing employment: Educational, health and social services (21.2%), Professional, scientific, management, administrative, and waste management services (16.0%), Retail trade (12.0%), Finance, insurance, real estate, and rental and leasing (10.4%).
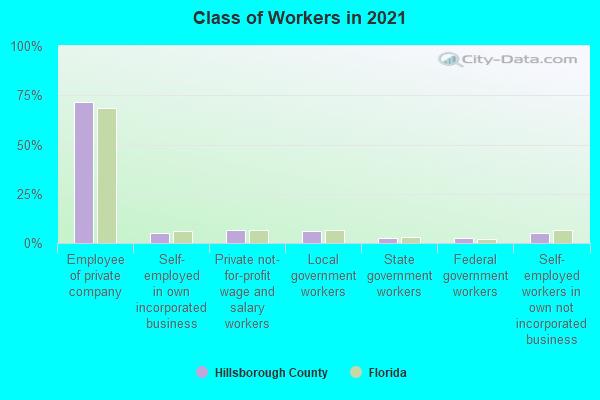
Type of workers:
- Private wage or salary: 85%
- Government: 10%
- Self-employed, not incorporated: 5%
- Unpaid family work: 0%
- OSM Map
- General Map
- Google Map
- MSN Map

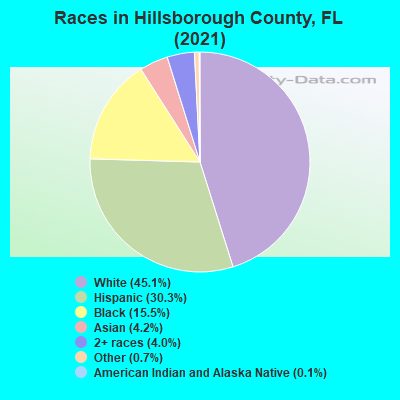
- 680,85645.0%White Non-Hispanic Alone
- 462,19430.5%Hispanic or Latino
- 238,45015.8%Black Non-Hispanic Alone
- 66,2154.4%Asian alone
- 53,0673.5%Two or more races
- 10,8310.7%Some other race alone
- 9920.07%Native Hawaiian and Other
Pacific Islander alone - 6960.05%American Indian and Alaska Native alone
| Median resident age: | 37.8 years |
| Florida median age: | 42.7 years |
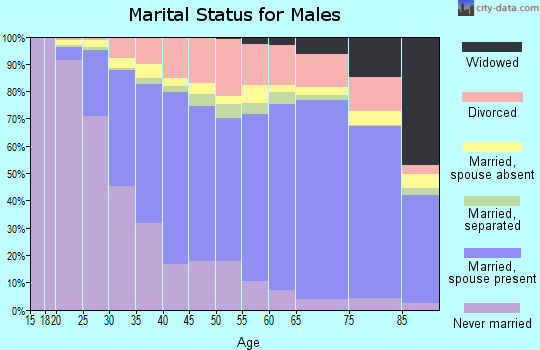
| Males: 746,809 | |
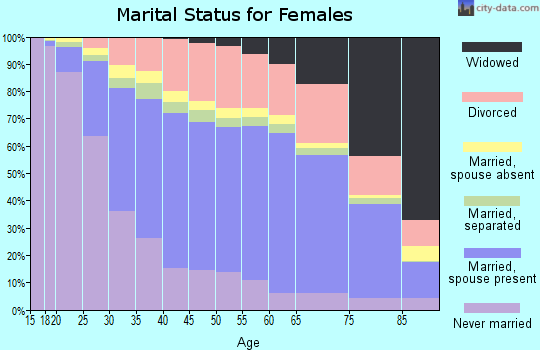
| Females: 766,492 |


| Hillsborough County: | 2.0 people |
| Florida: | 2 people |
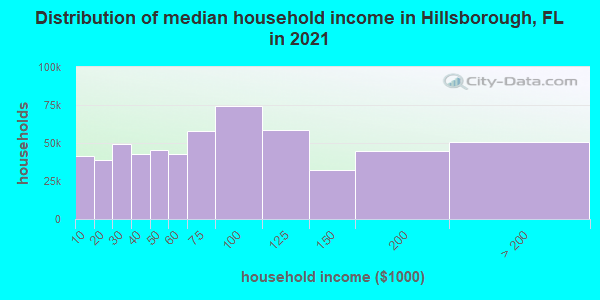
Estimated median household income in 2022: $74,308 ($40,663 in 1999)
| This county: | $74,308 |
| Florida: | $69,303 |
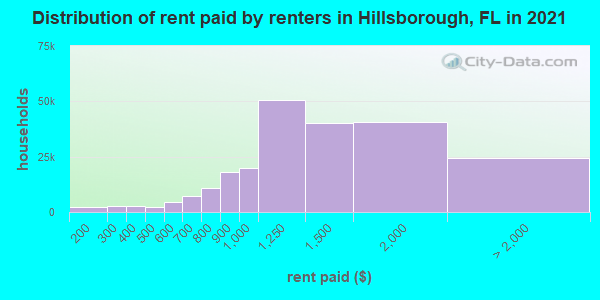
Median contract rent in 2022 for apartments: $1,378 (lower quartile is $1,031, upper quartile is $1,851)
| This county: | $1378 |
| State: | $1367 |
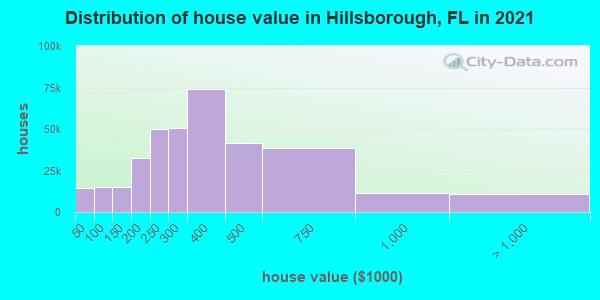
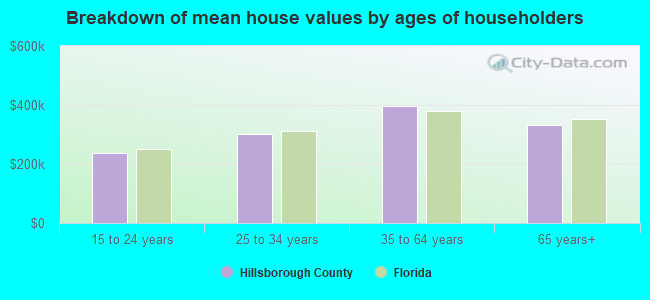
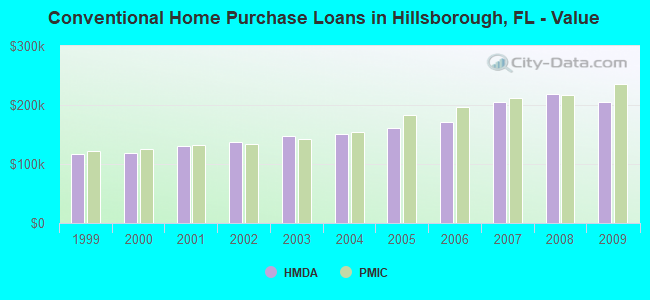
Estimated median house or condo value in 2022: $366,900 (it was $91,800 in 2000)
| Hillsborough: | $366,900 |
| Florida: | $354,100 |
Mean price in 2022:
Median monthly housing costs for homes and condos with a mortgage: $1,794Detached houses: $495,518
Here: $495,518 State: $500,941 Townhouses or other attached units: $293,217
Here: $293,217 State: $370,869 In 2-unit structures: $263,844
Here: $263,844 State: $423,188 In 3-to-4-unit structures: $284,374
Here: $284,374 State: $309,944 In 5-or-more-unit structures: $372,831
Here: $372,831 State: $447,145 Mobile homes: $124,061
Here: $124,061 State: $113,202 Occupied boats, RVs, vans, etc.: $162,788
Here: $162,788 State: $73,933
Median monthly housing costs for units without a mortgage: $593
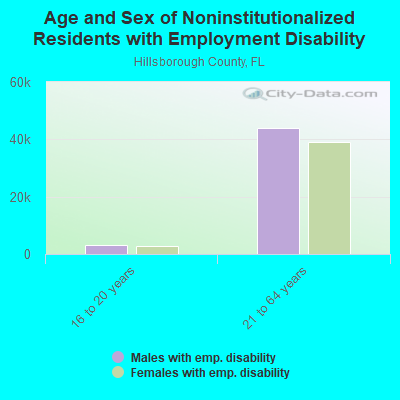
Institutionalized population: 7,929
Crime in 2020 (reported by the sheriff's office or county police, not the county total):
- Murders: 37
- Rapes: 248
- Robberies: 262
- Assaults: 1331
- Burglaries: 1191
- Thefts: 6610
- Auto thefts: 927
Crime in 2019 (reported by the sheriff's office or county police, not the county total):
- Murders: 32
- Rapes: 248
- Robberies: 278
- Assaults: 1194
- Burglaries: 1460
- Thefts: 8948
- Auto thefts: 945
Health of residents in Hillsborough County based on CDC Behavioral Risk Factor Surveillance System Survey Questionnaires from 2013 to 2021:
General health status score of residents in this county from 1 (poor) to 5 (excellent) is 3.4. This is about average.69.9% of residents exercised in the past month. This is less than average.
50.3% of residents smoked 100+ cigarettes in their lives. This is about average.
54.1% of adult residents drank alcohol in the past 30 days. This is less than average.
61.9% of residents visited a dentist within the past year. This is less than average.
Average weight of males is 196 pounds. This is about average.
Average weight of females is 160 pounds. This is about average.
Health of residents in Hillsborough County based on CDC Behavioral Risk Factor Surveillance System Survey Questionnaires from 2003 to 2012:
General health status score of residents in this county from 1 (poor) to 5 (excellent) is 3.5. This is about average.72.8% of residents exercised in the past month. This is about average.
46.6% of residents smoked 100+ cigarettes in their lives. This is about average.
86.4% of adult residents drank alcohol in the past 30 days. This is more than average.
65.2% of residents visited a dentist within the past year. This is less than average.
Average weight of males is 193 pounds. This is about average.
Average weight of females is 159 pounds. This is about average.
21.7% of residents keep firearms around their homes. This is about average.
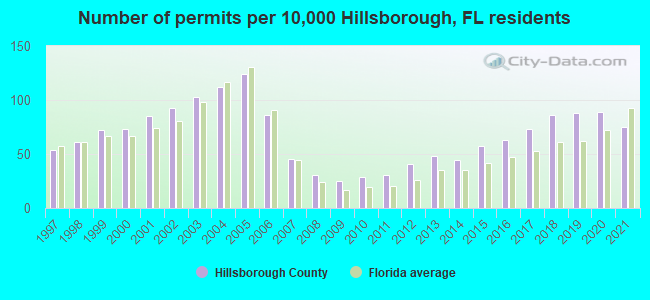
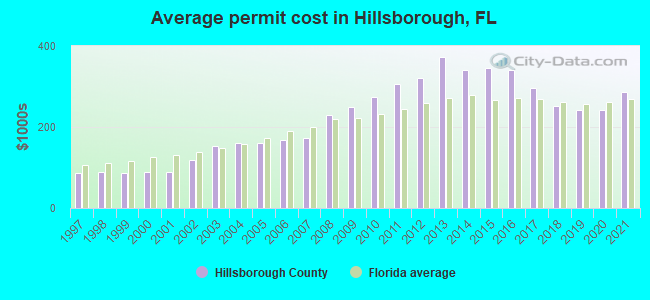
Single-family new house construction building permits:
- 2022: 5727 buildings, average cost: $371,700
- 2021: 7504 buildings, average cost: $286,200
- 2020: 8869 buildings, average cost: $242,100
- 2019: 8828 buildings, average cost: $243,300
- 2018: 8563 buildings, average cost: $250,800
- 2017: 7253 buildings, average cost: $296,100
- 2016: 6308 buildings, average cost: $340,400
- 2015: 5679 buildings, average cost: $345,300
- 2014: 4411 buildings, average cost: $341,400
- 2013: 4798 buildings, average cost: $374,000
- 2012: 4059 buildings, average cost: $322,000
- 2011: 3075 buildings, average cost: $307,200
- 2010: 2903 buildings, average cost: $275,300
- 2009: 2470 buildings, average cost: $249,700
- 2008: 3110 buildings, average cost: $230,400
- 2007: 4472 buildings, average cost: $174,000
- 2006: 8639 buildings, average cost: $168,200
- 2005: 12386 buildings, average cost: $159,500
- 2004: 11236 buildings, average cost: $159,600
- 2003: 10256 buildings, average cost: $154,100
- 2002: 9256 buildings, average cost: $117,800
- 2001: 8508 buildings, average cost: $90,000
- 2000: 7328 buildings, average cost: $89,500
- 1999: 7152 buildings, average cost: $87,300
- 1998: 6100 buildings, average cost: $88,200
- 1997: 5410 buildings, average cost: $86,800
Median real estate property taxes paid for housing units with mortgages in 2022: $3,043 (0.8%)
Median real estate property taxes paid for housing units with no mortgage in 2022: $2,109 (0.7%)
| Hillsborough County: | 12.9% |
| Florida: | 12.7% |
Median age of residents in 2022: 37.8 years old
(Males: 37.0 years old, Females: 38.5 years old)
(Median age for: White residents: 43.4 years old, Black residents: 33.5 years old, American Indian residents: 35.1 years old, Asian residents: 37.5 years old, Hispanic or Latino residents: 34.3 years old, Other race residents: 34.8 years old)
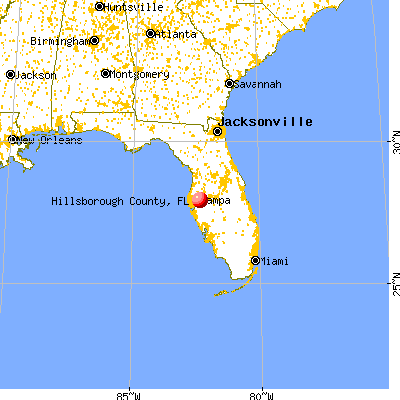
Area name: Tampa-St. Petersburg-Clearwater, FL MSA
Fair market rent in 2006 for a 1-bedroom apartment in Hillsborough County is $649 a month.
Fair market rent for a 2-bedroom apartment is $785 a month.
Fair market rent for a 3-bedroom apartment is $995 a month.
Cities in this county include: Tampa, Citrus Park-Fern Lake, Brandon, Town 'n' Country, Greater Carrollwood, Carrollwood, Egypt Lake-Leto, University, Wimauma-Lithia, Plant City.
| Zip Code | City | Certified Residential Database | Mandatory Residential Database | Mandatory Non-Residential Database | |||
|---|---|---|---|---|---|---|---|
| Buildings Measured | Above 4 pCi/L (%) | Buildings Measured | Above 4 pCi/L (%) | Buildings Measured | Above 4 pCi/L (%) | ||
| 33509 | Brandon | - | - | 1 | 0 | 1 | 0 |
| 33510 | Brandon | 411 | 41 | 1 | 0 | 1 | 0 |
| 33511 | Brandon | 898 | 14 | 1 | 0 | 1 | 0 |
| 33527 | Dover | 29 | 59 | 1 | 0 | 1 | 0 |
| 33534 | Gibsonton | 1 | 0 | 1 | 0 | 1 | 0 |
| 33547 | Lithia | 31 | 26 | - | - | - | - |
| 33548 | Lutz | 64 | 0 | - | - | - | - |
| 33549 | Lutz | 152 | 2 | 2 | 0 | 2 | 0 |
| 33556 | Odessa | 199 | 0 | - | - | - | - |
| 33564 | Plant City | 1 | 0 | - | - | - | - |
| 33565 | Plant City | 41 | 10 | 1 | 0 | 1 | 0 |
| 33566 | Plant City | 34 | 21 | 5 | 0 | 5 | 0 |
| 33567 | Plant City | 184 | 11 | 1 | 0 | 1 | 0 |
| 33569 | Riverview | 292 | 9 | - | - | - | - |
| 33570 | Ruskin | 13 | 0 | - | - | - | - |
| 33572 | Apollo Beach | 76 | 7 | - | - | - | - |
| 33573 | Sun City Center | 29 | 14 | - | - | - | - |
| 33584 | Seffner | 138 | 42 | 5 | 0 | 5 | 0 |
| 33592 | Thonotosassa | 11 | 9 | 3 | 0 | 3 | 0 |
| 33594 | Valrico | 1762 | 31 | 2 | 50 | 2 | 50 |
| 33598 | Wimauma | 10 | 0 | 1 | 0 | 1 | 0 |
| 33602 | Tampa | 40 | 0 | 4 | 0 | 4 | 0 |
| 33603 | Tampa | 33 | 0 | 5 | 0 | 5 | 0 |
| 33604 | Tampa | 128 | 7 | 1 | 0 | 1 | 0 |
| 33605 | Tampa | 7 | 14 | 9 | 0 | 9 | 0 |
| 33606 | Tampa | 169 | 5 | 1 | 0 | 1 | 0 |
| 33607 | Tampa | 21 | 0 | 10 | 0 | 10 | 0 |
| 33609 | Tampa | 126 | 1 | 3 | 0 | 3 | 0 |
| 33610 | Tampa | 15 | 7 | 16 | 0 | 16 | 0 |
| 33611 | Tampa | 121 | 1 | 1 | 0 | 1 | 0 |
| 33612 | Tampa | 42 | 0 | 8 | 0 | 8 | 0 |
| 33613 | Tampa | 184 | 0 | 4 | 0 | 4 | 0 |
| 33614 | Tampa | 254 | 0 | 6 | 0 | 6 | 0 |
| 33615 | Tampa | 287 | 6 | 2 | 0 | 2 | 0 |
| 33616 | Tampa | 49 | 22 | - | - | - | - |
| 33617 | Tampa | 222 | 2 | - | - | - | - |
| 33618 | Tampa | 222 | 0 | - | - | - | - |
| 33619 | Tampa | 27 | 4 | 4 | 0 | 4 | 0 |
| 33621 | Tampa | 3 | 0 | - | - | - | - |
| 33624 | Tampa | 656 | 1 | 1 | 0 | 1 | 0 |
| 33625 | Tampa | 132 | 0 | 1 | 0 | 1 | 0 |
| 33626 | Tampa | 147 | 1 | - | - | - | - |
| 33629 | Tampa | 288 | 1 | 2 | 0 | 2 | 0 |
| 33634 | Tampa | 60 | 0 | - | - | - | - |
| 33635 | Tampa | 96 | 0 | - | - | - | - |
| 33637 | Tampa | 37 | 5 | 1 | 0 | 1 | 0 |
| 33647 | Tampa | 712 | 1 | - | - | - | - |
| 33684 | Tampa | 2 | 0 | - | - | - | - |
2023 air pollution in Hillsborough County:
Carbon Monoxide: 0.149 ppm (standard limit: 9 ppm). Near U.S. average.
Ozone (1-hour): 0.027 ppm (standard limit: 0.12 ppm). Below U.S. average.
Particulate Matter (PM10) Annual: 22.5 µg/m3. Near U.S. average.
Sulfur Oxides Annual: 0.001 ppm (standard limit: 0.03 ppm). Near U.S. average.
Notable locations in this county outside city limits:
Notable locations in Hillsborough County: City of East Clearwater Wastewater Treatment Facility (A), Largo Fire Rescue Station 40 (B). Display/hide their locations on the map
Streams, rivers, and creeks: Allen Creek (A), Long Branch (B). Display/hide their locations on the map
Parks in Hillsborough County include: Coopers Point Nature Park (1), Courtney Campbell Parkway (2), Fort De Soto Park (3), De Soto Monument (4). Display/hide their locations on the map
Neighboring counties: Refugio County, Texas  , San Patricio County, Texas .
| Here: | 3.0% |
| Florida: | 2.9% |
Current college students: 60,920
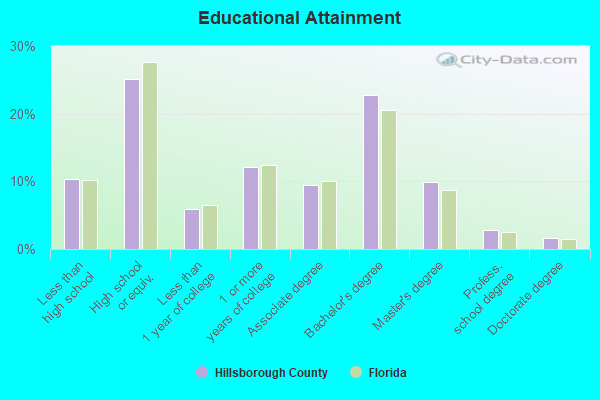
People 25 years of age or older with a high school degree or higher: 89.7%
People 25 years of age or older with a bachelor's degree or higher: 37.9%
Number of foreign born residents: 301,849 (52.3% naturalized citizens)
| Hillsborough County: | 19.9% |
| Whole state: | 21.7% |
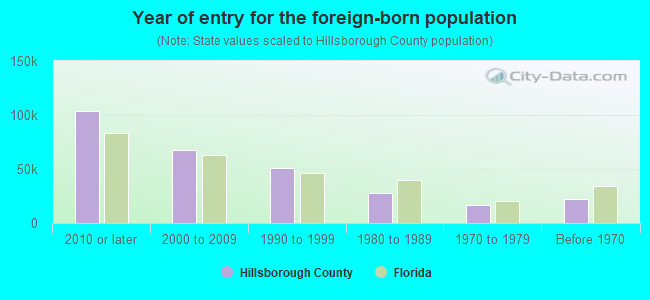
- Year of entry for the foreign-born population
- 135,8682010 or later
- 67,3112000 to 2009
- 42,4611990 to 1999
- 27,6281980 to 1989
- 16,2861970 to 1979
- 22,183Before 1970
Mean travel time to work (commute): minutes
Percentage of county residents living and working in this county: 99.2%
Housing units in structures:
- One, detached: 354,204
- One, attached: 50,097
- Two: 11,924
- 3 or 4: 21,367
- 5 to 9: 33,960
- 10 to 19: 41,025
- 20 to 49: 23,215
- 50 or more: 49,617
- Mobile homes: 41,032
- Boats, RVs, vans, etc.: 2,036
Housing units in Hillsborough County with a mortgage: 232,688 (20,449 second mortgage, 764 home equity loan, 16,914 both second mortgage and home equity loan)
Houses without a mortgage: 3,356
| Here: | 98.7% with mortgage |
| State: | 97.6% with mortgage |
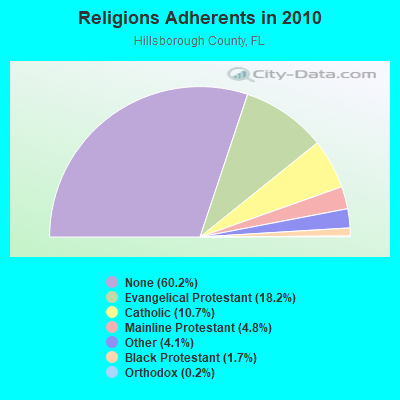
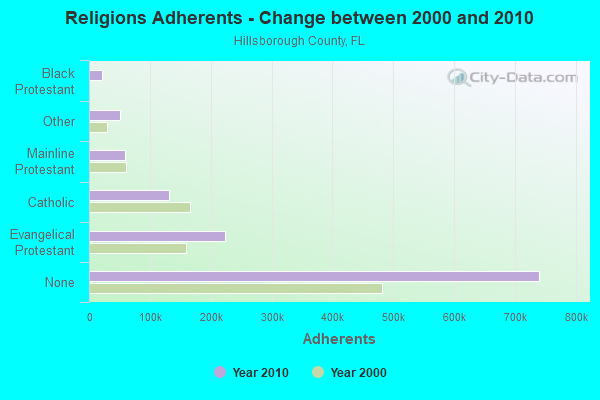
Religion statistics for Hillsborough County
| Religion | Adherents | Congregations |
|---|---|---|
| Evangelical Protestant | 224,054 | 695 |
| Catholic | 130,973 | 28 |
| Mainline Protestant | 59,348 | 106 |
| Other | 50,901 | 105 |
| Black Protestant | 21,160 | 62 |
| Orthodox | 2,463 | 9 |
| None | 740,327 | - |
Source: Clifford Grammich, Kirk Hadaway, Richard Houseal, Dale E.Jones, Alexei Krindatch, Richie Stanley and Richard H.Taylor. 2012. 2010 U.S.Religion Census: Religious Congregations & Membership Study. Association of Statisticians of American Religious Bodies. Jones, Dale E., et al. 2002. Congregations and Membership in the United States 2000. Nashville, TN: Glenmary Research Center.
Food Environment Statistics:
| Hillsborough County: | 2.25 / 10,000 pop. |
| State: | 2.04 / 10,000 pop. |
| Here: | 0.12 / 10,000 pop. |
| Florida: | 0.11 / 10,000 pop. |
| This county: | 1.11 / 10,000 pop. |
| Florida: | 1.28 / 10,000 pop. |
| Hillsborough County: | 3.19 / 10,000 pop. |
| Florida: | 3.04 / 10,000 pop. |
| This county: | 6.50 / 10,000 pop. |
| State: | 7.45 / 10,000 pop. |
| Hillsborough County: | 8.7% |
| Florida: | 9.2% |
| Hillsborough County: | 25.2% |
| State: | 23.7% |
| Here: | 13.6% |
| State: | 14.0% |
Agriculture in Hillsborough County:
Average size of farms: 96 acresAverage value of agricultural products sold per farm: $132,176
Average value of crops sold per acre for harvested cropland: $5624.09
The value of nursery, greenhouse, floriculture, and sod as a percentage of the total market value of agricultural products sold: 29.51%
The value of livestock, poultry, and their products as a percentage of the total market value of agricultural products sold: 14.95%
Average total farm production expenses per farm: $96,544
Harvested cropland as a percentage of land in farms: 20.83%
Irrigated harvested cropland as a percentage of land in farms: 70.22%
Average market value of all machinery and equipment per farm: $42,898
The percentage of farms operated by a family or individual: 86.86%
Average age of principal farm operators: 57 years
Average number of cattle and calves per 100 acres of all land in farms: 22.99
Milk cows as a percentage of all cattle and calves: 6.73%
Vegetables: 12,112 harvested acres
Land in orchards: 24,618 acres
Tornado activity:
Hillsborough County historical area-adjusted tornado activity is significantly below Florida state average. It is 2125473.0 times below overall U.S. average.Tornadoes in this county have caused 19 fatalities and 803 injuries recorded between 1950 and 2004.
On 4/4/1966, a category 4 (max. wind speeds 207-260 mph) tornado killed 11 people and injured 530 people and caused between $5,000,000 and $50,000,000 in damages.
Earthquake activity:
Hillsborough County-area historical earthquake activity is significantly above Florida state average. It is 89% smaller than the overall U.S. average.On 9/10/2006 at 14:56:08, a magnitude 5.9 (5.9 MB, 5.5 MS, 5.8 MW, Class: Moderate, Intensity: VI - VII) earthquake occurred 285.5 miles away from Hillsborough County center
On 10/24/1997 at 08:35:17, a magnitude 4.9 (4.8 MB, 4.2 MS, 4.9 LG, Depth: 6.2 mi, Class: Light, Intensity: IV - V) earthquake occurred 364.9 miles away from the county center
On 11/22/1974 at 05:25:55, a magnitude 4.7 (4.7 MB) earthquake occurred 367.0 miles away from the county center
On 8/2/1974 at 08:52:09, a magnitude 4.9 (4.3 MB, 4.9 LG) earthquake occurred 408.5 miles away from the county center
On 9/4/2016 at 18:29:29, a magnitude 3.8 (3.8 ML, Class: Light, Intensity: II - III) earthquake occurred 227.6 miles away from Hillsborough County center
On 6/23/2016 at 17:20:29, a magnitude 3.8 (3.8 ML) earthquake occurred 227.6 miles away from the county center
Magnitude types: regional Lg-wave magnitude (LG), body-wave magnitude (MB), local magnitude (ML), surface-wave magnitude (MS), moment magnitude (MW)
Most recent natural disasters:
- Florida Covid-19 Pandemic, Incident Period: January 20, 2020, FEMA Id: 4486, Natural disaster type: Other
- Florida Hurricane Irma, Incident Period: September 4, 2017 - October 18, 2017, FEMA Id: 4337, Natural disaster type: Hurricane
- Florida Hurricane Hermine, Incident Period: August 31, 2016 to September 11, 2016, Major Disaster (Presidential) Declared DR-4280: September 28, 2016, FEMA Id: 4280, Natural disaster type: Hurricane
- Florida Tropical Storm Debby, Incident Period: June 23, 2012 to July 26, 2012, Major Disaster (Presidential) Declared DR-4068: July 03, 2012, FEMA Id: 4068, Natural disaster type: Tropical Storm
- Florida Tropical Storm Fay, Incident Period: August 18, 2008 to September 12, 2008, Emergency Declared EM-3288: August 21, 2008, FEMA Id: 3288, Natural disaster type: Tropical Storm
- Florida Hurricane Katrina Evacuation, Incident Period: August 29, 2005 to October 01, 2005, Emergency Declared EM-3220: September 05, 2005, FEMA Id: 3220, Natural disaster type: Hurricane
- Florida Hurricane Jeanne, Incident Period: September 24, 2004 to November 17, 2004, Major Disaster (Presidential) Declared DR-1561: September 26, 2004, FEMA Id: 1561, Natural disaster type: Hurricane
- Florida Hurricane Frances, Incident Period: September 03, 2004 to October 08, 2004, Major Disaster (Presidential) Declared DR-1545: September 04, 2004, FEMA Id: 1545, Natural disaster type: Hurricane
- Florida Hurricane Charley and Tropical Storm Bonnie, Incident Period: August 11, 2004 to August 30, 2004, Major Disaster (Presidential) Declared DR-1539: August 13, 2004, FEMA Id: 1539, Natural disaster type: Tropical Storm, Hurricane
- Florida Lakeland Fire Complex, Incident Period: February 17, 2001, Fire Management Assistance Declared: March 18, 2001, FEMA Id: 2353, Natural disaster type: Fire
- 15 other natural disasters have been reported since 1953.
The number of natural disasters in Hillsborough County (25) is a lot greater than the US average (15).
Major Disasters (Presidential) Declared: 15
Emergencies Declared: 5
Causes of natural disasters: Hurricanes: 10, Fires: 5, Floods: 5, Storms: 4, Tornadoes: 4, Tropical Storms: 4, Freeze: 1, Wind: 1, Other: 1 (Note: some incidents may be assigned to more than one category).
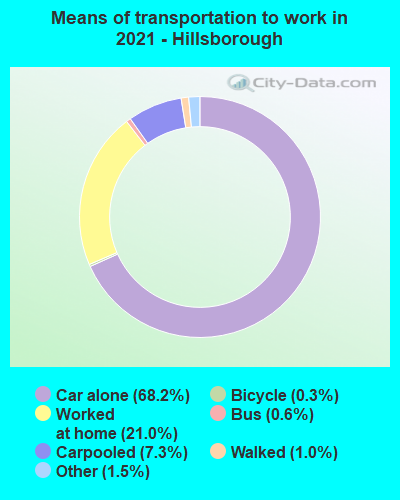
Means of transportation to work:
- Drove a car alone: 551,133 (67.4%)
- Carpooled: 73,098 (8.9%)
- Bus: 4,329 (0.5%)
- Subway or elevated rail: 45 (0.0%)
- Taxicab, motorcycle, or other means: 12,205 (1.5%)
- Bicycle: 4,064 (0.5%)
- Walked: 9,033 (1.1%)
- Worked at home: 163,974 (20.0%)
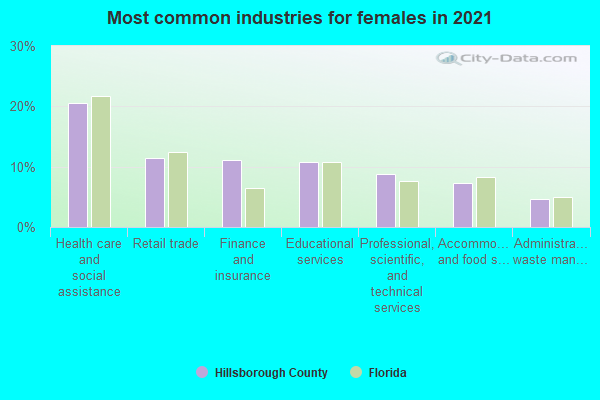
- Health care and social assistance (20%)
- Retail trade (11%)
- Educational services (11%)
- Finance and insurance (8%)
- Professional, scientific, and technical services (8%)
- Accommodation and food services (7%)
- Administrative and support and waste management services (5%)
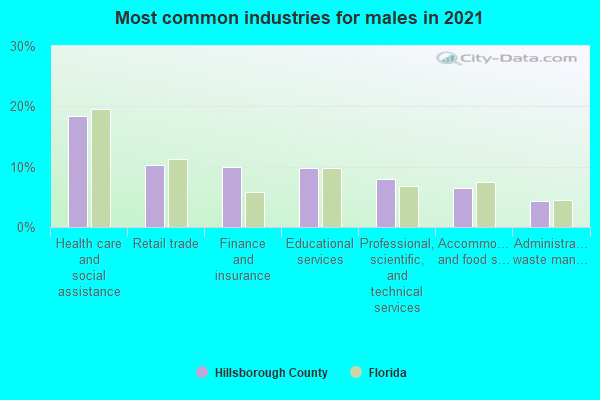
- Health care and social assistance (21%)
- Retail trade (12%)
- Educational services (11%)
- Finance and insurance (9%)
- Professional, scientific, and technical services (9%)
- Accommodation and food services (7%)
- Administrative and support and waste management services (6%)
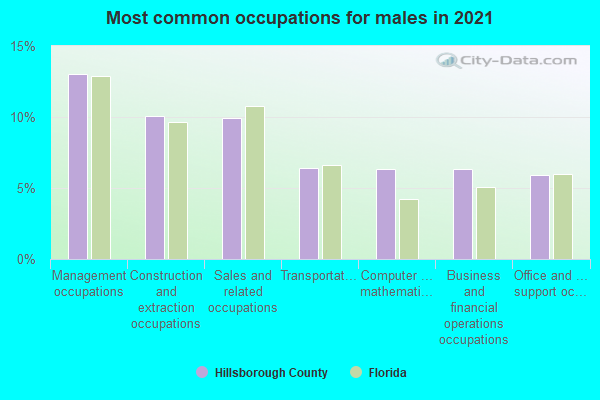
- Management occupations (14%)
- Sales and related occupations (10%)
- Construction and extraction occupations (10%)
- Business and financial operations occupations (7%)
- Transportation occupations (6%)
- Computer and mathematical occupations (6%)
- Office and administrative support occupations (6%)
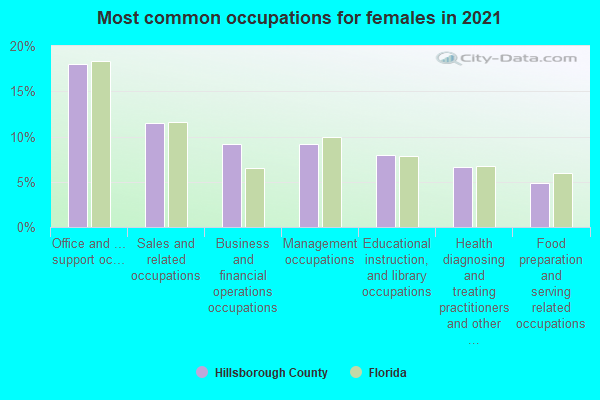
- Office and administrative support occupations (16%)
- Sales and related occupations (11%)
- Management occupations (10%)
- Business and financial operations occupations (8%)
- Educational instruction, and library occupations (8%)
- Health diagnosing and treating practitioners and other technical occupations (7%)
- Food preparation and serving related occupations (5%)
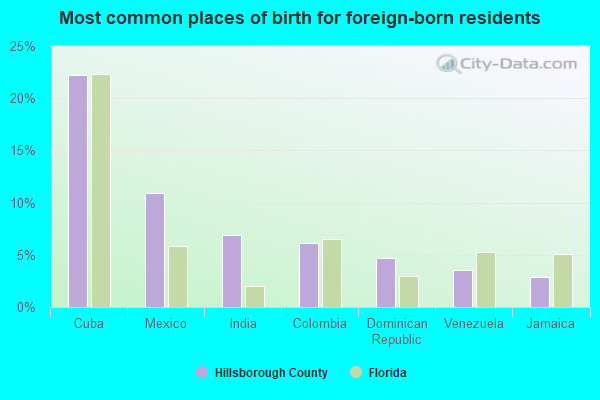
- Cuba (22%)
- Mexico (9%)
- India (7%)
- Colombia (6%)
- Venezuela (5%)
- Dominican Republic (4%)
- Haiti (3%)
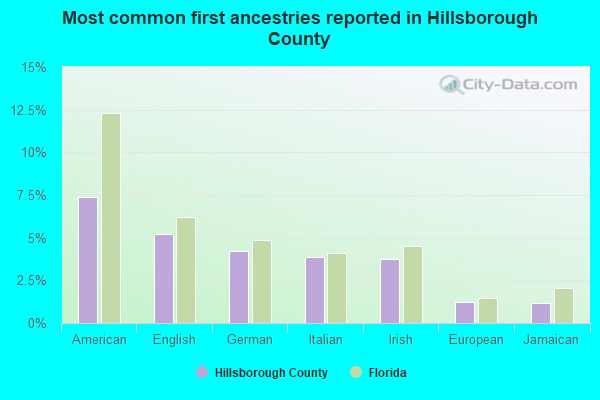
- American (8%)
- English (5%)
- German (4%)
- Irish (4%)
- Italian (4%)
- Haitian (1%)
- European (1%)
People in group quarters in Hillsborough County, Florida in 2010:
- 8,517 people in college/university student housing
- 3,480 people in nursing facilities/skilled-nursing facilities
- 3,238 people in local jails and other municipal confinement facilities
- 2,452 people in workers' group living quarters and job corps centers
- 990 people in group homes intended for adults
- 832 people in other noninstitutional facilities
- 647 people in emergency and transitional shelters (with sleeping facilities) for people experiencing homelessness
- 460 people in correctional facilities intended for juveniles
- 363 people in residential treatment centers for adults
- 285 people in state prisons
- 276 people in group homes for juveniles (non-correctional)
- 246 people in military barracks and dormitories (nondisciplinary)
- 123 people in hospitals with patients who have no usual home elsewhere
- 89 people in maritime/merchant vessels
- 35 people in residential treatment centers for juveniles (non-correctional)
- 29 people in correctional residential facilities
- 2 people in residential schools for people with disabilities
People in group quarters in Hillsborough County, Florida in 2000:
- 4,238 people in college dormitories (includes college quarters off campus)
- 3,460 people in nursing homes
- 3,360 people in other noninstitutional group quarters
- 2,832 people in local jails and other confinement facilities (including police lockups)
- 646 people in agriculture workers' dormitories on farms
- 557 people in other group homes
- 412 people in military barracks, etc.
- 326 people in unknown juvenile institutions
- 280 people in homes for the mentally retarded
- 230 people in state prisons
- 165 people in homes or halfway houses for drug/alcohol abuse
- 160 people in homes for the mentally ill
- 118 people in short-term care, detention or diagnostic centers for delinquent children
- 104 people in other nonhousehold living situations
- 95 people in training schools for juvenile delinquents
- 69 people in mental (psychiatric) hospitals or wards
- 65 people in homes for the physically handicapped
- 62 people in halfway houses
- 59 people in homes for abused, dependent, and neglected children
- 47 people in orthopedic wards and institutions for the physically handicapped
- 34 people in other types of correctional institutions
- 32 people in religious group quarters
- 26 people in other workers' dormitories
- 24 people in residential treatment centers for emotionally disturbed children
- 18 people in wards in general hospitals for patients who have no usual home elsewhere
- 5 people in crews of maritime vessels
- 3 people in hospitals or wards for drug/alcohol abuse
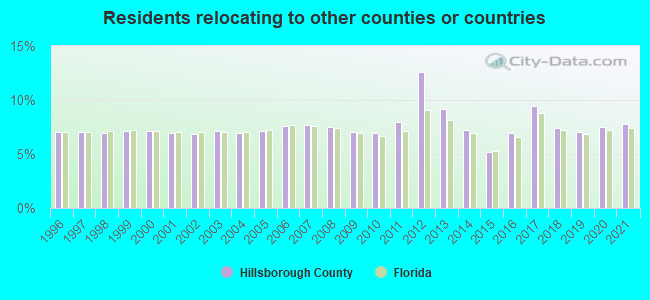
8.46% of this county's 2021 resident taxpayers lived in other counties in 2020 ($70,594 average adjusted gross income)
| Here: | 8.46% |
| Florida average: | 8.80% |
0.08% of residents moved from foreign countries ($553 average AGI)
Hillsborough County: 0.08% Florida average: 0.05%
3.92% relocated from other counties in Florida ($27,307 average AGI)
4.47% relocated from other states ($42,734 average AGI)
Hillsborough County: 4.47% Florida average: 4.38%

Top counties from which taxpayers relocated into this county between 2020 and 2021:
| from Pinellas County, FL | |
| from Pasco County, FL | |
| from Polk County, FL | |
| from Miami-Dade County, FL | |
| from Orange County, FL | |
| from Broward County, FL | |
| from Manatee County, FL |
7.78% of this county's 2020 resident taxpayers moved to other counties in 2021 ($64,211 average adjusted gross income)
| Here: | 7.78% |
| Florida average: | 7.45% |
0.06% of residents moved to foreign countries ($494 average AGI)
Hillsborough County: 0.06% Florida average: 0.04%
4.74% relocated to other counties in Florida ($37,838 average AGI)
2.98% relocated to other states ($25,878 average AGI)
Hillsborough County: 2.98% Florida average: 2.97%
Top counties to which taxpayers relocated from this county between 2020 and 2021:
| to Pasco County, FL | |
| to Pinellas County, FL | |
| to Polk County, FL | |
| to Manatee County, FL | |
| to Hernando County, FL | |
| to Orange County, FL | |
| to Miami-Dade County, FL |
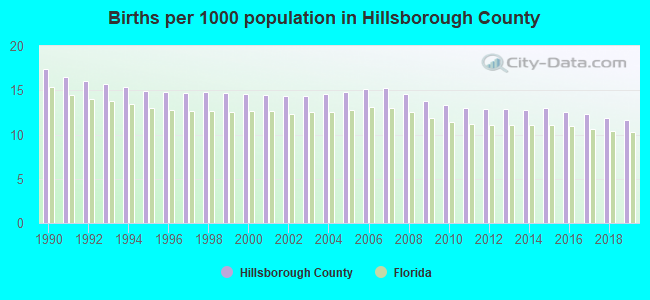
Births per 1000 population from 1990 to 1999: 15.5
Births per 1000 population from 2000 to 2009: 14.6
Births per 1000 population from 2010 to 2022: 10.6
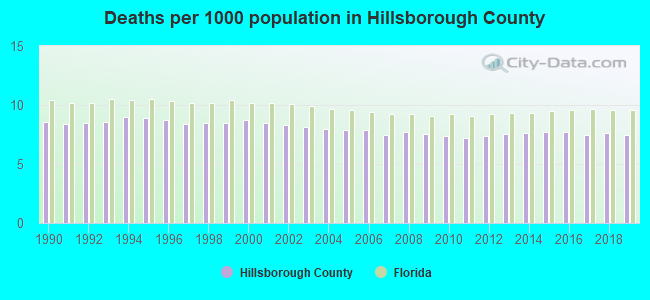
Deaths per 1000 population from 1990 to 1999: 8.6
Deaths per 1000 population from 2000 to 2009: 8.0
Deaths per 1000 population from 2010 to 2020: 7.6
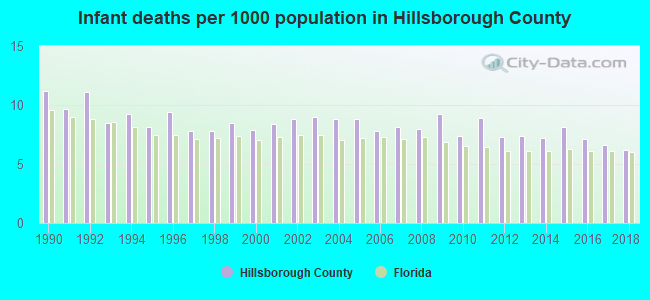
Infant deaths per 1000 live births from 1990 to 1999: 9.1
Infant deaths per 1000 live births from 2000 to 2009: 8.5
Infant deaths per 1000 live births from 2010 to 2021: 7.2
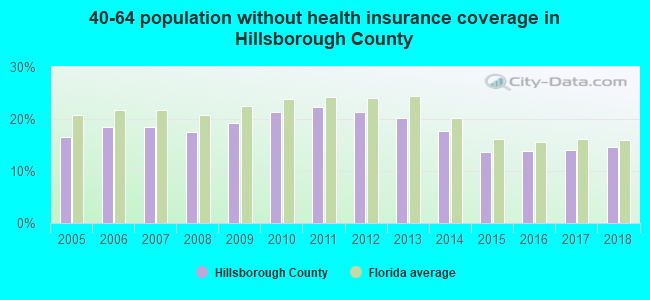
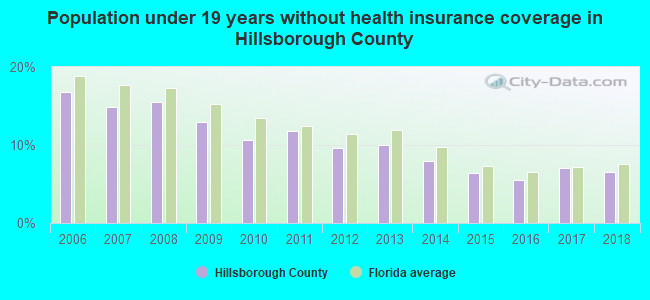
Persons under 19 years old without health insurance coverage in 2018: 6.6%
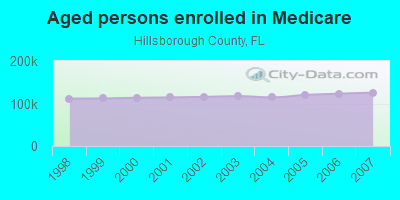
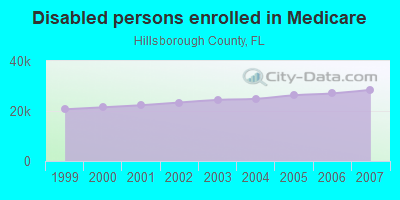
Persons enrolled in hospital insurance and/or supplemental medical insurance (Medicare) in July 1, 2007: 154,228 (125,752 aged, 28,476 disabled)
Children under 18 without health insurance coverage in 2007: 41,761 (14%)

Most common underlying causes of death in Hillsborough County, Florida in 1999 - 2019:
- Atherosclerotic heart disease (18,215)
- Bronchus or lung, unspecified - Malignant neoplasms (12,553)
- Chronic obstructive pulmonary disease, unspecified (9,081)
- Acute myocardial infarction, unspecified (7,730)
- Unspecified dementia (7,459)
- Alzheimer disease, unspecified (5,579)
- Atherosclerotic cardiovascular disease, so described (4,865)
- Hypertensive heart disease without (congestive) heart failure (4,633)
- Stroke, not specified as haemorrhage or infarction (4,514)
- Colon, unspecified - Malignant neoplasms (3,512)
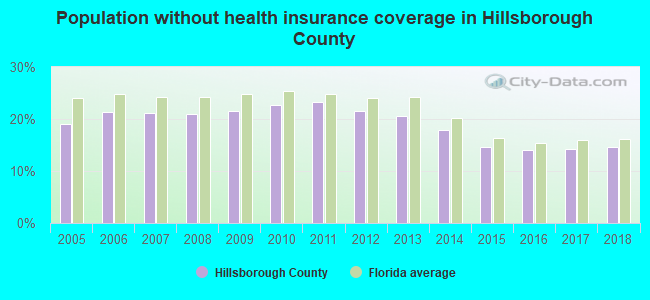
Population without health insurance coverage in 2000: 16%
Children under 18 without health insurance coverage in 2000: 15%
Short term general hospital admissions per 100,000 population in 2004: 13,536
Short term general hospital beds per 100,000 population in 2004: 310
Emergency room visits per 100,000 population in 2004: 40,159
General practice office based MDs per 100,000 population in 2005: 1,490
Medical specialist MDs per 100,000 population in 2005: 798
Dentists per 100,000 population in 1998: 6
Total births per 100,000 population, July 2005 - July 2006 : 41
Total deaths per 100,000 population, July 2005 - July 2006: 76
Limited-service eating places per 100,000 population in 2005 : 10
Fitness & recreation sports centers per 100,000 population in 2005: 9,453
EPA green book nonattainment status in 2004-2006: 1
Homicides per 1,000,000 population from 2000 to 2006: 59.2. This is less than state average.
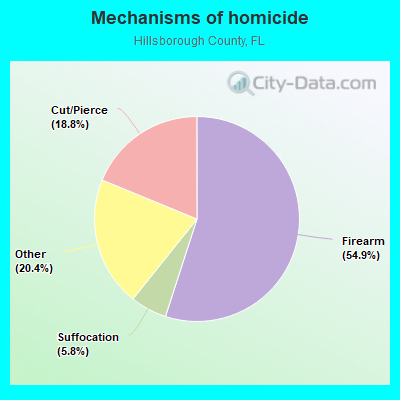
- Firearm - 32.5
- Cut/Pierce - 11.1
- Suffocation - 3.4
- Other - 12.1
Suicides per 1,000,000 population from 2000 to 2006: 128.3. This is less than state average.
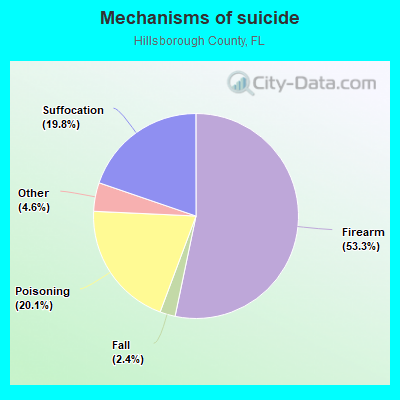
- Firearm - 68.3
- Poisoning - 25.7
- Suffocation - 25.3
- Fall - 3.1
- Other - 5.8
Household type by relationship:
Households: 1,513,301- Male householders: 291,033 (73,338 living alone), Female householders: 291,791 (84,784 living alone)
265,697 spouses (262,221 opposite-sex spouses), 50,437 unmarried partners, (45,628 opposite-sex unmarried partners), 413,139 children (384,714 natural, 11,533 adopted, 16,892 stepchildren), 31,452 grandchildren, 19,458 brothers or sisters, 34,589 parents, 1,771 foster children, 26,884 other relatives, 55,969 non-relatives
- In group quarters: 31,081
Size of family households: 152,804 2-persons, 93,032 3-persons, 71,253 4-persons, 33,423 5-persons, 15,627 6-persons, 6,319 7-or-more-persons.
Size of nonfamily households: 158,122 1-person, 42,746 2-persons, 6,362 3-persons, 2,063 4-persons, 795 5-persons, 278 7-or-more-persons.
193,140 married couples with children.
94,012 single-parent households (24,072 men, 69,940 women).
69.5% of residents of Hillsborough speak English at home.
22.7% of residents speak Spanish at home (55% speak English very well, 16% speak English well, 16% speak English not well, 13% don't speak English at all).
4.1% of residents speak other Indo-European language at home (69% speak English very well, 18% speak English well, 8% speak English not well, 5% don't speak English at all).
2.4% of residents speak Asian or Pacific Island language at home (64% speak English very well, 21% speak English well, 11% speak English not well, 4% don't speak English at all).
1.3% of residents speak other language at home (70% speak English very well, 22% speak English well, 2% speak English not well, 6% don't speak English at all).
In fiscal year 2004:
Federal Government expenditure: $7,095,092,000 ($6,443 per capita)
Department of Defense expenditure: $1,471,066,000
Federal direct payments to individuals for retirement and disability: $2,552,037,000
Federal other direct payments to individuals: $1,280,585,000
Federal direct payments not to individuals: $28,723,000
Federal grants: $1,295,937,000
Federal procurement contracts: $934,642,000 ($726,404,000 Department of Defense)
Federal salaries and wages: $1,003,168,000 ($398,187,000 Department of Defense)
Federal Government direct loans: $4,840,000
Federal guaranteed/insured loans: $1,038,887,000
Federal Government insurance: $8,634,839,000
Population change from April 1, 2000 to July 1, 2005:
Births: 80,184| Here: | 71 per 1000 residents |
| State: | 63 per 1000 residents |
Deaths: 45,295
| Here: | 40 per 1000 residents |
| State: | 49 per 1000 residents |
Net international migration: +26,420
| Here: | +23 per 1000 residents |
| State: | +30 per 1000 residents |
Net internal migration: +73,235
| Here: | +65 per 1000 residents |
| State: | +59 per 1000 residents |
Total withdrawal of fresh water for public supply: 166.39 millions of gallons per day (51% from ground, 49% from surface)
| Here: | 6.2 |
| State: | 5.9 |
| Here: | 4.1 |
| State: | 4.2 |
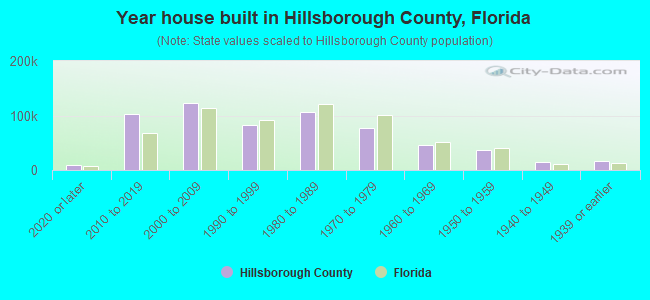
- Year house built in Hillsborough County, Florida
- 20,1082020 or later
- 97,8232010 to 2019
- 119,0072000 to 2009
- 81,6181990 to 1999
- 117,6931980 to 1989
- 79,6041970 to 1979
- 43,7691960 to 1969
- 38,2461950 to 1959
- 12,7031940 to 1949
- 17,9061939 or earlier
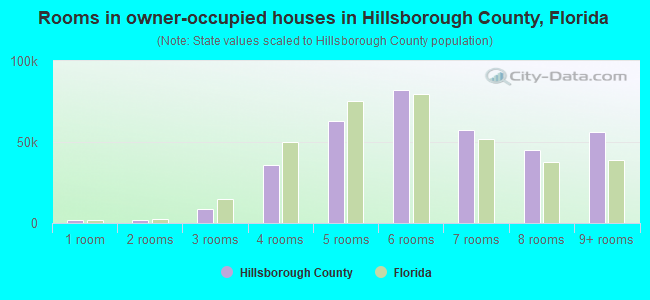
- Rooms in owner-occupied houses in Hillsborough County, Florida
- 1,3891 room
- 2,1992 rooms
- 11,0803 rooms
- 39,4764 rooms
- 70,3285 rooms
- 78,7926 rooms
- 56,3957 rooms
- 43,7638 rooms
- 53,5249+ rooms
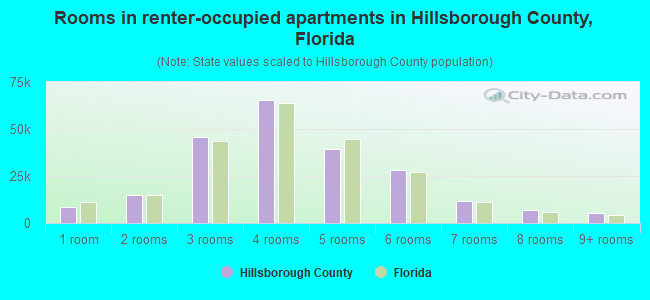
- Rooms in renter-occupied apartments in Hillsborough County, Florida
- 12,5191 room
- 12,7762 rooms
- 51,6563 rooms
- 58,2234 rooms
- 40,1315 rooms
- 31,3436 rooms
- 9,3857 rooms
- 5,2048 rooms
- 4,6419+ rooms
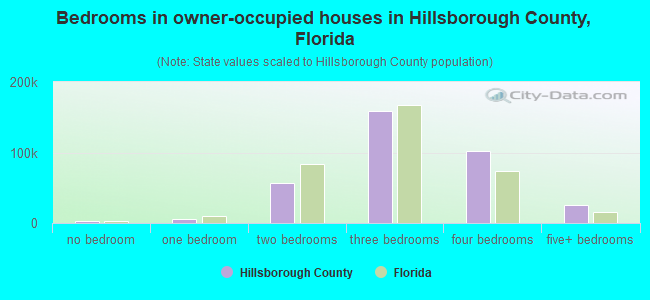
- Bedrooms in owner-occupied houses in Hillsborough County, Florida
- 1,758no bedroom
- 7,8261 bedroom
- 65,6002 bedrooms
- 150,8183 bedrooms
- 105,0074 bedrooms
- 25,9375+ bedrooms
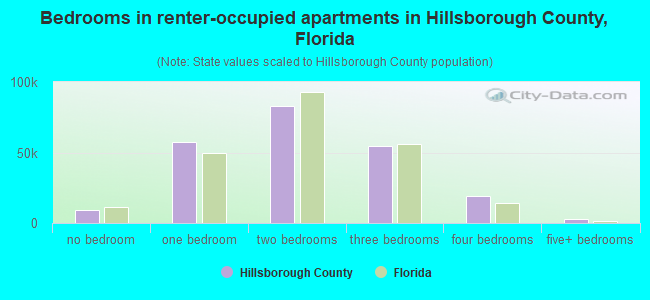
- Bedrooms in renter-occupied apartments in Hillsborough County, Florida
- 12,671no bedroom
- 54,4571 bedroom
- 85,5652 bedrooms
- 52,7383 bedrooms
- 17,9494 bedrooms
- 2,4985+ bedrooms
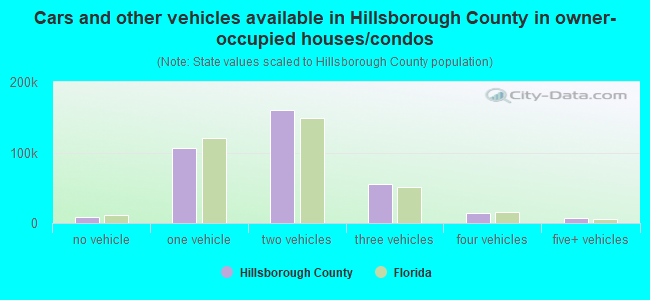
- Cars and other vehicles available in Hillsborough County in owner-occupied houses/condos
- 9,274no vehicle
- 105,1861 vehicle
- 163,5112 vehicles
- 59,0463 vehicles
- 14,6144 vehicles
- 5,3155+ vehicles
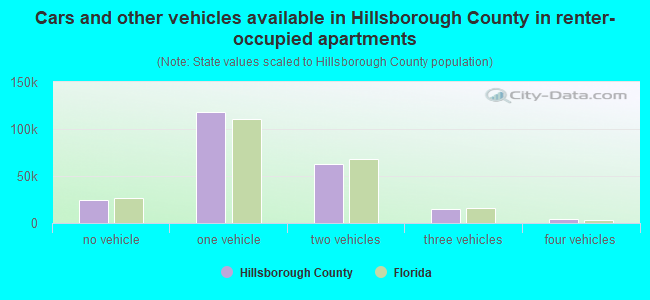
- Cars and other vehicles available in Hillsborough County in renter-occupied apartments
- 24,164no vehicle
- 112,6361 vehicle
- 67,5472 vehicles
- 16,2643 vehicles
- 3,9064 vehicles
- 1,3615+ vehicles
84.6% of Hillsborough County residents lived in the same house 1 years ago.
Out of people who lived in different houses, 35% lived in this county.
Out of people who lived in different counties, 44% lived in Florida.
| Hillsborough County: | 84.6% |
| State average: | 86.3% |
Place of birth for U.S.-born residents:
- This state: 576,253
- Other state: 559,157
- Northeast: 216,041
- Midwest: 135,348
- South: 155,548
- West: 52,220
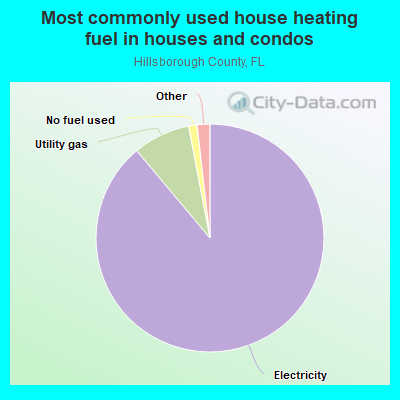
- 89.3%Electricity
- 7.5%Utility gas
- 1.3%No fuel used
- 0.9%Bottled, tank, or LP gas
- 0.7%Solar energy
- 0.1%Wood
- 0.1%Fuel oil, kerosene, etc.
- 0.1%Other fuel
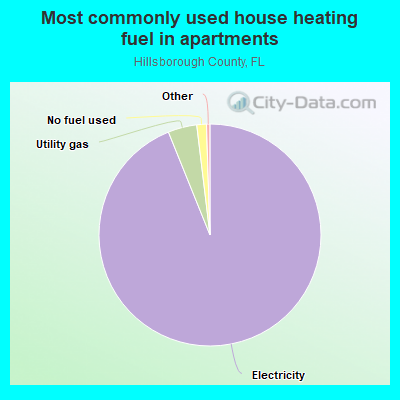
- 93.3%Electricity
- 4.1%Utility gas
- 1.7%No fuel used
- 0.5%Bottled, tank, or LP gas
- 0.2%Other fuel
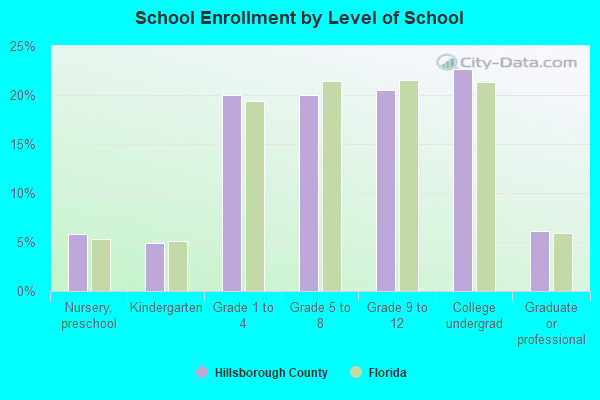
Private vs. public school enrollment:
| Here: | 11.4% |
| Florida: | 15.8% |
| Here: | 9.9% |
| Florida: | 12.9% |
| Here: | 26.7% |
| Florida: | 23.6% |

Hillsborough County government finances - Expenditure in 2018:
- Bond Funds - Cash and Securities: $272,140,000
Cash and Securities: $74,816,000
- Charges - Other: $203,954,000
Other: $176,798,000
Solid Waste Management: $109,409,000
Solid Waste Management: $105,423,000
Sea and Inland Port Facilities: $53,772,000
Sea and Inland Port Facilities: $46,206,000
Natural Resources - Other: $6,032,000
Natural Resources - Other: $5,084,000
Regular Highways: $4,468,000
Parks and Recreation: $4,390,000
Parks and Recreation: $4,385,000
Regular Highways: $2,862,000
Housing and Community Development: $901,000
Parking Facilities: $871,000
Parking Facilities: $867,000
Housing and Community Development: $608,000
- Construction - Water Utilities: $127,073,000
Water Utilities: $92,882,000
Regular Highways: $76,746,000
Regular Highways: $51,354,000
Sea and Inland Port Facilities: $44,266,000
Police Protection: $33,216,000
Natural Resources - Other: $25,169,000
Natural Resources - Other: $24,366,000
Police Protection: $15,932,000
- Current Operations - Police Protection: $394,750,000
Water Utilities: $274,994,000
Water Utilities: $231,405,000
Police Protection: $228,320,000
General - Other: $227,089,000
General - Other: $202,176,000
Health - Other: $179,614,000
Health - Other: $168,341,000
Financial Administration: $156,577,000
Correctional Institutions: $146,930,000
Financial Administration: $146,424,000
Local Fire Protection: $127,714,000
Local Fire Protection: $107,260,000
Solid Waste Management: $102,782,000
Solid Waste Management: $97,481,000
Regular Highways: $87,350,000
Regular Highways: $73,017,000
Judicial and Legal Services: $63,675,000
Judicial and Legal Services: $61,599,000
Parks and Recreation: $47,470,000
Parks and Recreation: $46,883,000
Libraries: $39,620,000
Libraries: $36,277,000
Natural Resources - Other: $35,149,000
Natural Resources - Other: $33,237,000
Sea and Inland Port Facilities: $33,064,000
Protective Inspection and Regulation - Other: $30,921,000
Central Staff Services: $29,368,000
Protective Inspection and Regulation - Other: $26,639,000
Central Staff Services: $25,284,000
General Public Buildings: $22,496,000
General Public Buildings: $18,990,000
Housing and Community Development: $11,961,000
Public Welfare - Other: $10,530,000
Public Welfare - Other: $9,722,000
Housing and Community Development: $9,331,000
Correctional Institutions: $7,411,000
Transit Utilities: $160,000
Transit Utilities: $97,000
- Federal Intergovernmental - Public Welfare: $56,855,000
Public Welfare: $43,437,000
Other: $22,931,000
Other: $22,618,000
Highways: $3,869,000
Health and Hospitals: $3,657,000
Health and Hospitals: $3,414,000
Highways: $2,585,000
General Local Government Support: $1,000
General Local Government Support: $1,000
- General - Interest on Debt: $31,087,000
Interest on Debt: $29,422,000
- Intergovernmental to Local - Other - Sea and Inland Port Facilities: $1,103,000
Other - General - Other: $30,000
- Intergovernmental to State - Health - Other: $19,000,000
Health - Other: $19,000,000
- Local Intergovernmental - Other: $77,878,000
Other: $37,513,000
Highways: $5,271,000
Highways: $522,000
- Long Term Debt - Outstanding Unspecified Public Purpose: $1,301,804,000
Beginning Outstanding - Unspecified Public Purpose: $1,183,040,000
Beginning Outstanding - Unspecified Public Purpose: $1,121,504,000
Outstanding Unspecified Public Purpose: $1,091,226,000
Beginning Outstanding - Public Debt for Private Purpose: $354,203,000
Outstanding Nonguaranteed - Industrial Revenue: $349,661,000
Issue, Unspecified Public Purpose: $284,335,000
Retired Unspecified Public Purpose: $243,231,000
Issue, Unspecified Public Purpose: $212,953,000
Beginning Outstanding - Public Debt for Private Purpose: $166,512,000
Outstanding Nonguaranteed - Industrial Revenue: $158,970,000
Retired Unspecified Public Purpose: $146,935,000
Retired Nonguaranteed - Public Debt for Private Purpose: $7,542,000
Retired Nonguaranteed - Public Debt for Private Purpose: $7,542,000
Issue, Nonguaranteed - Public Debt for Private Purpose: $3,000,000
- Miscellaneous - Special Assessments: $88,458,000
Special Assessments: $63,500,000
Interest Earnings: $60,126,000
General Revenue - Other: $30,206,000
Interest Earnings: $22,514,000
Fines and Forfeits: $22,402,000
General Revenue - Other: $21,126,000
Rents: $20,709,000
Fines and Forfeits: $16,285,000
Sale of Property: $11,649,000
Rents: $3,144,000
Donations From Private Sources: $2,251,000
Donations From Private Sources: $394,000
- Other Capital Outlay - General - Other: $14,976,000
General - Other: $13,531,000
Parks and Recreation: $12,825,000
Libraries: $10,043,000
Judicial and Legal Services: $7,562,000
Libraries: $7,375,000
Parks and Recreation: $6,958,000
Correctional Institutions: $6,373,000
Local Fire Protection: $4,643,000
Financial Administration: $3,453,000
Housing and Community Development: $3,361,000
General Public Building: $2,517,000
Financial Administration: $2,471,000
Sea and Inland Port Facilities: $2,245,000
Correctional Institutions: $2,156,000
Local Fire Protection: $1,990,000
Health - Other: $1,566,000
Judicial and Legal Services: $876,000
Health - Other: $732,000
Protective Inspection and Regulation - Other: $540,000
Protective Inspection and Regulation - Other: $259,000
General Public Building: $76,000
Central Staff Services: $29,000
Central Staff Services: $28,000
Housing and Community Development: $9,000
- Other Funds - Cash and Securities: $2,193,712,000
Cash and Securities: $1,974,126,000
- Revenue - Water Utilities: $262,358,000
Water Utilities: $240,480,000
- Short Term Debt Outstanding - End of Fiscal Year: $21,000
- Sinking Funds - Cash and Securities: $211,672,000
Cash and Securities: $203,624,000
- State Intergovernmental - General Local Government Support: $154,629,000
General Local Government Support: $140,908,000
Other: $53,009,000
Other: $38,833,000
Highways: $19,603,000
Highways: $19,030,000
Public Welfare: $14,277,000
Public Welfare: $6,496,000
Health and Hospitals: $4,749,000
Health and Hospitals: $4,036,000
- Tax - Property: $831,801,000
Property: $699,583,000
General Sales and Gross Receipts: $338,100,000
General Sales and Gross Receipts: $248,755,000
Motor Fuels Sales: $36,132,000
Other Selective Sales: $35,966,000
Motor Fuels Sales: $35,056,000
Other Selective Sales: $31,095,000
Public Utilities Sales: $21,400,000
Other License: $19,802,000
Public Utilities Sales: $18,788,000
Other License: $15,276,000
Documentary and Stock Transfer: $6,970,000
Documentary and Stock Transfer: $5,447,000
Occupation and Business License - Other: $1,686,000
Occupation and Business License - Other: $1,598,000
Other: $6,000
- Total Salaries and Wages: $12,635,000
: $323,000
- Water Utilities - Interest on Debt: $10,733,000
Interest on Debt: $5,911,000
Hillsborough County government finances - Revenue in 2018:
- Bond Funds - Cash and Securities: $272,140,000
Cash and Securities: $74,816,000
- Charges - Other: $203,954,000
Other: $176,798,000
Solid Waste Management: $109,409,000
Solid Waste Management: $105,423,000
Sea and Inland Port Facilities: $53,772,000
Sea and Inland Port Facilities: $46,206,000
Natural Resources - Other: $6,032,000
Natural Resources - Other: $5,084,000
Regular Highways: $4,468,000
Parks and Recreation: $4,390,000
Parks and Recreation: $4,385,000
Regular Highways: $2,862,000
Housing and Community Development: $901,000
Parking Facilities: $871,000
Parking Facilities: $867,000
Housing and Community Development: $608,000
- Construction - Water Utilities: $127,073,000
Water Utilities: $92,882,000
Regular Highways: $76,746,000
Regular Highways: $51,354,000
Sea and Inland Port Facilities: $44,266,000
Police Protection: $33,216,000
Natural Resources - Other: $25,169,000
Natural Resources - Other: $24,366,000
Police Protection: $15,932,000
- Current Operations - Police Protection: $394,750,000
Water Utilities: $274,994,000
Water Utilities: $231,405,000
Police Protection: $228,320,000
General - Other: $227,089,000
General - Other: $202,176,000
Health - Other: $179,614,000
Health - Other: $168,341,000
Financial Administration: $156,577,000
Correctional Institutions: $146,930,000
Financial Administration: $146,424,000
Local Fire Protection: $127,714,000
Local Fire Protection: $107,260,000
Solid Waste Management: $102,782,000
Solid Waste Management: $97,481,000
Regular Highways: $87,350,000
Regular Highways: $73,017,000
Judicial and Legal Services: $63,675,000
Judicial and Legal Services: $61,599,000
Parks and Recreation: $47,470,000
Parks and Recreation: $46,883,000
Libraries: $39,620,000
Libraries: $36,277,000
Natural Resources - Other: $35,149,000
Natural Resources - Other: $33,237,000
Sea and Inland Port Facilities: $33,064,000
Protective Inspection and Regulation - Other: $30,921,000
Central Staff Services: $29,368,000
Protective Inspection and Regulation - Other: $26,639,000
Central Staff Services: $25,284,000
General Public Buildings: $22,496,000
General Public Buildings: $18,990,000
Housing and Community Development: $11,961,000
Public Welfare - Other: $10,530,000
Public Welfare - Other: $9,722,000
Housing and Community Development: $9,331,000
Correctional Institutions: $7,411,000
Transit Utilities: $160,000
Transit Utilities: $97,000
- Federal Intergovernmental - Public Welfare: $56,855,000
Public Welfare: $43,437,000
Other: $22,931,000
Other: $22,618,000
Highways: $3,869,000
Health and Hospitals: $3,657,000
Health and Hospitals: $3,414,000
Highways: $2,585,000
General Local Government Support: $1,000
General Local Government Support: $1,000
- General - Interest on Debt: $31,087,000
Interest on Debt: $29,422,000
- Intergovernmental to Local - Other - Sea and Inland Port Facilities: $1,103,000
Other - General - Other: $30,000
- Intergovernmental to State - Health - Other: $19,000,000
Health - Other: $19,000,000
- Local Intergovernmental - Other: $77,878,000
Other: $37,513,000
Highways: $5,271,000
Highways: $522,000
- Long Term Debt - Outstanding Unspecified Public Purpose: $1,301,804,000
Beginning Outstanding - Unspecified Public Purpose: $1,183,040,000
Beginning Outstanding - Unspecified Public Purpose: $1,121,504,000
Outstanding Unspecified Public Purpose: $1,091,226,000
Beginning Outstanding - Public Debt for Private Purpose: $354,203,000
Outstanding Nonguaranteed - Industrial Revenue: $349,661,000
Issue, Unspecified Public Purpose: $284,335,000
Retired Unspecified Public Purpose: $243,231,000
Issue, Unspecified Public Purpose: $212,953,000
Beginning Outstanding - Public Debt for Private Purpose: $166,512,000
Outstanding Nonguaranteed - Industrial Revenue: $158,970,000
Retired Unspecified Public Purpose: $146,935,000
Retired Nonguaranteed - Public Debt for Private Purpose: $7,542,000
Retired Nonguaranteed - Public Debt for Private Purpose: $7,542,000
Issue, Nonguaranteed - Public Debt for Private Purpose: $3,000,000
- Miscellaneous - Special Assessments: $88,458,000
Special Assessments: $63,500,000
Interest Earnings: $60,126,000
General Revenue - Other: $30,206,000
Interest Earnings: $22,514,000
Fines and Forfeits: $22,402,000
General Revenue - Other: $21,126,000
Rents: $20,709,000
Fines and Forfeits: $16,285,000
Sale of Property: $11,649,000
Rents: $3,144,000
Donations From Private Sources: $2,251,000
Donations From Private Sources: $394,000
- Other Capital Outlay - General - Other: $14,976,000
General - Other: $13,531,000
Parks and Recreation: $12,825,000
Libraries: $10,043,000
Judicial and Legal Services: $7,562,000
Libraries: $7,375,000
Parks and Recreation: $6,958,000
Correctional Institutions: $6,373,000
Local Fire Protection: $4,643,000
Financial Administration: $3,453,000
Housing and Community Development: $3,361,000
General Public Building: $2,517,000
Financial Administration: $2,471,000
Sea and Inland Port Facilities: $2,245,000
Correctional Institutions: $2,156,000
Local Fire Protection: $1,990,000
Health - Other: $1,566,000
Judicial and Legal Services: $876,000
Health - Other: $732,000
Protective Inspection and Regulation - Other: $540,000
Protective Inspection and Regulation - Other: $259,000
General Public Building: $76,000
Central Staff Services: $29,000
Central Staff Services: $28,000
Housing and Community Development: $9,000
- Other Funds - Cash and Securities: $2,193,712,000
Cash and Securities: $1,974,126,000
- Revenue - Water Utilities: $262,358,000
Water Utilities: $240,480,000
- Short Term Debt Outstanding - End of Fiscal Year: $21,000
- Sinking Funds - Cash and Securities: $211,672,000
Cash and Securities: $203,624,000
- State Intergovernmental - General Local Government Support: $154,629,000
General Local Government Support: $140,908,000
Other: $53,009,000
Other: $38,833,000
Highways: $19,603,000
Highways: $19,030,000
Public Welfare: $14,277,000
Public Welfare: $6,496,000
Health and Hospitals: $4,749,000
Health and Hospitals: $4,036,000
- Tax - Property: $831,801,000
Property: $699,583,000
General Sales and Gross Receipts: $338,100,000
General Sales and Gross Receipts: $248,755,000
Motor Fuels Sales: $36,132,000
Other Selective Sales: $35,966,000
Motor Fuels Sales: $35,056,000
Other Selective Sales: $31,095,000
Public Utilities Sales: $21,400,000
Other License: $19,802,000
Public Utilities Sales: $18,788,000
Other License: $15,276,000
Documentary and Stock Transfer: $6,970,000
Documentary and Stock Transfer: $5,447,000
Occupation and Business License - Other: $1,686,000
Occupation and Business License - Other: $1,598,000
Other: $6,000
- Total Salaries and Wages: $12,635,000
: $323,000
- Water Utilities - Interest on Debt: $10,733,000
Interest on Debt: $5,911,000
Hillsborough County government finances - Debt in 2018:
- Bond Funds - Cash and Securities: $272,140,000
Cash and Securities: $74,816,000
- Charges - Other: $203,954,000
Other: $176,798,000
Solid Waste Management: $109,409,000
Solid Waste Management: $105,423,000
Sea and Inland Port Facilities: $53,772,000
Sea and Inland Port Facilities: $46,206,000
Natural Resources - Other: $6,032,000
Natural Resources - Other: $5,084,000
Regular Highways: $4,468,000
Parks and Recreation: $4,390,000
Parks and Recreation: $4,385,000
Regular Highways: $2,862,000
Housing and Community Development: $901,000
Parking Facilities: $871,000
Parking Facilities: $867,000
Housing and Community Development: $608,000
- Construction - Water Utilities: $127,073,000
Water Utilities: $92,882,000
Regular Highways: $76,746,000
Regular Highways: $51,354,000
Sea and Inland Port Facilities: $44,266,000
Police Protection: $33,216,000
Natural Resources - Other: $25,169,000
Natural Resources - Other: $24,366,000
Police Protection: $15,932,000
- Current Operations - Police Protection: $394,750,000
Water Utilities: $274,994,000
Water Utilities: $231,405,000
Police Protection: $228,320,000
General - Other: $227,089,000
General - Other: $202,176,000
Health - Other: $179,614,000
Health - Other: $168,341,000
Financial Administration: $156,577,000
Correctional Institutions: $146,930,000
Financial Administration: $146,424,000
Local Fire Protection: $127,714,000
Local Fire Protection: $107,260,000
Solid Waste Management: $102,782,000
Solid Waste Management: $97,481,000
Regular Highways: $87,350,000
Regular Highways: $73,017,000
Judicial and Legal Services: $63,675,000
Judicial and Legal Services: $61,599,000
Parks and Recreation: $47,470,000
Parks and Recreation: $46,883,000
Libraries: $39,620,000
Libraries: $36,277,000
Natural Resources - Other: $35,149,000
Natural Resources - Other: $33,237,000
Sea and Inland Port Facilities: $33,064,000
Protective Inspection and Regulation - Other: $30,921,000
Central Staff Services: $29,368,000
Protective Inspection and Regulation - Other: $26,639,000
Central Staff Services: $25,284,000
General Public Buildings: $22,496,000
General Public Buildings: $18,990,000
Housing and Community Development: $11,961,000
Public Welfare - Other: $10,530,000
Public Welfare - Other: $9,722,000
Housing and Community Development: $9,331,000
Correctional Institutions: $7,411,000
Transit Utilities: $160,000
Transit Utilities: $97,000
- Federal Intergovernmental - Public Welfare: $56,855,000
Public Welfare: $43,437,000
Other: $22,931,000
Other: $22,618,000
Highways: $3,869,000
Health and Hospitals: $3,657,000
Health and Hospitals: $3,414,000
Highways: $2,585,000
General Local Government Support: $1,000
General Local Government Support: $1,000
- General - Interest on Debt: $31,087,000
Interest on Debt: $29,422,000
- Intergovernmental to Local - Other - Sea and Inland Port Facilities: $1,103,000
Other - General - Other: $30,000
- Intergovernmental to State - Health - Other: $19,000,000
Health - Other: $19,000,000
- Local Intergovernmental - Other: $77,878,000
Other: $37,513,000
Highways: $5,271,000
Highways: $522,000
- Long Term Debt - Outstanding Unspecified Public Purpose: $1,301,804,000
Beginning Outstanding - Unspecified Public Purpose: $1,183,040,000
Beginning Outstanding - Unspecified Public Purpose: $1,121,504,000
Outstanding Unspecified Public Purpose: $1,091,226,000
Beginning Outstanding - Public Debt for Private Purpose: $354,203,000
Outstanding Nonguaranteed - Industrial Revenue: $349,661,000
Issue, Unspecified Public Purpose: $284,335,000
Retired Unspecified Public Purpose: $243,231,000
Issue, Unspecified Public Purpose: $212,953,000
Beginning Outstanding - Public Debt for Private Purpose: $166,512,000
Outstanding Nonguaranteed - Industrial Revenue: $158,970,000
Retired Unspecified Public Purpose: $146,935,000
Retired Nonguaranteed - Public Debt for Private Purpose: $7,542,000
Retired Nonguaranteed - Public Debt for Private Purpose: $7,542,000
Issue, Nonguaranteed - Public Debt for Private Purpose: $3,000,000
- Miscellaneous - Special Assessments: $88,458,000
Special Assessments: $63,500,000
Interest Earnings: $60,126,000
General Revenue - Other: $30,206,000
Interest Earnings: $22,514,000
Fines and Forfeits: $22,402,000
General Revenue - Other: $21,126,000
Rents: $20,709,000
Fines and Forfeits: $16,285,000
Sale of Property: $11,649,000
Rents: $3,144,000
Donations From Private Sources: $2,251,000
Donations From Private Sources: $394,000
- Other Capital Outlay - General - Other: $14,976,000
General - Other: $13,531,000
Parks and Recreation: $12,825,000
Libraries: $10,043,000
Judicial and Legal Services: $7,562,000
Libraries: $7,375,000
Parks and Recreation: $6,958,000
Correctional Institutions: $6,373,000
Local Fire Protection: $4,643,000
Financial Administration: $3,453,000
Housing and Community Development: $3,361,000
General Public Building: $2,517,000
Financial Administration: $2,471,000
Sea and Inland Port Facilities: $2,245,000
Correctional Institutions: $2,156,000
Local Fire Protection: $1,990,000
Health - Other: $1,566,000
Judicial and Legal Services: $876,000
Health - Other: $732,000
Protective Inspection and Regulation - Other: $540,000
Protective Inspection and Regulation - Other: $259,000
General Public Building: $76,000
Central Staff Services: $29,000
Central Staff Services: $28,000
Housing and Community Development: $9,000
- Other Funds - Cash and Securities: $2,193,712,000
Cash and Securities: $1,974,126,000
- Revenue - Water Utilities: $262,358,000
Water Utilities: $240,480,000
- Short Term Debt Outstanding - End of Fiscal Year: $21,000
- Sinking Funds - Cash and Securities: $211,672,000
Cash and Securities: $203,624,000
- State Intergovernmental - General Local Government Support: $154,629,000
General Local Government Support: $140,908,000
Other: $53,009,000
Other: $38,833,000
Highways: $19,603,000
Highways: $19,030,000
Public Welfare: $14,277,000
Public Welfare: $6,496,000
Health and Hospitals: $4,749,000
Health and Hospitals: $4,036,000
- Tax - Property: $831,801,000
Property: $699,583,000
General Sales and Gross Receipts: $338,100,000
General Sales and Gross Receipts: $248,755,000
Motor Fuels Sales: $36,132,000
Other Selective Sales: $35,966,000
Motor Fuels Sales: $35,056,000
Other Selective Sales: $31,095,000
Public Utilities Sales: $21,400,000
Other License: $19,802,000
Public Utilities Sales: $18,788,000
Other License: $15,276,000
Documentary and Stock Transfer: $6,970,000
Documentary and Stock Transfer: $5,447,000
Occupation and Business License - Other: $1,686,000
Occupation and Business License - Other: $1,598,000
Other: $6,000
- Total Salaries and Wages: $12,635,000
: $323,000
- Water Utilities - Interest on Debt: $10,733,000
Interest on Debt: $5,911,000
Hillsborough County government finances - Cash and Securities in 2018:
- Bond Funds - Cash and Securities: $272,140,000
Cash and Securities: $74,816,000
- Charges - Other: $203,954,000
Other: $176,798,000
Solid Waste Management: $109,409,000
Solid Waste Management: $105,423,000
Sea and Inland Port Facilities: $53,772,000
Sea and Inland Port Facilities: $46,206,000
Natural Resources - Other: $6,032,000
Natural Resources - Other: $5,084,000
Regular Highways: $4,468,000
Parks and Recreation: $4,390,000
Parks and Recreation: $4,385,000
Regular Highways: $2,862,000
Housing and Community Development: $901,000
Parking Facilities: $871,000
Parking Facilities: $867,000
Housing and Community Development: $608,000
- Construction - Water Utilities: $127,073,000
Water Utilities: $92,882,000
Regular Highways: $76,746,000
Regular Highways: $51,354,000
Sea and Inland Port Facilities: $44,266,000
Police Protection: $33,216,000
Natural Resources - Other: $25,169,000
Natural Resources - Other: $24,366,000
Police Protection: $15,932,000
- Current Operations - Police Protection: $394,750,000
Water Utilities: $274,994,000
Water Utilities: $231,405,000
Police Protection: $228,320,000
General - Other: $227,089,000
General - Other: $202,176,000
Health - Other: $179,614,000
Health - Other: $168,341,000
Financial Administration: $156,577,000
Correctional Institutions: $146,930,000
Financial Administration: $146,424,000
Local Fire Protection: $127,714,000
Local Fire Protection: $107,260,000
Solid Waste Management: $102,782,000
Solid Waste Management: $97,481,000
Regular Highways: $87,350,000
Regular Highways: $73,017,000
Judicial and Legal Services: $63,675,000
Judicial and Legal Services: $61,599,000
Parks and Recreation: $47,470,000
Parks and Recreation: $46,883,000
Libraries: $39,620,000
Libraries: $36,277,000
Natural Resources - Other: $35,149,000
Natural Resources - Other: $33,237,000
Sea and Inland Port Facilities: $33,064,000
Protective Inspection and Regulation - Other: $30,921,000
Central Staff Services: $29,368,000
Protective Inspection and Regulation - Other: $26,639,000
Central Staff Services: $25,284,000
General Public Buildings: $22,496,000
General Public Buildings: $18,990,000
Housing and Community Development: $11,961,000
Public Welfare - Other: $10,530,000
Public Welfare - Other: $9,722,000
Housing and Community Development: $9,331,000
Correctional Institutions: $7,411,000
Transit Utilities: $160,000
Transit Utilities: $97,000
- Federal Intergovernmental - Public Welfare: $56,855,000
Public Welfare: $43,437,000
Other: $22,931,000
Other: $22,618,000
Highways: $3,869,000
Health and Hospitals: $3,657,000
Health and Hospitals: $3,414,000
Highways: $2,585,000
General Local Government Support: $1,000
General Local Government Support: $1,000
- General - Interest on Debt: $31,087,000
Interest on Debt: $29,422,000
- Intergovernmental to Local - Other - Sea and Inland Port Facilities: $1,103,000
Other - General - Other: $30,000
- Intergovernmental to State - Health - Other: $19,000,000
Health - Other: $19,000,000
- Local Intergovernmental - Other: $77,878,000
Other: $37,513,000
Highways: $5,271,000
Highways: $522,000
- Long Term Debt - Outstanding Unspecified Public Purpose: $1,301,804,000
Beginning Outstanding - Unspecified Public Purpose: $1,183,040,000
Beginning Outstanding - Unspecified Public Purpose: $1,121,504,000
Outstanding Unspecified Public Purpose: $1,091,226,000
Beginning Outstanding - Public Debt for Private Purpose: $354,203,000
Outstanding Nonguaranteed - Industrial Revenue: $349,661,000
Issue, Unspecified Public Purpose: $284,335,000
Retired Unspecified Public Purpose: $243,231,000
Issue, Unspecified Public Purpose: $212,953,000
Beginning Outstanding - Public Debt for Private Purpose: $166,512,000
Outstanding Nonguaranteed - Industrial Revenue: $158,970,000
Retired Unspecified Public Purpose: $146,935,000
Retired Nonguaranteed - Public Debt for Private Purpose: $7,542,000
Retired Nonguaranteed - Public Debt for Private Purpose: $7,542,000
Issue, Nonguaranteed - Public Debt for Private Purpose: $3,000,000
- Miscellaneous - Special Assessments: $88,458,000
Special Assessments: $63,500,000
Interest Earnings: $60,126,000
General Revenue - Other: $30,206,000
Interest Earnings: $22,514,000
Fines and Forfeits: $22,402,000
General Revenue - Other: $21,126,000
Rents: $20,709,000
Fines and Forfeits: $16,285,000
Sale of Property: $11,649,000
Rents: $3,144,000
Donations From Private Sources: $2,251,000
Donations From Private Sources: $394,000
- Other Capital Outlay - General - Other: $14,976,000
General - Other: $13,531,000
Parks and Recreation: $12,825,000
Libraries: $10,043,000
Judicial and Legal Services: $7,562,000
Libraries: $7,375,000
Parks and Recreation: $6,958,000
Correctional Institutions: $6,373,000
Local Fire Protection: $4,643,000
Financial Administration: $3,453,000
Housing and Community Development: $3,361,000
General Public Building: $2,517,000
Financial Administration: $2,471,000
Sea and Inland Port Facilities: $2,245,000
Correctional Institutions: $2,156,000
Local Fire Protection: $1,990,000
Health - Other: $1,566,000
Judicial and Legal Services: $876,000
Health - Other: $732,000
Protective Inspection and Regulation - Other: $540,000
Protective Inspection and Regulation - Other: $259,000
General Public Building: $76,000
Central Staff Services: $29,000
Central Staff Services: $28,000
Housing and Community Development: $9,000
- Other Funds - Cash and Securities: $2,193,712,000
Cash and Securities: $1,974,126,000
- Revenue - Water Utilities: $262,358,000
Water Utilities: $240,480,000
- Short Term Debt Outstanding - End of Fiscal Year: $21,000
- Sinking Funds - Cash and Securities: $211,672,000
Cash and Securities: $203,624,000
- State Intergovernmental - General Local Government Support: $154,629,000
General Local Government Support: $140,908,000
Other: $53,009,000
Other: $38,833,000
Highways: $19,603,000
Highways: $19,030,000
Public Welfare: $14,277,000
Public Welfare: $6,496,000
Health and Hospitals: $4,749,000
Health and Hospitals: $4,036,000
- Tax - Property: $831,801,000
Property: $699,583,000
General Sales and Gross Receipts: $338,100,000
General Sales and Gross Receipts: $248,755,000
Motor Fuels Sales: $36,132,000
Other Selective Sales: $35,966,000
Motor Fuels Sales: $35,056,000
Other Selective Sales: $31,095,000
Public Utilities Sales: $21,400,000
Other License: $19,802,000
Public Utilities Sales: $18,788,000
Other License: $15,276,000
Documentary and Stock Transfer: $6,970,000
Documentary and Stock Transfer: $5,447,000
Occupation and Business License - Other: $1,686,000
Occupation and Business License - Other: $1,598,000
Other: $6,000
- Total Salaries and Wages: $12,635,000
: $323,000
- Water Utilities - Interest on Debt: $10,733,000
Interest on Debt: $5,911,000
Supplemental Security Income (SSI) in 2006:
- Total number of recipients: 30,899
- Number of aged recipients: 4,893
- Number of blind and disabled recipients: 26,006
- Number of recipients under 18: 7,684
- Number of recipients between 18 and 64: 15,578
- Number of recipients older than 64: 7,637
- Number of recipients also receiving OASDI: 9,586
- Amount of payments (thousands of dollars): 14,595
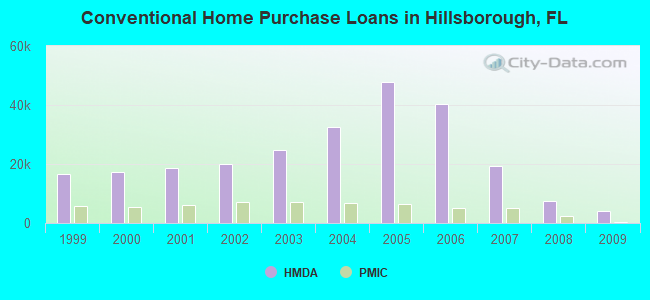
| Home Mortgage Disclosure Act Aggregated Statistics For Year 2009 (Based on 247 full tracts) | ||||||||||||||
| A) FHA, FSA/RHS & VA Home Purchase Loans | B) Conventional Home Purchase Loans | C) Refinancings | D) Home Improvement Loans | E) Loans on Dwellings For 5+ Families | F) Non-occupant Loans on < 5 Family Dwellings (A B C & D) | G) Loans On Manufactured Home Dwelling (A B C & D) | ||||||||
|---|---|---|---|---|---|---|---|---|---|---|---|---|---|---|
| Number | Average Value | Number | Average Value | Number | Average Value | Number | Average Value | Number | Average Value | Number | Average Value | Number | Average Value | |
| LOANS ORIGINATED | 5,814 | $162,386 | 4,151 | $204,884 | 10,187 | $192,350 | 502 | $93,024 | 29 | $6,125,000 | 1,163 | $145,549 | 250 | $90,652 |
| APPLICATIONS APPROVED, NOT ACCEPTED | 369 | $156,282 | 508 | $195,148 | 1,426 | $186,368 | 140 | $55,421 | 3 | $6,715,000 | 150 | $135,247 | 84 | $76,560 |
| APPLICATIONS DENIED | 1,515 | $148,888 | 1,452 | $163,441 | 6,540 | $188,335 | 620 | $62,403 | 6 | $4,888,333 | 702 | $132,821 | 363 | $75,052 |
| APPLICATIONS WITHDRAWN | 946 | $153,920 | 770 | $201,887 | 3,735 | $187,944 | 196 | $101,571 | 5 | $948,200 | 340 | $130,494 | 78 | $106,090 |
| FILES CLOSED FOR INCOMPLETENESS | 245 | $144,976 | 229 | $197,472 | 928 | $189,976 | 21 | $97,000 | 1 | $151,000 | 96 | $124,469 | 20 | $100,850 |
| Private Mortgage Insurance Companies Aggregated Statistics For Year 2009 (Based on 195 full tracts) | ||||||||
| A) Conventional Home Purchase Loans | B) Refinancings | C) Non-occupant Loans on < 5 Family Dwellings (A & B) | D) Loans On Manufactured Home Dwelling (A & B) | |||||
|---|---|---|---|---|---|---|---|---|
| Number | Average Value | Number | Average Value | Number | Average Value | Number | Average Value | |
| LOANS ORIGINATED | 457 | $234,871 | 119 | $223,723 | 4 | $219,000 | 0 | $0 |
| APPLICATIONS APPROVED, NOT ACCEPTED | 247 | $244,717 | 106 | $237,660 | 23 | $213,609 | 1 | $100,000 |
| APPLICATIONS DENIED | 116 | $247,698 | 58 | $220,569 | 10 | $153,700 | 1 | $160,000 |
| APPLICATIONS WITHDRAWN | 60 | $204,317 | 22 | $212,636 | 0 | $0 | 1 | $153,000 |
| FILES CLOSED FOR INCOMPLETENESS | 43 | $247,395 | 11 | $211,909 | 7 | $184,429 | 0 | $0 |
| Most common first names in Hillsborough County, FL among deceased individuals | ||
| Name | Count | Lived (average) |
|---|---|---|
| John | 6,690 | 73.2 years |
| William | 6,158 | 73.2 years |
| Mary | 5,483 | 78.1 years |
| James | 5,467 | 70.4 years |
| Robert | 4,646 | 70.1 years |
| Charles | 3,481 | 72.9 years |
| George | 3,335 | 74.2 years |
| Joseph | 3,081 | 74.1 years |
| Frank | 2,289 | 75.3 years |
| Helen | 2,198 | 79.2 years |
| Most common last names in Hillsborough County, FL among deceased individuals | ||
| Last name | Count | Lived (average) |
|---|---|---|
| Smith | 2,459 | 73.9 years |
| Williams | 1,994 | 72.0 years |
| Johnson | 1,776 | 72.8 years |
| Brown | 1,474 | 72.9 years |
| Jones | 1,391 | 73.8 years |
| Miller | 1,225 | 74.1 years |
| Davis | 1,209 | 71.9 years |
| Wilson | 931 | 73.6 years |
| Rodriguez | 875 | 76.0 years |
| Thomas | 863 | 72.1 years |
| Businesses in Hillsborough County, FL | ||||
| Name | Count | Name | Count | |
|---|---|---|---|---|
| 7-Eleven | 53 | Jones New York | 24 | |
| ALDI | 5 | Journeys | 4 | |
| ALDO | 3 | Justice | 4 | |
| AMF Bowling | 2 | KFC | 18 | |
| AT&T | 19 | Kincaid | 2 | |
| Abercrombie & Fitch | 3 | Kmart | 4 | |
| Abercrombie Kids | 2 | Kohl's | 2 | |
| Ace Hardware | 6 | Kroger | 2 | |
| Advance Auto Parts | 37 | LA Fitness | 5 | |
| Aeropostale | 5 | La Quinta | 8 | |
| Aerosoles | 1 | La-Z-Boy | 5 | |
| Albertsons | 2 | Lane Bryant | 2 | |
| American Eagle Outfitters | 4 | Lane Furniture | 6 | |
| Ann Taylor | 7 | LensCrafters | 7 | |
| Apple Store | 2 | Little Caesars Pizza | 17 | |
| Applebee's | 8 | Long John Silver's | 4 | |
| Arby's | 14 | Lowe's | 9 | |
| Ashley Furniture | 1 | Macy's | 5 | |
| Audi | 1 | Marriott | 20 | |
| AutoZone | 18 | Marshalls | 3 | |
| Avenue | 2 | MasterBrand Cabinets | 58 | |
| BMW | 1 | Mazda | 2 | |
| Baja Fresh Mexican Grill | 1 | McDonald's | 56 | |
| Bakers | 2 | Men's Wearhouse | 6 | |
| Bally Total Fitness | 2 | Microtel | 1 | |
| Banana Republic | 3 | Motel 6 | 2 | |
| Barnes & Noble | 3 | Motherhood Maternity | 8 | |
| Baskin-Robbins | 16 | New Balance | 14 | |
| Bath & Body Works | 5 | New York & Co | 3 | |
| Baymont Inn | 2 | Nike | 63 | |
| Bebe | 3 | Nissan | 3 | |
| Bed Bath & Beyond | 4 | Nordstrom | 2 | |
| Ben & Jerry's | 2 | Office Depot | 7 | |
| Best Western | 3 | Old Navy | 2 | |
| Blockbuster | 17 | Olive Garden | 4 | |
| Brooks Brothers | 1 | Outback | 7 | |
| Brookstone | 4 | Outback Steakhouse | 7 | |
| Budget Car Rental | 1 | Pac Sun | 4 | |
| Buffalo Wild Wings | 3 | Panda Express | 5 | |
| Burger King | 34 | Panera Bread | 9 | |
| Buybuy BABY | 1 | Papa John's Pizza | 14 | |
| CVS | 39 | Payless | 17 | |
| Cache | 4 | Penske | 9 | |
| Casual Male XL | 2 | PetSmart | 6 | |
| Catherines | 2 | Pier 1 Imports | 5 | |
| Charlotte Russe | 3 | Pizza Hut | 25 | |
| Chevrolet | 4 | Plato's Closet | 3 | |
| Chick-Fil-A | 15 | Popeyes | 11 | |
| Chico's | 3 | Pottery Barn | 2 | |
| Chipotle | 4 | Pottery Barn Kids | 1 | |
| Chuck E. Cheese's | 2 | Publix Super Markets | 41 | |
| Church's Chicken | 6 | Qdoba Mexican Grill | 4 | |
| Cinnabon | 1 | Quality | 1 | |
| Circle K | 49 | Quiznos | 6 | |
| Clarion | 1 | RadioShack | 21 | |
| Clarks | 2 | Ramada | 2 | |
| Cold Stone Creamery | 8 | Red Lobster | 4 | |
| Coldwater Creek | 2 | Red Robin | 1 | |
| ColorTyme | 1 | Red Roof Inn | 3 | |
| Comfort Inn | 3 | Rodeway Inn | 1 | |
| Comfort Suites | 3 | Rooms To Go | 4 | |
| Costco | 1 | Ruby Tuesday | 6 | |
| Cracker Barrel | 4 | Rue21 | 1 | |
| Crate & Barrel | 1 | Ryder Rental & Truck Leasing | 2 | |
| Curves | 6 | SAS Shoes | 3 | |
| DHL | 11 | SONIC Drive-In | 10 | |
| Dairy Queen | 10 | Saks Fifth Avenue | 1 | |
| Days Inn | 6 | Sam's Club | 4 | |
| Decora Cabinetry | 15 | Sears | 13 | |
| Dennys | 9 | Sephora | 2 | |
| Domino's Pizza | 17 | Sheraton | 2 | |
| DressBarn | 2 | Shoe Carnival | 2 | |
| Dressbarn | 1 | Skechers USA | 2 | |
| Dunkin Donuts | 38 | Sleep Inn | 1 | |
| Econo Lodge | 1 | Soma Intimates | 2 | |
| Eddie Bauer | 1 | Spencer Gifts | 3 | |
| Ethan Allen | 2 | Sprint Nextel | 10 | |
| Express | 4 | Staples | 7 | |
| Extended Stay America | 2 | Starbucks | 45 | |
| Extended Stay Deluxe | 2 | Steak 'n Shake | 10 | |
| Famous Footwear | 2 | Subaru | 2 | |
| Fashion Bug | 1 | Suburban | 1 | |
| FedEx | 208 | Subway | 96 | |
| Finish Line | 4 | Super 8 | 1 | |
| Firestone Complete Auto Care | 14 | T-Mobile | 47 | |
| Foot Locker | 4 | T.G.I. Driday's | 5 | |
| Ford | 6 | T.J.Maxx | 3 | |
| Forever 21 | 2 | Taco Bell | 26 | |
| Fredericks Of Hollywood | 3 | Talbots | 1 | |
| GNC | 19 | Target | 9 | |
| GameStop | 16 | The Athlete's Foot | 2 | |
| Gap | 2 | The Cheesecake Factory | 2 | |
| Goodwill | 6 | The Limited | 3 | |
| Gymboree | 4 | The Room Place | 6 | |
| H&R Block | 34 | Tire Kingdom | 12 | |
| Haagen-Dazs | 2 | Torrid | 1 | |
| Hardee's | 4 | Toyota | 3 | |
| Havertys Furniture | 2 | Toys"R"Us | 5 | |
| Haworth | 1 | True Value | 1 | |
| Hilton | 15 | U-Haul | 86 | |
| Holiday Inn | 13 | UPS | 234 | |
| Hollister Co. | 3 | Urban Outfitters | 1 | |
| Home Depot | 10 | Value City Furniture | 2 | |
| Homestead Studio Suites | 2 | Vans | 10 | |
| Honda | 3 | Verizon Wireless | 10 | |
| Hot Topic | 3 | Victoria's Secret | 5 | |
| Howard Johnson | 5 | Village Inn | 6 | |
| Hyundai | 2 | Volkswagen | 3 | |
| IHOP | 7 | Waffle House | 7 | |
| IKEA | 1 | Walgreens | 39 | |
| InTown Suites | 1 | Walmart | 19 | |
| J. Jill | 1 | Westin | 2 | |
| J.Crew | 1 | Wet Seal | 3 | |
| JCPenney | 3 | Whole Foods Market | 1 | |
| Jamba Juice | 1 | Wingate | 2 | |
| Jimmy John's | 15 | YMCA | 15 | |
| JoS. A. Bank | 1 | Z Gallerie | 1 | |
| Johnny Rockets | 1 | |||
Hillsborough County on our top lists:
- #3 on the list of "Top 101 counties with the largest number of people moving in compared to moving out (pop. 50,000+)"
- #16 on the list of "Top 101 counties with the most Evangelical Protestant congregations (pop. 50,000+)"
- #16 on the list of "Top 101 counties with the most Evangelical Protestant congregations"
- #17 on the list of "Top 101 counties with the most Evangelical Protestant adherents (pop. 50,000+)"
- #17 on the list of "Top 101 counties with the most Evangelical Protestant adherents"
- #22 on the list of "Top 101 counties with the highest percentage of residents relocating from other counties between 2010 and 2011 (pop. 50,000+)"
- #27 on the list of "Top 101 counties with the highest ground withdrawal of fresh water for public supply"
- #27 on the list of "Top 101 counties with the highest ground withdrawal of fresh water for public supply (pop. 50,000+)"
- #36 on the list of "Top 101 counties with the highest number of infant deaths per 1000 residents 2007-2013 (pop. 50,000+)"
- #40 on the list of "Top 101 counties with the most Black Protestant congregations"
- #40 on the list of "Top 101 counties with the most Black Protestant congregations (pop. 50,000+)"
- #45 on the list of "Top 101 counties with the lowest percentage of residents that visited a dentist within the past year"
- #46 on the list of "Top 101 counties with the highest total withdrawal of fresh water for public supply (pop. 50,000+)"
- #47 on the list of "Top 101 counties with the highest total withdrawal of fresh water for public supply"
- #47 on the list of "Top 101 counties with the most Other adherents"
- #47 on the list of "Top 101 counties with the most Other adherents (pop. 50,000+)"
- #48 on the list of "Top 101 counties with the most Black Protestant adherents (pop. 50,000+)"
- #48 on the list of "Top 101 counties with the most Black Protestant adherents"
- #54 on the list of "Top 101 counties with the most Other congregations (pop. 50,000+)"
- #56 on the list of "Top 101 counties with the largest decrease in the number of deaths per 1000 residents 2000-2006 to 2007-2013 (pop. 50,000+)"