Hernando County, Florida (FL)
County owner-occupied free and clear houses and condos in 2010: 22,938
County owner-occupied houses and condos in 2000: 47,954
Renter-occupied apartments: 13,971 (it was 7,471 in 2000)
| % of renters here: | 13% |
| State: | 33% |
Land area: 478 sq. mi.
Water area: 110.8 sq. mi.
Population density: 433 people per square mile (high).
Industries providing employment: Educational, health and social services (22.9%), Retail trade (13.6%), Professional, scientific, management, administrative, and waste management services (12.9%).
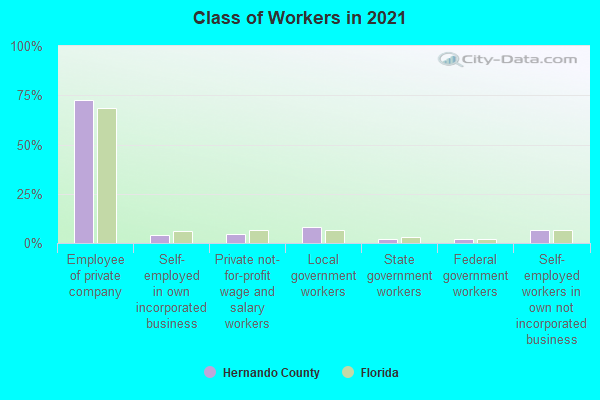
Type of workers:
- Private wage or salary: 80%
- Government: 13%
- Self-employed, not incorporated: 6%
- Unpaid family work: 0%
- OSM Map
- General Map
- Google Map
- MSN Map

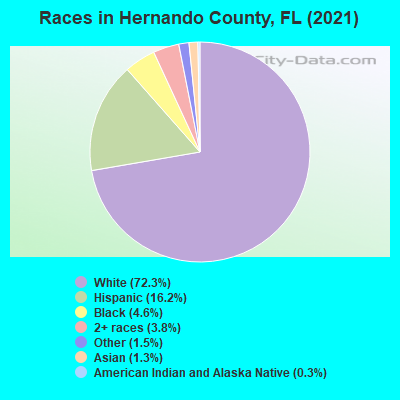
- 148,53571.8%White Non-Hispanic Alone
- 35,31917.1%Hispanic or Latino
- 11,0515.3%Black Non-Hispanic Alone
- 6,9393.4%Two or more races
- 3,0981.5%Asian alone
- 1,2100.6%Some other race alone
- 4310.2%Native Hawaiian and Other
Pacific Islander alone - 3130.2%American Indian and Alaska Native alone
| Median resident age: | 47.3 years |
| Florida median age: | 42.7 years |
| Males: 100,924 | |
| Females: 105,972 |

 | Irma! Are you prepared for this storm that seems to be heading out way! (666 replies) |
| Opinions from teachers needed (4 replies) |
| School Grades for Hernando County (21 replies) |
| Canines & FIRE ANTS?! (13 replies) |
| Commute from Seminole to Brooksville? (14 replies) |
| PLEASE stop moving here! (150 replies) |
| Hernando County: | 2.0 people |
| Florida: | 2 people |
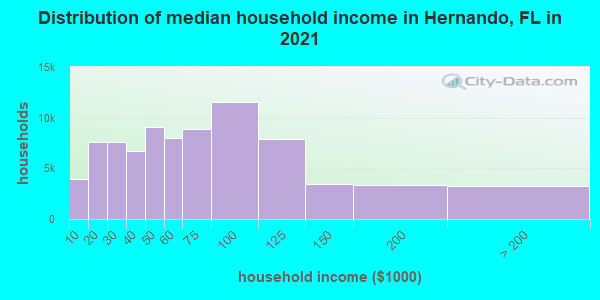
Estimated median household income in 2022: $61,462 ($32,572 in 1999)
| This county: | $61,462 |
| Florida: | $69,303 |
Median contract rent in 2022 for apartments: $986 (lower quartile is $806, upper quartile is $1,334)
| This county: | $986 |
| State: | $1367 |
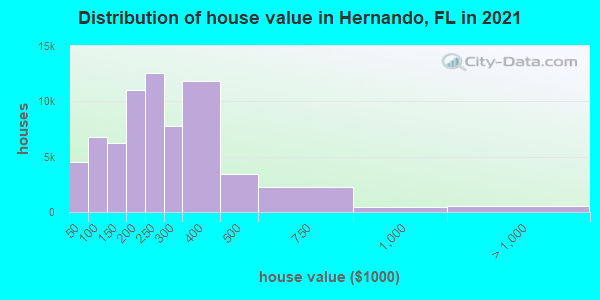
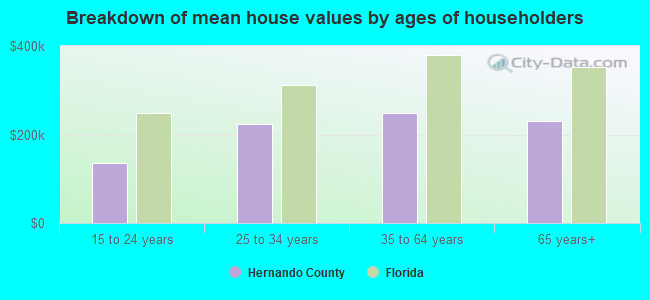
Estimated median house or condo value in 2022: $277,100 (it was $79,700 in 2000)
| Hernando: | $277,100 |
| Florida: | $354,100 |
Mean price in 2022:
Median monthly housing costs for homes and condos with a mortgage: $1,312Detached houses: $301,443
Here: $301,443 State: $500,941 Townhouses or other attached units: $228,040
Here: $228,040 State: $370,869 In 2-unit structures: $129,925
Here: $129,925 State: $423,188 In 3-to-4-unit structures: $165,462
Here: $165,462 State: $309,944 In 5-or-more-unit structures: $265,450
Here: $265,450 State: $447,145 Mobile homes: $137,998
Here: $137,998 State: $113,202 Occupied boats, RVs, vans, etc.: $73,313
Here: $73,313 State: $73,933
Median monthly housing costs for units without a mortgage: $416
Institutionalized population: 1,530
Crime in 2020 (reported by the sheriff's office or county police, not the county total):
- Murders: 7
- Rapes: 51
- Robberies: 49
- Assaults: 333
- Burglaries: 342
- Thefts: 1560
- Auto thefts: 156
Crime in 2019 (reported by the sheriff's office or county police, not the county total):
- Murders: 6
- Rapes: 58
- Robberies: 43
- Assaults: 358
- Burglaries: 397
- Thefts: 1690
- Auto thefts: 171
Health of residents in Hernando County based on CDC Behavioral Risk Factor Surveillance System Survey Questionnaires from 2013 to 2021:
General health status score of residents in this county from 1 (poor) to 5 (excellent) is 3.4. This is about average.69.9% of residents exercised in the past month. This is less than average.
50.3% of residents smoked 100+ cigarettes in their lives. This is about average.
54.1% of adult residents drank alcohol in the past 30 days. This is less than average.
61.9% of residents visited a dentist within the past year. This is less than average.
Average weight of males is 196 pounds. This is about average.
Average weight of females is 160 pounds. This is about average.
Health of residents in Hernando County based on CDC Behavioral Risk Factor Surveillance System Survey Questionnaires from 2003 to 2012:
General health status score of residents in this county from 1 (poor) to 5 (excellent) is 3.3. This is worse than average.71.8% of residents exercised in the past month. This is about average.
55.6% of residents smoked 100+ cigarettes in their lives. This is more than average.
99.6% of adult residents drank alcohol in the past 30 days. This is more than average.
58.0% of residents visited a dentist within the past year. This is less than average.
Average weight of males is 199 pounds. This is more than average.
Average weight of females is 160 pounds. This is about average.
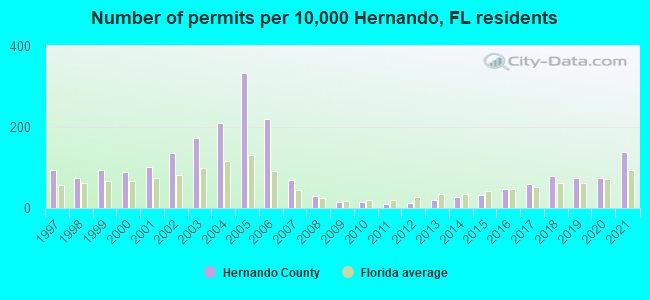
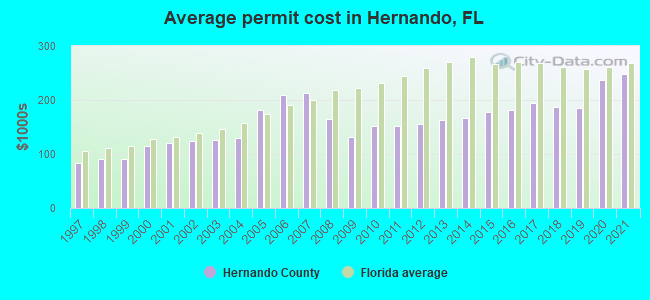
Single-family new house construction building permits:
- 2022: 1320 buildings, average cost: $272,900
- 2021: 1819 buildings, average cost: $248,900
- 2020: 984 buildings, average cost: $236,800
- 2019: 985 buildings, average cost: $184,500
- 2018: 1024 buildings, average cost: $187,100
- 2017: 781 buildings, average cost: $194,800
- 2016: 627 buildings, average cost: $181,800
- 2015: 426 buildings, average cost: $176,700
- 2014: 336 buildings, average cost: $165,900
- 2013: 249 buildings, average cost: $162,500
- 2012: 168 buildings, average cost: $154,800
- 2011: 135 buildings, average cost: $150,500
- 2010: 182 buildings, average cost: $151,700
- 2009: 194 buildings, average cost: $132,400
- 2008: 383 buildings, average cost: $165,200
- 2007: 910 buildings, average cost: $213,000
- 2006: 2862 buildings, average cost: $209,100
- 2005: 4374 buildings, average cost: $180,600
- 2004: 2762 buildings, average cost: $129,500
- 2003: 2272 buildings, average cost: $126,000
- 2002: 1779 buildings, average cost: $124,300
- 2001: 1336 buildings, average cost: $121,200
- 2000: 1150 buildings, average cost: $114,000
- 1999: 1217 buildings, average cost: $90,700
- 1998: 961 buildings, average cost: $89,600
- 1997: 1210 buildings, average cost: $83,300
Median real estate property taxes paid for housing units with mortgages in 2022: $1,955 (0.7%)
Median real estate property taxes paid for housing units with no mortgage in 2022: $1,432 (0.6%)

| Hernando County: | 11.8% |
| Florida: | 12.7% |
Median age of residents in 2022: 47.3 years old
(Males: 45.8 years old, Females: 49.3 years old)
(Median age for: White residents: 53.0 years old, Black residents: 34.7 years old, American Indian residents: 57.7 years old, Asian residents: 45.6 years old, Hispanic or Latino residents: 36.9 years old, Other race residents: 36.5 years old)
Area name: Tampa-St. Petersburg-Clearwater, FL MSA
Fair market rent in 2006 for a 1-bedroom apartment in Hernando County is $649 a month.
Fair market rent for a 2-bedroom apartment is $785 a month.
Fair market rent for a 3-bedroom apartment is $995 a month.
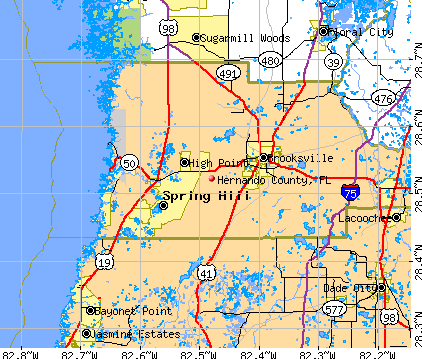
Cities in this county include: Spring Hill, Brooksville, Timber Pines, North Weeki Wachee, Ridge Manor, Brookridge, Hernando Beach, North Brooksville, Hill 'n Dale, South Brooksville.
| Zip Code | City | Certified Residential Database | Mandatory Residential Database | Mandatory Non-Residential Database | |||
|---|---|---|---|---|---|---|---|
| Buildings Measured | Above 4 pCi/L (%) | Buildings Measured | Above 4 pCi/L (%) | Buildings Measured | Above 4 pCi/L (%) | ||
| 34601 | Brooksville | 16 | 6 | 1 | 0 | 1 | 0 |
| 34602 | Brooksville | 9 | 22 | 5 | 0 | 5 | 0 |
| 34606 | Spring Hill | 19 | 5 | - | - | - | - |
| 34607 | Spring Hill | 5 | 0 | - | - | - | - |
| 34608 | Spring Hill | 20 | 0 | - | - | - | - |
| 34609 | Spring Hill | 23 | 0 | - | - | - | - |
| 34613 | Brooksville | 4 | 0 | - | - | - | - |
| 34614 | Brooksville | 1 | 0 | - | - | - | - |
Neighboring counties: Calhoun County, Texas  , Dimmit County, Texas , Frio County, Texas , Victoria County, Texas , Zavala County, Texas .
| Here: | 3.9% |
| Florida: | 2.9% |
Current college students: 3,490
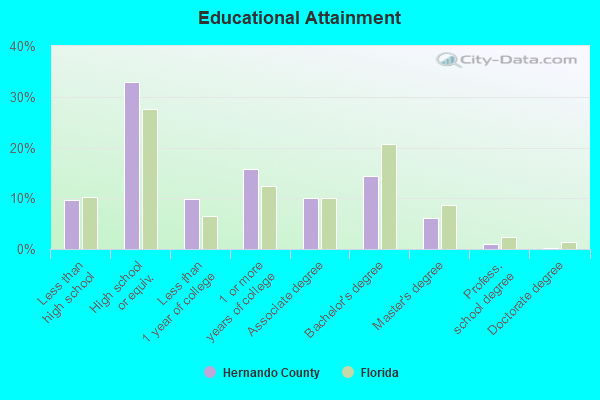
People 25 years of age or older with a high school degree or higher: 91.5%
People 25 years of age or older with a bachelor's degree or higher: 21.4%
Number of foreign born residents: 18,421 (65.9% naturalized citizens)
| Hernando County: | 8.9% |
| Whole state: | 21.7% |
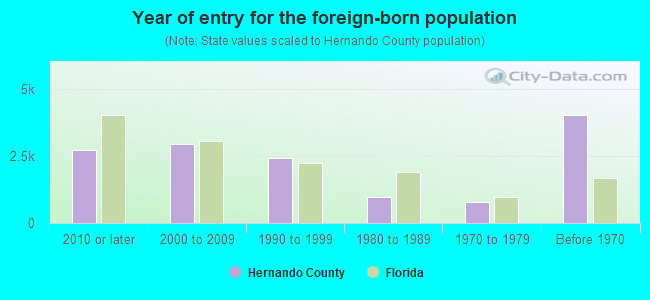
- Year of entry for the foreign-born population
- 4,4022010 or later
- 2,6462000 to 2009
- 2,6561990 to 1999
- 9541980 to 1989
- 7931970 to 1979
- 4,020Before 1970
Mean travel time to work (commute): minutes
Percentage of county residents living and working in this county: 99.2%
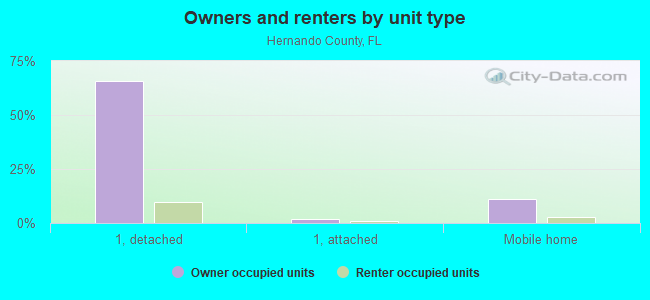
Housing units in structures:
- One, detached: 68,633
- One, attached: 2,104
- Two: 919
- 3 or 4: 1,301
- 5 to 9: 1,565
- 10 to 19: 537
- 20 to 49: 263
- 50 or more: 1,091
- Mobile homes: 15,836
- Boats, RVs, vans, etc.: 208
Housing units in Hernando County with a mortgage: 35,596 (2,737 second mortgage, 0 home equity loan, 2,120 both second mortgage and home equity loan)
Houses without a mortgage: 722
| Here: | 4.6% with mortgage |
| State: | 97.6% with mortgage |
Religion statistics for Hernando County
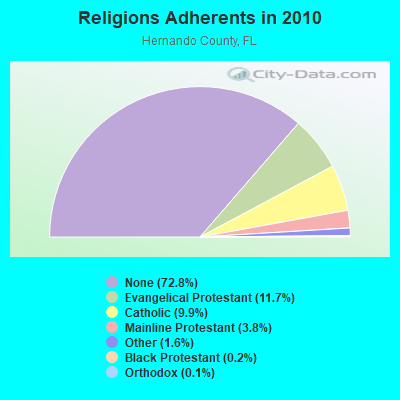
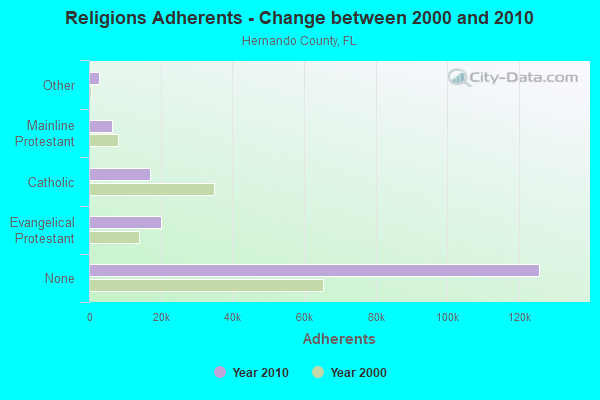
| Religion | Adherents | Congregations |
|---|---|---|
| Evangelical Protestant | 20,205 | 79 |
| Catholic | 17,068 | 7 |
| Mainline Protestant | 6,482 | 19 |
| Other | 2,774 | 9 |
| Black Protestant | 293 | 3 |
| Orthodox | 235 | 3 |
| None | 125,721 | - |
Source: Clifford Grammich, Kirk Hadaway, Richard Houseal, Dale E.Jones, Alexei Krindatch, Richie Stanley and Richard H.Taylor. 2012. 2010 U.S.Religion Census: Religious Congregations & Membership Study. Association of Statisticians of American Religious Bodies. Jones, Dale E., et al. 2002. Congregations and Membership in the United States 2000. Nashville, TN: Glenmary Research Center.
Food Environment Statistics:
| Hernando County: | 1.30 / 10,000 pop. |
| State: | 2.04 / 10,000 pop. |
| Here: | 0.18 / 10,000 pop. |
| Florida: | 0.11 / 10,000 pop. |
| This county: | 0.83 / 10,000 pop. |
| Florida: | 1.28 / 10,000 pop. |
| Hernando County: | 2.43 / 10,000 pop. |
| Florida: | 3.04 / 10,000 pop. |
| This county: | 5.45 / 10,000 pop. |
| State: | 7.45 / 10,000 pop. |
| Hernando County: | 11.1% |
| Florida: | 9.2% |
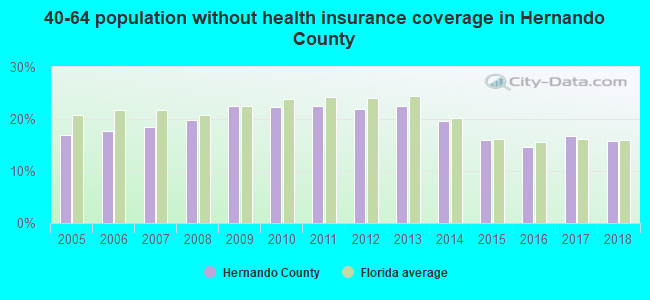
| Hernando County: | 25.4% |
| State: | 23.7% |
| Here: | 14.7% |
| State: | 14.0% |
Agriculture in Hernando County:
Average size of farms: 106 acresAverage value of agricultural products sold per farm: $35,183
Average value of crops sold per acre for harvested cropland: $673.51
The value of nursery, greenhouse, floriculture, and sod as a percentage of the total market value of agricultural products sold: 26.82%
The value of livestock, poultry, and their products as a percentage of the total market value of agricultural products sold: 62.34%
Average total farm production expenses per farm: $33,031
Harvested cropland as a percentage of land in farms: 18.59%
Irrigated harvested cropland as a percentage of land in farms: 10.57%
Average market value of all machinery and equipment per farm: $51,371
The percentage of farms operated by a family or individual: 90.76%
Average age of principal farm operators: 57 years
Average number of cattle and calves per 100 acres of all land in farms: 26.91
Milk cows as a percentage of all cattle and calves: 13.13%
Vegetables: 144 harvested acres
Land in orchards: 1,143 acres
Earthquake activity:
Hernando County-area historical earthquake activity is significantly above Florida state average. It is 87% smaller than the overall U.S. average.On 9/10/2006 at 14:56:08, a magnitude 5.9 (5.9 MB, 5.5 MS, 5.8 MW, Class: Moderate, Intensity: VI - VII) earthquake occurred 299.3 miles away from Hernando County center
On 10/24/1997 at 08:35:17, a magnitude 4.9 (4.8 MB, 4.2 MS, 4.9 LG, Depth: 6.2 mi, Class: Light, Intensity: IV - V) earthquake occurred 339.1 miles away from the county center
On 11/22/1974 at 05:25:55, a magnitude 4.7 (4.7 MB) earthquake occurred 333.2 miles away from the county center
On 8/2/1974 at 08:52:09, a magnitude 4.9 (4.3 MB, 4.9 LG) earthquake occurred 370.1 miles away from the county center
On 9/4/2016 at 18:29:29, a magnitude 3.8 (3.8 ML, Class: Light, Intensity: II - III) earthquake occurred 208.0 miles away from Hernando County center
On 9/21/2016 at 16:30:52, a magnitude 3.8 (3.8 ML) earthquake occurred 209.2 miles away from the county center
Magnitude types: regional Lg-wave magnitude (LG), body-wave magnitude (MB), local magnitude (ML), surface-wave magnitude (MS), moment magnitude (MW)
Most recent natural disasters:
- Florida Covid-19 Pandemic, Incident Period: January 20, 2020, FEMA Id: 4486, Natural disaster type: Other
- Florida Hurricane Irma, Incident Period: September 4, 2017 - October 18, 2017, FEMA Id: 4337, Natural disaster type: Hurricane
- Florida Hurricane Matthew, Incident Period: October 03, 2016 to October 19, 2016, Emergency Declared EM-3377: October 06, 2016, FEMA Id: 3377, Natural disaster type: Hurricane
- Florida Hurricane Hermine, Incident Period: August 31, 2016 to September 11, 2016, Major Disaster (Presidential) Declared DR-4280: September 28, 2016, FEMA Id: 4280, Natural disaster type: Hurricane
- Florida Tropical Storm Debby, Incident Period: June 23, 2012 to July 26, 2012, Major Disaster (Presidential) Declared DR-4068: July 03, 2012, FEMA Id: 4068, Natural disaster type: Tropical Storm
- Florida Tropical Storm Fay, Incident Period: August 18, 2008 to September 12, 2008, Emergency Declared EM-3288: August 21, 2008, FEMA Id: 3288, Natural disaster type: Tropical Storm
- Florida Hurricane Katrina Evacuation, Incident Period: August 29, 2005 to October 01, 2005, Emergency Declared EM-3220: September 05, 2005, FEMA Id: 3220, Natural disaster type: Hurricane
- Florida Hurricane Jeanne, Incident Period: September 24, 2004 to November 17, 2004, Major Disaster (Presidential) Declared DR-1561: September 26, 2004, FEMA Id: 1561, Natural disaster type: Hurricane
- Florida Hurricane Frances, Incident Period: September 03, 2004 to October 08, 2004, Major Disaster (Presidential) Declared DR-1545: September 04, 2004, FEMA Id: 1545, Natural disaster type: Hurricane
- Florida Hurricane Charley and Tropical Storm Bonnie, Incident Period: August 11, 2004 to August 30, 2004, Major Disaster (Presidential) Declared DR-1539: August 13, 2004, FEMA Id: 1539, Natural disaster type: Tropical Storm, Hurricane
- 9 other natural disasters have been reported since 1953.
The number of natural disasters in Hernando County (19) is greater than the US average (15).
Major Disasters (Presidential) Declared: 12
Emergencies Declared: 4
Causes of natural disasters: Hurricanes: 9, Floods: 4, Storms: 3, Tropical Storms: 3, Fires: 2, Tornadoes: 2, Freeze: 1, Wind: 1, Other: 1 (Note: some incidents may be assigned to more than one category).
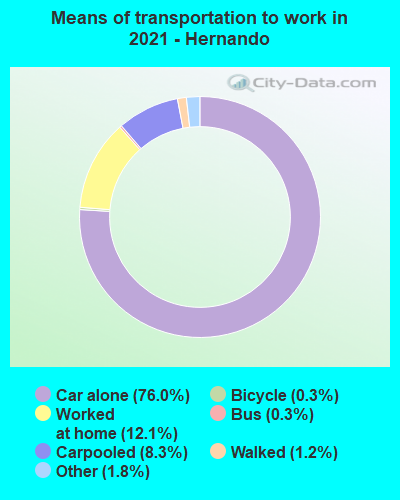
Means of transportation to work:
- Drove a car alone: 42,437 (68.2%)
- Carpooled: 5,005 (8.0%)
- Bus: 282 (0.5%)
- Taxicab, motorcycle, or other means: 1,382 (2.2%)
- Bicycle: 232 (0.4%)
- Walked: 847 (1.4%)
- Worked at home: 12,804 (20.6%)
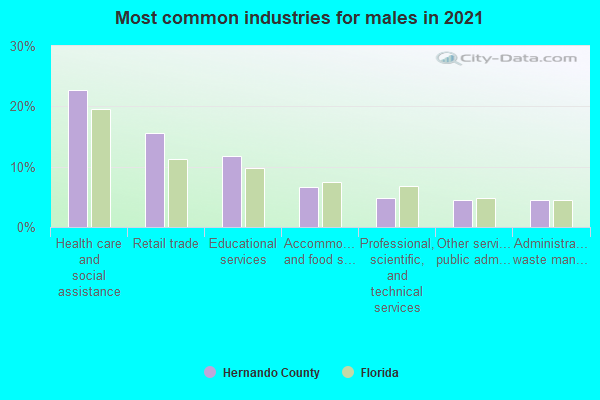
- Health care and social assistance (24%)
- Retail trade (13%)
- Educational services (10%)
- Professional, scientific, and technical services (9%)
- Accommodation and food services (6%)
- Manufacturing (5%)
- Administrative and support and waste management services (5%)
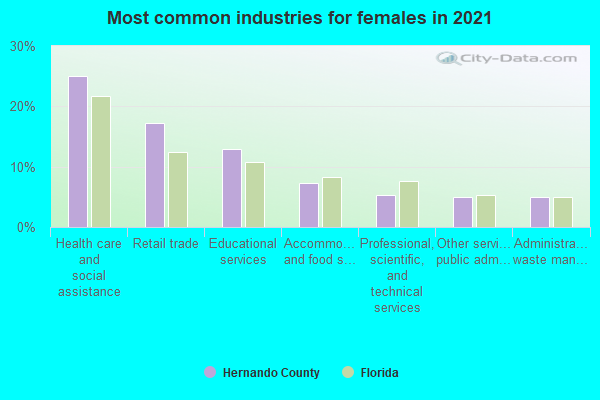
- Health care and social assistance (26%)
- Retail trade (14%)
- Educational services (11%)
- Professional, scientific, and technical services (9%)
- Accommodation and food services (7%)
- Manufacturing (5%)
- Administrative and support and waste management services (5%)
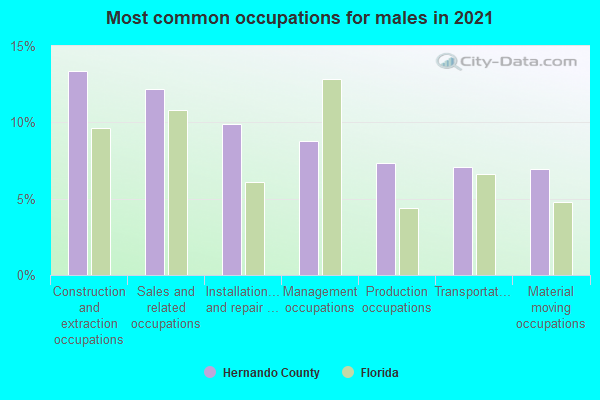
- Management occupations (12%)
- Construction and extraction occupations (11%)
- Transportation occupations (11%)
- Sales and related occupations (9%)
- Office and administrative support occupations (7%)
- Production occupations (6%)
- Installation, maintenance, and repair occupations (5%)
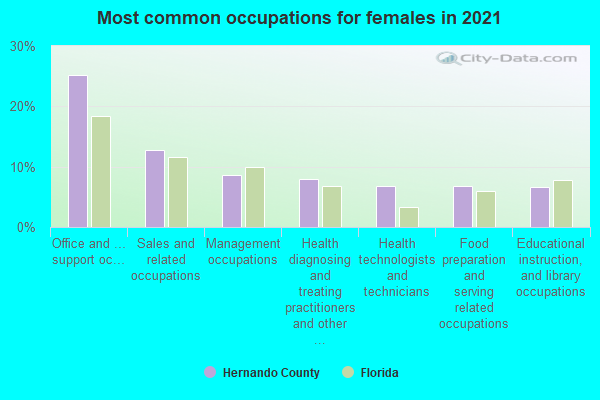
- Office and administrative support occupations (20%)
- Sales and related occupations (11%)
- Management occupations (9%)
- Health diagnosing and treating practitioners and other technical occupations (9%)
- Healthcare support occupations (7%)
- Business and financial operations occupations (7%)
- Educational instruction, and library occupations (6%)
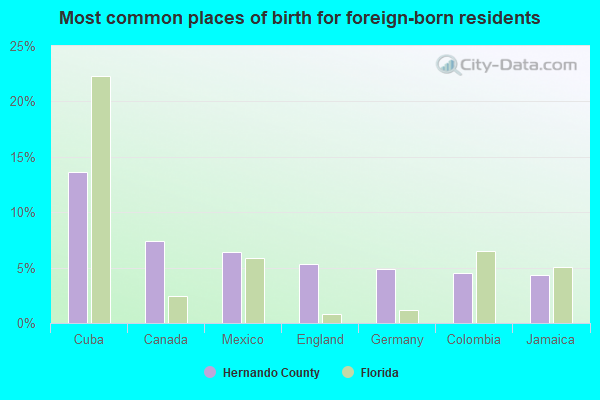
- Cuba (12%)
- Canada (10%)
- England (5%)
- Mexico (5%)
- Colombia (5%)
- Germany (5%)
- Jamaica (4%)
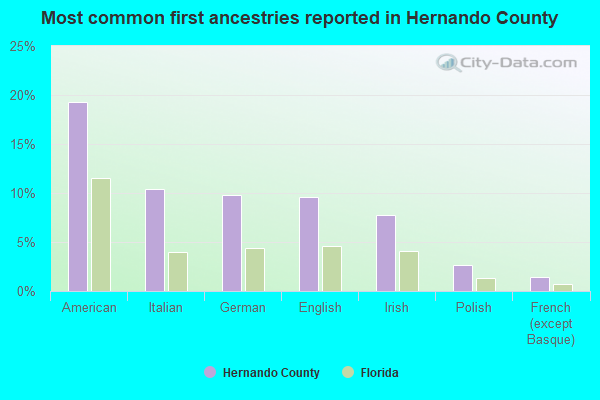
- American (16%)
- Italian (11%)
- English (10%)
- German (9%)
- Irish (8%)
- Polish (3%)
- Scottish (2%)
People in group quarters in Hernando County, Florida in 2010:
- 520 people in local jails and other municipal confinement facilities
- 492 people in nursing facilities/skilled-nursing facilities
- 424 people in state prisons
- 216 people in group homes intended for adults
- 48 people in correctional facilities intended for juveniles
- 29 people in emergency and transitional shelters (with sleeping facilities) for people experiencing homelessness
- 24 people in workers' group living quarters and job corps centers
- 22 people in in-patient hospice facilities
- 20 people in residential treatment centers for juveniles (non-correctional)
- 16 people in residential treatment centers for adults
- 13 people in other noninstitutional facilities
- 4 people in correctional residential facilities
People in group quarters in Hernando County, Florida in 2000:
- 744 people in nursing homes
- 447 people in state prisons
- 336 people in other noninstitutional group quarters
- 324 people in local jails and other confinement facilities (including police lockups)
- 140 people in other group homes
- 55 people in residential treatment centers for emotionally disturbed children
- 47 people in homes for abused, dependent, and neglected children
- 15 people in unknown juvenile institutions
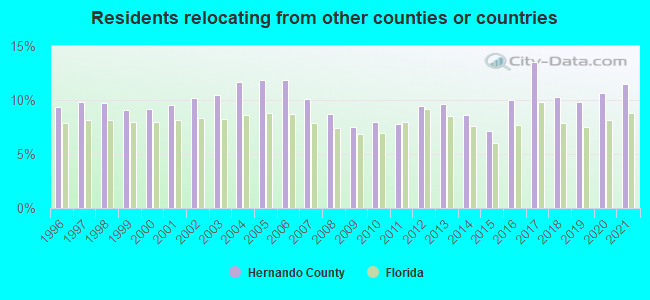
11.48% of this county's 2021 resident taxpayers lived in other counties in 2020 ($55,231 average adjusted gross income)
| Here: | 11.48% |
| Florida average: | 8.80% |
0.03% of residents moved from foreign countries ($131 average AGI)
Hernando County: 0.03% Florida average: 0.05%
6.76% relocated from other counties in Florida ($28,327 average AGI)
4.69% relocated from other states ($26,773 average AGI)
Hernando County: 4.69% Florida average: 4.38%
Top counties from which taxpayers relocated into this county between 2020 and 2021:
| from Pasco County, FL | |
| from Hillsborough County, FL | |
| from Pinellas County, FL | |
| from Citrus County, FL | |
| from Miami-Dade County, FL | |
| from Polk County, FL | |
| from Suffolk County, NY |
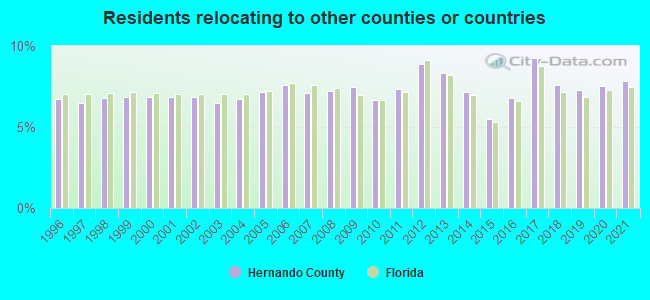
7.84% of this county's 2020 resident taxpayers moved to other counties in 2021 ($43,637 average adjusted gross income)
| Here: | 7.84% |
| Florida average: | 7.45% |
0.03% of residents moved to foreign countries ($160 average AGI)
Hernando County: 0.03% Florida average: 0.04%
4.88% relocated to other counties in Florida ($26,113 average AGI)
2.93% relocated to other states ($17,364 average AGI)
Hernando County: 2.93% Florida average: 2.97%
Top counties to which taxpayers relocated from this county between 2020 and 2021:
| to Pasco County, FL | |
| to Hillsborough County, FL | |
| to Citrus County, FL | |
| to Pinellas County, FL | |
| to Marion County, FL | |
| to Orange County, FL | |
| to Polk County, FL |
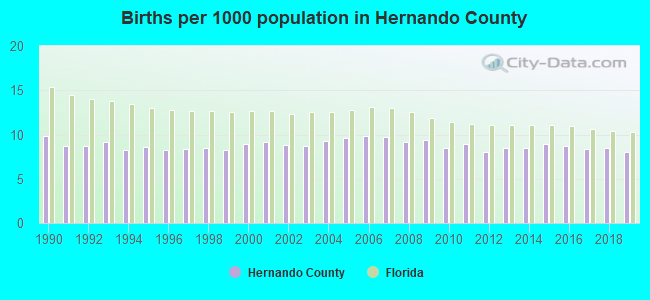
Births per 1000 population from 1990 to 1999: 8.7
Births per 1000 population from 2000 to 2009: 9.3
Births per 1000 population from 2010 to 2022: 7.1
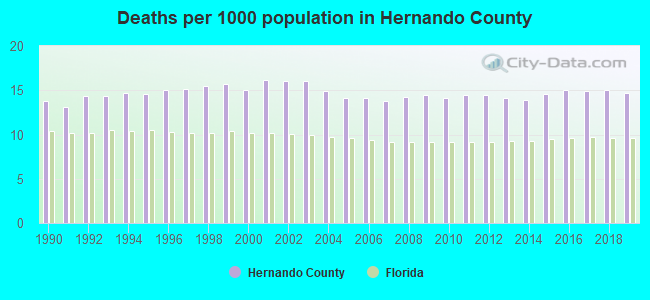
Deaths per 1000 population from 1990 to 1999: 14.6
Deaths per 1000 population from 2000 to 2009: 14.9
Deaths per 1000 population from 2010 to 2020: 14.7
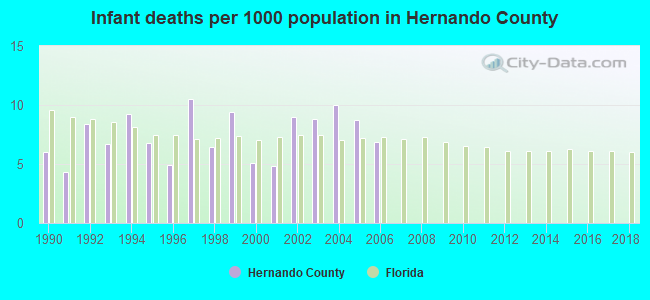
Infant deaths per 1000 live births from 1990 to 1999: 7.3
Infant deaths per 1000 live births from 2000 to 2006: 7.6
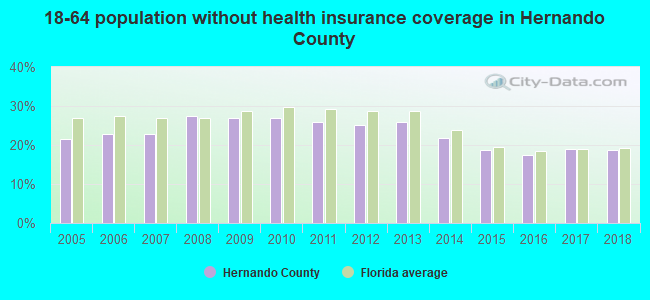
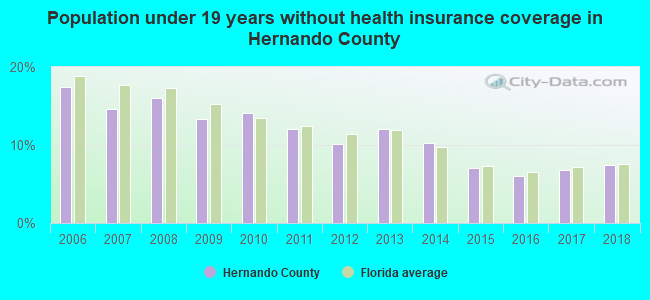
Persons under 19 years old without health insurance coverage in 2018: 7.5%
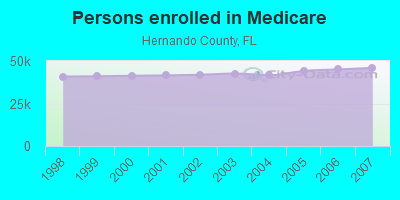
Persons enrolled in hospital insurance and/or supplemental medical insurance (Medicare) in July 1, 2007: 45,935 (39,128 aged, 6,807 disabled)
Children under 18 without health insurance coverage in 2007: 4,626 (14%)

Most common underlying causes of death in Hernando County, Florida in 1999 - 2019:
- Atherosclerotic heart disease (4,227)
- Bronchus or lung, unspecified - Malignant neoplasms (3,941)
- Chronic obstructive pulmonary disease, unspecified (3,197)
- Senility (2,346)
- Acute myocardial infarction, unspecified (2,065)
- Unspecified dementia (1,862)
- Stroke, not specified as haemorrhage or infarction (1,473)
- Alzheimer disease, unspecified (1,243)
- Atherosclerotic cardiovascular disease, so described (1,070)
- Ischaemic cardiomyopathy (958)
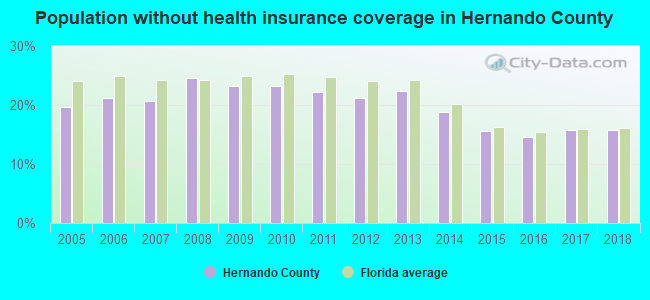
Population without health insurance coverage in 2000: 14%
Children under 18 without health insurance coverage in 2000: 14%
Short term general hospital admissions per 100,000 population in 2004: 14,875
Short term general hospital beds per 100,000 population in 2004: 253
Emergency room visits per 100,000 population in 2004: 37,513
General practice office based MDs per 100,000 population in 2005: 949
Medical specialist MDs per 100,000 population in 2005: 1,406
Dentists per 100,000 population in 1998: 7
Total births per 100,000 population, July 2005 - July 2006 : 21
Total deaths per 100,000 population, July 2005 - July 2006: 45
Limited-service eating places per 100,000 population in 2005 : 8
Homicides per 1,000,000 population from 2000 to 2006: 32.5. This is less than state average.
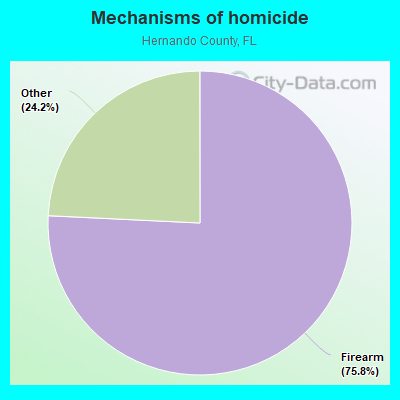
- Firearm - 24.7
- Other - 7.9
Suicides per 1,000,000 population from 2000 to 2006: 175.5. This is more than state average.
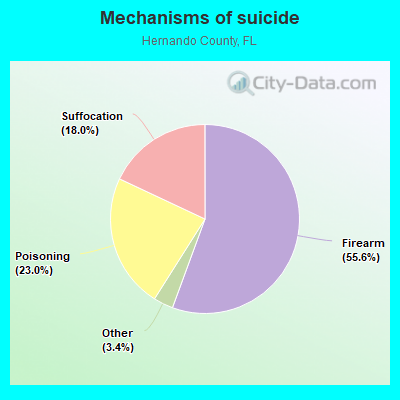
- Firearm - 97.6
- Poisoning - 40.4
- Suffocation - 31.6
- Other - 5.9
Household type by relationship:
Households: 206,896- Male householders: 38,230 (9,941 living alone), Female householders: 41,981 (10,968 living alone)
38,912 spouses (38,508 opposite-sex spouses), 6,109 unmarried partners, (6,109 opposite-sex unmarried partners), 54,210 children (48,918 natural, 3,544 adopted, 1,748 stepchildren), 5,091 grandchildren, 3,663 brothers or sisters, 3,167 parents, 138 foster children, 4,223 other relatives, 9,162 non-relatives
- In group quarters: 2,010
Size of family households: 28,333 2-persons, 9,946 3-persons, 8,585 4-persons, 4,396 5-persons, 1,220 6-persons, 727 7-or-more-persons.
Size of nonfamily households: 20,909 1-person, 4,679 2-persons, 1,133 3-persons, 56 4-persons, 227 6-persons.
19,979 married couples with children.
11,736 single-parent households (4,698 men, 7,038 women).
87.7% of residents of Hernando speak English at home.
9.2% of residents speak Spanish at home (68% speak English very well, 20% speak English well, 8% speak English not well, 4% don't speak English at all).
2.0% of residents speak other Indo-European language at home (67% speak English very well, 25% speak English well, 8% speak English not well, 1% don't speak English at all).
0.7% of residents speak Asian or Pacific Island language at home (58% speak English very well, 25% speak English well, 16% speak English not well, 1% don't speak English at all).
0.2% of residents speak other language at home (83% speak English very well, 17% speak English well).
In fiscal year 2004:
Federal Government expenditure: $1,094,871,000 ($7,281 per capita)
Department of Defense expenditure: $40,668,000
Federal direct payments to individuals for retirement and disability: $670,509,000
Federal other direct payments to individuals: $338,652,000
Federal direct payments not to individuals: $780,000
Federal grants: $57,120,000
Federal procurement contracts: $7,230,000 ($2,334,000 Department of Defense)
Federal salaries and wages: $20,579,000 ($604,000 Department of Defense)
Federal Government direct loans: $747,000
Federal guaranteed/insured loans: $99,655,000
Federal Government insurance: $529,994,000
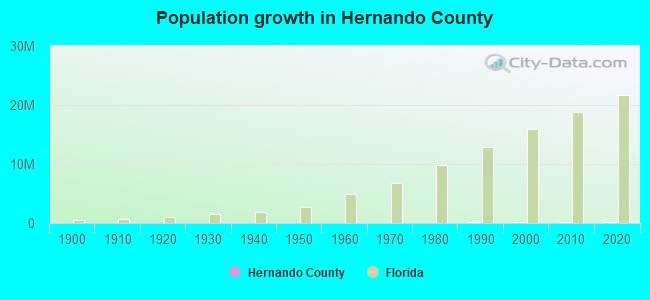
Population change from April 1, 2000 to July 1, 2005:
Births: 6,476| Here: | 41 per 1000 residents |
| State: | 63 per 1000 residents |
Deaths: 11,525
| Here: | 73 per 1000 residents |
| State: | 49 per 1000 residents |
Net international migration: +466
| Here: | +3 per 1000 residents |
| State: | +30 per 1000 residents |
Net internal migration: +32,533
| Here: | +205 per 1000 residents |
| State: | +59 per 1000 residents |
Total withdrawal of fresh water for public supply: 20.27 millions of gallons per day (100% from ground, 0% from surface)
| Here: | 6.0 |
| State: | 5.9 |
| Here: | 4.8 |
| State: | 4.2 |
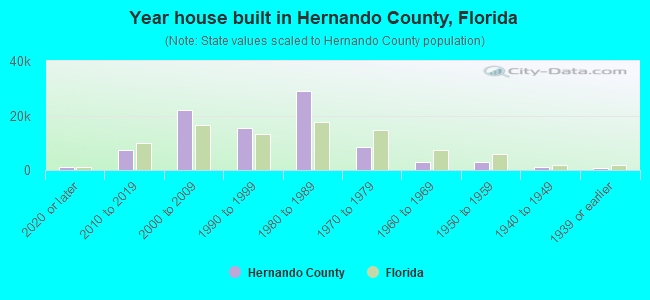
- Year house built in Hernando County, Florida
- 1,0192020 or later
- 8,0902010 to 2019
- 19,1492000 to 2009
- 14,8441990 to 1999
- 29,8191980 to 1989
- 14,5241970 to 1979
- 2,8631960 to 1969
- 1,5241950 to 1959
- 931940 to 1949
- 5321939 or earlier
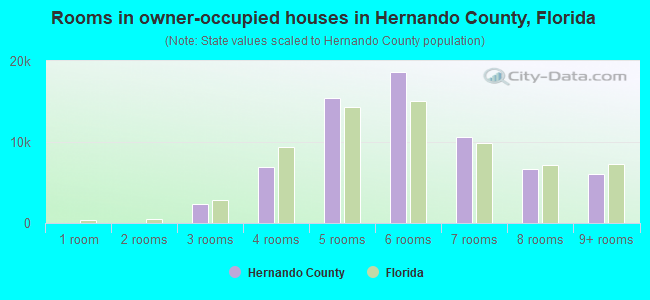
- Rooms in owner-occupied houses in Hernando County, Florida
- 01 room
- 1212 rooms
- 1,7603 rooms
- 8,9744 rooms
- 13,8665 rooms
- 17,5406 rooms
- 10,1807 rooms
- 6,6498 rooms
- 6,5779+ rooms
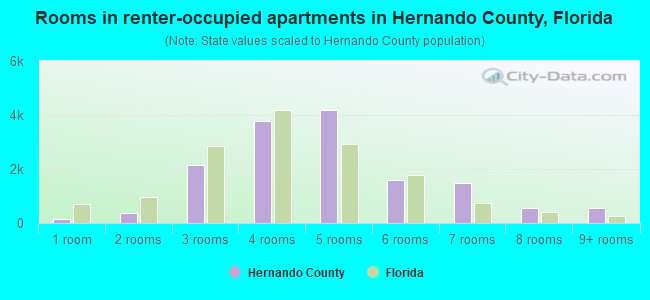
- Rooms in renter-occupied apartments in Hernando County, Florida
- 4031 room
- 4522 rooms
- 1,5373 rooms
- 3,3874 rooms
- 4,4035 rooms
- 2,5216 rooms
- 1,3747 rooms
- 1418 rooms
- 3269+ rooms
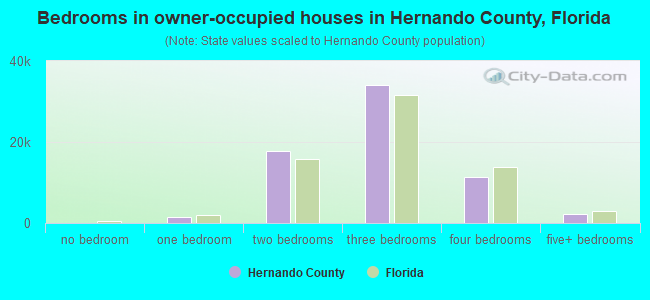
- Bedrooms in owner-occupied houses in Hernando County, Florida
- 81no bedroom
- 7401 bedroom
- 18,8372 bedrooms
- 35,9313 bedrooms
- 9,1984 bedrooms
- 8805+ bedrooms
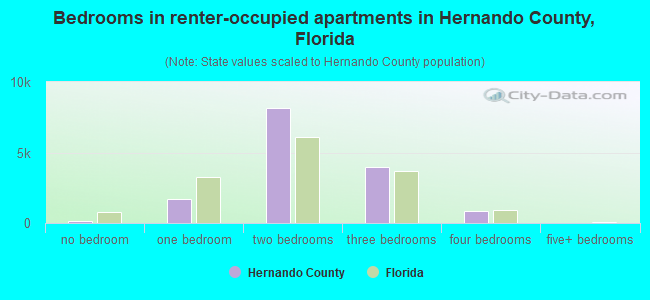
- Bedrooms in renter-occupied apartments in Hernando County, Florida
- 403no bedroom
- 1,2931 bedroom
- 7,5012 bedrooms
- 3,1043 bedrooms
- 2,2434 bedrooms
- 05+ bedrooms
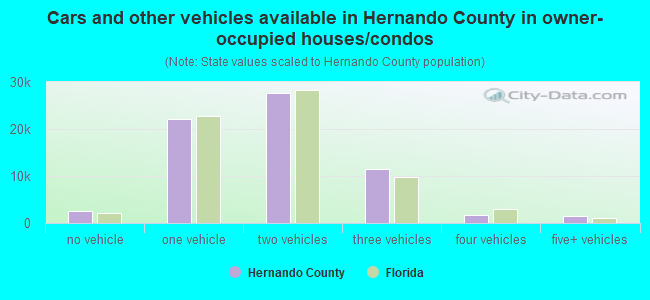
- Cars and other vehicles available in Hernando County in owner-occupied houses/condos
- 2,186no vehicle
- 26,1481 vehicle
- 24,2532 vehicles
- 9,0613 vehicles
- 2,7174 vehicles
- 1,3025+ vehicles
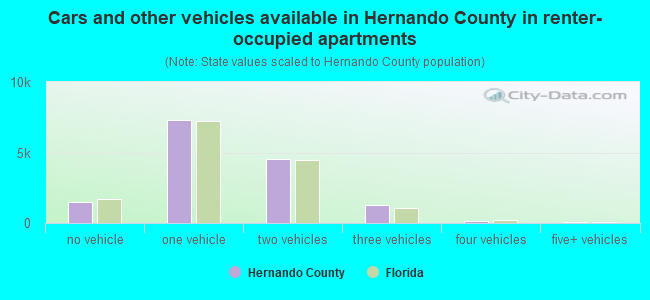
- Cars and other vehicles available in Hernando County in renter-occupied apartments
- 1,315no vehicle
- 6,3921 vehicle
- 5,2862 vehicles
- 7003 vehicles
- 8514 vehicles
- 05+ vehicles
87.7% of Hernando County residents lived in the same house 1 years ago.
Out of people who lived in different houses, 21% lived in this county.
Out of people who lived in different counties, 56% lived in Florida.
| Hernando County: | 87.7% |
| State average: | 86.3% |
Place of birth for U.S.-born residents:
- This state: 68,589
- Other state: 112,982
- Northeast: 57,291
- Midwest: 31,086
- South: 18,855
- West: 5,750
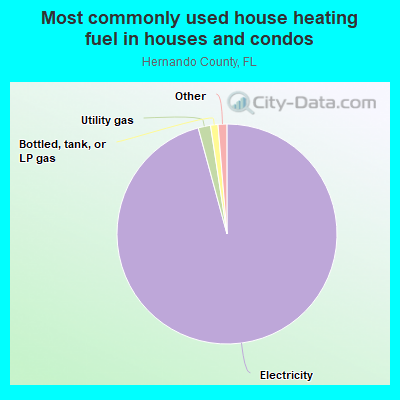
- 95.4%Electricity
- 1.9%Utility gas
- 1.2%Bottled, tank, or LP gas
- 1.0%No fuel used
- 0.3%Solar energy
- 0.1%Wood
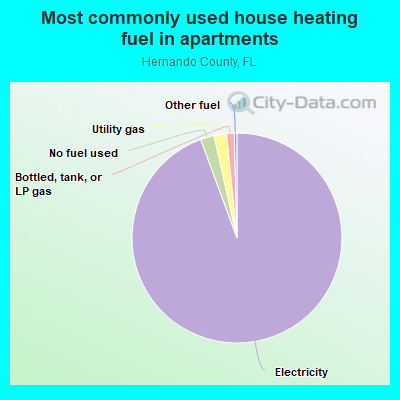
- 93.6%Electricity
- 2.4%No fuel used
- 2.4%Utility gas
- 1.2%Bottled, tank, or LP gas
- 0.3%Other fuel
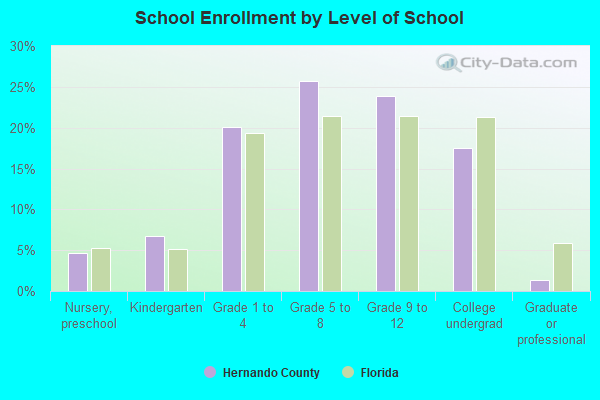
Private vs. public school enrollment:
| Here: | 23.2% |
| Florida: | 15.8% |
| Here: | 17.1% |
| Florida: | 12.9% |
| Here: | 20.6% |
| Florida: | 23.6% |
Hernando County government finances - Expenditure in 2018:
- Bond Funds - Cash and Securities: $15,543,000
Cash and Securities: $3,042,000
- Charges - Other: $28,462,000
Other: $22,143,000
Sewerage: $18,095,000
Sewerage: $16,083,000
Solid Waste Management: $3,367,000
Solid Waste Management: $2,967,000
Air Transportation: $1,988,000
Air Transportation: $1,775,000
Regular Highways: $854,000
Parks and Recreation: $803,000
Regular Highways: $795,000
Parks and Recreation: $735,000
Natural Resources - Other: $385,000
Natural Resources - Other: $330,000
- Construction - Air Transportation: $2,481,000
Air Transportation: $1,638,000
- Current Operations - Police Protection: $49,529,000
Police Protection: $43,297,000
General - Other: $37,982,000
Local Fire Protection: $23,084,000
Sewerage: $22,596,000
Local Fire Protection: $20,452,000
Sewerage: $19,912,000
Health - Other: $19,406,000
Health - Other: $18,738,000
Financial Administration: $14,334,000
Solid Waste Management: $14,281,000
Regular Highways: $13,128,000
Regular Highways: $12,961,000
Financial Administration: $12,678,000
Water Utilities: $7,739,000
Solid Waste Management: $7,411,000
Water Utilities: $7,196,000
Judicial and Legal Services: $7,007,000
Judicial and Legal Services: $6,719,000
General - Other: $6,236,000
Protective Inspection and Regulation - Other: $4,631,000
Central Staff Services: $4,019,000
Protective Inspection and Regulation - Other: $3,883,000
Central Staff Services: $3,722,000
Parks and Recreation: $2,993,000
Libraries: $2,790,000
Air Transportation: $2,689,000
Parks and Recreation: $2,607,000
Libraries: $2,245,000
Air Transportation: $2,234,000
Transit Utilities: $2,189,000
Transit Utilities: $2,132,000
Housing and Community Development: $1,497,000
General Public Buildings: $1,473,000
Natural Resources - Other: $1,419,000
General Public Buildings: $1,229,000
Natural Resources - Other: $1,120,000
Correctional Institutions: $901,000
Housing and Community Development: $842,000
Correctional Institutions: $619,000
Toll Highways: $557,000
Public Welfare - Other: $478,000
Toll Highways: $466,000
Public Welfare - Other: $433,000
- Federal Intergovernmental - Other: $3,456,000
Transit Utilities: $2,973,000
Transit Utilities: $2,907,000
Other: $1,403,000
Highways: $1,130,000
Highways: $861,000
- General - Interest on Debt: $1,087,000
Interest on Debt: $1,043,000
- Intergovernmental to State - Health - Other: $4,000,000
Health - Other: $4,000,000
- Local Intergovernmental - Other: $4,315,000
Other: $3,199,000
General Local Government Support: $2,627,000
General Local Government Support: $1,918,000
Highways: $8,000
Highways: $6,000
- Long Term Debt - Beginning Outstanding - Unspecified Public Purpose: $124,346,000
Outstanding Unspecified Public Purpose: $114,612,000
Beginning Outstanding - Unspecified Public Purpose: $108,696,000
Outstanding Unspecified Public Purpose: $100,266,000
Retired Unspecified Public Purpose: $8,833,000
Retired Unspecified Public Purpose: $7,766,000
Issue, Unspecified Public Purpose: $2,368,000
Issue, Unspecified Public Purpose: $1,056,000
Retired Nonguaranteed - Public Debt for Private Purpose: $178,000
Retired Nonguaranteed - Public Debt for Private Purpose: $178,000
Beginning Outstanding - Public Debt for Private Purpose: $168,000
- Miscellaneous - Special Assessments: $44,536,000
Special Assessments: $29,012,000
Interest Earnings: $4,561,000
Rents: $3,460,000
Rents: $2,877,000
General Revenue - Other: $2,694,000
General Revenue - Other: $2,609,000
Fines and Forfeits: $1,763,000
Fines and Forfeits: $1,643,000
Interest Earnings: $910,000
Donations From Private Sources: $481,000
Sale of Property: $262,000
Donations From Private Sources: $84,000
Sale of Property: $25,000
- Other Capital Outlay - Regular Highways: $8,938,000
Regular Highways: $6,997,000
Police Protection: $2,111,000
Police Protection: $1,440,000
Transit Utilities: $1,147,000
Natural Resources - Other: $1,120,000
Transit Utilities: $817,000
Financial Administration: $740,000
Health - Other: $690,000
General - Other: $438,000
Parks and Recreation: $292,000
Financial Administration: $261,000
Libraries: $244,000
Libraries: $240,000
Natural Resources - Other: $200,000
General - Other: $155,000
Health - Other: $152,000
Toll Highways: $130,000
Judicial and Legal Services: $97,000
Local Fire Protection: $75,000
Judicial and Legal Services: $46,000
Local Fire Protection: $32,000
Toll Highways: $27,000
Parks and Recreation: $17,000
Protective Inspection and Regulation - Other: $10,000
Central Staff Services: $4,000
- Other Funds - Cash and Securities: $222,318,000
Cash and Securities: $194,239,000
- Revenue - Water Utilities: $18,005,000
Water Utilities: $17,604,000
Transit Utilities: $154,000
Transit Utilities: $148,000
- Sinking Funds - Cash and Securities: $24,000
- State Intergovernmental - General Local Government Support: $15,477,000
General Local Government Support: $14,171,000
Other: $5,030,000
Other: $3,966,000
Highways: $2,873,000
Highways: $2,818,000
Transit Utilities: $382,000
Transit Utilities: $337,000
Health and Hospitals: $237,000
Health and Hospitals: $237,000
Public Welfare: $42,000
Public Welfare: $32,000
Sewerage: $3,000
- Tax - Property: $72,134,000
Property: $62,915,000
Other Selective Sales: $10,032,000
Other Selective Sales: $9,608,000
Other License: $4,214,000
Other License: $3,336,000
Documentary and Stock Transfer: $1,895,000
Public Utilities Sales: $1,655,000
Documentary and Stock Transfer: $1,609,000
Public Utilities Sales: $1,494,000
Occupation and Business License - Other: $28,000
Occupation and Business License - Other: $24,000
- Water Utilities - Interest on Debt: $3,708,000
Interest on Debt: $2,242,000
Hernando County government finances - Revenue in 2018:
- Bond Funds - Cash and Securities: $15,543,000
Cash and Securities: $3,042,000
- Charges - Other: $28,462,000
Other: $22,143,000
Sewerage: $18,095,000
Sewerage: $16,083,000
Solid Waste Management: $3,367,000
Solid Waste Management: $2,967,000
Air Transportation: $1,988,000
Air Transportation: $1,775,000
Regular Highways: $854,000
Parks and Recreation: $803,000
Regular Highways: $795,000
Parks and Recreation: $735,000
Natural Resources - Other: $385,000
Natural Resources - Other: $330,000
- Construction - Air Transportation: $2,481,000
Air Transportation: $1,638,000
- Current Operations - Police Protection: $49,529,000
Police Protection: $43,297,000
General - Other: $37,982,000
Local Fire Protection: $23,084,000
Sewerage: $22,596,000
Local Fire Protection: $20,452,000
Sewerage: $19,912,000
Health - Other: $19,406,000
Health - Other: $18,738,000
Financial Administration: $14,334,000
Solid Waste Management: $14,281,000
Regular Highways: $13,128,000
Regular Highways: $12,961,000
Financial Administration: $12,678,000
Water Utilities: $7,739,000
Solid Waste Management: $7,411,000
Water Utilities: $7,196,000
Judicial and Legal Services: $7,007,000
Judicial and Legal Services: $6,719,000
General - Other: $6,236,000
Protective Inspection and Regulation - Other: $4,631,000
Central Staff Services: $4,019,000
Protective Inspection and Regulation - Other: $3,883,000
Central Staff Services: $3,722,000
Parks and Recreation: $2,993,000
Libraries: $2,790,000
Air Transportation: $2,689,000
Parks and Recreation: $2,607,000
Libraries: $2,245,000
Air Transportation: $2,234,000
Transit Utilities: $2,189,000
Transit Utilities: $2,132,000
Housing and Community Development: $1,497,000
General Public Buildings: $1,473,000
Natural Resources - Other: $1,419,000
General Public Buildings: $1,229,000
Natural Resources - Other: $1,120,000
Correctional Institutions: $901,000
Housing and Community Development: $842,000
Correctional Institutions: $619,000
Toll Highways: $557,000
Public Welfare - Other: $478,000
Toll Highways: $466,000
Public Welfare - Other: $433,000
- Federal Intergovernmental - Other: $3,456,000
Transit Utilities: $2,973,000
Transit Utilities: $2,907,000
Other: $1,403,000
Highways: $1,130,000
Highways: $861,000
- General - Interest on Debt: $1,087,000
Interest on Debt: $1,043,000
- Intergovernmental to State - Health - Other: $4,000,000
Health - Other: $4,000,000
- Local Intergovernmental - Other: $4,315,000
Other: $3,199,000
General Local Government Support: $2,627,000
General Local Government Support: $1,918,000
Highways: $8,000
Highways: $6,000
- Long Term Debt - Beginning Outstanding - Unspecified Public Purpose: $124,346,000
Outstanding Unspecified Public Purpose: $114,612,000
Beginning Outstanding - Unspecified Public Purpose: $108,696,000
Outstanding Unspecified Public Purpose: $100,266,000
Retired Unspecified Public Purpose: $8,833,000
Retired Unspecified Public Purpose: $7,766,000
Issue, Unspecified Public Purpose: $2,368,000
Issue, Unspecified Public Purpose: $1,056,000
Retired Nonguaranteed - Public Debt for Private Purpose: $178,000
Retired Nonguaranteed - Public Debt for Private Purpose: $178,000
Beginning Outstanding - Public Debt for Private Purpose: $168,000
- Miscellaneous - Special Assessments: $44,536,000
Special Assessments: $29,012,000
Interest Earnings: $4,561,000
Rents: $3,460,000
Rents: $2,877,000
General Revenue - Other: $2,694,000
General Revenue - Other: $2,609,000
Fines and Forfeits: $1,763,000
Fines and Forfeits: $1,643,000
Interest Earnings: $910,000
Donations From Private Sources: $481,000
Sale of Property: $262,000
Donations From Private Sources: $84,000
Sale of Property: $25,000
- Other Capital Outlay - Regular Highways: $8,938,000
Regular Highways: $6,997,000
Police Protection: $2,111,000
Police Protection: $1,440,000
Transit Utilities: $1,147,000
Natural Resources - Other: $1,120,000
Transit Utilities: $817,000
Financial Administration: $740,000
Health - Other: $690,000
General - Other: $438,000
Parks and Recreation: $292,000
Financial Administration: $261,000
Libraries: $244,000
Libraries: $240,000
Natural Resources - Other: $200,000
General - Other: $155,000
Health - Other: $152,000
Toll Highways: $130,000
Judicial and Legal Services: $97,000
Local Fire Protection: $75,000
Judicial and Legal Services: $46,000
Local Fire Protection: $32,000
Toll Highways: $27,000
Parks and Recreation: $17,000
Protective Inspection and Regulation - Other: $10,000
Central Staff Services: $4,000
- Other Funds - Cash and Securities: $222,318,000
Cash and Securities: $194,239,000
- Revenue - Water Utilities: $18,005,000
Water Utilities: $17,604,000
Transit Utilities: $154,000
Transit Utilities: $148,000
- Sinking Funds - Cash and Securities: $24,000
- State Intergovernmental - General Local Government Support: $15,477,000
General Local Government Support: $14,171,000
Other: $5,030,000
Other: $3,966,000
Highways: $2,873,000
Highways: $2,818,000
Transit Utilities: $382,000
Transit Utilities: $337,000
Health and Hospitals: $237,000
Health and Hospitals: $237,000
Public Welfare: $42,000
Public Welfare: $32,000
Sewerage: $3,000
- Tax - Property: $72,134,000
Property: $62,915,000
Other Selective Sales: $10,032,000
Other Selective Sales: $9,608,000
Other License: $4,214,000
Other License: $3,336,000
Documentary and Stock Transfer: $1,895,000
Public Utilities Sales: $1,655,000
Documentary and Stock Transfer: $1,609,000
Public Utilities Sales: $1,494,000
Occupation and Business License - Other: $28,000
Occupation and Business License - Other: $24,000
- Water Utilities - Interest on Debt: $3,708,000
Interest on Debt: $2,242,000
Hernando County government finances - Debt in 2018:
- Bond Funds - Cash and Securities: $15,543,000
Cash and Securities: $3,042,000
- Charges - Other: $28,462,000
Other: $22,143,000
Sewerage: $18,095,000
Sewerage: $16,083,000
Solid Waste Management: $3,367,000
Solid Waste Management: $2,967,000
Air Transportation: $1,988,000
Air Transportation: $1,775,000
Regular Highways: $854,000
Parks and Recreation: $803,000
Regular Highways: $795,000
Parks and Recreation: $735,000
Natural Resources - Other: $385,000
Natural Resources - Other: $330,000
- Construction - Air Transportation: $2,481,000
Air Transportation: $1,638,000
- Current Operations - Police Protection: $49,529,000
Police Protection: $43,297,000
General - Other: $37,982,000
Local Fire Protection: $23,084,000
Sewerage: $22,596,000
Local Fire Protection: $20,452,000
Sewerage: $19,912,000
Health - Other: $19,406,000
Health - Other: $18,738,000
Financial Administration: $14,334,000
Solid Waste Management: $14,281,000
Regular Highways: $13,128,000
Regular Highways: $12,961,000
Financial Administration: $12,678,000
Water Utilities: $7,739,000
Solid Waste Management: $7,411,000
Water Utilities: $7,196,000
Judicial and Legal Services: $7,007,000
Judicial and Legal Services: $6,719,000
General - Other: $6,236,000
Protective Inspection and Regulation - Other: $4,631,000
Central Staff Services: $4,019,000
Protective Inspection and Regulation - Other: $3,883,000
Central Staff Services: $3,722,000
Parks and Recreation: $2,993,000
Libraries: $2,790,000
Air Transportation: $2,689,000
Parks and Recreation: $2,607,000
Libraries: $2,245,000
Air Transportation: $2,234,000
Transit Utilities: $2,189,000
Transit Utilities: $2,132,000
Housing and Community Development: $1,497,000
General Public Buildings: $1,473,000
Natural Resources - Other: $1,419,000
General Public Buildings: $1,229,000
Natural Resources - Other: $1,120,000
Correctional Institutions: $901,000
Housing and Community Development: $842,000
Correctional Institutions: $619,000
Toll Highways: $557,000
Public Welfare - Other: $478,000
Toll Highways: $466,000
Public Welfare - Other: $433,000
- Federal Intergovernmental - Other: $3,456,000
Transit Utilities: $2,973,000
Transit Utilities: $2,907,000
Other: $1,403,000
Highways: $1,130,000
Highways: $861,000
- General - Interest on Debt: $1,087,000
Interest on Debt: $1,043,000
- Intergovernmental to State - Health - Other: $4,000,000
Health - Other: $4,000,000
- Local Intergovernmental - Other: $4,315,000
Other: $3,199,000
General Local Government Support: $2,627,000
General Local Government Support: $1,918,000
Highways: $8,000
Highways: $6,000
- Long Term Debt - Beginning Outstanding - Unspecified Public Purpose: $124,346,000
Outstanding Unspecified Public Purpose: $114,612,000
Beginning Outstanding - Unspecified Public Purpose: $108,696,000
Outstanding Unspecified Public Purpose: $100,266,000
Retired Unspecified Public Purpose: $8,833,000
Retired Unspecified Public Purpose: $7,766,000
Issue, Unspecified Public Purpose: $2,368,000
Issue, Unspecified Public Purpose: $1,056,000
Retired Nonguaranteed - Public Debt for Private Purpose: $178,000
Retired Nonguaranteed - Public Debt for Private Purpose: $178,000
Beginning Outstanding - Public Debt for Private Purpose: $168,000
- Miscellaneous - Special Assessments: $44,536,000
Special Assessments: $29,012,000
Interest Earnings: $4,561,000
Rents: $3,460,000
Rents: $2,877,000
General Revenue - Other: $2,694,000
General Revenue - Other: $2,609,000
Fines and Forfeits: $1,763,000
Fines and Forfeits: $1,643,000
Interest Earnings: $910,000
Donations From Private Sources: $481,000
Sale of Property: $262,000
Donations From Private Sources: $84,000
Sale of Property: $25,000
- Other Capital Outlay - Regular Highways: $8,938,000
Regular Highways: $6,997,000
Police Protection: $2,111,000
Police Protection: $1,440,000
Transit Utilities: $1,147,000
Natural Resources - Other: $1,120,000
Transit Utilities: $817,000
Financial Administration: $740,000
Health - Other: $690,000
General - Other: $438,000
Parks and Recreation: $292,000
Financial Administration: $261,000
Libraries: $244,000
Libraries: $240,000
Natural Resources - Other: $200,000
General - Other: $155,000
Health - Other: $152,000
Toll Highways: $130,000
Judicial and Legal Services: $97,000
Local Fire Protection: $75,000
Judicial and Legal Services: $46,000
Local Fire Protection: $32,000
Toll Highways: $27,000
Parks and Recreation: $17,000
Protective Inspection and Regulation - Other: $10,000
Central Staff Services: $4,000
- Other Funds - Cash and Securities: $222,318,000
Cash and Securities: $194,239,000
- Revenue - Water Utilities: $18,005,000
Water Utilities: $17,604,000
Transit Utilities: $154,000
Transit Utilities: $148,000
- Sinking Funds - Cash and Securities: $24,000
- State Intergovernmental - General Local Government Support: $15,477,000
General Local Government Support: $14,171,000
Other: $5,030,000
Other: $3,966,000
Highways: $2,873,000
Highways: $2,818,000
Transit Utilities: $382,000
Transit Utilities: $337,000
Health and Hospitals: $237,000
Health and Hospitals: $237,000
Public Welfare: $42,000
Public Welfare: $32,000
Sewerage: $3,000
- Tax - Property: $72,134,000
Property: $62,915,000
Other Selective Sales: $10,032,000
Other Selective Sales: $9,608,000
Other License: $4,214,000
Other License: $3,336,000
Documentary and Stock Transfer: $1,895,000
Public Utilities Sales: $1,655,000
Documentary and Stock Transfer: $1,609,000
Public Utilities Sales: $1,494,000
Occupation and Business License - Other: $28,000
Occupation and Business License - Other: $24,000
- Water Utilities - Interest on Debt: $3,708,000
Interest on Debt: $2,242,000
Hernando County government finances - Cash and Securities in 2018:
- Bond Funds - Cash and Securities: $15,543,000
Cash and Securities: $3,042,000
- Charges - Other: $28,462,000
Other: $22,143,000
Sewerage: $18,095,000
Sewerage: $16,083,000
Solid Waste Management: $3,367,000
Solid Waste Management: $2,967,000
Air Transportation: $1,988,000
Air Transportation: $1,775,000
Regular Highways: $854,000
Parks and Recreation: $803,000
Regular Highways: $795,000
Parks and Recreation: $735,000
Natural Resources - Other: $385,000
Natural Resources - Other: $330,000
- Construction - Air Transportation: $2,481,000
Air Transportation: $1,638,000
- Current Operations - Police Protection: $49,529,000
Police Protection: $43,297,000
General - Other: $37,982,000
Local Fire Protection: $23,084,000
Sewerage: $22,596,000
Local Fire Protection: $20,452,000
Sewerage: $19,912,000
Health - Other: $19,406,000
Health - Other: $18,738,000
Financial Administration: $14,334,000
Solid Waste Management: $14,281,000
Regular Highways: $13,128,000
Regular Highways: $12,961,000
Financial Administration: $12,678,000
Water Utilities: $7,739,000
Solid Waste Management: $7,411,000
Water Utilities: $7,196,000
Judicial and Legal Services: $7,007,000
Judicial and Legal Services: $6,719,000
General - Other: $6,236,000
Protective Inspection and Regulation - Other: $4,631,000
Central Staff Services: $4,019,000
Protective Inspection and Regulation - Other: $3,883,000
Central Staff Services: $3,722,000
Parks and Recreation: $2,993,000
Libraries: $2,790,000
Air Transportation: $2,689,000
Parks and Recreation: $2,607,000
Libraries: $2,245,000
Air Transportation: $2,234,000
Transit Utilities: $2,189,000
Transit Utilities: $2,132,000
Housing and Community Development: $1,497,000
General Public Buildings: $1,473,000
Natural Resources - Other: $1,419,000
General Public Buildings: $1,229,000
Natural Resources - Other: $1,120,000
Correctional Institutions: $901,000
Housing and Community Development: $842,000
Correctional Institutions: $619,000
Toll Highways: $557,000
Public Welfare - Other: $478,000
Toll Highways: $466,000
Public Welfare - Other: $433,000
- Federal Intergovernmental - Other: $3,456,000
Transit Utilities: $2,973,000
Transit Utilities: $2,907,000
Other: $1,403,000
Highways: $1,130,000
Highways: $861,000
- General - Interest on Debt: $1,087,000
Interest on Debt: $1,043,000
- Intergovernmental to State - Health - Other: $4,000,000
Health - Other: $4,000,000
- Local Intergovernmental - Other: $4,315,000
Other: $3,199,000
General Local Government Support: $2,627,000
General Local Government Support: $1,918,000
Highways: $8,000
Highways: $6,000
- Long Term Debt - Beginning Outstanding - Unspecified Public Purpose: $124,346,000
Outstanding Unspecified Public Purpose: $114,612,000
Beginning Outstanding - Unspecified Public Purpose: $108,696,000
Outstanding Unspecified Public Purpose: $100,266,000
Retired Unspecified Public Purpose: $8,833,000
Retired Unspecified Public Purpose: $7,766,000
Issue, Unspecified Public Purpose: $2,368,000
Issue, Unspecified Public Purpose: $1,056,000
Retired Nonguaranteed - Public Debt for Private Purpose: $178,000
Retired Nonguaranteed - Public Debt for Private Purpose: $178,000
Beginning Outstanding - Public Debt for Private Purpose: $168,000
- Miscellaneous - Special Assessments: $44,536,000
Special Assessments: $29,012,000
Interest Earnings: $4,561,000
Rents: $3,460,000
Rents: $2,877,000
General Revenue - Other: $2,694,000
General Revenue - Other: $2,609,000
Fines and Forfeits: $1,763,000
Fines and Forfeits: $1,643,000
Interest Earnings: $910,000
Donations From Private Sources: $481,000
Sale of Property: $262,000
Donations From Private Sources: $84,000
Sale of Property: $25,000
- Other Capital Outlay - Regular Highways: $8,938,000
Regular Highways: $6,997,000
Police Protection: $2,111,000
Police Protection: $1,440,000
Transit Utilities: $1,147,000
Natural Resources - Other: $1,120,000
Transit Utilities: $817,000
Financial Administration: $740,000
Health - Other: $690,000
General - Other: $438,000
Parks and Recreation: $292,000
Financial Administration: $261,000
Libraries: $244,000
Libraries: $240,000
Natural Resources - Other: $200,000
General - Other: $155,000
Health - Other: $152,000
Toll Highways: $130,000
Judicial and Legal Services: $97,000
Local Fire Protection: $75,000
Judicial and Legal Services: $46,000
Local Fire Protection: $32,000
Toll Highways: $27,000
Parks and Recreation: $17,000
Protective Inspection and Regulation - Other: $10,000
Central Staff Services: $4,000
- Other Funds - Cash and Securities: $222,318,000
Cash and Securities: $194,239,000
- Revenue - Water Utilities: $18,005,000
Water Utilities: $17,604,000
Transit Utilities: $154,000
Transit Utilities: $148,000
- Sinking Funds - Cash and Securities: $24,000
- State Intergovernmental - General Local Government Support: $15,477,000
General Local Government Support: $14,171,000
Other: $5,030,000
Other: $3,966,000
Highways: $2,873,000
Highways: $2,818,000
Transit Utilities: $382,000
Transit Utilities: $337,000
Health and Hospitals: $237,000
Health and Hospitals: $237,000
Public Welfare: $42,000
Public Welfare: $32,000
Sewerage: $3,000
- Tax - Property: $72,134,000
Property: $62,915,000
Other Selective Sales: $10,032,000
Other Selective Sales: $9,608,000
Other License: $4,214,000
Other License: $3,336,000
Documentary and Stock Transfer: $1,895,000
Public Utilities Sales: $1,655,000
Documentary and Stock Transfer: $1,609,000
Public Utilities Sales: $1,494,000
Occupation and Business License - Other: $28,000
Occupation and Business License - Other: $24,000
- Water Utilities - Interest on Debt: $3,708,000
Interest on Debt: $2,242,000
Supplemental Security Income (SSI) in 2006:
- Total number of recipients: 2,835
- Number of aged recipients: 260
- Number of blind and disabled recipients: 2,575
- Number of recipients under 18: 587
- Number of recipients between 18 and 64: 1,755
- Number of recipients older than 64: 493
- Number of recipients also receiving OASDI: 1,042
- Amount of payments (thousands of dollars): 1,259
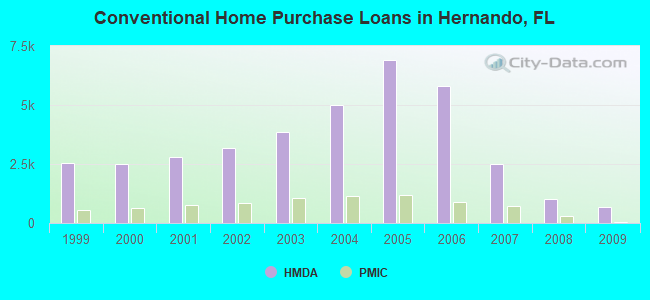
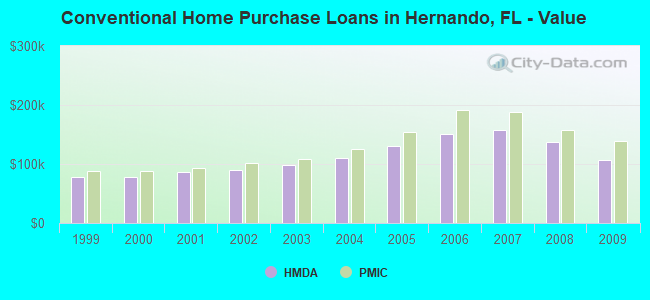
| Home Mortgage Disclosure Act Aggregated Statistics For Year 2009 (Based on 25 full tracts) | ||||||||||||||
| A) FHA, FSA/RHS & VA Home Purchase Loans | B) Conventional Home Purchase Loans | C) Refinancings | D) Home Improvement Loans | E) Loans on Dwellings For 5+ Families | F) Non-occupant Loans on < 5 Family Dwellings (A B C & D) | G) Loans On Manufactured Home Dwelling (A B C & D) | ||||||||
|---|---|---|---|---|---|---|---|---|---|---|---|---|---|---|
| Number | Average Value | Number | Average Value | Number | Average Value | Number | Average Value | Number | Average Value | Number | Average Value | Number | Average Value | |
| LOANS ORIGINATED | 748 | $113,999 | 663 | $106,563 | 1,481 | $137,584 | 86 | $40,744 | 0 | $0 | 334 | $116,449 | 134 | $73,507 |
| APPLICATIONS APPROVED, NOT ACCEPTED | 33 | $109,000 | 63 | $112,095 | 228 | $148,197 | 23 | $44,957 | 0 | $0 | 29 | $136,793 | 26 | $79,385 |
| APPLICATIONS DENIED | 201 | $120,055 | 226 | $95,770 | 1,181 | $149,243 | 150 | $43,220 | 0 | $0 | 158 | $117,582 | 136 | $59,096 |
| APPLICATIONS WITHDRAWN | 99 | $116,141 | 100 | $107,250 | 575 | $145,783 | 26 | $93,808 | 1 | $8,583,000 | 45 | $93,133 | 64 | $86,344 |
| FILES CLOSED FOR INCOMPLETENESS | 28 | $111,107 | 29 | $120,724 | 161 | $157,385 | 8 | $53,875 | 0 | $0 | 15 | $175,600 | 4 | $94,500 |
| Private Mortgage Insurance Companies Aggregated Statistics For Year 2009 (Based on 23 full tracts) | ||||||
| A) Conventional Home Purchase Loans | B) Refinancings | C) Non-occupant Loans on < 5 Family Dwellings (A & B) | ||||
|---|---|---|---|---|---|---|
| Number | Average Value | Number | Average Value | Number | Average Value | |
| LOANS ORIGINATED | 48 | $139,375 | 12 | $138,000 | 8 | $182,500 |
| APPLICATIONS APPROVED, NOT ACCEPTED | 62 | $205,790 | 11 | $213,000 | 39 | $220,359 |
| APPLICATIONS DENIED | 11 | $137,727 | 6 | $150,000 | 3 | $101,333 |
| APPLICATIONS WITHDRAWN | 6 | $133,667 | 5 | $192,600 | 0 | $0 |
| FILES CLOSED FOR INCOMPLETENESS | 4 | $100,750 | 3 | $200,000 | 1 | $68,000 |
| Most common first names in Hernando County, FL among deceased individuals | ||
| Name | Count | Lived (average) |
|---|---|---|
| John | 1,164 | 76.0 years |
| William | 949 | 76.8 years |
| Robert | 920 | 74.5 years |
| Mary | 775 | 80.4 years |
| James | 755 | 73.2 years |
| Joseph | 654 | 77.0 years |
| Charles | 586 | 77.1 years |
| George | 522 | 77.4 years |
| Dorothy | 443 | 80.0 years |
| Helen | 404 | 82.6 years |
| Most common last names in Hernando County, FL among deceased individuals | ||
| Last name | Count | Lived (average) |
|---|---|---|
| Smith | 290 | 75.9 years |
| Johnson | 199 | 78.1 years |
| Miller | 139 | 77.8 years |
| Williams | 131 | 74.8 years |
| Davis | 128 | 77.0 years |
| Brown | 119 | 74.6 years |
| Jones | 114 | 75.0 years |
| Martin | 105 | 79.6 years |
| White | 99 | 77.9 years |
| Anderson | 96 | 78.9 years |
| Businesses in Hernando County, FL | ||||
| Name | Count | Name | Count | |
|---|---|---|---|---|
| 7-Eleven | 4 | Long John Silver's | 1 | |
| AT&T | 3 | Lowe's | 2 | |
| Ace Hardware | 1 | Marshalls | 1 | |
| Advance Auto Parts | 6 | McDonald's | 10 | |
| Applebee's | 3 | Microtel | 1 | |
| Arby's | 2 | New Balance | 2 | |
| AutoZone | 4 | Nike | 2 | |
| Baskin-Robbins | 4 | Office Depot | 2 | |
| Bath & Body Works | 1 | Old Navy | 1 | |
| Bed Bath & Beyond | 1 | Outback | 1 | |
| Best Western | 1 | Outback Steakhouse | 1 | |
| Blockbuster | 3 | Panera Bread | 2 | |
| Burger King | 3 | Papa John's Pizza | 1 | |
| CVS | 5 | Payless | 2 | |
| Catherines | 1 | Penske | 1 | |
| Chevrolet | 1 | PetSmart | 1 | |
| Chick-Fil-A | 1 | Pizza Hut | 3 | |
| Circle K | 3 | Popeyes | 1 | |
| Cold Stone Creamery | 1 | Publix Super Markets | 8 | |
| Cracker Barrel | 2 | Quality | 1 | |
| Curves | 1 | Quiznos | 1 | |
| DHL | 1 | RadioShack | 3 | |
| Dairy Queen | 2 | Red Lobster | 1 | |
| Days Inn | 1 | Ruby Tuesday | 1 | |
| Dennys | 2 | Rue21 | 1 | |
| Domino's Pizza | 2 | Sam's Club | 1 | |
| Dunkin Donuts | 9 | Sears | 1 | |
| FedEx | 25 | Sephora | 1 | |
| Ford | 2 | Sprint Nextel | 1 | |
| GNC | 4 | Staples | 1 | |
| GameStop | 2 | Starbucks | 3 | |
| Goodwill | 5 | Steak 'n Shake | 1 | |
| H&R Block | 6 | T-Mobile | 6 | |
| Hardee's | 2 | Taco Bell | 3 | |
| Hilton | 2 | Target | 2 | |
| Holiday Inn | 3 | Tire Kingdom | 1 | |
| Home Depot | 1 | True Value | 2 | |
| IHOP | 1 | U-Haul | 15 | |
| JCPenney | 1 | UPS | 28 | |
| Jones New York | 1 | Verizon Wireless | 1 | |
| KFC | 2 | Waffle House | 1 | |
| Kohl's | 1 | Walgreens | 7 | |
| Lane Furniture | 1 | Walmart | 3 | |
| Little Caesars Pizza | 3 | YMCA | 1 | |
Hernando County on our top lists:
- #1 on the list of "Top 101 counties with the lowest surface withdrawal of fresh water for public supply (pop. 50,000+)"
- #4 on the list of "Top 101 counties with the highest number of deaths per 1000 residents 2007-2013 (pop. 50,000+)"
- #8 on the list of "Top 101 counties with the lowest surface withdrawal of fresh water for public supply"
- #12 on the list of "Top 101 counties with the lowest number of births per 1000 residents 2007-2013"
- #12 on the list of "Top 101 counties with the lowest number of births per 1000 residents 2007-2013 (pop 50,000+)"
- #36 on the list of "Top 101 counties with the smallest number of children under 18 without health insurance coverage in 2000 (pop. 50,000+)"