Overview
Comparing East San Gabriel Valley and Chula Vista, California, we find two unique areas with distinct advantages. East San Gabriel Valley offers a small-town atmosphere, with a lower crime rate and a more moderate cost of living. Chula Vista holds appeal for those who love the ocean, a larger city feel, and a diverse range of occupations.
Overall, both cities are parts of the vast and diverse landscape that California offers and have their individual benefits. The decision between East San Gabriel Valley and Chula Vista will depend largely on personal preference for the natural environment, cultural offerings, employment opportunities and costs associated with living.
In terms of crime, East San Gabriel Valley has reported significantly lower rates, making it a safer option for families. Chula Vista is still considered safe for a city its size, but the crime rates are comparatively higher, with property crimes being the most common.
Cost of Living
Living in East San Gabriel Valley is typically less expensive than in Chula Vista. This is reflected in the cost of housing, groceries, health care, and transportation.
Income Tax
Income tax rates in both locations are consistent with California's overall state income tax rates, which are somewhat high compared to the national average.
Property Tax
Property tax rates in both Chula Vista and the East San Gabriel Valley are roughly identical and are lower than the national average.
Sales Tax
Sales tax in both the East San Gabriel Valley and Chula Vista is relatively high, reflective of California's overall higher-than-average sales tax.
Income
Type
East San Gabriel Valley
Chula Vista
Estimated median household income
$95,242
$91,949
Estimated per capita income
$34,474
$35,138
Cost of living index (U.S. average is 100)
150.2
123.4
If you make $50,000 in Chula Vista, you will have to make $60,859 in East San Gabriel Valley to maintain the same standard of living.
Geographical Conditions
East San Gabriel Valley is landlocked and features a variety of geographical features, including mountains, forests, and foothills. Chula Vista holds appeal for those who love the ocean—it's located by the coast and is just a short drive away from beautiful Southern California beaches.
Geographical information
Type
East San Gabriel Valley
Chula Vista
Land area
212.6 sq. miles
48.9 sq. miles
Population density
4,478.5 people per sq. mile
5,671.8 people per sq. mile
Relative area comparison
East San Gabriel Valley, CA Chula Vista, CA
Education
Both areas boast quality education facilities with numerous public and private schools. East San Gabriel Valley is noted for its excellent public school system, while Chula Vista features two notable universities and high-ranking K-12 school systems.
Chula Vista's economy is primarily dominated by the service industry, with retail, education, and healthcare sectors leading the charge. East San Gabriel Valley's economy, on the other hand, is a mix of retail, healthcare, education, and manufacturing.
Biggest Employers
In Chula Vista, the biggest employers include the Sweetwater Union High School District, Sharp Chula Vista Medical Center, and Walmart. East San Gabriel Valley’s major employers are varied and include several retail and healthcare companies, City of Hope, and Kaiser Permanente.
In East San Gabriel Valley (Los Angeles County), 69.7% voted for Democrats and 27.8% for Republicans in 2012 Presidential Election. In Chula Vista (San Diego County), 52.6% voted for Democrats and 45.0% for Republicans.
Elections
Type
Democrats
Republicans
Other
Year
East San Gabriel Valley
Chula Vista
East San Gabriel Valley
Chula Vista
East San Gabriel Valley
Chula Vista
2020
71.0%
60.3%
26.9%
37.5%
2.1%
2.1%
2016
72.0%
56.3%
22.5%
36.6%
5.5%
7.1%
2012
69.7%
52.6%
27.8%
45.0%
2.4%
2.4%
2008
69.2%
54.2%
28.8%
44.0%
1.9%
1.8%
2004
63.3%
46.7%
35.7%
52.9%
1.0%
0.4%
2000
63.6%
45.8%
32.4%
49.8%
4.0%
4.5%
1996
59.3%
44.1%
31.0%
45.6%
9.7%
10.3%
Breakdown of population affiliated with a religious congregation
Type
Adherents
Congregations
Religion
East San Gabriel Valley
Chula Vista
East San Gabriel Valley
Chula Vista
CATHOLIC CHURCH
36.1%
25.9%
4.7%
6.7%
SOUTHERN BAPTIST CONVENTION
1.0%
1.1%
9.0%
12.0%
MUSLIM ESTIMATE
0.7%
0.7%
1.0%
1.1%
AMERICAN BAPTIST CHURCHES IN THE USA
0.5%
0.1%
3.1%
1.5%
SEVENTH DAY ADVENTIST CHURCH
0.5%
0.5%
2.4%
2.0%
EPISCOPAL CHURCH
0.4%
0.4%
1.4%
2.0%
EVANGELICAL LUTHERAN CHURCH IN AMERICA
0.2%
0.4%
1.9%
2.0%
LUTHERAN CHURCH
0.2%
0.4%
1.6%
2.2%
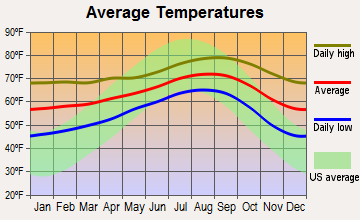
Weather
Both cities enjoy typical Southern California weather, with mild winters and warm to hot summers. However, due to its proximity to the coast, Chula Vista experiences cooler summers and less drastic temperature changes, compared to East San Gabriel Valley, which is inland.
Weather and climate
Type
East San Gabriel Valley
Chula Vista
Temperature - Average
62.7°F
63.9°F
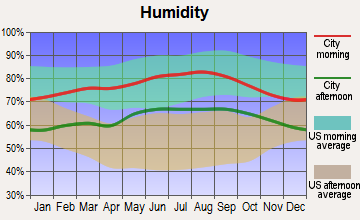
Humidity - Average morning or afternoon humidity
64.7%
74%
Humidity - Differences between morning and afternoon humidity
19.6%
22%
Humidity - Maximum monthly morning or afternoon humidity
70.7%
80%
Humidity - Minimum monthly morning or afternoon humidity
51%
58%
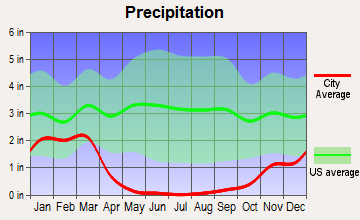
Precipitation - Yearly average
19.1 in
10.3 in
Snowfall - Yearly average
0 in
0 in
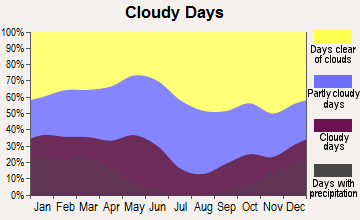
Clouds - Number of days clear of clouds
28.3%
24.3%
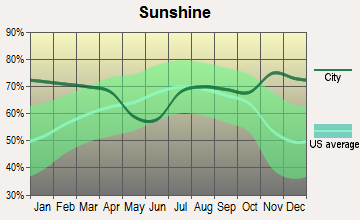
Sunshine amount - Average
78.4%
74.8%
Sunshine amount - Differences during a year
22%
19%
Sunshine amount - Maximum monthly
85%
75%
Sunshine amount - Minimum monthly
63%
56%
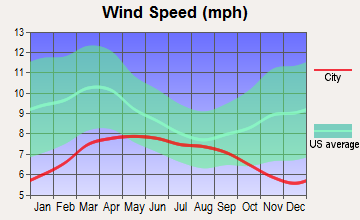
Wind speed - Average
3.7 mph
6.9 mph
Average climate in East San Gabriel Valley, California
Average climate in Chula Vista, California
Air pollution
Type
AQI
CO
NO2
OZONE
PB
PM10
PM25
SO2
Year
East San Gabriel Valley
Chula Vista
East San Gabriel Valley
Chula Vista
East San Gabriel Valley
Chula Vista
East San Gabriel Valley
Chula Vista
East San Gabriel Valley
Chula Vista
East San Gabriel Valley
Chula Vista
East San Gabriel Valley
Chula Vista
East San Gabriel Valley
Chula Vista
2018
143
101
0.36
0.36
14.1
8.6
29.2
29.4
0.007
0.010
29.6
N/A
13.4
11.5
0.3
0.1
2017
150
115
0.35
0.39
14.8
9.1
30.5
28.8
0.007
0.010
32.7
N/A
12.6
11.5
0.3
0.1
2016
141
105
0.31
0.34
15.5
9.1
29.3
28.6
0.007
0.010
30.3
N/A
12.0
12.0
0.3
0.1
2015
145
105
0.30
0.34
15.2
10.0
30.4
28.5
0.007
0.015
30.0
N/A
14.6
12.0
0.2
0.1
2014
142
99
0.32
0.42
16.8
10.6
29.7
26.3
0.008
0.012
33.6
N/A
11.7
10.8
0.3
0.1
2013
147
128
0.33
0.61
17.0
10.8
27.7
28.7
0.007
0.013
31.5
N/A
11.5
12.2
0.4
0.3
2012
149
107
0.39
0.54
18.3
11.1
27.5
31.2
0.005
0.013
30.9
N/A
15.6
13.6
0.6
0.2
2011
149
108
0.40
0.57
18.6
12.3
26.7
27.1
0.008
0.023
30.3
N/A
17.3
14.0
0.5
2.1
2010
139
91
0.44
0.56
19.3
12.2
26.8
33.6
N/A
0.017
26.6
N/A
14.8
N/A
0.4
1.4
2009
156
109
0.40
0.55
21.0
13.4
28.0
33.3
0.010
0.014
26.0
N/A
16.5
N/A
0.6
2.0
2008
156
401
0.48
0.60
22.7
14.8
27.7
32.7
0.012
N/A
27.0
207.2
15.1
N/A
1.0
2.3
2007
135
160
0.52
0.66
25.3
15.0
24.8
34.2
0.014
0.012
N/A
64.3
N/A
N/A
1.3
2.6
2006
128
130
0.55
0.61
25.1
16.9
24.0
32.4
0.009
0.056
N/A
64.0
N/A
N/A
1.9
3.3
2005
127
126
0.59
0.68
25.7
16.3
22.8
32.2
0.014
0.049
N/A
72.6
N/A
N/A
1.9
3.1
2004
132
116
0.68
0.72
25.4
16.0
24.6
30.6
0.016
0.055
N/A
N/A
N/A
N/A
1.7
3.1
2003
137
128
0.80
0.71
29.9
17.7
24.7
23.1
0.021
0.048
N/A
N/A
N/A
N/A
1.4
3.6
2002
134
125
0.83
0.74
31.4
17.7
23.1
30.7
0.021
0.015
N/A
N/A
N/A
N/A
2.0
3.7
2001
141
129
1.00
0.81
31.8
16.9
21.4
30.8
0.029
0.029
N/A
N/A
N/A
N/A
2.1
3.3
2000
150
132
1.05
0.84
34.7
16.9
20.7
28.4
0.027
0.045
N/A
N/A
N/A
N/A
2.0
2.7
Natural disasters
Type
East San Gabriel Valley
Chula Vista
Tornado activity compared to U.S. average
18.5%
5%
Earthquake activity compared to U.S. average
7,292.4%
5,616.5%
Natural disasters compared to U.S. average
57%
39%
Transportation
Chula Vista's transportation infrastructure is comprehensive, with ample options for public transit and commuting. East San Gabriel Valley, located inland, is more reliant on personal vehicles, with less well-developed public transit systems.
Transport
Type
East San Gabriel Valley
Chula Vista
Amtrak stations nearby
3
1
FAA registered aircraft
0
59
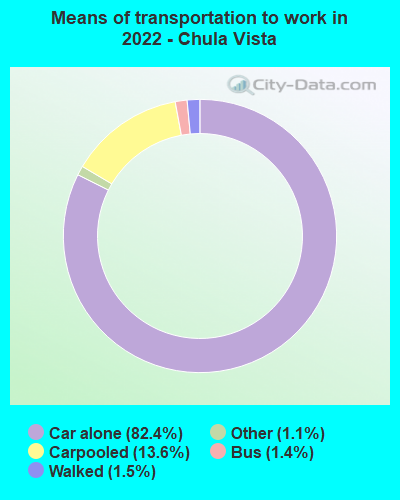
Means of transportation to work
Type
East San Gabriel Valley
Chula Vista
Bicycle
0.6%
0.2%
Bus
2.9%
2.6%
Carpooled
17.1%
10%
Car alone
73.3%
79.6%
Motorcycle
0.2%
0.3%
Railroad
0.6%
0.4%
Streetcar
0%
0.2%
Walked
2.2%
3.6%
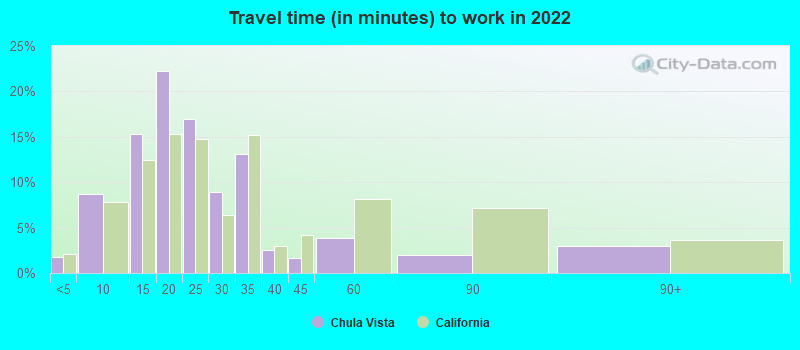
Average travel time to work
Type
East San Gabriel Valley
Chula Vista
Average
32.3 min
23 min
Real Estate
The real estate market is more competitive in Chula Vista, with relatively higher costs compared to the East San Gabriel Valley.
Neighborhoods
East San Gabriel Valley consists of several small towns and unincorporated areas - with unique histories and distinct personalities. Chula Vista is characterized by its diverse neighborhoods, ranging from older, established areas to newer, upscale communities.
Houses and residents
Type
East San Gabriel Valley
Chula Vista
Houses
270,240
88,821
Average household size (people)
3.5
3.2
Houses occupied
263,338 (97.4%)
83,451 (94%)
Houses occupied by owners
180,683 (68.6%)
48,589 (58.2%)
Houses occupied by renters
82,655 (31.4%)
34,862 (41.8%)
Median rent asked for vacant for-rent units
$1,935
$1,736
Median price asked for vacant for-sale houses and condos
$1,138,428
$648,184
Estimated median house or condo value
$643,048
$655,100
Median number of rooms in apartments
3.7
3.8
Median number of rooms in houses and condos
5.9
6
Renting percentage
32.3%
41.9%
Housing density (houses/condos per square mile)
1,270.8
1,817.2
Household income disparities
40.3%
41.7%
Housing units without a mortgage
26,635 (16.4%)
303 (0.9%)
Housing units with both a second mortgage and home equity loan
515 (0.3%)
2,201 (6.5%)
Housing units with a mortgage
136,243 (83.6%)
33,694 (99.1%)
Housing units with a home equity loan
11,429 (7%)
0 (0%)
Housing units with a second mortgage
21,150 (13%)
2,899 (8.5%)
Housing units lacking complete kitchen facilities
1%
1.5%
Housing units lacking complete plumbing facilities
Self-employed workers in own not incorporated business
25,753
9,347
State government workers
13,845
7,115
Unpaid family workers
1,494
174
Industries and Occupations
The main industries in Chula Vista are in the service and tourism sector, whereas in East San Gabriel Valley, manufacturing and retail trade are leading industries.
Both cities offer solid healthcare facilities. Chula Vista is home to the well-regarded Sharp Chula Vista Medical Center, and East San Gabriel Valley residents have access to City of Hope, a leading cancer research and treatment facility.
Health (county statistics)
Type
East San Gabriel Valley
Chula Vista
General health status score of residents in this county from 1 (poor) to 5 (excellent)
East San Gabriel Valley has a more rural feel and infrastructure is geared towards personal mobility, with less emphasis on public transportation. The infrastructure in Chula Vista is more developed, featuring an efficient road network, a light rail system, and bus services.
Infrastructure
Type
East San Gabriel Valley
Chula Vista
TV stations
24
12
Culture and Food
Culturally, Chula Vista boasts a more diverse food scene, with an emphasis on seafood and Mexican cuisine due to its coastal location and large Latinx population. East San Gabriel Valley, while having a variety of food options, is acclaimed for its Asian cuisine.
Sports Teams
As for sports, both areas offer ample opportunities for outdoor activities. Chula Vista is home to the Chula Vista Elite Athlete Training Center, a U.S. Olympic and Paralympic training facility. In the East San Gabriel Valley, residents are within easy reach of Los Angeles' professional sports teams.
 East San Gabriel Valley, CA
 Chula Vista, CA