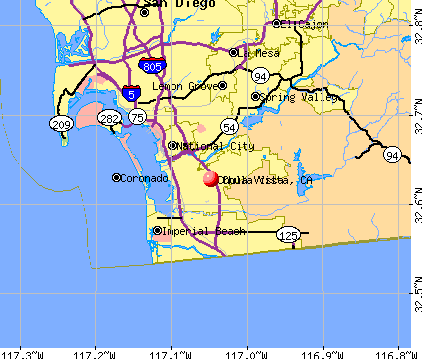
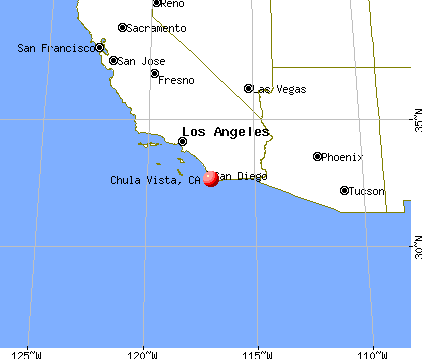
Chula Vista, California
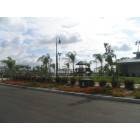
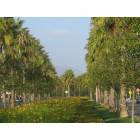
Chula Vista: One of the very many parks in town. Most are city parks, but many newer east end communities have their own with pools.
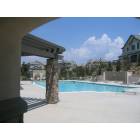
Chula Vista: Some of many beautiful condos here

Chula Vista: Most flowers bloom all year long!
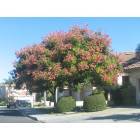
Chula Vista: One of the many beautiful and unusual tress
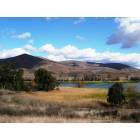
Chula Vista: Lower Otay Lake
Chula Vista: From WindingWalk community
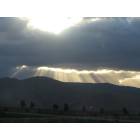
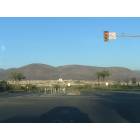
Chula Vista: East Palomar Street looking toward Otay Mountains in the east
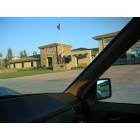
Chula Vista: Even the fire stations are nice
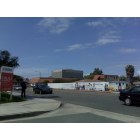
Chula Vista: Chula Vista
Chula Vista: Looking toward the (Summer ) Olympic Training Center
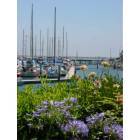
Chula Vista: J st. Marina, Chula Vista
- see
14
more - add
your
Submit your own pictures of this city and show them to the world
- OSM Map
- General Map
- Google Map
- MSN Map
Population change since 2000: +60.9%
| Males: 136,580 | |
| Females: 142,590 |
| Median resident age: | 35.9 years |
| California median age: | 37.9 years |
Zip codes: 91911, 91913, 91914, 91915, 91950, 92154.
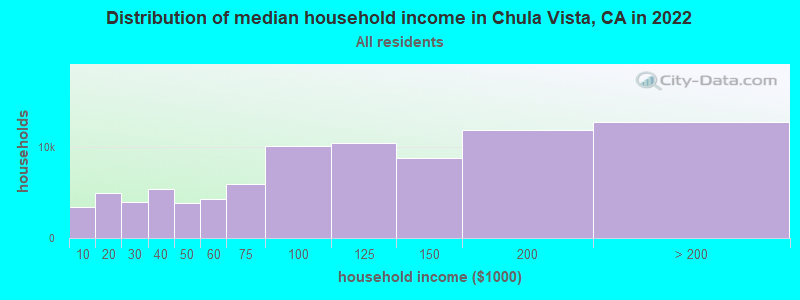
Chula Vista Zip Code Map| Chula Vista: | $101,190 |
| CA: | $91,551 |
Estimated per capita income in 2022: $36,572 (it was $18,556 in 2000)
Chula Vista city income, earnings, and wages data
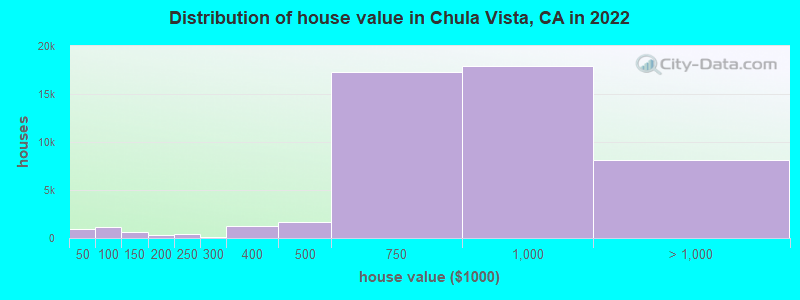
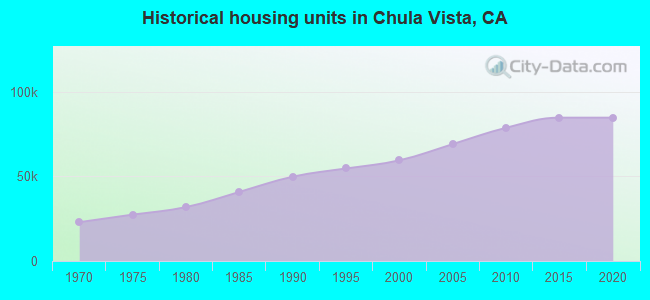
Estimated median house or condo value in 2022: $767,500 (it was $187,100 in 2000)
| Chula Vista: | $767,500 |
| CA: | $715,900 |
Mean prices in 2022: all housing units: $682,063; detached houses: $774,524; townhouses or other attached units: $552,250; in 2-unit structures: $451,316; in 3-to-4-unit structures: $440,396; in 5-or-more-unit structures: $432,668; mobile homes: $96,729
Median gross rent in 2022: $2,003.
(9.1% for White Non-Hispanic residents, 10.0% for Black residents, 11.7% for Hispanic or Latino residents, 19.9% for American Indian residents, 10.1% for Native Hawaiian and other Pacific Islander residents, 13.1% for other race residents, 11.2% for two or more races residents)
Detailed information about poverty and poor residents in Chula Vista, CA


Compare current foreclosures in Chula Vista, CA:
| Photo | Address | Area | Beds / Baths | Price | Details |
|---|---|---|---|---|---|

|
#1
Otay Valley Rd Unit A
Chula Vista, CA 91911
|
1,212 sq. feet
|
2 baths 3 beds |
show details | |

|
#2
Kent St
Chula Vista, CA 91913
|
2,035 sq. feet
|
2 baths 3 beds |
show details | |

|
#3
Via Sinuoso
Chula Vista, CA 91910
|
2,871 sq. feet
|
3 baths 4 beds |
show details | |

|
#4
Arthur Ave
Chula Vista, CA 91910
|
- sq. feet
|
1 baths 2 beds |
show details | |

|
#5
Tremont St
Chula Vista, CA 91911
|
912 sq. feet
|
2 baths 3 beds |
show details | |

|
#6
Tamayo Dr Apt 1
Chula Vista, CA 91910
|
1,006 sq. feet
|
2 baths 2 beds |
show details | |

|
#7
E Rienstra St
Chula Vista, CA 91911
|
1,350 sq. feet
|
1 baths 3 beds |
show details | |

|
#8
Carver St
Chula Vista, CA 91911
|
1,475 sq. feet
|
3 baths 4 beds |
show details | |

|
#9
Myra Ct
Chula Vista, CA 91911
|
1,314 sq. feet
|
2 baths 3 beds |
show details | |

|
#10
Santa Olivia Rd
Chula Vista, CA 91913
|
2,207 sq. feet
|
2 baths 3 beds |
show details |
| Photo | Address | Area | Beds / Baths | Price | Details |
|---|---|---|---|---|---|

|
#11
Mendocino Dr Unit 81
Chula Vista, CA 91911
|
1,045 sq. feet
|
1 baths 2 beds |
show details | |

|
#12
Amador St, O Ernesto Monzon
Chula Vista, CA 91913
|
2,102 sq. feet
|
3 baths 5 beds |
show details | |

|
#13
Carlos Canyon Dr
Chula Vista, CA 91910
|
5,109 sq. feet
|
3 baths 4 beds |
show details | |

|
#14
N 2nd Ave Unit 17
Chula Vista, CA 91910
|
786 sq. feet
|
1 baths 1 beds |
show details | |

|
#15
Camino Del Sol
Chula Vista, CA 91910
|
2,017 sq. feet
|
3 baths 3 beds |
show details | |

|
#16
Theresa Way
Chula Vista, CA 91911
|
1,040 sq. feet
|
1 baths 3 beds |
show details | |

|
#17
Mount Dana Dr
Chula Vista, CA 91913
|
2,950 sq. feet
|
3 baths 5 beds |
show details | |

|
#18
3rd Ave Spc 46
Chula Vista, CA 91911
|
1,120 sq. feet
|
2 baths 3 beds |
show details | |

|
#19
Trapani Cv Unit 7
Chula Vista, CA 91915
|
1,180 sq. feet
|
2 baths 2 beds |
show details | |

|
#20
Red Granite Rd
Chula Vista, CA 91913
|
3,745 sq. feet
|
4 baths 5 beds |
show details |
| Photo | Address | Area | Beds / Baths | Price | Details |
|---|---|---|---|---|---|

|
#21
Melrose Ave Unit 143
Chula Vista, CA 91911
|
1,102 sq. feet
|
2 baths 3 beds |
show details | |

|
#22
Cobblecreek St
Chula Vista, CA 91913
|
2,844 sq. feet
|
3 baths 5 beds |
show details | |

|
#23
Carla Ave
Chula Vista, CA 91910
|
1,062 sq. feet
|
1 baths 2 beds |
show details | |

|
#24
Yale St
Chula Vista, CA 91913
|
1,197 sq. feet
|
2 baths 3 beds |
show details | |

|
#25
Amador St
Chula Vista, CA 91913
|
2,102 sq. feet
|
3 baths 5 beds |
show details | |

|
#26
Greenfield Ct
Chula Vista, CA 91913
|
1,794 sq. feet
|
3 baths 4 beds |
show details | |

|
#27
Tamarack Ct
Chula Vista, CA 91911
|
1,104 sq. feet
|
2 baths 3 beds |
show details | |

|
#28
Haglar Way Unit 6
Chula Vista, CA 91913
|
1,529 sq. feet
|
3 baths 3 beds |
show details | |

|
#29
Melrose Ave
Chula Vista, CA 91911
|
1,040 sq. feet
|
2 baths 3 beds |
show details | |

|
#30
Caminito Siena
Chula Vista, CA 91911
|
1,705 sq. feet
|
2 baths 4 beds |
show details |
| Photo | Address | Area | Beds / Baths | Price | Details |
|---|---|---|---|---|---|

|
#31
Meeks Bay Dr
Chula Vista, CA 91913
|
2,464 sq. feet
|
3 baths 4 beds |
show details | |

|
#32
Camellia Ct
Chula Vista, CA 91911
|
2,070 sq. feet
|
2 baths 5 beds |
show details | |

|
#33
I St
Chula Vista, CA 91910
|
3,446 sq. feet
|
3 baths 5 beds |
show details | |

|
#34
Robert Ave
Chula Vista, CA 91910
|
1,016 sq. feet
|
1 baths 3 beds |
show details | |

|
#35
N 2nd Ave Unit 27
Chula Vista, CA 91910
|
1,003 sq. feet
|
2 baths 2 beds |
show details | |

|
#36
Via La Paloma
Chula Vista, CA 91910
|
1,888 sq. feet
|
3 baths 4 beds |
show details | |

|
#37
Hilltop Dr Unit 103
Chula Vista, CA 91911
|
1,004 sq. feet
|
2 baths 2 beds |
show details | |

|
#38
Broadway Unit 16
Chula Vista, CA 91910
|
1,584 sq. feet
|
3 baths 3 beds |
show details | |

|
#39
1st Ave
Chula Vista, CA 91911
|
1,354 sq. feet
|
2 baths 3 beds |
show details | |

|
#40
Rambling Vista Rd
Chula Vista, CA 91915
|
3,096 sq. feet
|
4 baths 4 beds |
show details |
| Photo | Address | Area | Beds / Baths | Price | Details |
|---|---|---|---|---|---|

|
#41
Waterville Lake Rd
Chula Vista, CA 91915
|
2,808 sq. feet
|
2 baths 4 beds |
show details | |

|
#42
Neptune Dr
Chula Vista, CA 91911
|
1,882 sq. feet
|
2 baths 4 beds |
show details | |

|
#43
Corte Castillo
Chula Vista, CA 91914
|
2,616 sq. feet
|
3 baths 3 beds |
show details | |

|
#44
Shenandoah Dr
Chula Vista, CA 91914
|
4,540 sq. feet
|
3 baths 4 beds |
show details | |

|
#45
Windjammer Cir
Chula Vista, CA 91910
|
1,469 sq. feet
|
3 baths 3 beds |
show details | |

|
#46
Rambur St
Chula Vista, CA 91911
|
2,863 sq. feet
|
3 baths 5 beds |
show details | |

|
#47
Meeks Bay Dr
Chula Vista, CA 91913
|
2,680 sq. feet
|
3 baths 4 beds |
show details | |

|
#48
Honeybee St
Chula Vista, CA 91915
|
1,788 sq. feet
|
2 baths 4 beds |
show details | |

|
#49
Castaic Ct
Chula Vista, CA 91913
|
2,407 sq. feet
|
2 baths 4 beds |
show details | |

|
Check over 1 million property listings on Foreclosure.com!
|
browse all offers | |||


- 181,11864.9%Hispanic
- 40,98114.7%White alone
- 33,61112.0%Asian alone
- 12,3134.4%Black alone
- 9,1893.3%Two or more races
- 8540.3%Other race alone
- 5220.2%American Indian alone
- 5700.2%Native Hawaiian and Other
Pacific Islander alone

According to our research of California and other state lists, there were 204 registered sex offenders living in Chula Vista, California as of April 27, 2024.
The ratio of all residents to sex offenders in Chula Vista is 1,310 to 1.
The ratio of registered sex offenders to all residents in this city is lower than the state average.
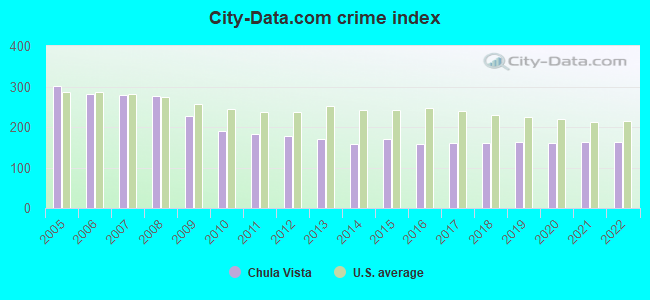
The City-Data.com crime index weighs serious crimes and violent crimes more heavily. Higher means more crime, U.S. average is 246.1. It adjusts for the number of visitors and daily workers commuting into cities.
- means the value is smaller than the state average.- means the value is about the same as the state average.
- means the value is bigger than the state average.
- means the value is much bigger than the state average.
Crime rate in Chula Vista detailed stats: murders, rapes, robberies, assaults, burglaries, thefts, arson
Full-time law enforcement employees in 2021, including police officers: 253 (241 officers - 194 male; 47 female).
| Officers per 1,000 residents here: | 0.87 |
| California average: | 2.30 |
 Recent articles from our blog. Our writers, many of them Ph.D. graduates or candidates, create easy-to-read articles on a wide variety of topics.

 | Homes in Otay Ranch, Chula Vista vs. rest of San Diego (13 replies) |
| Honest Mechanic -Chula Vista area (8 replies) |
| East/West Chula Vista for buying a house? (12 replies) |
| Safe Suburbs that are Commutable to Chula Vista, CA? (20 replies) |
| Commuting from San Diego to Chula Vista for work ? (5 replies) |
| East Chula Vista vs Temecula (16 replies) |
Latest news from Chula Vista, CA collected exclusively by city-data.com from local newspapers, TV, and radio stations
Ancestries: American (1.7%), German (1.1%), English (1.0%).
Current Local Time: PST time zone
Elevation: 70 feet
Land area: 48.9 square miles.
Population density: 5,712 people per square mile (average).
79,759 residents are foreign born (19.8% Latin America, 8.4% Asia).
| This city: | 29.0% |
| California: | 26.5% |
Median real estate property taxes paid for housing units with mortgages in 2022: $6,372 (0.8%)
Median real estate property taxes paid for housing units with no mortgage in 2022: $3,830 (0.6%)
Nearest city with pop. 200,000+: San Diego, CA  (11.9 miles , pop. 1,223,400).
Nearest cities:
), ), Latitude: 32.63 N, Longitude: 117.05 W
Daytime population change due to commuting: -58,504 (-21.0%)
Workers who live and work in this city: 44,390 (33.1%)
Area code: 619
Chula Vista tourist attractions:
Chula Vista, California accommodation & food services, waste management - Economy and Business Data
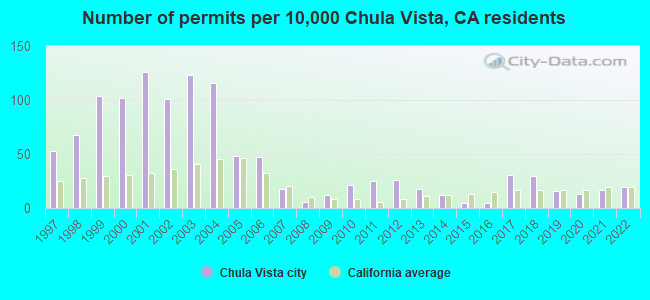
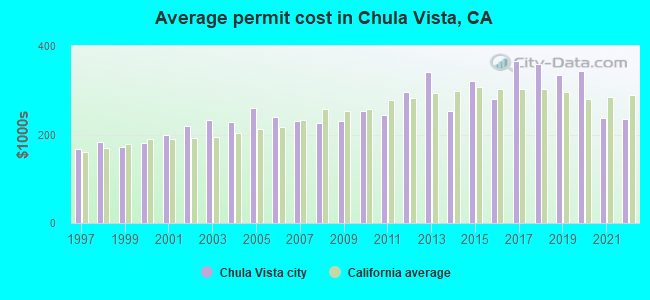
Single-family new house construction building permits:
- 2022: 331 buildings, average cost: $235,400
- 2021: 291 buildings, average cost: $238,100
- 2020: 222 buildings, average cost: $344,100
- 2019: 282 buildings, average cost: $333,800
- 2018: 515 buildings, average cost: $359,000
- 2017: 533 buildings, average cost: $364,700
- 2016: 86 buildings, average cost: $280,700
- 2015: 90 buildings, average cost: $320,600
- 2014: 215 buildings, average cost: $253,900
- 2013: 314 buildings, average cost: $341,100
- 2012: 459 buildings, average cost: $295,300
- 2011: 428 buildings, average cost: $244,900
- 2010: 367 buildings, average cost: $254,200
- 2009: 206 buildings, average cost: $231,200
- 2008: 111 buildings, average cost: $226,700
- 2007: 312 buildings, average cost: $231,300
- 2006: 818 buildings, average cost: $239,400
- 2005: 837 buildings, average cost: $258,500
- 2004: 2019 buildings, average cost: $229,100
- 2003: 2137 buildings, average cost: $233,100
- 2002: 1749 buildings, average cost: $218,800
- 2001: 2184 buildings, average cost: $198,600
- 2000: 1775 buildings, average cost: $179,700
- 1999: 1811 buildings, average cost: $171,100
- 1998: 1180 buildings, average cost: $182,200
- 1997: 927 buildings, average cost: $168,100
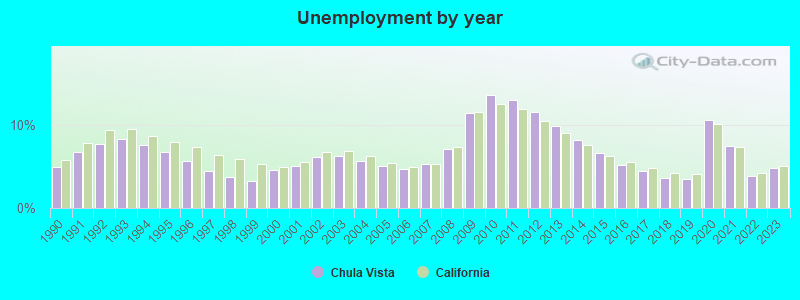
| Here: | 4.8% |
| California: | 5.1% |
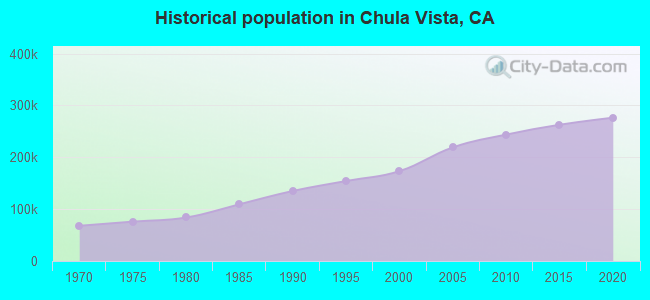
Population change in the 1990s: +37,464 (+27.5%).
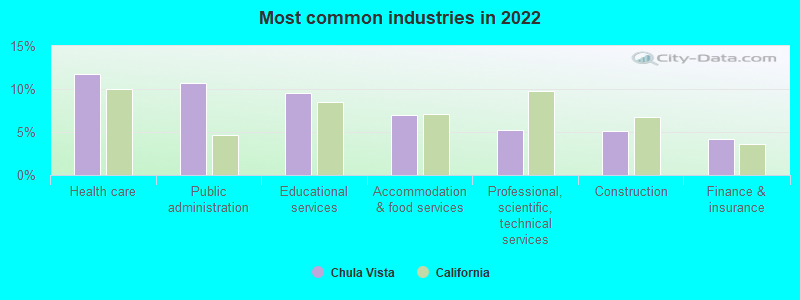
- Health care (11.7%)
- Public administration (10.7%)
- Educational services (9.5%)
- Accommodation & food services (7.0%)
- Professional, scientific, technical services (5.3%)
- Construction (5.2%)
- Finance & insurance (4.2%)
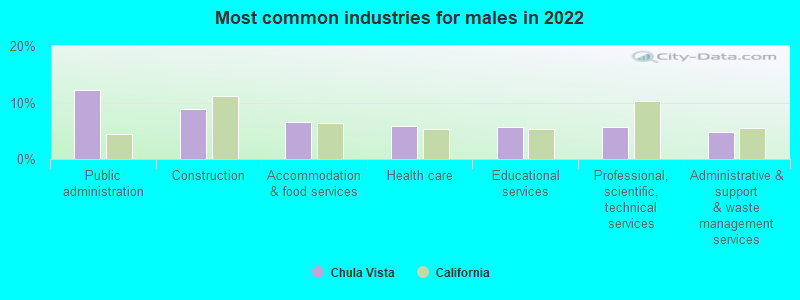
- Public administration (12.2%)
- Construction (8.9%)
- Accommodation & food services (6.6%)
- Health care (5.8%)
- Educational services (5.7%)
- Professional, scientific, technical services (5.7%)
- Administrative & support & waste management services (4.8%)
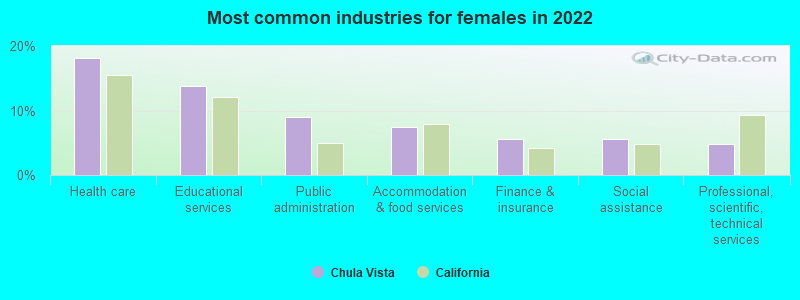
- Health care (18.2%)
- Educational services (13.7%)
- Public administration (9.0%)
- Accommodation & food services (7.4%)
- Finance & insurance (5.6%)
- Social assistance (5.6%)
- Professional, scientific, technical services (4.8%)
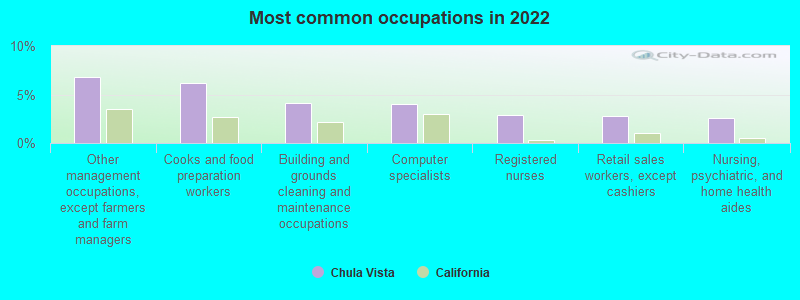
- Other management occupations, except farmers and farm managers (6.8%)
- Cooks and food preparation workers (6.2%)
- Building and grounds cleaning and maintenance occupations (4.1%)
- Computer specialists (4.0%)
- Registered nurses (2.9%)
- Retail sales workers, except cashiers (2.7%)
- Nursing, psychiatric, and home health aides (2.6%)
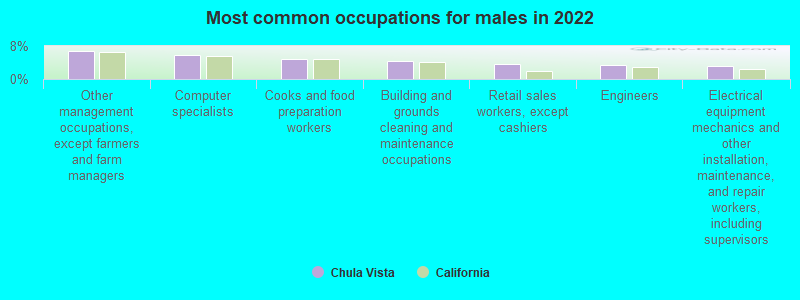
- Other management occupations, except farmers and farm managers (6.7%)
- Computer specialists (5.7%)
- Cooks and food preparation workers (4.9%)
- Building and grounds cleaning and maintenance occupations (4.4%)
- Retail sales workers, except cashiers (3.7%)
- Engineers (3.4%)
- Electrical equipment mechanics and other installation, maintenance, and repair workers, including supervisors (3.1%)
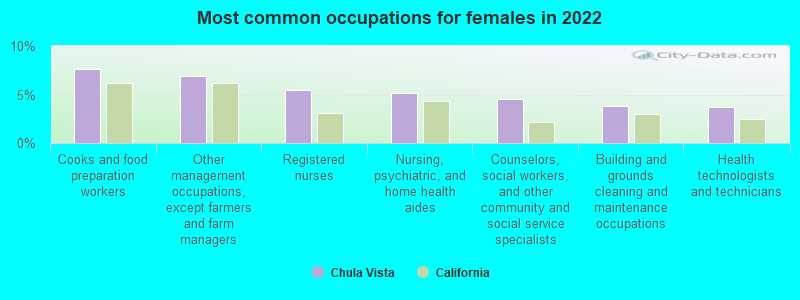
- Cooks and food preparation workers (7.6%)
- Other management occupations, except farmers and farm managers (6.9%)
- Registered nurses (5.5%)
- Nursing, psychiatric, and home health aides (5.2%)
- Counselors, social workers, and other community and social service specialists (4.5%)
- Building and grounds cleaning and maintenance occupations (3.8%)
- Health technologists and technicians (3.8%)
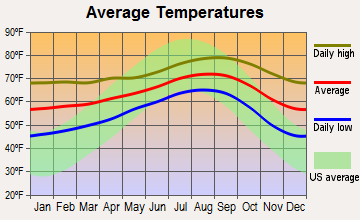
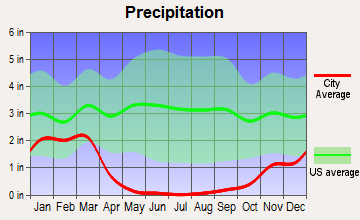
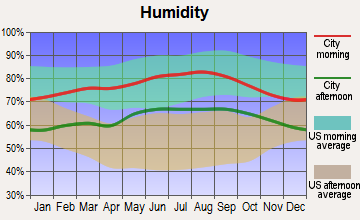
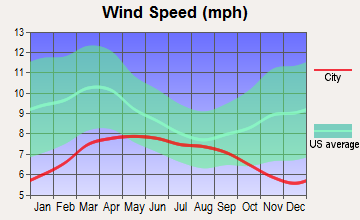
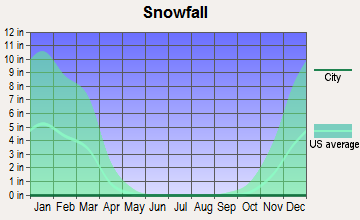
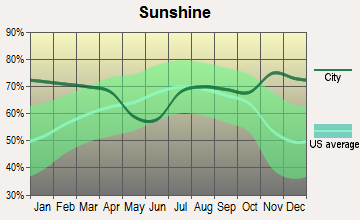
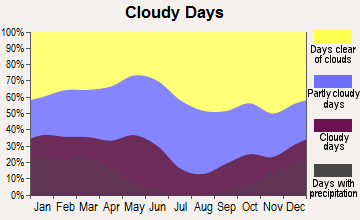
Average climate in Chula Vista, California
Based on data reported by over 4,000 weather stations
|
|

(lower is better)
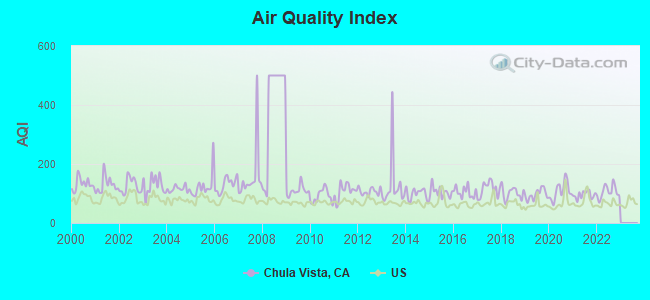
Air Quality Index (AQI) level in 2022 was 106. This is significantly worse than average.
| City: | 106 |
| U.S.: | 73 |
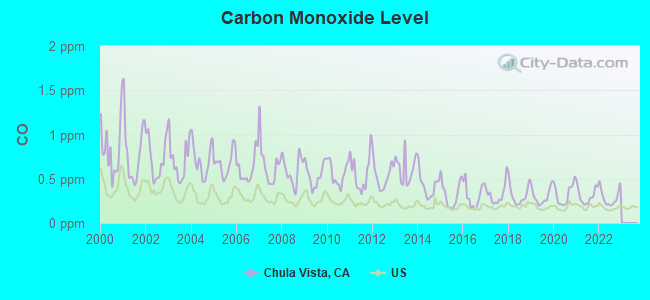
Carbon Monoxide (CO) [ppm] level in 2022 was 0.291. This is about average. Closest monitor was 0.7 miles away from the city center.
| City: | 0.291 |
| U.S.: | 0.251 |
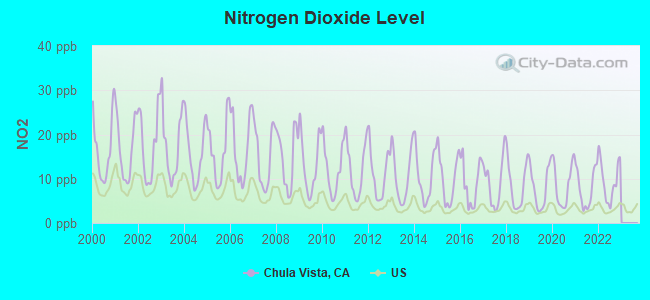
Nitrogen Dioxide (NO2) [ppb] level in 2022 was 9.61. This is significantly worse than average. Closest monitor was 0.7 miles away from the city center.
| City: | 9.61 |
| U.S.: | 5.11 |
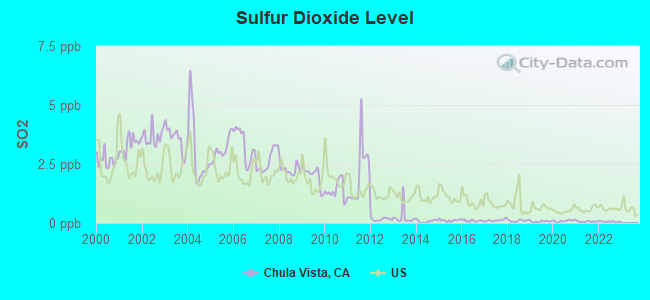
Sulfur Dioxide (SO2) [ppb] level in 2022 was 0.0589. This is significantly better than average. Closest monitor was 0.7 miles away from the city center.
| City: | 0.0589 |
| U.S.: | 1.5147 |
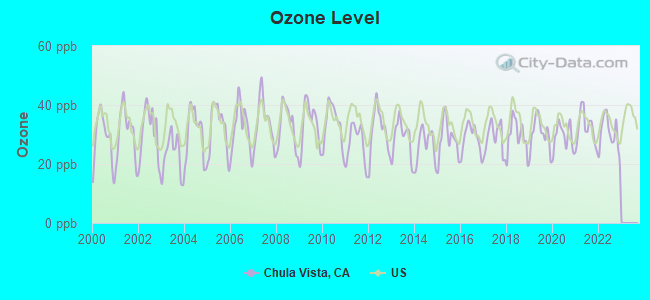
Ozone [ppb] level in 2022 was 30.1. This is about average. Closest monitor was 0.7 miles away from the city center.
| City: | 30.1 |
| U.S.: | 33.3 |
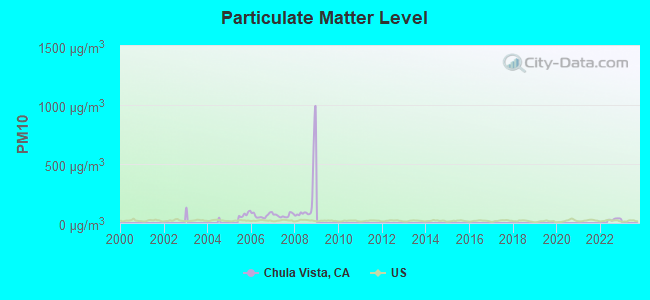
Particulate Matter (PM10) [µg/m3] level in 2022 was 31.9. This is significantly worse than average. Closest monitor was 0.7 miles away from the city center.
| City: | 31.9 |
| U.S.: | 19.2 |
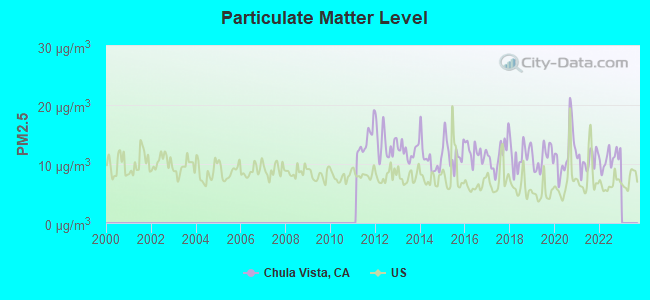
Particulate Matter (PM2.5) [µg/m3] level in 2022 was 10.9. This is worse than average. Closest monitor was 0.7 miles away from the city center.
| City: | 10.9 |
| U.S.: | 8.1 |
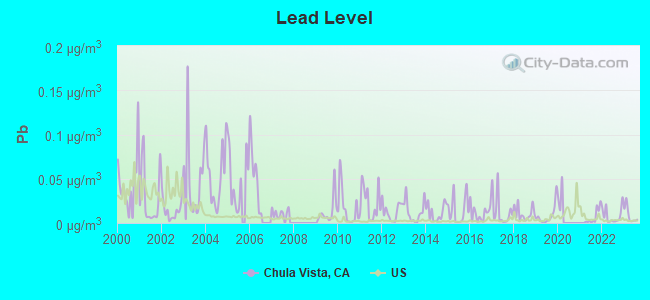
Lead (Pb) [µg/m3] level in 2023 was 0.00884. This is about average. Closest monitor was 0.7 miles away from the city center.
| City: | 0.00884 |
| U.S.: | 0.00931 |
Earthquake activity:
Chula Vista-area historical earthquake activity is significantly above California state average. It is 5517% greater than the overall U.S. average.On 6/28/1992 at 11:57:34, a magnitude 7.6 (6.2 MB, 7.6 MS, 7.3 MW, Depth: 0.7 mi, Class: Major, Intensity: VIII - XII) earthquake occurred 111.7 miles away from Chula Vista center, causing 3 deaths (1 shaking deaths, 2 other deaths) and 400 injuries, causing $100,000,000 total damage and $40,000,000 insured losses
On 7/21/1952 at 11:52:14, a magnitude 7.7 (7.7 UK) earthquake occurred 198.7 miles away from the city center, causing $50,000,000 total damage
On 10/16/1999 at 09:46:44, a magnitude 7.4 (6.3 MB, 7.4 MS, 7.2 MW, 7.3 ML) earthquake occurred 135.2 miles away from the city center
On 5/19/1940 at 04:36:40, a magnitude 7.2 (7.2 UK) earthquake occurred 88.5 miles away from Chula Vista center, causing $33,000,000 total damage
On 12/31/1934 at 18:45:56, a magnitude 7.1 (7.1 UK) earthquake occurred 75.0 miles away from the city center
On 10/15/1979 at 23:16:54, a magnitude 7.0 (5.7 MB, 6.9 MS, 7.0 ML, 6.4 MW) earthquake occurred 83.0 miles away from Chula Vista center
Magnitude types: body-wave magnitude (MB), local magnitude (ML), surface-wave magnitude (MS), moment magnitude (MW)
Natural disasters:
The number of natural disasters in San Diego County (39) is a lot greater than the US average (15).Major Disasters (Presidential) Declared: 21
Emergencies Declared: 2
Causes of natural disasters: Fires: 21, Floods: 17, Storms: 9, Winter Storms: 6, Landslides: 5, Mudslides: 4, Freeze: 1, Heavy Rain: 1, Hurricane: 1, Tornado: 1, Other: 1 (Note: some incidents may be assigned to more than one category).
Hospitals in Chula Vista:
- BAYVIEW HOSPITAL AND MENTAL HEALTH SYS (provides emergency services, 330 MOSS ST)
- SHARP CHULA VISTA MEDICAL CENTER (Proprietary, 751 MEDICAL CENTER COURT)
- SWEDELIUS GROUP HOME (329A D STREET)
Nursing Homes in Chula Vista:
- COLLINGWOOD MANOR (553 F STREET)
- FREDERICKA MANOR CARE CENTER (111 THIRD AVENUE)
- VETERANS HOME OF CALIFORNIA - (700 EAST NAPLES COURT)
Dialysis Facilities in Chula Vista:
- DSI CHULA VISTA DIALYSIS (1181 BROADWAY, SUITE 5)
- FMC-BALBOA SOUTH BAY HOME THERAPIES (340 4TH AVENUE, SUITE 18)
- FMC-BALBOA-MARINA BAY (630 BAY BLVD., SUITE 101)
- HOME DIALYSIS THERAPIES OF SAN DIEGO-SOUTH (678 3RD AVENUE, SUITE 210)
Home Health Centers in Chula Vista:
Airports located in Chula Vista:
- John Nichol's Field Airport (0CL3) (Runways: 2)
Amtrak station near Chula Vista:
- 10 miles: SAN DIEGO (1050 KETTNER BLVD.) . Services: ticket office, fully wheelchair accessible, enclosed waiting area, public restrooms, public payphones, full-service food facilities, paid short-term parking, paid long-term parking, call for car rental service, taxi stand, public transit connection.
Colleges/Universities in Chula Vista:
- Southwestern College (Full-time enrollment: 10,761; Location: 900 Otay Lakes Rd; Public; Website: www.swccd.edu/)
- Pima Medical Institute-Chula Vista (Full-time enrollment: 1,497; Location: 780 Bay Blvd Suite101; Private, for-profit; Website: pmi.edu)
- Kaplan College-Chula Vista (Full-time enrollment: 485; Location: 555 Broadway Suite 144; Private, for-profit; Website: www.kaplancollege.com/chula-vista-ca/)
- United States University (Full-time enrollment: 212; Location: 830 Bay Boulevard; Private, for-profit; Website: www.usuniversity.edu; Offers Master's degree)
- San Joaquin Valley College-San Diego (Full-time enrollment: 5; Location: 333 H Street Suite 1065; Private, for-profit; Website: www.sjvc.edu/)
Other colleges/universities with over 2000 students near Chula Vista:
- San Diego City College (about 9 miles; San Diego, CA; Full-time enrollment: 7,972)
- Cuyamaca College (about 11 miles; El Cajon, CA; FT enrollment: 4,270)
- San Diego State University (about 11 miles; San Diego, CA; FT enrollment: 27,516)
- The Art Institute of California-Argosy University San Diego (about 13 miles; San Diego, CA; FT enrollment: 2,180)
- University of San Diego (about 13 miles; San Diego, CA; FT enrollment: 7,589)
- University of Phoenix-San Diego Campus (about 13 miles; San Diego, CA; FT enrollment: 5,159)
- Point Loma Nazarene University (about 14 miles; San Diego, CA; FT enrollment: 3,189)
Biggest public high schools in Chula Vista:
- CHULA VISTA SENIOR HIGH (Students: 1,936, Location: 820 FOURTH AVE., Grades: 9-12)
- OTAY RANCH SENIOR HIGH (Students: 1,856, Location: 1250 OLYMPIC PKWY., Grades: 9-12)
- HILLTOP SENIOR HIGH (Students: 1,785, Location: 555 CLAIRE AVE., Grades: 9-12)
- EASTLAKE HIGH (Students: 1,775, Location: 1120 E.LAKE PKWY., Grades: 9-12)
- BONITA VISTA SENIOR HIGH (Students: 1,700, Location: 751 OTAY LAKES RD., Grades: 9-12)
- CASTLE PARK SENIOR HIGH (Students: 1,141, Location: 1395 HILLTOP DR., Grades: 9-12)
- OLYMPIAN HIGH (Students: 1,011, Location: 1925 MAGDALENA AVE., Grades: 9-12)
- MUELLER CHARTER (ROBERT L.) (Students: 679, Location: 715 I ST., Grades: KG-9, Charter school)
- CHULA VISTA LEARNING COMMUNITY CHARTER (Students: 418, Location: 590 K ST., Grades: KG-11, Charter school)
- OPTIONS SECONDARY (Students: 236, Location: 467 MOSS ST., Grades: 7-12)
Private high schools in Chula Vista:
- MATER DEI CATHOLIC HIGH SCHOOL (Students: 677, Location: 1615 MATER DEI DR, Grades: 9-12)
- CALVARY CHRISTIAN ACADEMY (Students: 426, Location: 1771 E PALOMAR ST, Grades: PK-12)
- LUTHERAN HIGH SCHOOL OF SAN DIEGO (Students: 77, Location: 810 BUENA VISTA WAY, Grades: 9-12)
- SOUTH BAY CHRISTIAN ACADEMY (Students: 22, Location: 395 D ST, Grades: KG-12)
Biggest public elementary/middle schools in Chula Vista:
- RANCHO DEL REY MIDDLE (Students: 1,572, Location: 1174 E. J ST., Grades: 7-8)
- EASTLAKE MIDDLE (Students: 1,488, Location: 900 DUNCAN RANCH RD., Grades: 7-8)
- HILLTOP MIDDLE (Students: 1,164, Location: 44 E. J ST., Grades: 7-8)
- BONITA VISTA MIDDLE (Students: 1,078, Location: 650 OTAY LAKES RD., Grades: 7-8)
- CASTLE PARK MIDDLE (Students: 1,059, Location: 160 QUINTARD ST., Grades: 7-8)
- CHULA VISTA MIDDLE (Students: 1,030, Location: 415 FIFTH AVE., Grades: 7-8)
- HEDENKAMP (ANNE AND WILLIAM) ELEMENTARY (Students: 712, Location: 930 E. PALOMAR, Grades: KG-6)
- FEASTER (MAE L.) CHARTER (Students: 696, Location: 670 FLOWER ST., Grades: KG-8, Charter school)
- SALT CREEK ELEMENTARY (Students: 633, Location: 1055 HUNTE PKWY., Grades: KG-6)
- ARROYO VISTA CHARTER (Students: 579, Location: 2491 SCH HOUSE RD., Grades: KG-8, Charter school)
Private elementary/middle schools in Chula Vista:
- ST ROSE OF LIMA SCHOOL (Students: 368, Location: 278 ALVARADO ST # B, Grades: PK-8)
- ST JOHN'S EPISCOPAL SCHOOL (Students: 364, Location: 760 1ST AVE, Grades: PK-8)
- ST PIUS X SCHOOL (Students: 284, Location: 37 E EMERSON ST, Grades: PK-8)
- BONITA ROAD CHRISTIAN SCHOOL (Students: 252, Location: 73 E BONITA RD, Grades: PK-6)
- PILGRIM LUTHERAN SCHOOL (Students: 182, Location: 497 E ST, Grades: PK-8)
- SOUTHWESTERN CHRISTIAN SCHOOL (Students: 126, Location: 482 L ST, Grades: KG-8)
- BONITA COUNTRY DAY SCHOOL (Students: 88, Location: 625 OTAY LAKES RD, Grades: PK-3)
- MONTESSORI EXPLORER ELEMENTARY (Students: 37, Location: 271 E J ST, Grades: PK-3)
Points of interest:
Notable locations in Chula Vista: Otay Ranch (A), Rancho del Otay (B), Eastlake Greens Golf Course (C), Otay Landfill (D), Fenton Ranch (E), Chula Vista Junction (F), Bird Ranch (G), San Diego Country Club (H), Chula Vista Municipal Golf Course (I), Woodlawn Park Branch Chula Vista Public Library (J), Castle Park-Otay Branch Chula Vista Public Library (K), Chula Vista Library (L), Chula Vista Chamber of Commerce (M), Chula Vista Nature Interpretive Center (N), Chula Vista Fire Department Station 6 (O), Chula Vista Fire Department Station 7 (P), Chula Vista Fire Department Station 5 (Q), Chula Vista Fire Department Station 4 (R), Chula Vista Fire Department Station 8 (S), Chula Vista Fire Department Station 2 (T). Display/hide their locations on the map
Shopping Centers: Price Bazaar Shopping Center (1), Oxford Shopping Center (2), Genesis Square Shopping Center (3), Florence Shopping Center (4), Country Club Square Shopping Center (5), Country Club Shopping Center (6), Southwestern College Estates Shopping Center (7), Rio Sweetwater Plaza Shopping Center (8), Chula Vista Square Shopping Center (9). Display/hide their locations on the map
Churches in Chula Vista include: Assembly of God Church (A), Church of the Nazarene (B), First Christian Church (C), First Church of Christ (D), First Church of Christ Scientist (E), First Community Congregational Church (F), First Methodist Church (G), Pilgrim Lutheran Church (H), Saint Johns Episcopal Church (I). Display/hide their locations on the map
Reservoirs and swamps: River Botton Reservoir (A), Eastlake Reservoir (B), Sweetwater Marsh (C). Display/hide their locations on the map
Rivers and creeks: Sweetwater River (A), Salt Creek (B), Paradise Creek (C). Display/hide their locations on the map
Parks in Chula Vista include: Chula Vista Bay Front Park (1), Lauderbach Park (2), Los Ninos Park (3), Marina View Park (4), Otay Park (5), Palomar Park (6), Sunbow Park (7), Valle Lindo Park (8), General Roca Park (9). Display/hide their locations on the map
Tourist attractions: Chula Vista City - Libraries- Eastlake Branch-Eastlake High School Ca (Cultural Attractions- Events- & Facilities; 1120 Eastlake Parkway) (1), Chula Vista City - Libraries- Civic Center Branch (Cultural Attractions- Events- & Facilities; 365 F Street) (2), Chula Vista City - Libraries- South Chula Vista Branch (Cultural Attractions- Events- & Facilities; 389 Orange Avenue) (3), Chula Vista Convention & Visitors Bureau (Cultural Attractions- Events- & Facilities; 750 E Street) (4), Chamber of Commerce of Chula Vista (233 4th Avenue) (5), Brunswick Premier Lanes (845 Lazo Court) (6). Display/hide their approximate locations on the map
Hotels: Best Western Chula Vista Inn (946 Broadway) (1), Bay Cities Motel (864 Broadway) (2), Big 7 Motel (333 Broadway) (3). Display/hide their approximate locations on the map
Birthplace of: Jessica Sanchez - Singer, Joel Zumaya - Baseball player, Charles E. Whittingham - Horse trainer, Craig Coxe - Ice hockey player, Derek Sherrod - Football player, Mike Jacobs - 2005 Major League Baseball player (New York Mets, born: Oct 30, 1980), Mike Jacobs (first baseman) - Baseball player, Ruth Hayward - Artist, Zeke Moreno - 2005 NFL player (Houston Texans, born: Oct 10, 1978), John Jaso - Baseball player.
Drinking water stations with addresses in Chula Vista and their reported violations in the past:
SOUTH BAY ROD & GUN CLUB, INC. (Population served: 200, Groundwater):Past health violations:Past monitoring violations:
- MCL, Monthly (TCR) - Between JAN-2008 and MAR-2008, Contaminant: Coliform
- MCL, Monthly (TCR) - Between JAN-2008 and MAR-2008, Contaminant: Coliform. Follow-up actions: St Boil Water Order (FEB-06-2008)
- MCL, Monthly (TCR) - Between OCT-2007 and DEC-2007, Contaminant: Coliform. Follow-up actions: St Boil Water Order (OCT-26-2007)
- MCL, Monthly (TCR) - Between OCT-2007 and DEC-2007, Contaminant: Coliform
- 5 routine major monitoring violations
| This city: | 3.2 people |
| California: | 2.9 people |
| This city: | 78.7% |
| Whole state: | 68.7% |
| This city: | 5.6% |
| Whole state: | 7.2% |
Likely homosexual households (counted as self-reported same-sex unmarried-partner households)
- Lesbian couples: 0.3% of all households
- Gay men: 0.3% of all households
People in group quarters in Chula Vista in 2010:
- 538 people in nursing facilities/skilled-nursing facilities
- 428 people in local jails and other municipal confinement facilities
- 322 people in group homes intended for adults
- 224 people in other noninstitutional facilities
- 80 people in residential treatment centers for juveniles (non-correctional)
- 71 people in workers' group living quarters and job corps centers
- 33 people in residential treatment centers for adults
- 22 people in in-patient hospice facilities
- 7 people in group homes for juveniles (non-correctional)
- 6 people in emergency and transitional shelters (with sleeping facilities) for people experiencing homelessness
- 5 people in correctional residential facilities
People in group quarters in Chula Vista in 2000:
- 379 people in local jails and other confinement facilities (including police lockups)
- 252 people in other noninstitutional group quarters
- 165 people in nursing homes
- 126 people in other group homes
- 85 people in hospitals/wards and hospices for chronically ill
- 85 people in other hospitals or wards for chronically ill
- 24 people in homes or halfway houses for drug/alcohol abuse
- 23 people in homes for the mentally ill
- 13 people in mental (psychiatric) hospitals or wards
- 5 people in hospitals or wards for drug/alcohol abuse
- 4 people in homes for the mentally retarded
- 3 people in religious group quarters
Banks with most branches in Chula Vista (2011 data):
- JPMorgan Chase Bank, National Association: 8 branches. Info updated 2011/11/10: Bank assets: $1,811,678.0 mil, Deposits: $1,190,738.0 mil, headquarters in Columbus, OH, positive income, International Specialization, 5577 total offices, Holding Company: Jpmorgan Chase & Co.
- Wells Fargo Bank, National Association: 7 branches. Info updated 2011/04/05: Bank assets: $1,161,490.0 mil, Deposits: $905,653.0 mil, headquarters in Sioux Falls, SD, positive income, 6395 total offices, Holding Company: Wells Fargo & Company
- Bank of America, National Association: Otay Ranch Town Center Night Deposit, Otay Ranch Branch, Chula Vista Main Branch, Third And K Branch, Eastlake Village Branch. Info updated 2009/11/18: Bank assets: $1,451,969.3 mil, Deposits: $1,077,176.8 mil, headquarters in Charlotte, NC, positive income, 5782 total offices, Holding Company: Bank Of America Corporation
- Union Bank, National Association: Bonita Point Branch, Eastlake Branch, Castle Park Branch, Chula Vista Branch. Info updated 2011/09/01: Bank assets: $88,967.5 mil, Deposits: $65,286.4 mil, headquarters in San Francisco, CA, positive income, Commercial Lending Specialization, 403 total offices, Holding Company: Mitsubishi Ufj Financial Group, Inc.
- U.S. Bank National Association: Chula Vista Center City Branch, Eastlake Branch, Chula Vista Ralphs Branch, Otay Ranch Vons Branch. Info updated 2012/01/30: Bank assets: $330,470.8 mil, Deposits: $236,091.5 mil, headquarters in Cincinnati, OH, positive income, 3121 total offices, Holding Company: U.S. Bancorp
- First Bank: Eastlake Branch at 2314 Proctor Valley Road, branch established on 2007/06/25; Chula Vista Branch at 318 Fourth Avenue, branch established on 1980/07/17. Info updated 2007/12/04: Bank assets: $6,579.8 mil, Deposits: $5,800.6 mil, headquarters in Creve Coeur, MO, negative income in the last year, Commercial Lending Specialization, 148 total offices, Holding Company: First Banks, Inc.
- Pacific Trust Bank, FSB: Bfg Chula Vista Branch at 850 Lagoon Drive, branch established on 1995/01/05; F Street Branch at 279 F Street, branch established on 2000/01/01. Info updated 2012/02/15: Bank assets: $984.3 mil, Deposits: $831.9 mil, headquarters in Irvine, CA, positive income, Mortgage Lending Specialization, 11 total offices
- Citibank, National Association: Otay Lakes Road Branch at 2240 Otay Lakes Road, Suite 304-3, branch established on 1998/09/11; H Street Branch at 352 H Street, branch established on 1972/01/01. Info updated 2012/01/10: Bank assets: $1,288,658.0 mil, Deposits: $882,541.0 mil, headquarters in Sioux Falls, SD, positive income, International Specialization, 1048 total offices, Holding Company: Citigroup Inc.
- Vibra Bank: at 530 Broadway, branch established on 2008/07/10. Info updated 2008/07/23: Bank assets: $104.4 mil, Deposits: $90.1 mil, local headquarters, positive income, Commercial Lending Specialization, 1 total offices
- 6 other banks with 6 local branches
For population 15 years and over in Chula Vista:
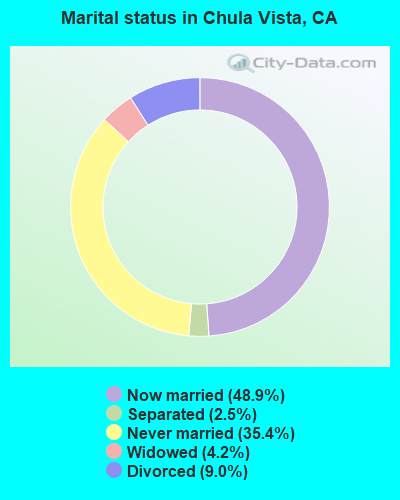
- Never married: 35.4%
- Now married: 48.9%
- Separated: 2.5%
- Widowed: 4.2%
- Divorced: 9.0%
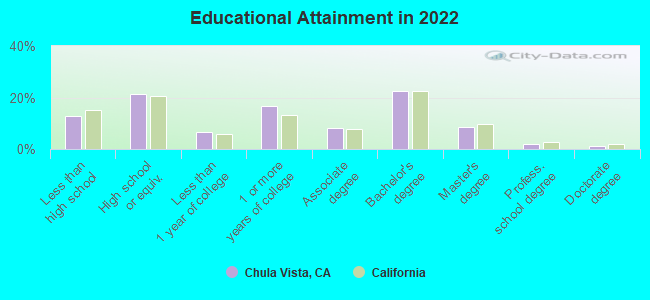
For population 25 years and over in Chula Vista:
- High school or higher: 87.1%
- Bachelor's degree or higher: 34.2%
- Graduate or professional degree: 11.6%
- Unemployed: 6.4%
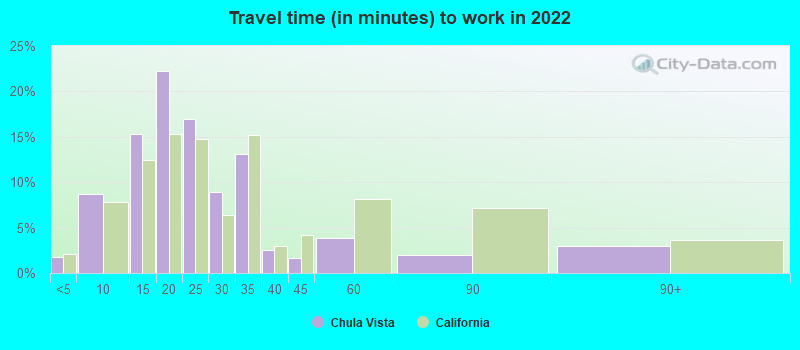
- Mean travel time to work (commute): 25.9 minutes
| Here: | 13.7 |
| California average: | 15.5 |
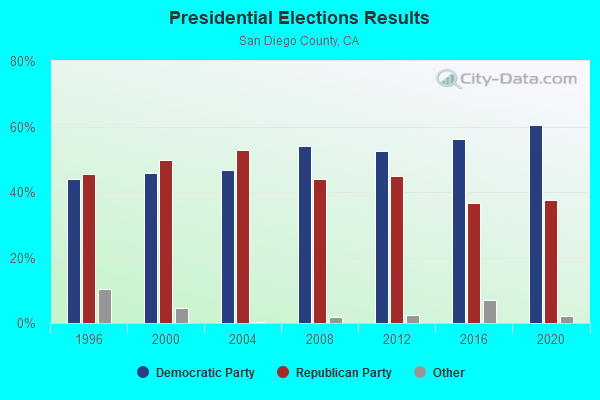
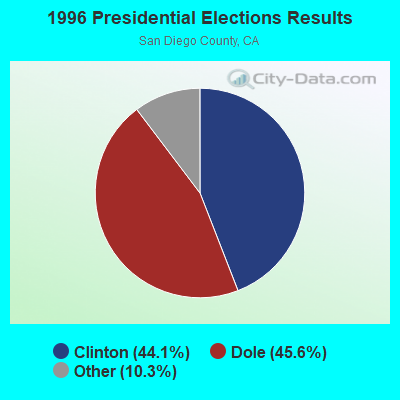
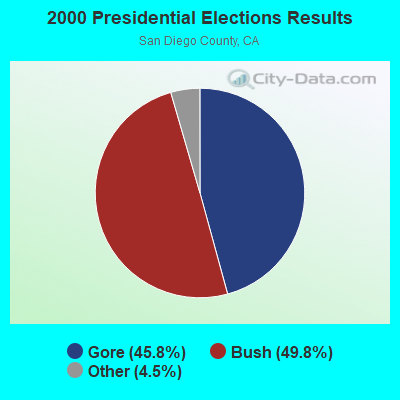
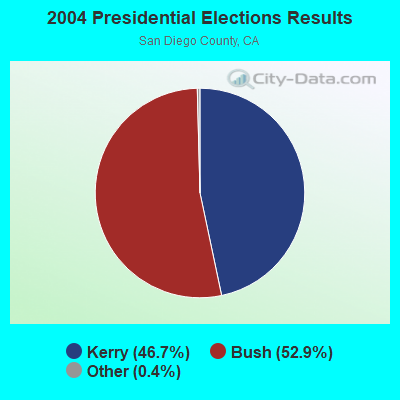
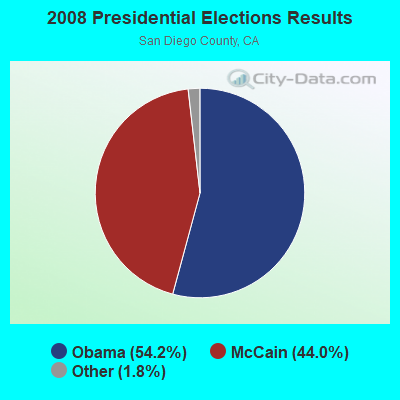
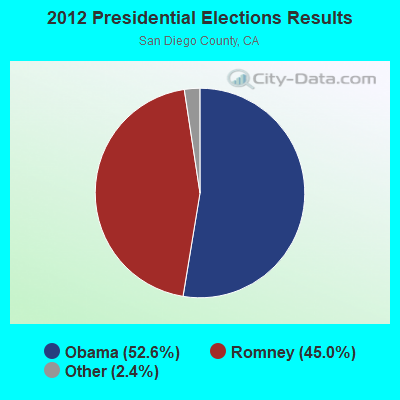
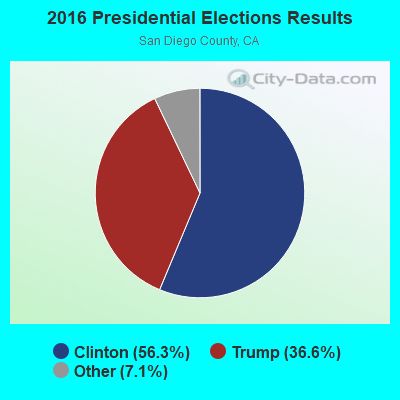
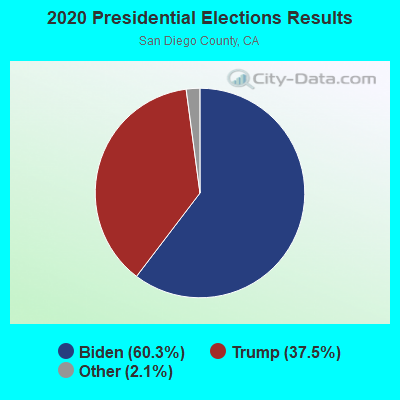
Graphs represent county-level data. Detailed 2008 Election Results
Neighborhoods in Chula Vista:
(Chula Vista, California Neighborhood Map)- Amphitheater neighborhood
- Bayfront neighborhood
- Bella Lago neighborhood
- Bonita Meadows neighborhood
- Castle Park neighborhood
- Downtown Third Avenue District neighborhood
- Eastlake neighborhood
- Eastlake III Vistas neighborhood
- Eastlake III Woods neighborhood
- H Street Corridor District neighborhood
- Interstate 5 Corridor District neighborhood
- Lower Sweetwater neighborhood
- McMillin Otay Ranch Spa neighborhood
- Mid-Broadway District neighborhood
- Northwest Chula Vista Area neighborhood
- Olympic Training Center neighborhood
- Otay neighborhood
- Otay Ranch neighborhood
- Otay Ranch Village neighborhood
- Park View Estates neighborhood
- Rancho del Rey neighborhood
- Rolling Hills Ranch neighborhood
- Salt Creek neighborhood
- Salt Creek Ranch neighborhood
- San Miguel Ranch neighborhood
- South Broadway District neighborhood
- South Third Avenue District neighborhood
- South West Chula Vista neighborhood
- Sunbow neighborhood
- Telegraph Canyon Estates neighborhood
- Telegraph Estates neighborhood
- Terra Nova neighborhood
- Urban Core neighborhood
- Village Center neighborhood
- Watson Land Company neighborhood
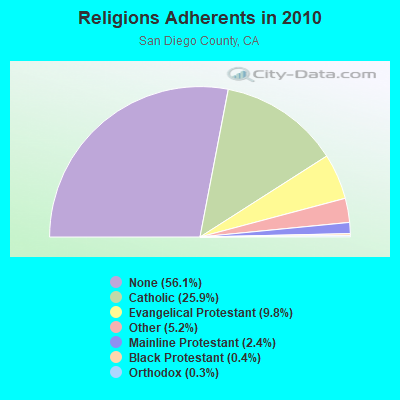
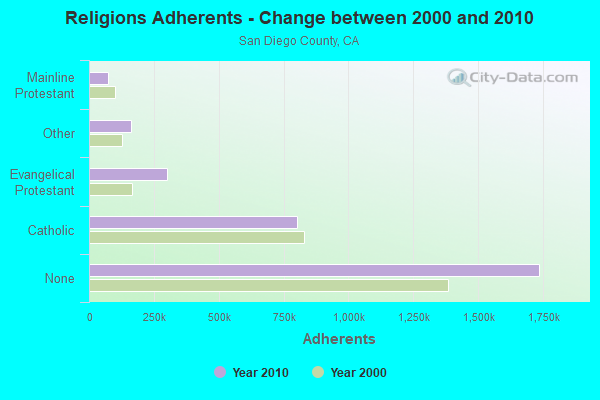
Religion statistics for Chula Vista, CA (based on San Diego County data)
| Religion | Adherents | Congregations |
|---|---|---|
| Catholic | 801,850 | 115 |
| Evangelical Protestant | 302,320 | 974 |
| Other | 161,530 | 349 |
| Mainline Protestant | 74,992 | 211 |
| Black Protestant | 10,857 | 52 |
| Orthodox | 7,828 | 19 |
| None | 1,735,936 | - |
Food Environment Statistics:
| San Diego County: | 1.94 / 10,000 pop. |
| California: | 2.14 / 10,000 pop. |
| San Diego County: | 0.06 / 10,000 pop. |
| State: | 0.04 / 10,000 pop. |
| This county: | 0.77 / 10,000 pop. |
| California: | 0.62 / 10,000 pop. |
| This county: | 1.65 / 10,000 pop. |
| California: | 1.49 / 10,000 pop. |
| Here: | 7.56 / 10,000 pop. |
| California: | 7.42 / 10,000 pop. |
| San Diego County: | 6.5% |
| California: | 7.3% |
| Here: | 22.2% |
| California: | 21.3% |
| San Diego County: | 16.0% |
| California: | 17.9% |
Health and Nutrition:
| This city: | 50.1% |
| California: | 49.4% |
| Chula Vista: | 49.3% |
| California: | 48.0% |
| Chula Vista: | 28.2 |
| California: | 28.1 |
| Chula Vista: | 19.8% |
| California: | 20.2% |
| Chula Vista: | 11.7% |
| California: | 11.2% |
| Here: | 6.8 |
| California: | 6.8 |
| Chula Vista: | 32.4% |
| State: | 31.5% |
| Chula Vista: | 56.6% |
| California: | 56.4% |
| Chula Vista: | 81.6% |
| State: | 80.9% |
More about Health and Nutrition of Chula Vista, CA Residents
| Local government employment and payroll (March 2022) | |||||
| Function | Full-time employees | Monthly full-time payroll | Average yearly full-time wage | Part-time employees | Monthly part-time payroll |
|---|---|---|---|---|---|
| Police Protection - Officers | 214 | $2,511,372 | $140,825 | 0 | $0 |
| Police - Other | 136 | $1,075,884 | $94,931 | 11 | $26,988 |
| Firefighters | 123 | $1,918,302 | $187,151 | 0 | $0 |
| Streets and Highways | 111 | $808,334 | $87,387 | 7 | $17,236 |
| Other and Unallocable | 100 | $878,356 | $105,403 | 25 | $38,243 |
| Health | 47 | $506,726 | $129,377 | 5 | $4,398 |
| Parks and Recreation | 46 | $337,603 | $88,070 | 163 | $147,469 |
| Sewerage | 45 | $423,183 | $112,849 | 3 | $2,662 |
| Other Government Administration | 38 | $400,961 | $126,619 | 5 | $10,252 |
| Financial Administration | 36 | $379,431 | $126,477 | 5 | $7,086 |
| Fire - Other | 30 | $217,963 | $87,185 | 2 | $4,475 |
| Local Libraries | 23 | $157,555 | $82,203 | 38 | $55,397 |
| Judicial and Legal | 14 | $176,242 | $151,065 | 0 | $0 |
| Totals for Government | 963 | $9,791,912 | $122,018 | 264 | $314,205 |
Chula Vista government finances - Expenditure in 2021 (per resident):
- Construction - Regular Highways: $41,146,000 ($147.39)
General - Other: $27,513,000 ($98.55)
Local Fire Protection: $13,909,000 ($49.82)
Parks and Recreation: $5,564,000 ($19.93)
Sewerage: $3,037,000 ($10.88)
Police Protection: $1,729,000 ($6.19)
General Public Buildings: $1,592,000 ($5.70)
Housing and Community Development: $566,000 ($2.03)
Libraries: $415,000 ($1.49)
Health - Other: $22,000 ($0.08)
- Current Operations - Police Protection: $171,078,000 ($612.81)
Local Fire Protection: $107,940,000 ($386.65)
Central Staff Services: $92,795,000 ($332.40)
Parks and Recreation: $59,934,000 ($214.69)
Financial Administration: $57,090,000 ($204.50)
Protective Inspection and Regulation - Other: $53,933,000 ($193.19)
Sewerage: $33,169,000 ($118.81)
Regular Highways: $18,426,000 ($66.00)
Libraries: $10,740,000 ($38.47)
General - Other: $10,340,000 ($37.04)
Housing and Community Development: $6,426,000 ($23.02)
Health - Other: $6,140,000 ($21.99)
Transit Utilities: $3,115,000 ($11.16)
Judicial and Legal Services: $3,024,000 ($10.83)
Solid Waste Management: $1,614,000 ($5.78)
Parking Facilities: $516,000 ($1.85)
- General - Interest on Debt: $20,948,000 ($75.04)
- Other Capital Outlay - General - Other: $5,393,000 ($19.32)
Police Protection: $2,519,000 ($9.02)
Sewerage: $635,000 ($2.27)
Local Fire Protection: $447,000 ($1.60)
General Public Building: $162,000 ($0.58)
Parks and Recreation: $58,000 ($0.21)
- Transit Utilities - Interest on Debt: $79,000 ($0.28)
Chula Vista government finances - Revenue in 2021 (per resident):
- Charges - Other: $50,977,000 ($182.60)
Sewerage: $43,052,000 ($154.21)
Sea and Inland Port Facilities: $1,104,000 ($3.95)
Parks and Recreation: $323,000 ($1.16)
Parking Facilities: $246,000 ($0.88)
Housing and Community Development: $147,000 ($0.53)
- Federal Intergovernmental - Other: $19,659,000 ($70.42)
Housing and Community Development: $573,000 ($2.05)
- Local Intergovernmental - Other: $2,486,000 ($8.90)
- Miscellaneous - Special Assessments: $25,352,000 ($90.81)
General Revenue - Other: $19,427,000 ($69.59)
Interest Earnings: $6,853,000 ($24.55)
Rents: $1,966,000 ($7.04)
Fines and Forfeits: $1,368,000 ($4.90)
Donations From Private Sources: $62,000 ($0.22)
- Revenue - Transit Utilities: $6,656,000 ($23.84)
- State Intergovernmental - Other: $20,782,000 ($74.44)
Highways: $11,014,000 ($39.45)
General Local Government Support: $220,000 ($0.79)
- Tax - General Sales and Gross Receipts: $104,767,000 ($375.28)
Property: $65,643,000 ($235.14)
Public Utilities Sales: $17,046,000 ($61.06)
Other Selective Sales: $5,271,000 ($18.88)
Other License: $1,998,000 ($7.16)
Occupation and Business License - Other: $1,680,000 ($6.02)
Documentary and Stock Transfer: $1,486,000 ($5.32)
Other: $245,000 ($0.88)
Chula Vista government finances - Debt in 2021 (per resident):
- Long Term Debt - Outstanding Unspecified Public Purpose: $918,276,000 ($3289.31)
Beginning Outstanding - Unspecified Public Purpose: $869,087,000 ($3113.11)
Beginning Outstanding - Public Debt for Private Purpose: $534,065,000 ($1913.05)
Outstanding Nonguaranteed - Industrial Revenue: $529,005,000 ($1894.92)
Issue, Unspecified Public Purpose: $361,291,000 ($1294.16)
Retired Unspecified Public Purpose: $312,102,000 ($1117.96)
Retired Nonguaranteed - Public Debt for Private Purpose: $5,060,000 ($18.13)
Chula Vista government finances - Cash and Securities in 2021 (per resident):
- Bond Funds - Cash and Securities: $115,644,000 ($414.24)
- Other Funds - Cash and Securities: $271,406,000 ($972.19)
- Sinking Funds - Cash and Securities: $542,974,000 ($1944.96)
5.18% of this county's 2021 resident taxpayers lived in other counties in 2020 ($90,734 average adjusted gross income)
| Here: | 5.18% |
| California average: | 5.19% |
0.14% of residents moved from foreign countries ($1,493 average AGI)
San Diego County: 0.14% California average: 0.03%
Top counties from which taxpayers relocated into this county between 2020 and 2021:
| from Los Angeles County, CA | |
| from Riverside County, CA | |
| from Orange County, CA |
5.71% of this county's 2020 resident taxpayers moved to other counties in 2021 ($83,556 average adjusted gross income)
| Here: | 5.71% |
| California average: | 6.14% |
0.09% of residents moved to foreign countries ($1,067 average AGI)
San Diego County: 0.09% California average: 0.02%
Top counties to which taxpayers relocated from this county between 2020 and 2021:
| to Riverside County, CA | |
| to Los Angeles County, CA | |
| to Orange County, CA |
| Businesses in Chula Vista, CA | ||||
| Name | Count | Name | Count | |
|---|---|---|---|---|
| 24 Hour Fitness | 3 | JoS. A. Bank | 1 | |
| 7-Eleven | 15 | Jones New York | 2 | |
| ALDO | 1 | Justice | 1 | |
| AT&T | 5 | KFC | 3 | |
| Aeropostale | 2 | Kmart | 1 | |
| Albertsons | 2 | Kohl's | 2 | |
| American Eagle Outfitters | 1 | Kroger | 3 | |
| Ann Taylor | 1 | LA Fitness | 1 | |
| Apple Store | 1 | La Quinta | 1 | |
| Arby's | 1 | LensCrafters | 1 | |
| Ashley Furniture | 1 | Little Caesars Pizza | 5 | |
| AutoZone | 4 | Long John Silver's | 1 | |
| Banana Republic | 1 | Lowe's | 1 | |
| Barnes & Noble | 1 | Macy's | 2 | |
| Bath & Body Works | 2 | Marshalls | 1 | |
| Bebe | 1 | McDonald's | 10 | |
| Bed Bath & Beyond | 1 | Men's Wearhouse | 1 | |
| Best Western | 3 | Motherhood Maternity | 2 | |
| Big O Tires | 1 | New Balance | 1 | |
| Blockbuster | 5 | New York & Co | 1 | |
| Brunswick Bowling & Billiards | 1 | Nike | 18 | |
| Budget Car Rental | 1 | Nissan | 1 | |
| Burger King | 4 | Office Depot | 2 | |
| Burlington Coat Factory | 1 | Olive Garden | 1 | |
| CVS | 6 | Pac Sun | 2 | |
| Carl\s Jr. | 5 | Panda Express | 4 | |
| Catherines | 1 | Panera Bread | 2 | |
| Charlotte Russe | 1 | Papa John's Pizza | 2 | |
| Chick-Fil-A | 1 | Payless | 6 | |
| Chico's | 1 | Penske | 1 | |
| Church's Chicken | 1 | PetSmart | 2 | |
| Circle K | 5 | Pier 1 Imports | 2 | |
| Cold Stone Creamery | 3 | Pizza Hut | 4 | |
| Coldwater Creek | 2 | Quiznos | 1 | |
| ColorTyme | 1 | RadioShack | 3 | |
| Costco | 2 | Ramada | 1 | |
| Cricket Wireless | 8 | Red Lobster | 1 | |
| Curves | 1 | Rite Aid | 4 | |
| DHL | 3 | SAS Shoes | 1 | |
| Dairy Queen | 1 | Safeway | 5 | |
| Days Inn | 1 | Sears | 3 | |
| Dennys | 2 | Sephora | 1 | |
| Discount Tire | 1 | Sprint Nextel | 8 | |
| Domino's Pizza | 2 | Staples | 1 | |
| El Pollo Loco | 1 | Starbucks | 11 | |
| Express | 1 | Subway | 14 | |
| FedEx | 16 | T-Mobile | 14 | |
| Firestone Complete Auto Care | 1 | Taco Bell | 3 | |
| Foot Locker | 1 | Target | 3 | |
| GNC | 3 | The Cheesecake Factory | 1 | |
| GameStop | 6 | The Room Place | 1 | |
| Gap | 1 | Toyota | 1 | |
| Goodwill | 1 | Toys"R"Us | 3 | |
| Gymboree | 1 | Trader Joe's | 1 | |
| H&M | 1 | U-Haul | 4 | |
| H&R Block | 8 | UPS | 18 | |
| Hollister Co. | 1 | Vans | 8 | |
| Home Depot | 2 | Verizon Wireless | 6 | |
| HomeTown Buffet | 1 | Victoria's Secret | 2 | |
| Honda | 1 | Vons | 5 | |
| Hot Topic | 1 | Walgreens | 3 | |
| IHOP | 2 | Walmart | 3 | |
| JCPenney | 1 | Wendy's | 2 | |
| Jamba Juice | 2 | YMCA | 1 | |
Strongest AM radio stations in Chula Vista:
- KFMB (760 AM; 50 kW; SAN DIEGO, CA; Owner: MIDWEST TELEVISION, INC.)
- KCBQ (1170 AM; 50 kW; SAN DIEGO, CA; Owner: RADIO 1210, INC.)
- KOGO (600 AM; 5 kW; SAN DIEGO, CA; Owner: CITICASTERS LICENSES, L.P.)
- KURS (1040 AM; 5 kW; SAN DIEGO, CA; Owner: QUETZAL BILINGUAL COMMUNICATIONS INC)
- KPOP (1360 AM; 5 kW; SAN DIEGO, CA; Owner: CITICASTERS LICENSES, L.P.)
- KSDO (1130 AM; 10 kW; SAN DIEGO, CA; Owner: HI-FAVOR BROADCASTING, LLC)
- KSON (1240 AM; 1 kW; SAN DIEGO, CA; Owner: JEFFERSON-PILOT COMMUNICATIONS COMPANY OF CALIFORNIA)
- KPRZ (1210 AM; 20 kW; SAN MARCOS, CA; Owner: RADIO 1210, INC.)
- KECR (910 AM; 5 kW; EL CAJON, CA; Owner: FAMILY STATIONS, INC.)
- KFI (640 AM; 50 kW; LOS ANGELES, CA; Owner: CAPSTAR TX LIMITED PARTNERSHIP)
- KPLS (830 AM; 50 kW; ORANGE, CA; Owner: CRN LICENSES, LLC)
- KLAC (570 AM; 50 kW; LOS ANGELES, CA; Owner: AMFM RADIO LICENSES, L.L.C.)
- KTNQ (1020 AM; 50 kW; LOS ANGELES, CA; Owner: KTNQ-AM LICENSE CORP.)
Strongest FM radio stations in Chula Vista:
- KHTS-FM (93.3 FM; EL CAJON, CA; Owner: CITICASTERS LICENSES, L.P.)
- K210CL (89.9 FM; LEMON GROVE, CA; Owner: SANTA MONICA COMMUNITY COLLEGE DISTRICT)
- KLNV (106.5 FM; SAN DIEGO, CA; Owner: HBC LICENSE CORPORATION)
- KPBS-FM (89.5 FM; SAN DIEGO, CA; Owner: THE BD. OF TRUSTEES, CALIFORNIA STATE UNIVERSITY)
- KIOZ (105.3 FM; SAN DIEGO, CA; Owner: CITICASTERS LICENSES, L.P.)
- KLQV (102.9 FM; SAN DIEGO, CA; Owner: HBC LICENSE CORPORATION)
- KGB-FM (101.5 FM; SAN DIEGO, CA; Owner: CITICASTERS LICENSES, L.P.)
- KSON-FM (97.3 FM; SAN DIEGO, CA; Owner: JEFFERSON-PILOT COMMUNICATIONS COMPANY OF CALIFORNIA)
- KWVE (107.9 FM; SAN CLEMENTE, CA; Owner: CALVARY CHAPEL OF COSTA MESA)
- KBZT (94.9 FM; SAN DIEGO, CA; Owner: JEFFERSON-PILOT COMMUNICATIONS COMPANY OF CALIFORNIA)
- KLVJ (100.1 FM; JULIAN, CA; Owner: EDUCATIONAL MEDIA FOUNDATION)
- KIFM (98.1 FM; SAN DIEGO, CA; Owner: JEFFERSON-PILOT COMMUNICATIONS COMPANY OF CALIFORNIA)
- KYXY (96.5 FM; SAN DIEGO, CA; Owner: INFINITY RADIO OPERATIONS INC.)
- KOCL (95.7 FM; CARLSBAD, CA; Owner: CITICASTERS LICENSES, L.P.)
- KRTM (88.9 FM; TEMECULA, CA; Owner: PENFOLD COMMUNICATIONS, INC.)
- KFMB-FM (100.7 FM; SAN DIEGO, CA; Owner: MIDWEST TELEVISION, INC.)
- KMYI (94.1 FM; SAN DIEGO, CA; Owner: CITICASTERS LICENSES, L.P.)
- KPLN (103.7 FM; SAN DIEGO, CA; Owner: INFINITY RADIO OPERATIONS INC.)
- KFSD-FM (92.1 FM; ESCONDIDO, CA; Owner: NORTH COUNTY BROADCASTING CORP.)
- KPRI (102.1 FM; ENCINITAS, CA; Owner: COMPASS RADIO OF SAN DIEGO, INC.)
TV broadcast stations around Chula Vista:
- KBNT-CA (Channel 17; SAN DIEGO, CA; Owner: ENTRAVISION HOLDINGS, L.L.C.)
- KBOP-LP (Channel 25; SAN DIEGO, CA; Owner: COMMERCIAL BROADCASTING CORP.)
- K63EN (Channel 63; SAN DIEGO, CA; Owner: CIVIC LIGHT, INC.)
- K61GH (Channel 61; NATIONAL CITY, CA; Owner: TV-61 SAN DIEGO, INC.)
- KSWB-TV (Channel 69; SAN DIEGO, CA; Owner: KSWB INC.)
- KUSI-TV (Channel 51; SAN DIEGO, CA; Owner: CHANNEL 51 OF SAN DIEGO, INC.)
- KPBS (Channel 15; SAN DIEGO, CA; Owner: BOARD OF TRUSTEES FOR SAN DIEGO UNIV.)
- KNSD (Channel 39; SAN DIEGO, CA; Owner: STATION VENTURE OPERATIONS, LP)
- KFMB-TV (Channel 8; SAN DIEGO, CA; Owner: MIDWEST TELEVISION, INC.)
- KGTV (Channel 10; SAN DIEGO, CA; Owner: MCGRAW-HILL BROADCASTING COMPANY, INC.)
- K59AL (Channel 59; LA JOLLA, CA; Owner: BOARD OF TRUSTEES FOR SAN DIEGO UNIVERSITY)
- KSDX-LP (Channel 29; SAN DIEGO, CA; Owner: KRCA LICENSE CORP.)
- National Bridge Inventory (NBI) Statistics
- 119Number of bridges
- 1,860ft / 567mTotal length
- $5,337,000Total costs
- 5,535,145Total average daily traffic
- 213,853Total average daily truck traffic
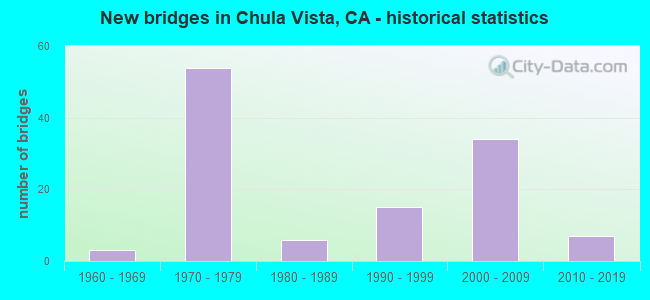
- New bridges - historical statistics
- 31960-1969
- 541970-1979
- 61980-1989
- 151990-1999
- 342000-2009
- 72010-2019
FCC Registered Antenna Towers: 180 (See the full list of FCC Registered Antenna Towers)
FCC Registered Private Land Mobile Towers: 19 (See the full list of FCC Registered Private Land Mobile Towers in Chula Vista, CA)
FCC Registered Broadcast Land Mobile Towers: 73 (See the full list of FCC Registered Broadcast Land Mobile Towers)
FCC Registered Microwave Towers: 92 (See the full list of FCC Registered Microwave Towers in this town)
FCC Registered Paging Towers: 6 (See the full list of FCC Registered Paging Towers)
FCC Registered Maritime Coast & Aviation Ground Towers: 3 (See the full list of FCC Registered Maritime Coast & Aviation Ground Towers)
FCC Registered Amateur Radio Licenses: 885 (See the full list of FCC Registered Amateur Radio Licenses in Chula Vista)
FAA Registered Aircraft: 59 (See the full list of FAA Registered Aircraft in Chula Vista)
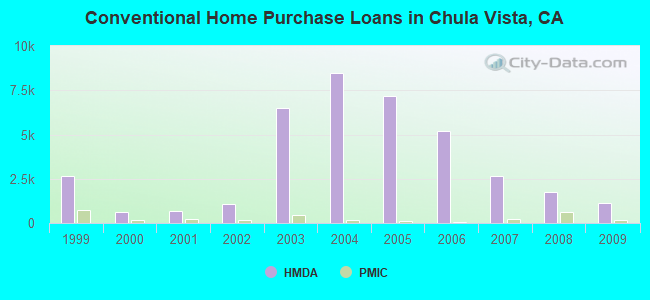
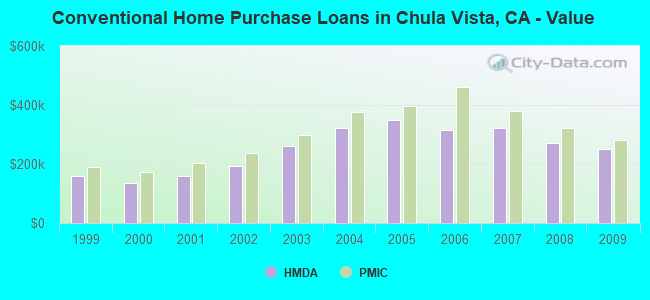
| Home Mortgage Disclosure Act Aggregated Statistics For Year 2009 (Based on 32 full and 10 partial tracts) | ||||||||||||||
| A) FHA, FSA/RHS & VA Home Purchase Loans | B) Conventional Home Purchase Loans | C) Refinancings | D) Home Improvement Loans | E) Loans on Dwellings For 5+ Families | F) Non-occupant Loans on < 5 Family Dwellings (A B C & D) | G) Loans On Manufactured Home Dwelling (A B C & D) | ||||||||
|---|---|---|---|---|---|---|---|---|---|---|---|---|---|---|
| Number | Average Value | Number | Average Value | Number | Average Value | Number | Average Value | Number | Average Value | Number | Average Value | Number | Average Value | |
| LOANS ORIGINATED | 2,020 | $301,283 | 1,109 | $249,583 | 2,366 | $275,187 | 103 | $117,965 | 10 | $6,580,761 | 372 | $207,275 | 10 | $77,334 |
| APPLICATIONS APPROVED, NOT ACCEPTED | 203 | $291,091 | 167 | $245,007 | 289 | $293,262 | 16 | $73,451 | 0 | $0 | 53 | $201,572 | 12 | $55,294 |
| APPLICATIONS DENIED | 359 | $296,334 | 300 | $234,088 | 1,029 | $301,273 | 73 | $93,603 | 0 | $0 | 155 | $206,299 | 24 | $72,902 |
| APPLICATIONS WITHDRAWN | 348 | $301,660 | 241 | $239,928 | 651 | $287,582 | 25 | $182,191 | 1 | $278,000 | 104 | $218,485 | 1 | $59,000 |
| FILES CLOSED FOR INCOMPLETENESS | 58 | $275,598 | 41 | $216,351 | 200 | $315,196 | 7 | $145,689 | 0 | $0 | 21 | $234,115 | 6 | $68,833 |
Detailed mortgage data for all 42 tracts in Chula Vista, CA
| Private Mortgage Insurance Companies Aggregated Statistics For Year 2009 (Based on 29 full and 10 partial tracts) | ||||||
| A) Conventional Home Purchase Loans | B) Refinancings | C) Non-occupant Loans on < 5 Family Dwellings (A & B) | ||||
|---|---|---|---|---|---|---|
| Number | Average Value | Number | Average Value | Number | Average Value | |
| LOANS ORIGINATED | 156 | $279,871 | 30 | $305,604 | 2 | $165,270 |
| APPLICATIONS APPROVED, NOT ACCEPTED | 80 | $282,177 | 19 | $346,084 | 3 | $179,840 |
| APPLICATIONS DENIED | 40 | $249,067 | 15 | $326,909 | 3 | $192,000 |
| APPLICATIONS WITHDRAWN | 13 | $233,097 | 4 | $290,500 | 0 | $0 |
| FILES CLOSED FOR INCOMPLETENESS | 16 | $293,809 | 0 | $0 | 0 | $0 |
2005 - 2018 National Fire Incident Reporting System (NFIRS) incidents
- Fire incident types reported to NFIRS in Chula Vista, CA
- 1,40241.8%Outside Fires
- 1,03030.7%Structure Fires
- 72621.7%Mobile Property/Vehicle Fires
- 1945.8%Other
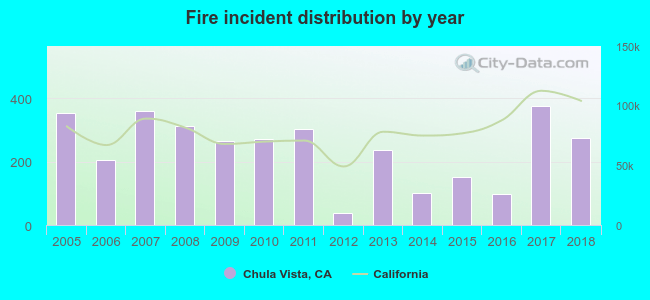 Based on the data from the years 2005 - 2018 the average number of fires per year is 239. The highest number of reported fire incidents - 377 took place in 2017, and the least - 39 in 2012. The data has a dropping trend.
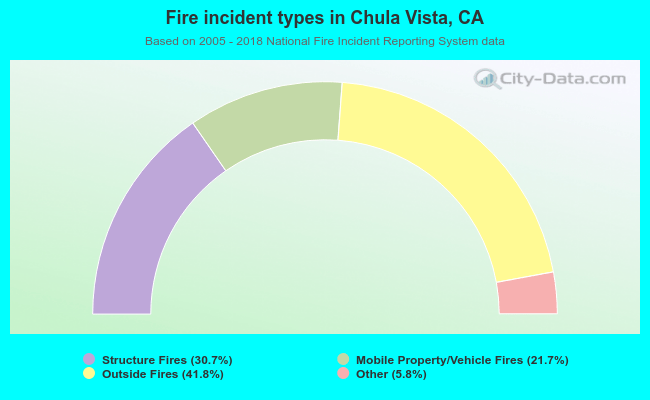 When looking into fire subcategories, the most reports belonged to: Outside Fires (41.8%), and Structure Fires (30.7%).
Fire-safe hotels and motels in Chula Vista, California:
- Howard Johnson By Wyndham San Diego Chula Vista Suites Hotel, 235 Woodlawn Ave, Chula Vista, California 91910 , Phone: (619) 427-9170, Fax: (619) 427-5247
- Good Nite Inn Chula Vista, 225 Bay Blvd, Chula Vista, California 91910 , Phone: (619) 425-8200, Fax: (619) 426-7411
- Days Inn San Diego Chula Vista South Bay, 699 E St, Chula Vista, California 91910 , Phone: (619) 585-1999, Fax: (619) 427-3748
- Rodeway Inn & Suites, 372 Broadway, Chula Vista, California 91910 , Phone: (619) 422-4242, Fax: (619) 422-5222
- Best Western Plus Otay Valley Hotel, 4450 Main St, Chula Vista, California 91911 , Phone: (619) 422-2600, Fax: (619) 425-4605
- Holiday Inn Express South San Diego - Chula Vista, 632 E St, Chula Vista, California 91910 , Phone: (619) 426-2500, Fax: (619) 476-8635
- Palomar Inn, 801 Palomar St, Chula Vista, California 91911 , Phone: (619) 423-8889, Fax: (619) 575-7595
- Comfort Inn - Chula Vista, 91 E Bonita Rd, Chula Vista, California 91910 , Phone: (619) 425-9999, Fax: (619) 425-8934
- 2 other hotels and motels
| Most common first names in Chula Vista, CA among deceased individuals | ||
| Name | Count | Lived (average) |
|---|---|---|
| Robert | 373 | 76.2 years |
| John | 336 | 76.5 years |
| Mary | 325 | 80.9 years |
| William | 311 | 77.7 years |
| Maria | 303 | 77.5 years |
| James | 231 | 74.3 years |
| Jose | 196 | 73.1 years |
| Charles | 179 | 77.3 years |
| George | 166 | 76.5 years |
| Margaret | 161 | 81.2 years |
| Most common last names in Chula Vista, CA among deceased individuals | ||
| Last name | Count | Lived (average) |
|---|---|---|
| Smith | 114 | 78.0 years |
| Garcia | 95 | 75.0 years |
| Hernandez | 92 | 73.8 years |
| Johnson | 90 | 78.6 years |
| Martinez | 88 | 73.8 years |
| Gonzalez | 83 | 71.7 years |
| Lopez | 82 | 74.8 years |
| Miller | 74 | 76.1 years |
| Rodriguez | 69 | 71.1 years |
| Williams | 68 | 76.0 years |
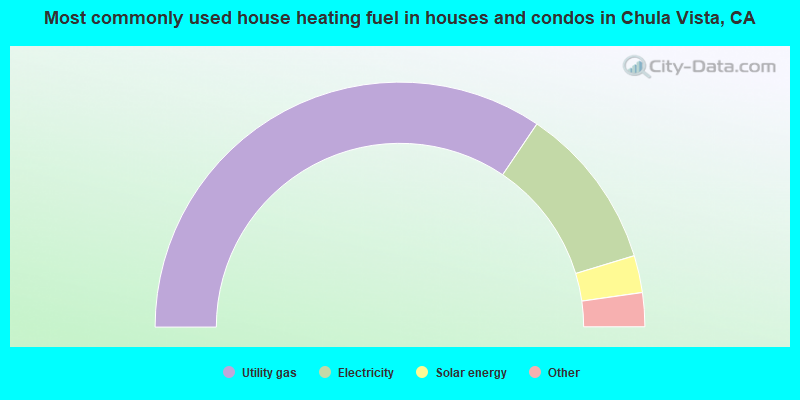
- 68.9%Utility gas
- 21.7%Electricity
- 4.9%Solar energy
- 2.8%No fuel used
- 1.3%Bottled, tank, or LP gas
- 0.2%Wood
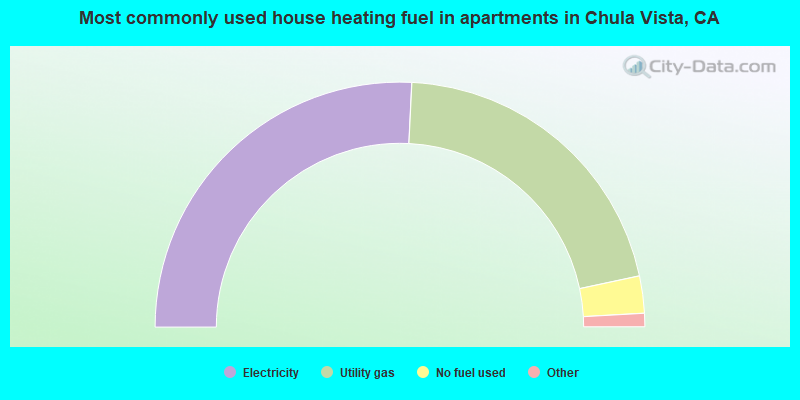
- 51.6%Electricity
- 41.8%Utility gas
- 4.9%No fuel used
- 1.2%Bottled, tank, or LP gas
- 0.5%Wood
- 0.1%Solar energy
Chula Vista compared to California state average:
- Unemployed percentage below state average.
- Hispanic race population percentage above state average.
- Foreign-born population percentage above state average.
- House age below state average.
Chula Vista, CA compared to other similar cities:
Chula Vista on our top lists:
- #17 on the list of "Top 101 cities with the lowest number of police officers per 1000 residents (population 50,000+)"
- #19 on the list of "Top 101 cities with largest percentage of females in occupations: law enforcement workers including supervisors (population 50,000+)"
- #26 on the list of "Top 101 cities with the smallest differences between morning and afternoon humidity (population 50,000+)"
- #26 on the list of "Top 101 cities with the smallest humidity differences during a year (population 50,000+)"
- #27 on the list of "Top 101 cities with the largest city-data.com crime index decrease from 2002 to 2012 (population 50,000+)"
- #33 on the list of "Top 101 cities with the highest percentage of family households, population 100,000+"
- #37 on the list of "Top 101 cities with the smallest temperature differences during a year (population 50,000+)"
- #44 on the list of "Top 101 cities with largest percentage of females in industries: public administration (population 50,000+)"
- #49 on the list of "Top 101 cities with the lowest average yearly precipitation (population 50,000+)"
- #61 on the list of "Top 101 cities with the lowest average snowfall in a year (population 50,000+)"
- #62 on the list of "Top 101 cities with largest percentage of males in industries: public administration (population 50,000+)"
- #71 on the list of "Top 101 cities with the lowest percentage of English-only speaking households, population 50,000+"
- #72 on the list of "Top 101 cities with largest percentage of males in occupations: law enforcement workers including supervisors (population 50,000+)"
- #74 on the list of "Top 101 cities with largest percentage of males in occupations: transportation occupations (population 50,000+)"
- #76 on the list of "Top 101 cities with largest percentage of males in industries: management of companies and enterprises (population 50,000+)"
- #77 on the list of "Top 101 cities with the largest percentage population increase from 2000 (population 50,000+)"
- #85 on the list of "Top 101 cities with the lowest number of thefts per 100,000 residents (population 50,000+)"
- #86 on the list of "Top 101 cities with the lowest average wind speeds (population 50,000+)"
- #89 on the list of "Top 101 cities with the most cars per house, population 50,000+"
- #98 on the list of "Top 101 biggest cities in 2013"
- #4 on the list of "Top 101 counties with the most Catholic adherents"
- #4 on the list of "Top 101 counties with the highest lead air pollution readings in 2012 (µg/m3)"
- #7 on the list of "Top 101 counties with the most Evangelical Protestant congregations"
- #7 on the list of "Top 101 counties with the most Catholic congregations"
- #7 on the list of "Top 101 counties with the highest surface withdrawal of fresh water for public supply (pop. 50,000+)"
State forum archive:
- California Pages: 2 3 4 5 6 7 8 9 10 11 12 13 14 15 16 17 18 19 20 21 22 23 24 25 26 27 28 29 30 31 32 33 34 35 36 37 38 39 40 41 42 43 44 45 46 47 48 49 50 51 52 53 54 55 56 57 58 59 60 61 62 63 64 65 66 67 68 69 70 71 72 73 74 75 76 77 78 79
- Los Angeles Pages: 2 3 4 5 6 7 8 9 10 11 12 13 14 15 16 17 18 19 20 21 22 23 24 25 26 27 28 29 30 31 32 33 34 35 36 37 38 39 40 41 42 43 44 45 46 47 48 49 50 51 52 53 54 55 56 57 58 59 60 61 62 63 64 65 66 67 68 69 70 71 72 73 74 75 76 77 78 79 80 81 82 83 84 85 86 87 88 89 90 91 92 93 94 95 96 97 98 99 100 101 102 103 104 105 106 107 108 109 110 111 112 113 114 115 116 117 118 119 120 121 122 123
- Monterey County Pages: 2 3
- Orange County Pages: 2 3 4 5 6 7 8 9 10 11 12 13 14 15 16 17 18 19 20 21 22 23 24 25 26 27 28 29 30 31 32 33 34 35 36
- Sacramento Pages: 2 3 4 5 6 7 8 9 10 11 12 13 14 15 16 17 18 19 20 21 22 23 24 25 26 27 28 29 30 31 32
- San Bernardino and Riverside Counties Pages: 2 3 4 5 6 7 8 9 10 11 12 13 14 15 16 17 18 19 20 21 22 23
- San Diego Pages: 2 3 4 5 6 7 8 9 10 11 12 13 14 15 16 17 18 19 20 21 22 23 24 25 26 27 28 29 30 31 32 33 34 35 36 37 38 39 40 41 42 43 44 45 46 47 48 49 50 51 52 53 54 55 56 57 58 59 60 61 62 63 64 65 66 67 68 69 70 71 72 73 74 75 76
- San Francisco - Oakland Pages: 2 3 4 5 6 7 8 9 10 11 12 13 14 15 16 17 18 19 20 21 22 23 24 25 26 27 28 29 30 31 32 33 34 35 36 37 38 39 40 41 42 43 44 45 46 47 48 49 50 51 52 53 54 55 56 57 58 59 60 61 62 63 64 65 66 67 68 69 70 71 72
- San Jose Pages: 2 3 4 5 6 7 8 9 10 11 12 13 14 15 16 17 18 19 20 21 22 23 24
- Ventura County Pages: 2 3 4 5 6 7

|
|
Total of 860 patent applications in 2008-2024.