La Mesa, California
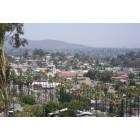
La Mesa: La Mesa
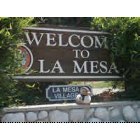
La Mesa: now entering La Mesa

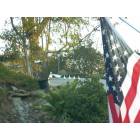
La Mesa: Lake Murray Winter Sunset - La Mesa, California
La Mesa: Top of Mount Grossmont
- add
your
Submit your own pictures of this city and show them to the world
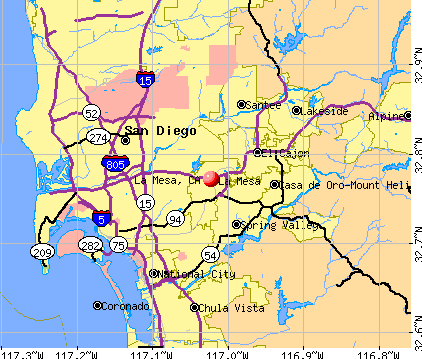
- OSM Map
- General Map
- Google Map
- MSN Map
Population change since 2000: +10.2%
 |
| Males: 28,780 | |
| Females: 31,580 |
| Median resident age: | 36.9 years |
| California median age: | 37.9 years |
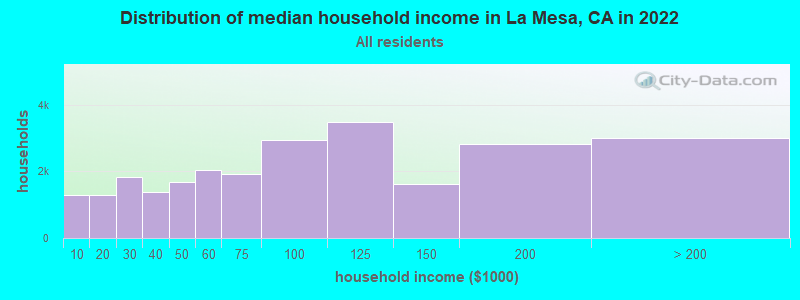
| La Mesa: | $85,335 |
| CA: | $91,551 |
Estimated per capita income in 2022: $45,409 (it was $22,372 in 2000)
La Mesa city income, earnings, and wages data
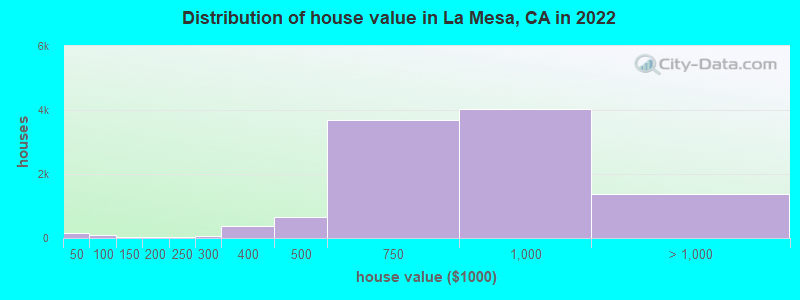
Estimated median house or condo value in 2022: $798,737 (it was $192,800 in 2000)
| La Mesa: | $798,737 |
| CA: | $715,900 |
Mean prices in 2022: all housing units: $846,406; detached houses: $918,997; townhouses or other attached units: $640,791; in 2-unit structures: $612,304; in 3-to-4-unit structures: $551,852; in 5-or-more-unit structures: $437,076; mobile homes: $159,566; occupied boats, rvs, vans, etc.: $22,881
Median gross rent in 2022: $1,849.
(8.7% for White Non-Hispanic residents, 20.7% for Black residents, 15.3% for Hispanic or Latino residents, 31.4% for American Indian residents, 14.1% for other race residents, 14.9% for two or more races residents)
Detailed information about poverty and poor residents in La Mesa, CA


Compare current foreclosures in La Mesa, CA:
| Photo | Address | Area | Beds / Baths | Price | Details |
|---|---|---|---|---|---|

|
#1
Baltimore Dr Unit 75
La Mesa, CA 91942
|
1,612 sq. feet
|
3 baths 3 beds |
show details | |

|
#2
Normal Ave
La Mesa, CA 91941
|
1,766 sq. feet
|
2 baths 3 beds |
show details | |

|
#3
Baltimore Dr Unit 75
La Mesa, CA 91942
|
1,612 sq. feet
|
3 baths 3 beds |
show details | |

|
#4
Madison Ave
La Mesa, CA 91941
|
931 sq. feet
|
1 baths 3 beds |
show details | |

|
#5
Whitehead Pl
La Mesa, CA 91942
|
1,018 sq. feet
|
2 baths 3 beds |
show details | |

|
#6
Merritt Blvd
La Mesa, CA 91941
|
1,109 sq. feet
|
1 baths 3 beds |
show details | |

|
#7
3rd St
La Mesa, CA 91941
|
2,194 sq. feet
|
2 baths 4 beds |
show details | |

|
#8
Heavenly Way
La Mesa, CA 91941
|
4,622 sq. feet
|
3 baths 2 beds |
show details | |

|
#9
Wendi St
La Mesa, CA 91942
|
1,080 sq. feet
|
1 baths 3 beds |
show details | |

|
#10
Odessa Ave
La Mesa, CA 91942
|
3,525 sq. feet
|
3 baths 4 beds |
show details |
| Photo | Address | Area | Beds / Baths | Price | Details |
|---|---|---|---|---|---|

|
#11
Charles St
La Mesa, CA 91941
|
1,998 sq. feet
|
2 baths 4 beds |
show details | |

|
#12
Edgewood Dr
La Mesa, CA 91941
|
1,898 sq. feet
|
3 baths 3 beds |
show details | |

|
#13
Kelton Ave
La Mesa, CA 91942
|
1,056 sq. feet
|
1 baths 3 beds |
show details | |

|
#14
Challenge Blvd
La Mesa, CA 91941
|
1,340 sq. feet
|
1 baths 3 beds |
show details | |

|
#15
Marian St
La Mesa, CA 91941
|
1,031 sq. feet
|
1 baths 3 beds |
show details | |

|
#16
Nancy Dr
La Mesa, CA 91942
|
1,493 sq. feet
|
2 baths 4 beds |
show details | |

|
#17
Lupin Way
La Mesa, CA 91941
|
2,073 sq. feet
|
3 baths 4 beds |
show details | |

|
#18
Lubbock Ave
La Mesa, CA 91942
|
1,221 sq. feet
|
1 baths 2 beds |
show details | |

|
#19
Calavo Dr
La Mesa, CA 91941
|
4,922 sq. feet
|
3 baths 3 beds |
show details | |

|
#20
S Tropico Dr
La Mesa, CA 91941
|
1,570 sq. feet
|
2 baths 3 beds |
show details |
| Photo | Address | Area | Beds / Baths | Price | Details |
|---|---|---|---|---|---|

|
#21
Challenge Blvd
La Mesa, CA 91941
|
2,020 sq. feet
|
3 baths 4 beds |
show details | |

|
#22
Marian St
La Mesa, CA 91941
|
1,124 sq. feet
|
2 baths 2 beds |
show details | |

|
#23
Calavo Dr
La Mesa, CA 91941
|
4,922 sq. feet
|
3 baths 3 beds |
show details | |

|
#24
Spring St Apt 31
La Mesa, CA 91941
|
- sq. feet
|
- baths - beds |
show details | |

|
#25
Dailey Ct
La Mesa, CA 91942
|
- sq. feet
|
- baths - beds |
show details | |

|
#26
King St Apt H
La Mesa, CA 91941
|
- sq. feet
|
- baths - beds |
show details | |

|
#27
La Mesita Pl # 3
La Mesa, CA 91942
|
- sq. feet
|
- baths - beds |
show details | |

|
#28
Amaya Dr Unit 82
La Mesa, CA 91942
|
- sq. feet
|
- baths - beds |
show details | |

|
#29
National Ave
La Mesa, CA 91941
|
- sq. feet
|
- baths - beds |
show details | |

|
#30
Avocado Blvd # 516
La Mesa, CA 91941
|
- sq. feet
|
- baths - beds |
show details |
| Photo | Address | Area | Beds / Baths | Price | Details |
|---|---|---|---|---|---|

|
#31
La Mesa Blvd Ste C
La Mesa, CA 91942
|
- sq. feet
|
- baths - beds |
show details | |

|
#32
Saranac St Apt 36
La Mesa, CA 91942
|
- sq. feet
|
- baths - beds |
show details | |

|
#33
Waite Dr
La Mesa, CA 91941
|
- sq. feet
|
- baths - beds |
show details | |

|
#34
Baltimore Dr
La Mesa, CA 91942
|
- sq. feet
|
- baths - beds |
show details | |

|
#35
3rd St Apt 10
La Mesa, CA 91941
|
- sq. feet
|
- baths - beds |
show details | |

|
#36
Allison Ave
La Mesa, CA 91942
|
- sq. feet
|
- baths - beds |
show details | |

|
#37
Case St
La Mesa, CA 91942
|
- sq. feet
|
- baths - beds |
show details | |

|
#38
Case St
La Mesa, CA 91942
|
- sq. feet
|
- baths - beds |
show details | |

|
#39
Rosebud Ln Apt A
La Mesa, CA 91941
|
- sq. feet
|
- baths - beds |
show details | |

|
#40
Lake Park Way
La Mesa, CA 91942
|
- sq. feet
|
- baths - beds |
show details |
| Photo | Address | Area | Beds / Baths | Price | Details |
|---|---|---|---|---|---|

|
#41
Rosebud Ln Apt B
La Mesa, CA 91941
|
- sq. feet
|
- baths - beds |
show details | |

|
#42
Normal Ave
La Mesa, CA 91941
|
- sq. feet
|
- baths - beds |
show details | |

|
#43
70th St Apt 48
La Mesa, CA 91942
|
- sq. feet
|
- baths - beds |
show details | |

|
#44
La Mesa Blvd Apt 3
La Mesa, CA 91942
|
- sq. feet
|
- baths - beds |
show details | |

|
#45
Nancy Dr
La Mesa, CA 91942
|
- sq. feet
|
- baths - beds |
show details | |

|
#46
Calle Verde Apt 122
La Mesa, CA 91941
|
- sq. feet
|
- baths - beds |
show details | |

|
#47
Fletcher Pkwy Unit 570
La Mesa, CA 91942
|
- sq. feet
|
- baths - beds |
show details | |

|
#48
Lake Murray Blvd Unit 2
La Mesa, CA 91942
|
- sq. feet
|
- baths - beds |
show details | |

|
#49
Lemon Ave # 6
La Mesa, CA 91941
|
- sq. feet
|
- baths - beds |
show details | |

|
Check over 1 million property listings on Foreclosure.com!
|
browse all offers | |||


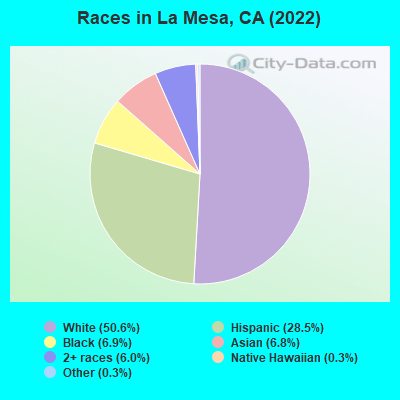
- 30,66550.6%White alone
- 17,26228.5%Hispanic
- 4,1636.9%Black alone
- 4,1266.8%Asian alone
- 3,6096.0%Two or more races
- 2090.3%Native Hawaiian and Other
Pacific Islander alone - 1670.3%Other race alone
- 240.04%American Indian alone
According to our research of California and other state lists, there were 96 registered sex offenders living in La Mesa, California as of April 26, 2024.
The ratio of all residents to sex offenders in La Mesa is 628 to 1.
The ratio of registered sex offenders to all residents in this city is near the state average.
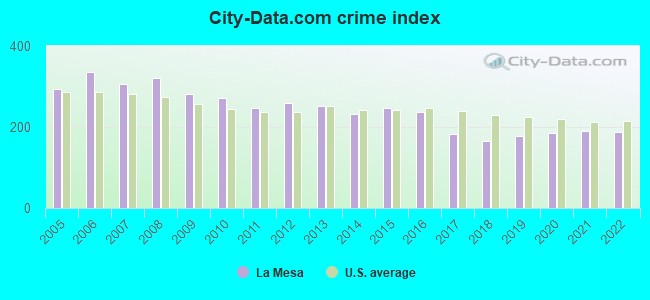
The City-Data.com crime index weighs serious crimes and violent crimes more heavily. Higher means more crime, U.S. average is 246.1. It adjusts for the number of visitors and daily workers commuting into cities.
- means the value is smaller than the state average.- means the value is about the same as the state average.
- means the value is bigger than the state average.
- means the value is much bigger than the state average.
Crime rate in La Mesa detailed stats: murders, rapes, robberies, assaults, burglaries, thefts, arson
Full-time law enforcement employees in 2021, including police officers: 88 (62 officers - 53 male; 9 female).
| Officers per 1,000 residents here: | 1.03 |
| California average: | 2.30 |
 Recent articles from our blog. Our writers, many of them Ph.D. graduates or candidates, create easy-to-read articles on a wide variety of topics.

 | Downtown La Mesa is on fire (93 replies) |
| Any experience with Trolley noise in residential La Mesa? (21 replies) |
| Rolando area that borders La Mesa, and also La Mesa itself (12 replies) |
| Charges Dropped In Amaurie Johnson Case In La Mesa (5 replies) |
| Owls in La Mesa (21 replies) |
| Weather difference between San Diego (Gaslamp) and La Mesa ? (27 replies) |
Latest news from La Mesa, CA collected exclusively by city-data.com from local newspapers, TV, and radio stations
La Mesa, CA City Guides:
Ancestries: American (4.8%), German (4.8%), English (4.1%), European (3.7%), Irish (3.7%), Italian (2.2%).
Current Local Time: PST time zone
Elevation: 507 feet
Land area: 9.26 square miles.
Population density: 6,516 people per square mile (high).
8,407 residents are foreign born (5.4% Asia, 4.8% Latin America, 2.4% Europe).
| This city: | 13.9% |
| California: | 26.5% |
Median real estate property taxes paid for housing units with mortgages in 2022: $5,541 (0.7%)
Median real estate property taxes paid for housing units with no mortgage in 2022: $3,199 (0.4%)
Nearest city with pop. 200,000+: San Diego, CA  (7.2 miles , pop. 1,223,400).
Nearest cities:
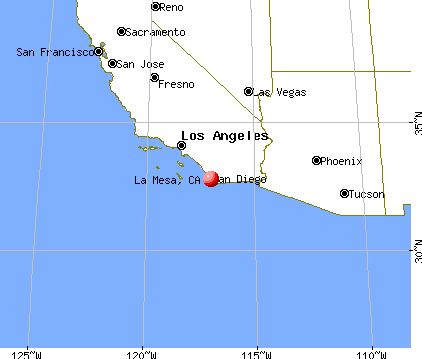
), ), )Latitude: 32.77 N, Longitude: 117.02 W
Daytime population change due to commuting: -2,875 (-4.7%)
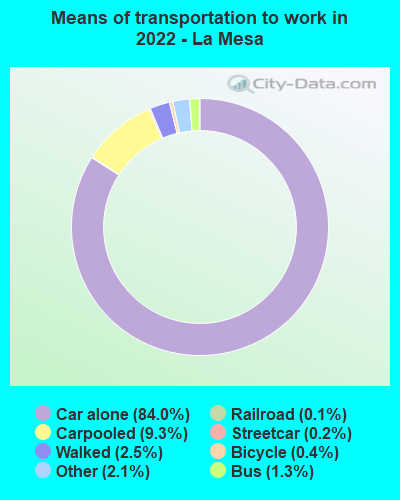
Workers who live and work in this city: 7,534 (23.6%)
Area code: 619
La Mesa, California accommodation & food services, waste management - Economy and Business Data
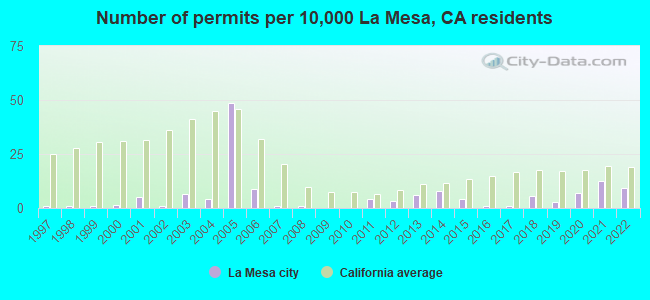
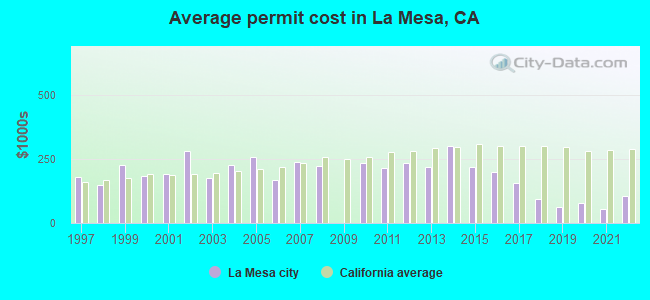
Single-family new house construction building permits:
- 2022: 51 buildings, average cost: $105,200
- 2021: 68 buildings, average cost: $54,700
- 2020: 38 buildings, average cost: $80,200
- 2019: 15 buildings, average cost: $63,900
- 2018: 31 buildings, average cost: $94,400
- 2017: 4 buildings, average cost: $155,900
- 2016: 5 buildings, average cost: $199,500
- 2015: 23 buildings, average cost: $217,800
- 2014: 42 buildings, average cost: $303,300
- 2013: 34 buildings, average cost: $218,200
- 2012: 18 buildings, average cost: $232,600
- 2011: 22 buildings, average cost: $216,500
- 2010: 1 building, cost: $233,500
- 2008: 5 buildings, average cost: $222,000
- 2007: 5 buildings, average cost: $237,500
- 2006: 48 buildings, average cost: $168,700
- 2005: 265 buildings, average cost: $260,400
- 2004: 22 buildings, average cost: $226,400
- 2003: 35 buildings, average cost: $174,600
- 2002: 6 buildings, average cost: $283,100
- 2001: 27 buildings, average cost: $192,100
- 2000: 7 buildings, average cost: $183,400
- 1999: 6 buildings, average cost: $225,700
- 1998: 6 buildings, average cost: $149,300
- 1997: 4 buildings, average cost: $181,700
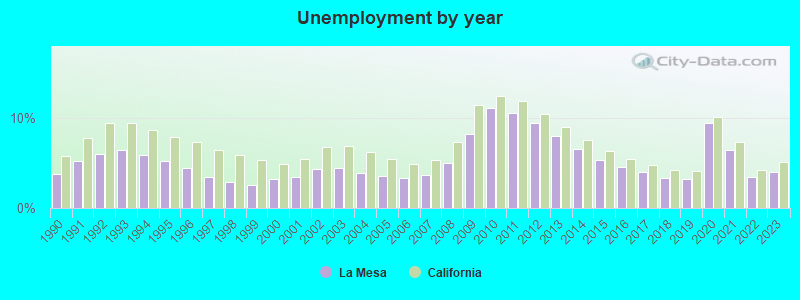
| Here: | 4.0% |
| California: | 5.1% |
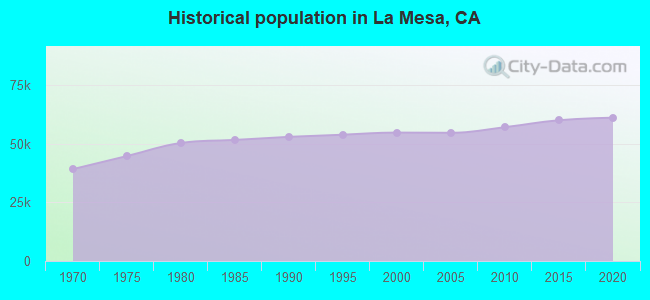
Population change in the 1990s: +1,438 (+2.7%).
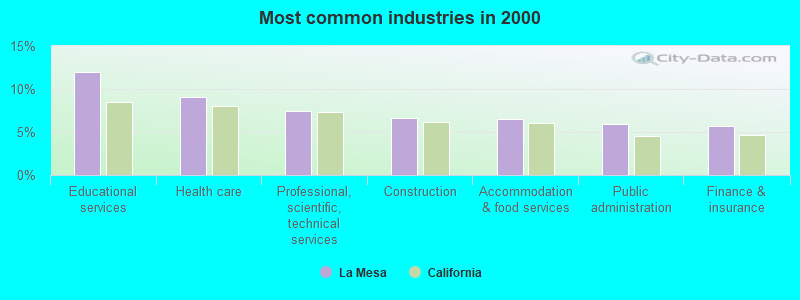
- Educational services (12.0%)
- Health care (9.1%)
- Professional, scientific, technical services (7.5%)
- Construction (6.7%)
- Accommodation & food services (6.5%)
- Public administration (5.9%)
- Finance & insurance (5.7%)
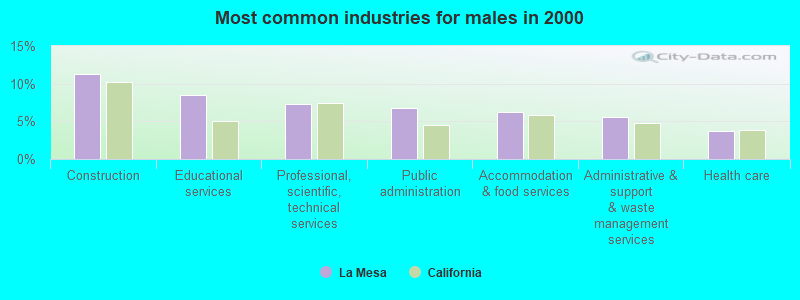
- Construction (11.3%)
- Educational services (8.5%)
- Professional, scientific, technical services (7.3%)
- Public administration (6.8%)
- Accommodation & food services (6.2%)
- Administrative & support & waste management services (5.6%)
- Health care (3.8%)

- Educational services (15.6%)
- Health care (14.4%)
- Finance & insurance (8.4%)
- Professional, scientific, technical services (7.7%)
- Accommodation & food services (6.7%)
- Public administration (5.0%)
- Administrative & support & waste management services (4.0%)
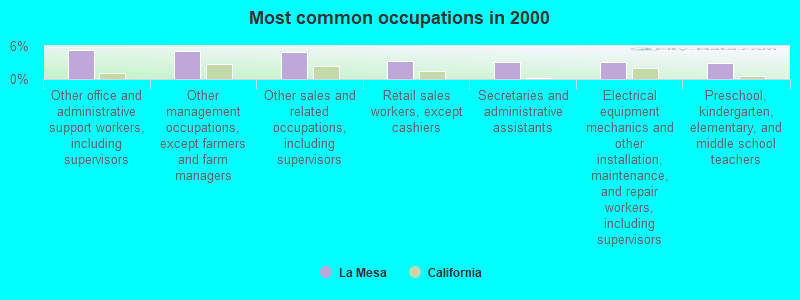
- Other office and administrative support workers, including supervisors (5.3%)
- Other management occupations, except farmers and farm managers (5.0%)
- Other sales and related occupations, including supervisors (4.9%)
- Retail sales workers, except cashiers (3.3%)
- Secretaries and administrative assistants (3.1%)
- Electrical equipment mechanics and other installation, maintenance, and repair workers, including supervisors (3.1%)
- Preschool, kindergarten, elementary, and middle school teachers (3.0%)
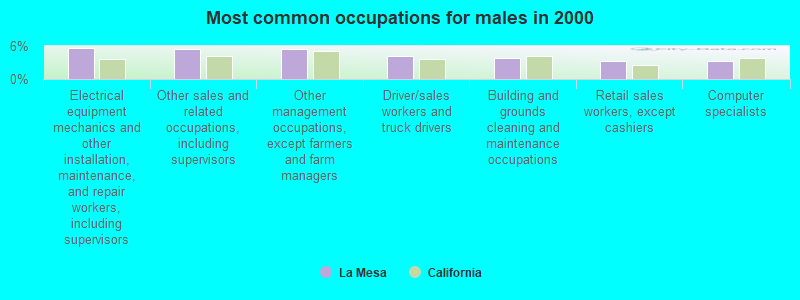
- Electrical equipment mechanics and other installation, maintenance, and repair workers, including supervisors (5.6%)
- Other sales and related occupations, including supervisors (5.5%)
- Other management occupations, except farmers and farm managers (5.4%)
- Driver/sales workers and truck drivers (4.1%)
- Building and grounds cleaning and maintenance occupations (3.8%)
- Retail sales workers, except cashiers (3.3%)
- Computer specialists (3.2%)
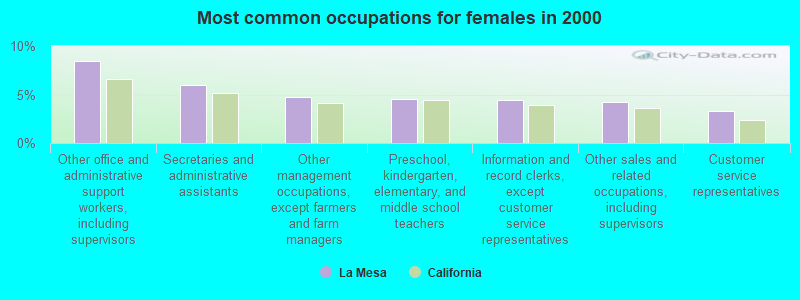
- Other office and administrative support workers, including supervisors (8.5%)
- Secretaries and administrative assistants (6.0%)
- Other management occupations, except farmers and farm managers (4.7%)
- Preschool, kindergarten, elementary, and middle school teachers (4.5%)
- Information and record clerks, except customer service representatives (4.5%)
- Other sales and related occupations, including supervisors (4.2%)
- Customer service representatives (3.3%)
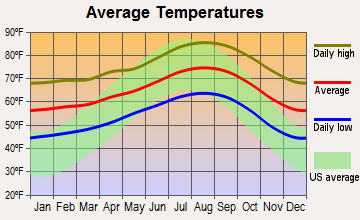
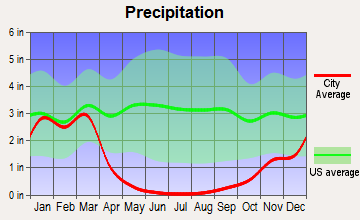
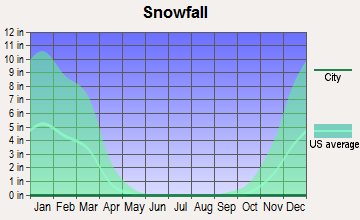
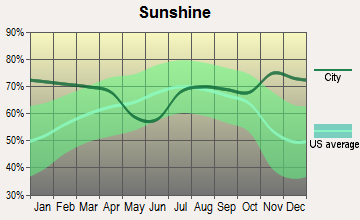
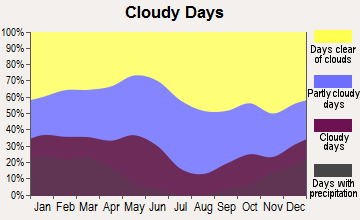
Average climate in La Mesa, California
Based on data reported by over 4,000 weather stations
|
|

(lower is better)
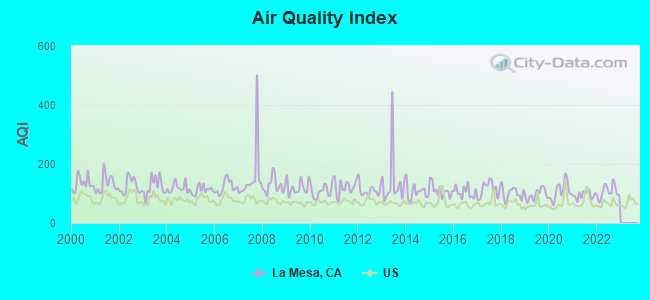
Air Quality Index (AQI) level in 2022 was 106. This is significantly worse than average.
| City: | 106 |
| U.S.: | 73 |
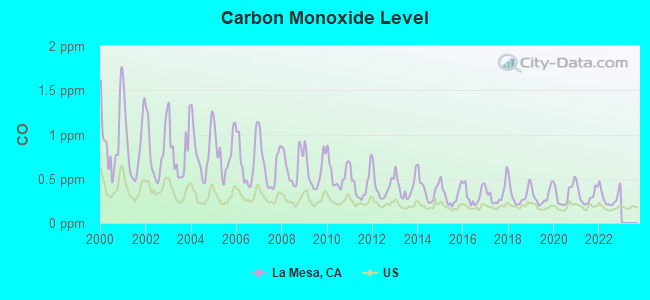
Carbon Monoxide (CO) [ppm] level in 2022 was 0.291. This is about average. Closest monitor was 3.8 miles away from the city center.
| City: | 0.291 |
| U.S.: | 0.251 |
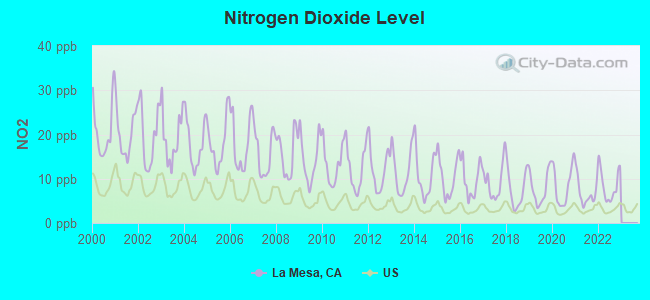
Nitrogen Dioxide (NO2) [ppb] level in 2022 was 8.57. This is significantly worse than average. Closest monitor was 3.8 miles away from the city center.
| City: | 8.57 |
| U.S.: | 5.11 |
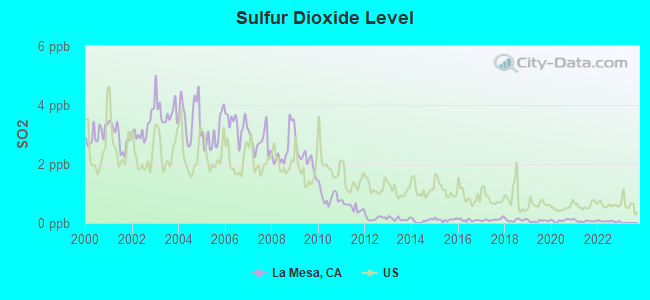
Sulfur Dioxide (SO2) [ppb] level in 2022 was 0.0589. This is significantly better than average. Closest monitor was 3.8 miles away from the city center.
| City: | 0.0589 |
| U.S.: | 1.5147 |
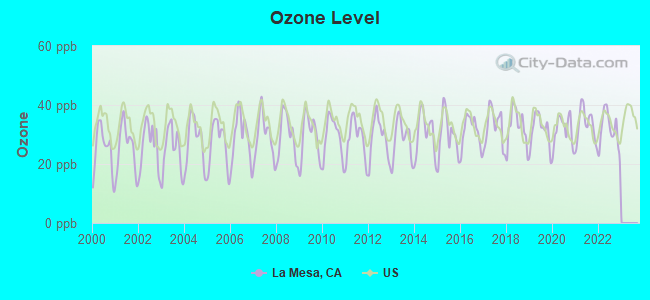
Ozone [ppb] level in 2022 was 31.4. This is about average. Closest monitor was 3.5 miles away from the city center.
| City: | 31.4 |
| U.S.: | 33.3 |
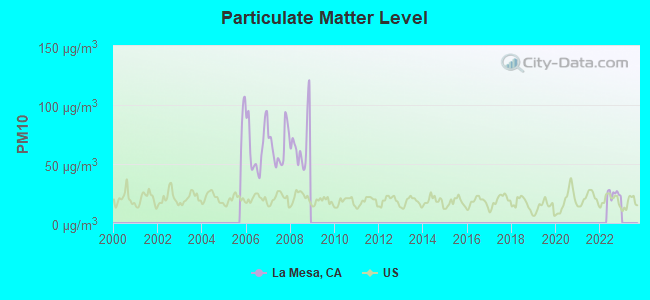
Particulate Matter (PM10) [µg/m3] level in 2022 was 24.9. This is worse than average. Closest monitor was 4.7 miles away from the city center.
| City: | 24.9 |
| U.S.: | 19.2 |
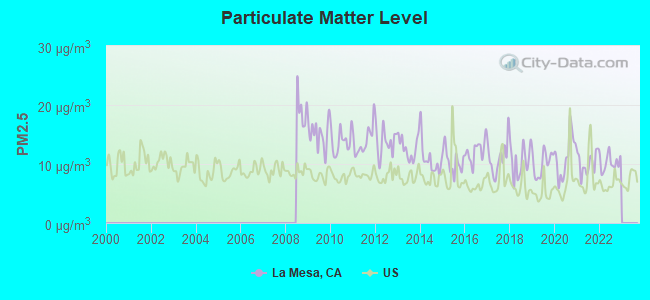
Particulate Matter (PM2.5) [µg/m3] level in 2022 was 10.2. This is worse than average. Closest monitor was 4.5 miles away from the city center.
| City: | 10.2 |
| U.S.: | 8.1 |
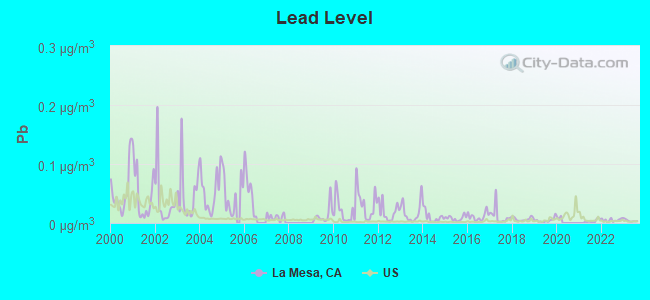
Lead (Pb) [µg/m3] level in 2023 was 0.00400. This is significantly better than average. Closest monitor was 3.9 miles away from the city center.
| City: | 0.00400 |
| U.S.: | 0.00931 |
Earthquake activity:
La Mesa-area historical earthquake activity is significantly above California state average. It is 5742% greater than the overall U.S. average.On 6/28/1992 at 11:57:34, a magnitude 7.6 (6.2 MB, 7.6 MS, 7.3 MW, Depth: 0.7 mi, Class: Major, Intensity: VIII - XII) earthquake occurred 101.7 miles away from La Mesa center, causing 3 deaths (1 shaking deaths, 2 other deaths) and 400 injuries, causing $100,000,000 total damage and $40,000,000 insured losses
On 7/21/1952 at 11:52:14, a magnitude 7.7 (7.7 UK) earthquake occurred 191.4 miles away from La Mesa center, causing $50,000,000 total damage
On 10/16/1999 at 09:46:44, a magnitude 7.4 (6.3 MB, 7.4 MS, 7.2 MW, 7.3 ML) earthquake occurred 125.3 miles away from La Mesa center
On 5/19/1940 at 04:36:40, a magnitude 7.2 (7.2 UK) earthquake occurred 83.0 miles away from the city center, causing $33,000,000 total damage
On 12/31/1934 at 18:45:56, a magnitude 7.1 (7.1 UK) earthquake occurred 73.7 miles away from the city center
On 10/15/1979 at 23:16:54, a magnitude 7.0 (5.7 MB, 6.9 MS, 7.0 ML, 6.4 MW) earthquake occurred 80.5 miles away from La Mesa center
Magnitude types: body-wave magnitude (MB), local magnitude (ML), surface-wave magnitude (MS), moment magnitude (MW)
Natural disasters:
The number of natural disasters in San Diego County (39) is a lot greater than the US average (15).Major Disasters (Presidential) Declared: 21
Emergencies Declared: 2
Causes of natural disasters: Fires: 21, Floods: 17, Storms: 9, Winter Storms: 6, Landslides: 5, Mudslides: 4, Freeze: 1, Heavy Rain: 1, Hurricane: 1, Tornado: 1, Other: 1 (Note: some incidents may be assigned to more than one category).

Hospitals in La Mesa:
- ALVARADO PARKWAY INSTITUTE BEHAVIORAL HEALTH SYSTE (7050 PARKWAY DRIVE)
- GROSSMONT HOSPITAL (Government - Hospital District or Authority, provides emergency services, 5555 GROSSMONT CENTER DRIVE BOX 58)
- SHARP HOSPICECARE (8881 FLETCHER PARKWAY STE 336)
- SHASTA HOME (5502 SHASTA LANE)
Nursing Homes in La Mesa:
- ARBOR HILLS NURSING CENTER (7800 PARKWAY DRIVE)
- COMMUNITY CONV HOSP OF LA MESA, LP (8665 LA MESA BLVD.)
- COUNTRY VILLA LA MESA HEALTHCARE CENTER (5696 LAKE MURRAY BLVD)
- GROSSMONT GARDENS HEALTH CARE (5480 MARENGO AVENUE)
- LA MESA HEALTHCARE CENTER (3780 MASSACHUSETTS AVENUE)
- PARKWAY HILLS NURSING AND REHABILITATION (7760 PARKWAY DRIVE)
- SHEA FAMILY CARE GROSSMONT (8787 CENTER DRIVE)
Dialysis Facilities in La Mesa:
Home Health Centers in La Mesa:
Heliports located in La Mesa:
Amtrak station near La Mesa:
- 10 miles: SAN DIEGO (1050 KETTNER BLVD.) . Services: ticket office, fully wheelchair accessible, enclosed waiting area, public restrooms, public payphones, full-service food facilities, paid short-term parking, paid long-term parking, call for car rental service, taxi stand, public transit connection.
College/University in La Mesa:
Colleges/universities with over 2000 students nearest to La Mesa:
- San Diego State University (about 3 miles; San Diego, CA; Full-time enrollment: 27,516)
- Grossmont College (about 4 miles; El Cajon, CA; FT enrollment: 10,461)
- Cuyamaca College (about 6 miles; El Cajon, CA; FT enrollment: 4,270)
- University of Phoenix-San Diego Campus (about 7 miles; San Diego, CA; FT enrollment: 5,159)
- The Art Institute of California-Argosy University San Diego (about 8 miles; San Diego, CA; FT enrollment: 2,180)
- San Diego City College (about 9 miles; San Diego, CA; FT enrollment: 7,972)
- San Diego Mesa College (about 9 miles; San Diego, CA; FT enrollment: 12,487)
Public high schools in La Mesa:
- GROSSMONT HIGH (Students: 1,672, Location: 1100 MURRAY DR., Grades: 9-12)
- HELIX HIGH (Students: 1,658, Location: 7323 UNIVERSITY AVE., Grades: 9-12, Charter school)
- GROSSMONT UNION HIGH SPECIAL EDUCATION PROGRAM (Students: 36, Location: 1100 MURRAY DR., Grades: 9-12)
- SAN DIEGO VIRTUAL (Location: 7950 UNIVERSITY AVE. STE. 410, Grades: KG-12, Charter school)
- LEARNING CHOICE ACADEMY (Location: 4215 SPRING ST., STE. A-104, Grades: KG-12, Charter school)
Private high school in La Mesa:
Biggest public elementary/middle schools in La Mesa:
- PARKWAY MIDDLE (Students: 1,197, Location: 9009 PARK PLAZA DR., Grades: 7-8)
- LA MESA MIDDLE (Students: 1,124, Location: 4200 PARKS AVE., Grades: 7-8)
- LEMON AVENUE ELEMENTARY (Students: 385, Location: 8787 LEMON AVE., Grades: KG-6)
- MURRAY MANOR ELEMENTARY (Students: 358, Location: 8305 EL PASO ST., Grades: KG-8)
- VISTA LA MESA ACADEMY (Students: 334, Location: 3900 VIOLET ST., Grades: KG-8)
- AVOCADO ELEMENTARY (Students: 331, Location: 3845 AVOCADO SCH RD., Grades: KG-5)
- NORTHMONT ELEMENTARY (Students: 274, Location: 9405 GREGORY ST., Grades: KG-6)
- ROLANDO ELEMENTARY (Students: 261, Location: 6925 TOWER ST., Grades: KG-6)
- LA MESA DALE ELEMENTARY (Students: 250, Location: 4370 PARKS AVE., Grades: KG-6)
- MARYLAND AVENUE ELEMENTARY (Students: 218, Location: 5400 MARYLAND AVE., Grades: KG-6)
Private elementary/middle schools in La Mesa:
- ST MARTIN OF TOURS ACADEMY (Students: 284, Location: 7708 EL CAJON BLVD, Grades: PK-8)
- WARREN-WALKER SCHOOL-LA MESA (Students: 268, Location: 5150 WILSON ST, Grades: PK-5)
- CHRIST LUTHERAN SCHOOL (Students: 188, Location: 7921 LA MESA BLVD, Grades: KG-8)
- MT HELIX ACADEMY - TIEE (Students: 174, Location: 5955 SEVERIN DR, Grades: KG-8)
- MT HELIX ACADEMY (Students: 174, Location: 5955 SEVERIN DRIVE, Grades: KG-8)
- CALVARY CHAPEL LA MESA CHRISTIAN SCHOOL (Students: 46, Location: 7525 EL CAJON BLVD, Grades: T1-8)
- SHEPHERD OF THE HILLS LUTHERAN SCHOOL (Students: 30, Location: 9191 FLETCHER PKWY, Grades: KG-8)
- COLLEGE CENTER MONTESSORI SCHOOL (Students: 18, Location: 7484 UNIVERSITY AVE STE 100, Grades: PK-4)
- LEO HAMEL K-8 ACADEMY (Students: 8, Location: 5300 JACKSON DR STE A, Grades: KG-8)
User-submitted facts and corrections:
- Regarding La Mesa, CA, of which I am a resident, actor Dennis Hopper graduated from Helix High School and was voted "most likely to succeed." Another Helix grad was the superstar basketball player Bill Walton. And while the first female hispanic astronaut, Ellen Ochoa, was born in Los Angeles,she considers La Mesa her hometown, according to NASA. She graduated from La Mesa's Grossmont High.
- Birthplace of: Dave Mustaine - musician (singer/guitarist/songwriter for Megadeth)
Points of interest:
Notable locations in La Mesa: Sun Valley Golf Course (A), Little Flower Haven (B), La Mesa Memorial Fine Arts Center (C), South County Regional Center San Diego County Library (D), La Mesa Civic Center (E), Americare Ambulance Service La Mesa (F), Schaefer Ambulance Service (G), La Mesa Fire District Station 13 (H), La Mesa Fire District Station 12 (I), La Mesa Fire District Station 11 (J), La Mesa Library (K), Herrick Community Health Library (L), Grossmont Healthcare District Library (M). Display/hide their locations on the map
Shopping Centers: Village Station Shopping Center (1), Village Shopping Center (2), Lake Murray Square Shopping Center (3), La Mesa Town and Country Shopping Center (4), La Mesa Square Shopping Center (5), La Mesa Springs Shopping Center (6), La Mesa Crossroads Shopping Center (7), Grossmont Shopping Center (8), Fletcher Hills Shopping Center (9). Display/hide their locations on the map
Churches in La Mesa include: Del Cerro Baptist Church (A), Calvary Chapel of La Mesa (B), Evangelical Bible Church (C), First Assembly of God Church (D), First Missionary Baptist Church (E), Lake Murray Evangelical Free Church (F), Saint Lukes Lutheran Church (G), United Church of Christ (H), Vista La Mesa Christian Church (I). Display/hide their locations on the map
Reservoirs: Grassmont Reservoir (A), Mount Helix Reservoir (B). Display/hide their locations on the map
Parks in La Mesa include: Collier Park (1), Highwood Park (2), Jackson Park (3), MacArthur Park (4), Porter Park (5), Rolando Park (6), Sunset Park (7), Vista La Mesa Park (8), Aztec Park (9). Display/hide their locations on the map
Tourist attraction: Computer Museum of America (Cultural Attractions- Events- & Facilities; 640 Centre).
Hotels: Best Value Inn - La Mesa (Bv) (6952 University Ave), Best Value Inn & Suites - La Mesa (6952 University ave.).
Birthplace of: Aaron Boone - 2005 Major League Baseball player (Cleveland Indians, born: Mar 9, 1973), Jason Phillips - 2005 Major League Baseball player (Los Angeles Dodgers, born: Sep 27, 1976), Jason Phillips (catcher) - Baseball player and coach, Joe Kennedy - 2005 Major League Baseball player (Oakland Athletics, born: May 24, 1979), Joe Kennedy (baseball) - Professional baseball player, Kevin McCadam - 2005 NFL player (Atlanta Falcons, born: Mar 6, 1979), Royce Ring - 2005 Major League Baseball player (New York Mets, born: Dec 21, 1980), Steve Roach (musician) - Ambient musician, Ed White (American football) - Football player, Jeff Byrd - Baseball player.
Drinking water stations with addresses in La Mesa and their reported violations in the past:
WHISPERING WINDS CATHOLIC CONFERENCE CEN (Population served: 162, Groundwater):Past monitoring violations:KATHERINE RESORTS LANDING (Address: 7885 QUINCE ST , Serves AZ, Population served: 82, Groundwater):
- 16 routine major monitoring violations
- One regular monitoring violation
Past monitoring violations:
- Monitoring and Reporting (DBP) - Between OCT-2013 and DEC-2013, Contaminant: Chlorine. Follow-up actions: St Compliance achieved (APR-21-2014)
- Monitoring and Reporting (DBP) - Between JUL-2013 and SEP-2013, Contaminant: Chlorine. Follow-up actions: St Compliance achieved (APR-21-2014)
- Monitoring and Reporting (DBP) - Between APR-2013 and JUN-2013, Contaminant: Chlorine. Follow-up actions: St Compliance achieved (APR-21-2014)
- Monitoring and Reporting (DBP) - Between JAN-2013 and MAR-2013, Contaminant: Chlorine. Follow-up actions: St Compliance achieved (JUN-24-2013)
- Monitoring and Reporting (DBP) - Between OCT-2012 and DEC-2012, Contaminant: Chlorine. Follow-up actions: St Violation/Reminder Notice (APR-02-2013), St Compliance achieved (JUN-24-2013)
- One routine major monitoring violation
- 47 other older monitoring violations
| This city: | 2.3 people |
| California: | 2.9 people |
| This city: | 56.2% |
| Whole state: | 68.7% |
| This city: | 8.1% |
| Whole state: | 7.2% |
Likely homosexual households (counted as self-reported same-sex unmarried-partner households)
- Lesbian couples: 0.5% of all households
- Gay men: 0.5% of all households
People in group quarters in La Mesa in 2010:
- 512 people in nursing facilities/skilled-nursing facilities
- 68 people in group homes intended for adults
- 24 people in other noninstitutional facilities
- 14 people in emergency and transitional shelters (with sleeping facilities) for people experiencing homelessness
- 12 people in workers' group living quarters and job corps centers
- 10 people in in-patient hospice facilities
- 6 people in group homes for juveniles (non-correctional)
- 6 people in residential treatment centers for adults
- 5 people in residential treatment centers for juveniles (non-correctional)
People in group quarters in La Mesa in 2000:
- 781 people in nursing homes
- 95 people in other noninstitutional group quarters
- 57 people in other nonhousehold living situations
- 27 people in mental (psychiatric) hospitals or wards
- 24 people in homes for the mentally retarded
- 20 people in homes or halfway houses for drug/alcohol abuse
- 19 people in religious group quarters
- 12 people in unknown juvenile institutions
- 7 people in homes for the mentally ill
- 4 people in other group homes
Banks with most branches in La Mesa (2011 data):
- Wells Fargo Bank, National Association: La Mesa Springs Branch, Lake Murray Village, Grossmont Branch. Info updated 2011/04/05: Bank assets: $1,161,490.0 mil, Deposits: $905,653.0 mil, headquarters in Sioux Falls, SD, positive income, 6395 total offices, Holding Company: Wells Fargo & Company
- Citibank, National Association: La Mesa Branch at 3777 Avocado Boulevard, branch established on 1998/09/11; Grossmont Cntr Branch at 5332 Jackson Drive, branch established on 1934/10/01. Info updated 2012/01/10: Bank assets: $1,288,658.0 mil, Deposits: $882,541.0 mil, headquarters in Sioux Falls, SD, positive income, International Specialization, 1048 total offices, Holding Company: Citigroup Inc.
- California Bank & Trust: La Mesa Branch at 5500 Grossmont Center Drive, branch established on 2005/01/02; Rancho San Diego Branch at 3787 Avocado Boulevard, branch established on 1980/09/22. Info updated 2009/07/20: Bank assets: $10,894.1 mil, Deposits: $9,193.9 mil, headquarters in San Diego, CA, positive income, Commercial Lending Specialization, 109 total offices, Holding Company: Zions Bancorporation
- U.S. Bank National Association: La Mesa Albertsons Branch at 8920 Fletcher Parkway, branch established on 1999/09/10; La Mesa Vons Branch at 3681 Avocado Avenue, branch established on 2006/11/03. Info updated 2012/01/30: Bank assets: $330,470.8 mil, Deposits: $236,091.5 mil, headquarters in Cincinnati, OH, positive income, 3121 total offices, Holding Company: U.S. Bancorp
- JPMorgan Chase Bank, National Association: Grossmont Branch at 5505 Grossmont Ctr Dr, branch established on 1934/11/01; La Mesa Branch at 4791 Spring Street, branch established on 1926/01/01. Info updated 2011/11/10: Bank assets: $1,811,678.0 mil, Deposits: $1,190,738.0 mil, headquarters in Columbus, OH, positive income, International Specialization, 5577 total offices, Holding Company: Jpmorgan Chase & Co.
- Borrego Springs Bank, National Association: at 7777 Alvarado Road, Suite 515, branch established on 1982/11/01; La Mesa at 7777 Alvarado Rd, Ste 114, branch established on 1997/04/07. Info updated 2006/11/03: Bank assets: $131.3 mil, Deposits: $114.9 mil, local headquarters, positive income, Commercial Lending Specialization, 4 total offices, Holding Company: American Heritage Holdings
- Bank of America, National Association: La Mesa Main Branch at 5500 Grossmont Center Drive, branch established on 1962/02/16. Info updated 2009/11/18: Bank assets: $1,451,969.3 mil, Deposits: $1,077,176.8 mil, headquarters in Charlotte, NC, positive income, 5782 total offices, Holding Company: Bank Of America Corporation
- First Republic Bank: La Mesa Branch at 8347 La Mesa Boulevard, branch established on 1981/01/31. Info updated 2010/08/03: Bank assets: $27,791.8 mil, Deposits: $22,459.3 mil, headquarters in San Francisco, CA, positive income, Mortgage Lending Specialization, 60 total offices
- Union Bank, National Association: La Mesa Branch at 4771 Spring Street, branch established on 1934/07/02. Info updated 2011/09/01: Bank assets: $88,967.5 mil, Deposits: $65,286.4 mil, headquarters in San Francisco, CA, positive income, Commercial Lending Specialization, 403 total offices, Holding Company: Mitsubishi Ufj Financial Group, Inc.
- 5 other banks with 5 local branches
For population 15 years and over in La Mesa:
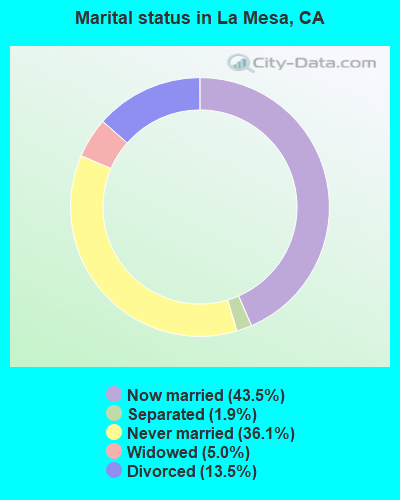
- Never married: 36.1%
- Now married: 43.5%
- Separated: 1.9%
- Widowed: 5.0%
- Divorced: 13.5%
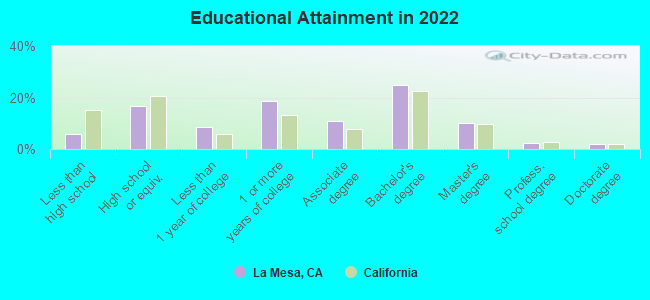
For population 25 years and over in La Mesa:
- High school or higher: 93.9%
- Bachelor's degree or higher: 37.7%
- Graduate or professional degree: 13.7%
- Unemployed: 4.3%
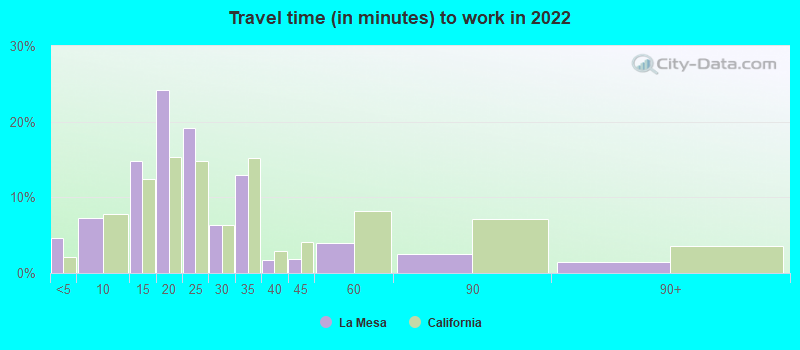
- Mean travel time to work (commute): 20.9 minutes
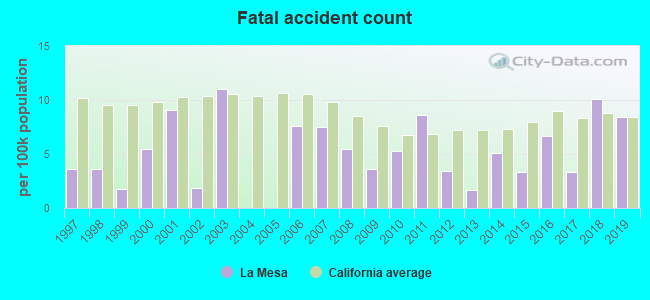
| Here: | 9.9 |
| California average: | 15.5 |
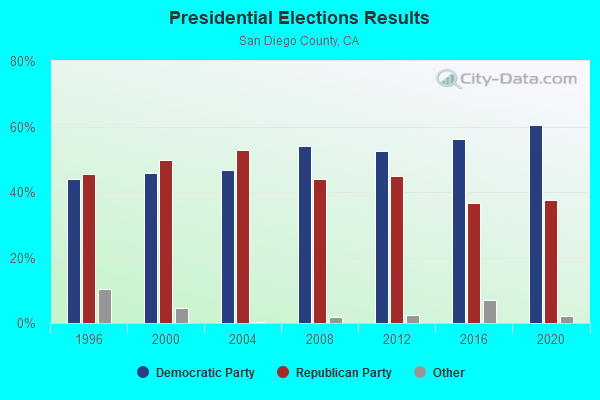
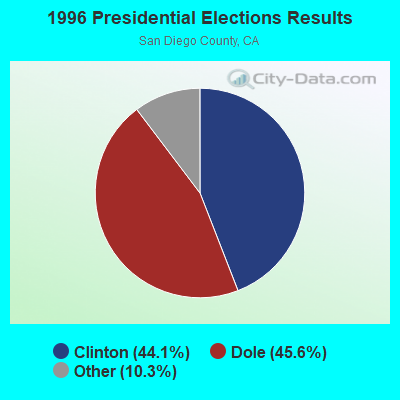
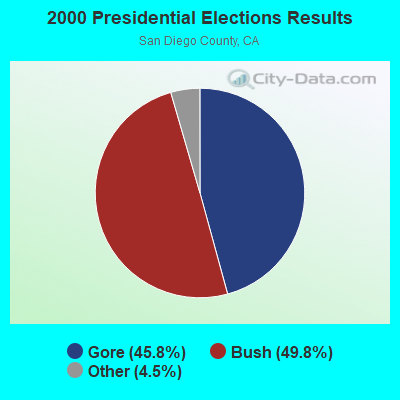
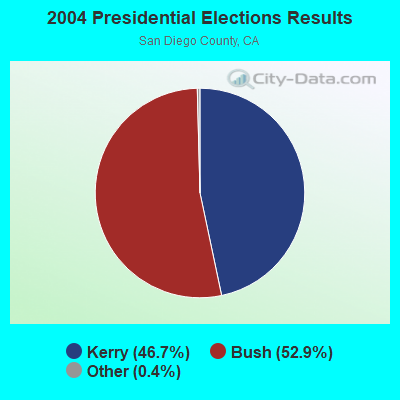
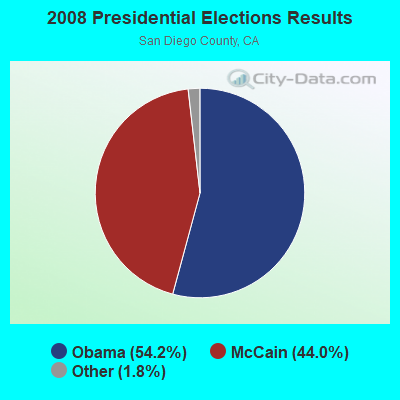
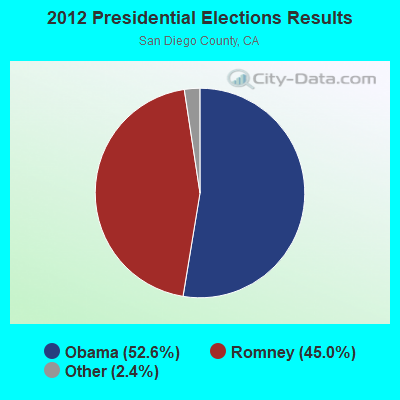
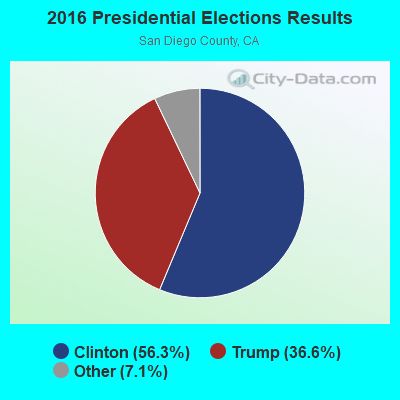
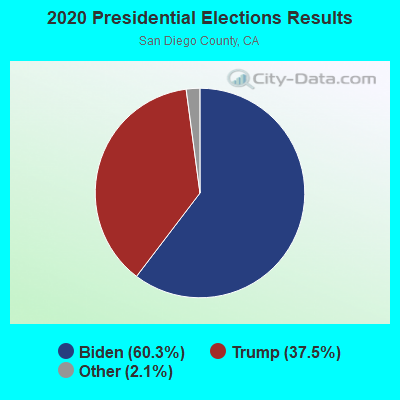
Graphs represent county-level data. Detailed 2008 Election Results
Neighborhoods in La Mesa:
(La Mesa, California Neighborhood Map)Religion statistics for La Mesa, CA (based on San Diego County data)
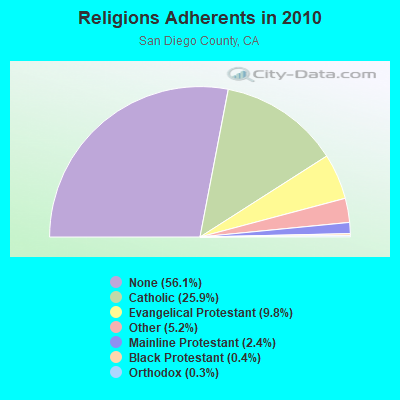
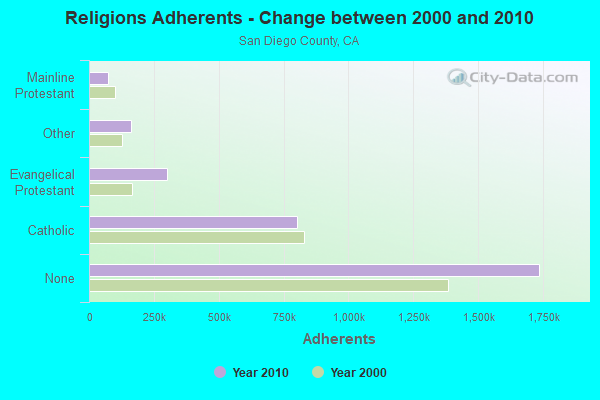
| Religion | Adherents | Congregations |
|---|---|---|
| Catholic | 801,850 | 115 |
| Evangelical Protestant | 302,320 | 974 |
| Other | 161,530 | 349 |
| Mainline Protestant | 74,992 | 211 |
| Black Protestant | 10,857 | 52 |
| Orthodox | 7,828 | 19 |
| None | 1,735,936 | - |
Food Environment Statistics:
| Here: | 1.94 / 10,000 pop. |
| State: | 2.14 / 10,000 pop. |
| San Diego County: | 0.06 / 10,000 pop. |
| California: | 0.04 / 10,000 pop. |
| This county: | 0.77 / 10,000 pop. |
| State: | 0.62 / 10,000 pop. |
| This county: | 1.65 / 10,000 pop. |
| State: | 1.49 / 10,000 pop. |
| San Diego County: | 7.56 / 10,000 pop. |
| California: | 7.42 / 10,000 pop. |
| Here: | 6.5% |
| California: | 7.3% |
| San Diego County: | 22.2% |
| California: | 21.3% |
| San Diego County: | 16.0% |
| State: | 17.9% |
Health and Nutrition:
| This city: | 51.3% |
| California: | 49.4% |
| La Mesa: | 50.0% |
| California: | 48.0% |
| Here: | 28.3 |
| California: | 28.1 |
| This city: | 19.8% |
| California: | 20.2% |
| Here: | 10.6% |
| California: | 11.2% |
| This city: | 6.9 |
| State: | 6.8 |
| This city: | 33.4% |
| California: | 31.5% |
| This city: | 58.2% |
| California: | 56.4% |
| La Mesa: | 80.0% |
| California: | 80.9% |
More about Health and Nutrition of La Mesa, CA Residents
| Local government employment and payroll (March 2022) | |||||
| Function | Full-time employees | Monthly full-time payroll | Average yearly full-time wage | Part-time employees | Monthly part-time payroll |
|---|---|---|---|---|---|
| Police Protection - Officers | 65 | $781,165 | $144,215 | 0 | $0 |
| Firefighters | 37 | $510,253 | $165,487 | 0 | $0 |
| Police - Other | 27 | $178,733 | $79,437 | 6 | $13,784 |
| Other Government Administration | 23 | $167,971 | $87,637 | 1 | $72 |
| Parks and Recreation | 19 | $104,271 | $65,855 | 20 | $10,201 |
| Financial Administration | 16 | $105,396 | $79,047 | 1 | $1,702 |
| Streets and Highways | 16 | $93,051 | $69,788 | 0 | $0 |
| Other and Unallocable | 15 | $99,729 | $79,783 | 2 | $5,212 |
| Sewerage | 11 | $73,884 | $80,601 | 3 | $908 |
| Fire - Other | 10 | $90,447 | $108,536 | 0 | $0 |
| Welfare | 4 | $20,963 | $62,889 | 1 | $1,820 |
| Solid Waste Management | 1 | $7,987 | $95,844 | 0 | $0 |
| Judicial and Legal | 1 | $9,785 | $117,420 | 0 | $0 |
| Housing and Community Development (Local) | 1 | $7,737 | $92,844 | 0 | $0 |
| Totals for Government | 246 | $2,251,371 | $109,823 | 34 | $33,699 |
La Mesa government finances - Expenditure in 2017 (per resident):
- Construction - Regular Highways: $7,819,000 ($129.54)
Sewerage: $1,624,000 ($26.91)
Central Staff Services: $364,000 ($6.03)
Police Protection: $262,000 ($4.34)
Housing and Community Development: $216,000 ($3.58)
Parks and Recreation: $201,000 ($3.33)
- Current Operations - Police Protection: $17,640,000 ($292.25)
Local Fire Protection: $10,033,000 ($166.22)
Sewerage: $7,992,000 ($132.41)
Central Staff Services: $6,295,000 ($104.29)
Regular Highways: $4,490,000 ($74.39)
Parks and Recreation: $3,705,000 ($61.38)
Financial Administration: $1,000,000 ($16.57)
Protective Inspection and Regulation - Other: $871,000 ($14.43)
Health - Other: $605,000 ($10.02)
Housing and Community Development: $280,000 ($4.64)
Solid Waste Management: $259,000 ($4.29)
Parking Facilities: $199,000 ($3.30)
- General - Interest on Debt: $1,212,000 ($20.08)
- Intergovernmental to Local - Other - Sewerage: $5,326,000 ($88.24)
Other - General - Other: $500,000 ($8.28)
Other - Local Fire Protection: $440,000 ($7.29)
- Intergovernmental to State - Police Protection: $103,000 ($1.71)
- Other Capital Outlay - Libraries: $359,000 ($5.95)
Local Fire Protection: $86,000 ($1.42)
Financial Administration: $64,000 ($1.06)
Parks and Recreation: $58,000 ($0.96)
Central Staff Services: $52,000 ($0.86)
La Mesa government finances - Revenue in 2017 (per resident):
- Charges - Sewerage: $11,155,000 ($184.81)
Other: $2,580,000 ($42.74)
Parks and Recreation: $585,000 ($9.69)
Parking Facilities: $435,000 ($7.21)
Solid Waste Management: $326,000 ($5.40)
Housing and Community Development: $74,000 ($1.23)
- Federal Intergovernmental - Housing and Community Development: $784,000 ($12.99)
Other: $223,000 ($3.69)
- Local Intergovernmental - Sewerage: $15,000 ($0.25)
- Miscellaneous - General Revenue - Other: $772,000 ($12.79)
Rents: $685,000 ($11.35)
Fines and Forfeits: $535,000 ($8.86)
Interest Earnings: $494,000 ($8.18)
Special Assessments: $70,000 ($1.16)
Donations From Private Sources: $40,000 ($0.66)
- State Intergovernmental - Other: $2,130,000 ($35.29)
Highways: $1,157,000 ($19.17)
General Local Government Support: $64,000 ($1.06)
- Tax - General Sales and Gross Receipts: $22,407,000 ($371.22)
Property: $14,313,000 ($237.13)
Public Utilities Sales: $2,100,000 ($34.79)
Other License: $1,397,000 ($23.14)
Other Selective Sales: $1,250,000 ($20.71)
Occupation and Business License - Other: $365,000 ($6.05)
Documentary and Stock Transfer: $292,000 ($4.84)
La Mesa government finances - Debt in 2017 (per resident):
- Long Term Debt - Beginning Outstanding - Unspecified Public Purpose: $43,985,000 ($728.71)
Outstanding Unspecified Public Purpose: $43,591,000 ($722.18)
Retired Unspecified Public Purpose: $2,327,000 ($38.55)
Issue, Unspecified Public Purpose: $1,932,000 ($32.01)
La Mesa government finances - Cash and Securities in 2017 (per resident):
- Bond Funds - Cash and Securities: $3,162,000 ($52.39)
- Other Funds - Cash and Securities: $58,019,000 ($961.22)
- Sinking Funds - Cash and Securities: $2,611,000 ($43.26)
5.18% of this county's 2021 resident taxpayers lived in other counties in 2020 ($90,734 average adjusted gross income)
| Here: | 5.18% |
| California average: | 5.19% |
0.14% of residents moved from foreign countries ($1,493 average AGI)
San Diego County: 0.14% California average: 0.03%
Top counties from which taxpayers relocated into this county between 2020 and 2021:
| from Los Angeles County, CA | |
| from Riverside County, CA | |
| from Orange County, CA |
5.71% of this county's 2020 resident taxpayers moved to other counties in 2021 ($83,556 average adjusted gross income)
| Here: | 5.71% |
| California average: | 6.14% |
0.09% of residents moved to foreign countries ($1,067 average AGI)
San Diego County: 0.09% California average: 0.02%
Top counties to which taxpayers relocated from this county between 2020 and 2021:
| to Riverside County, CA | |
| to Los Angeles County, CA | |
| to Orange County, CA |
| Businesses in La Mesa, CA | ||||
| Name | Count | Name | Count | |
|---|---|---|---|---|
| 24 Hour Fitness | 3 | Little Caesars Pizza | 1 | |
| 7-Eleven | 7 | Macy's | 1 | |
| 99 Cents Only Stores | 1 | MasterBrand Cabinets | 11 | |
| AT&T | 2 | McDonald's | 3 | |
| Albertsons | 1 | Men's Wearhouse | 1 | |
| Arby's | 1 | Motel 6 | 1 | |
| AutoZone | 1 | Motherhood Maternity | 3 | |
| Barnes & Noble | 1 | New Balance | 2 | |
| Baskin-Robbins | 1 | Nike | 2 | |
| Bath & Body Works | 1 | Office Depot | 1 | |
| Big O Tires | 1 | Olive Garden | 1 | |
| Blockbuster | 1 | Outback | 1 | |
| Burlington Coat Factory | 1 | Outback Steakhouse | 1 | |
| CVS | 2 | Panda Express | 2 | |
| Carl\s Jr. | 1 | Panera Bread | 1 | |
| Charlotte Russe | 1 | Payless | 1 | |
| Chevrolet | 1 | Pier 1 Imports | 1 | |
| Chipotle | 1 | Pizza Hut | 1 | |
| Chuck E. Cheese's | 1 | Quiznos | 1 | |
| Circle K | 1 | RadioShack | 2 | |
| Cold Stone Creamery | 1 | Red Lobster | 1 | |
| Costco | 1 | Rodeway Inn | 1 | |
| Curves | 2 | Safeway | 3 | |
| DHL | 1 | Sprint Nextel | 1 | |
| Days Inn | 1 | Staples | 1 | |
| Dennys | 1 | Starbucks | 9 | |
| Discount Tire | 1 | Subway | 6 | |
| Domino's Pizza | 1 | Super 8 | 1 | |
| Ethan Allen | 1 | T-Mobile | 3 | |
| Famous Footwear | 1 | Target | 1 | |
| FedEx | 11 | Toys"R"Us | 2 | |
| Firestone Complete Auto Care | 1 | Travelodge | 1 | |
| GameStop | 1 | U-Haul | 2 | |
| Goodwill | 1 | UPS | 16 | |
| H&R Block | 4 | Vans | 1 | |
| Holiday Inn | 2 | Verizon Wireless | 2 | |
| IHOP | 2 | Vons | 3 | |
| Jamba Juice | 2 | Walmart | 1 | |
| Jones New York | 5 | Wendy's | 1 | |
| Kroger | 1 | YMCA | 1 | |
Strongest AM radio stations in La Mesa:
- KFMB (760 AM; 50 kW; SAN DIEGO, CA; Owner: MIDWEST TELEVISION, INC.)
- KCBQ (1170 AM; 50 kW; SAN DIEGO, CA; Owner: RADIO 1210, INC.)
- KOGO (600 AM; 5 kW; SAN DIEGO, CA; Owner: CITICASTERS LICENSES, L.P.)
- KSDO (1130 AM; 10 kW; SAN DIEGO, CA; Owner: HI-FAVOR BROADCASTING, LLC)
- KPOP (1360 AM; 5 kW; SAN DIEGO, CA; Owner: CITICASTERS LICENSES, L.P.)
- KURS (1040 AM; 5 kW; SAN DIEGO, CA; Owner: QUETZAL BILINGUAL COMMUNICATIONS INC)
- KECR (910 AM; 5 kW; EL CAJON, CA; Owner: FAMILY STATIONS, INC.)
- KPRZ (1210 AM; 20 kW; SAN MARCOS, CA; Owner: RADIO 1210, INC.)
- KSON (1240 AM; 1 kW; SAN DIEGO, CA; Owner: JEFFERSON-PILOT COMMUNICATIONS COMPANY OF CALIFORNIA)
- KFI (640 AM; 50 kW; LOS ANGELES, CA; Owner: CAPSTAR TX LIMITED PARTNERSHIP)
- KPLS (830 AM; 50 kW; ORANGE, CA; Owner: CRN LICENSES, LLC)
- KLAC (570 AM; 50 kW; LOS ANGELES, CA; Owner: AMFM RADIO LICENSES, L.L.C.)
- KTNQ (1020 AM; 50 kW; LOS ANGELES, CA; Owner: KTNQ-AM LICENSE CORP.)
Strongest FM radio stations in La Mesa:
- KPBS-FM (89.5 FM; SAN DIEGO, CA; Owner: THE BD. OF TRUSTEES, CALIFORNIA STATE UNIVERSITY)
- KGB-FM (101.5 FM; SAN DIEGO, CA; Owner: CITICASTERS LICENSES, L.P.)
- KSON-FM (97.3 FM; SAN DIEGO, CA; Owner: JEFFERSON-PILOT COMMUNICATIONS COMPANY OF CALIFORNIA)
- KLNV (106.5 FM; SAN DIEGO, CA; Owner: HBC LICENSE CORPORATION)
- KHTS-FM (93.3 FM; EL CAJON, CA; Owner: CITICASTERS LICENSES, L.P.)
- K210CL (89.9 FM; LEMON GROVE, CA; Owner: SANTA MONICA COMMUNITY COLLEGE DISTRICT)
- KIOZ (105.3 FM; SAN DIEGO, CA; Owner: CITICASTERS LICENSES, L.P.)
- KLQV (102.9 FM; SAN DIEGO, CA; Owner: HBC LICENSE CORPORATION)
- KPRI-FM2 (102.1 FM; LA MESA, CA; Owner: COMPASS RADIO OF SAN DIEGO, INC.)
- KBZT (94.9 FM; SAN DIEGO, CA; Owner: JEFFERSON-PILOT COMMUNICATIONS COMPANY OF CALIFORNIA)
- KIFM (98.1 FM; SAN DIEGO, CA; Owner: JEFFERSON-PILOT COMMUNICATIONS COMPANY OF CALIFORNIA)
- KYXY (96.5 FM; SAN DIEGO, CA; Owner: INFINITY RADIO OPERATIONS INC.)
- KOCL (95.7 FM; CARLSBAD, CA; Owner: CITICASTERS LICENSES, L.P.)
- KLVJ (100.1 FM; JULIAN, CA; Owner: EDUCATIONAL MEDIA FOUNDATION)
- KFMB-FM (100.7 FM; SAN DIEGO, CA; Owner: MIDWEST TELEVISION, INC.)
- KMYI (94.1 FM; SAN DIEGO, CA; Owner: CITICASTERS LICENSES, L.P.)
- KWVE (107.9 FM; SAN CLEMENTE, CA; Owner: CALVARY CHAPEL OF COSTA MESA)
- KPLN (103.7 FM; SAN DIEGO, CA; Owner: INFINITY RADIO OPERATIONS INC.)
- KRTM (88.9 FM; TEMECULA, CA; Owner: PENFOLD COMMUNICATIONS, INC.)
- KFSD-FM (92.1 FM; ESCONDIDO, CA; Owner: NORTH COUNTY BROADCASTING CORP.)
TV broadcast stations around La Mesa:
- KBOP-LP (Channel 25; SAN DIEGO, CA; Owner: COMMERCIAL BROADCASTING CORP.)
- K63EN (Channel 63; SAN DIEGO, CA; Owner: CIVIC LIGHT, INC.)
- KBNT-CA (Channel 17; SAN DIEGO, CA; Owner: ENTRAVISION HOLDINGS, L.L.C.)
- K61GH (Channel 61; NATIONAL CITY, CA; Owner: TV-61 SAN DIEGO, INC.)
- KSWB-TV (Channel 69; SAN DIEGO, CA; Owner: KSWB INC.)
- KUSI-TV (Channel 51; SAN DIEGO, CA; Owner: CHANNEL 51 OF SAN DIEGO, INC.)
- KPBS (Channel 15; SAN DIEGO, CA; Owner: BOARD OF TRUSTEES FOR SAN DIEGO UNIV.)
- KNSD (Channel 39; SAN DIEGO, CA; Owner: STATION VENTURE OPERATIONS, LP)
- KFMB-TV (Channel 8; SAN DIEGO, CA; Owner: MIDWEST TELEVISION, INC.)
- KGTV (Channel 10; SAN DIEGO, CA; Owner: MCGRAW-HILL BROADCASTING COMPANY, INC.)
- K59AL (Channel 59; LA JOLLA, CA; Owner: BOARD OF TRUSTEES FOR SAN DIEGO UNIVERSITY)
- KSDX-LP (Channel 29; SAN DIEGO, CA; Owner: KRCA LICENSE CORP.)
- K35DG (Channel 35; LA JOLLA, CA; Owner: THE REGENTS OF THE UNIV. OF CALIFORNIA)
- KNSD-LP (Channel 62; LA JOLLA, CA; Owner: STATION VENTURE OPERATIONS, LP)
- National Bridge Inventory (NBI) Statistics
- 119Number of bridges
- 1,775ft / 541mTotal length
- $6,764,000Total costs
- 6,109,172Total average daily traffic
- 166,192Total average daily truck traffic
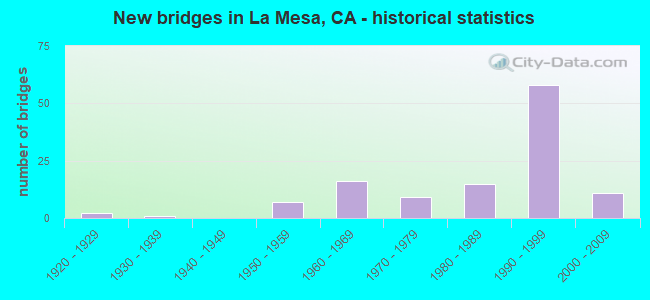
- New bridges - historical statistics
- 21920-1929
- 11930-1939
- 71950-1959
- 161960-1969
- 91970-1979
- 151980-1989
- 581990-1999
- 112000-2009
FCC Registered Antenna Towers:
143 (See the full list of FCC Registered Antenna Towers in La Mesa)FCC Registered Private Land Mobile Towers:
1 (See the full list of FCC Registered Private Land Mobile Towers in La Mesa, CA)FCC Registered Broadcast Land Mobile Towers:
21 (See the full list of FCC Registered Broadcast Land Mobile Towers)FCC Registered Microwave Towers:
7- STATION, Grossmont Hospital 5555 Grossmont Center Dr (Lat: 32.777528 Lon: -117.012806), Structure height: 36.6 m, Overall height: 42.7 m, Call Sign: WNEG960,
Assigned Frequencies: 2183.20 MHz, 2139.60 MHz, Grant Date: 08/15/2001, Expiration Date: 11/07/2011, Cancellation Date: 02/05/2002, Phone: (619) 694-2620
- GROSSMONT, 5555 Grossmont Cntr Dr (Lat: 32.780861 Lon: -117.006694), Overall height: 17.4 m, Call Sign: WPJC226,
Assigned Frequencies: 10626.2 MHz, Grant Date: 11/13/1995, Expiration Date: 02/01/2001, Cancellation Date: 02/20/1998, Registrant: Airtouch Cellular, 5355 Mira Sorrento Pl Suite 500, San Diego, CA 92121
- LA MESA PD, 8085 University Ave (Lat: 32.767306 Lon: -117.023167), Type: Bant, Structure height: 16.8 m, Overall height: 18.8 m, Call Sign: WQNH750,
Assigned Frequencies: 11625.0 MHz, 11305.0 MHz, Grant Date: 12/15/2020, Expiration Date: 02/08/2031, Certifier: Anna L Holmes, Registrant: County Of San Diego, 5595 Overland Ave, Suite#101, San Diego, CA 92123, Phone: (858) 256-2143, Fax: (858) 569-5905, Email:
- SANLM0001, 5150 Wilsom St (Lat: 32.772944 Lon: -117.007000), Type: Building, Structure height: 8.2 m, Overall height: 8.7 m, Call Sign: WRDQ980,
Assigned Frequencies: 17840.0 MHz, 17840.0 MHz, 17840.0 MHz, 17840.0 MHz, Grant Date: 07/02/2019, Expiration Date: 07/02/2029, Certifier: David Hertgen, Registrant: Wiline Spectrum Holdings LLC, 2955 Campus Drive, Suite 100, San Mateo, CA 94403, Phone: (650) 523-2143, Email:
- MURRAY SUB, El Paso St & Samuel St (Lat: 32.791167 Lon: -117.023139), Type: Mtower, Structure height: 12.2 m, Overall height: 15.2 m, Call Sign: WRJV610, Licensee ID: L00013978,
Assigned Frequencies: 11265.0 MHz, 11265.0 MHz, 11265.0 MHz, 11265.0 MHz, 11265.0 MHz, 11265.0 MHz, 11265.0 MHz, 11265.0 MHz, 11265.0 MHz, 11265.0 MHz, Grant Date: 11/03/2020, Expiration Date: 11/03/2030, Certifier: Ali Atoui, Registrant: San Diego Gas & Electric Company, 8680 Balboa Ave, San Diego, CA 92123, Phone: (503) 680-0966, Email:
- LA MESA, 7840 El Cajon Blvd (Lat: 32.768722 Lon: -117.029194), Type: Mast, Structure height: 25.9 m, Call Sign: WLU305,
Assigned Frequencies: 11245.0 MHz, 11405.0 MHz, 11365.0 MHz, Grant Date: 01/25/2011, Expiration Date: 02/01/2021, Cancellation Date: 06/20/2013, Certifier: Brian D Kidney, Registrant: Verizon Wireless, 1120 Sanctuary Pkwy, #150 Gasa5reg, Alpharetta, GA 30009-7630, Phone: (770) 797-1070, Fax: (770) 797-1036, Email:
- LA MESA, 7777 Alvarado Rd (Lat: 32.771139 Lon: -117.031417), Overall height: 31.4 m, Call Sign: WLV978,
Assigned Frequencies: 18585.0 MHz, Grant Date: 03/06/2001, Expiration Date: 02/01/2011, Cancellation Date: 01/14/2002, Certifier: William P Barr, Registrant: At&t Wireless Services, Inc., 1150 Connecticut Avenue, N.W., 4th Floor, Washington, DC 20036, Phone: (202) 416-6540, Fax: (202) 223-9095, Email:
FCC Registered Amateur Radio Licenses:
560 (See the full list of FCC Registered Amateur Radio Licenses in La Mesa)FAA Registered Aircraft Manufacturers and Dealers:
5 (See the full list of FAA Registered Manufacturers and Dealers in La Mesa)FAA Registered Aircraft:
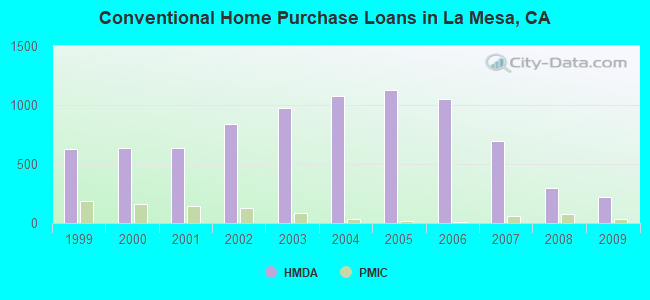
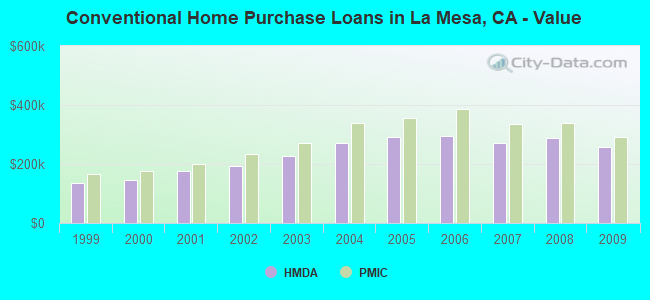
76 (See the full list of FAA Registered Aircraft)| Home Mortgage Disclosure Act Aggregated Statistics For Year 2009 (Based on 10 full and 2 partial tracts) | ||||||||||||||
| A) FHA, FSA/RHS & VA Home Purchase Loans | B) Conventional Home Purchase Loans | C) Refinancings | D) Home Improvement Loans | E) Loans on Dwellings For 5+ Families | F) Non-occupant Loans on < 5 Family Dwellings (A B C & D) | G) Loans On Manufactured Home Dwelling (A B C & D) | ||||||||
|---|---|---|---|---|---|---|---|---|---|---|---|---|---|---|
| Number | Average Value | Number | Average Value | Number | Average Value | Number | Average Value | Number | Average Value | Number | Average Value | Number | Average Value | |
| LOANS ORIGINATED | 196 | $306,230 | 222 | $256,786 | 914 | $263,401 | 33 | $171,810 | 6 | $1,754,500 | 91 | $231,060 | 1 | $307,350 |
| APPLICATIONS APPROVED, NOT ACCEPTED | 30 | $308,291 | 43 | $297,670 | 109 | $297,474 | 4 | $187,970 | 1 | $2,000,000 | 14 | $232,250 | 0 | $0 |
| APPLICATIONS DENIED | 30 | $305,518 | 51 | $333,142 | 323 | $294,012 | 18 | $100,193 | 1 | $500,000 | 52 | $211,281 | 0 | $0 |
| APPLICATIONS WITHDRAWN | 44 | $292,221 | 43 | $243,152 | 214 | $281,381 | 9 | $132,836 | 1 | $334,970 | 26 | $234,158 | 0 | $0 |
| FILES CLOSED FOR INCOMPLETENESS | 5 | $251,306 | 5 | $347,534 | 50 | $318,635 | 6 | $109,525 | 0 | $0 | 6 | $203,155 | 0 | $0 |
Detailed mortgage data for all 12 tracts in La Mesa, CA
| Private Mortgage Insurance Companies Aggregated Statistics For Year 2009 (Based on 10 full and 2 partial tracts) | ||||
| A) Conventional Home Purchase Loans | B) Refinancings | |||
|---|---|---|---|---|
| Number | Average Value | Number | Average Value | |
| LOANS ORIGINATED | 30 | $290,823 | 13 | $325,536 |
| APPLICATIONS APPROVED, NOT ACCEPTED | 12 | $298,450 | 7 | $353,703 |
| APPLICATIONS DENIED | 7 | $275,927 | 7 | $387,336 |
| APPLICATIONS WITHDRAWN | 0 | $0 | 2 | $303,000 |
| FILES CLOSED FOR INCOMPLETENESS | 0 | $0 | 0 | $0 |
2005 - 2018 National Fire Incident Reporting System (NFIRS) incidents
- Fire incident types reported to NFIRS in La Mesa, CA
- 26539.7%Structure Fires
- 19228.8%Outside Fires
- 15623.4%Mobile Property/Vehicle Fires
- 548.1%Other
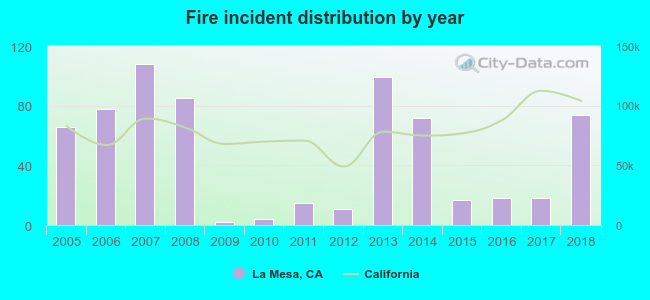 Based on the data from the years 2005 - 2018 the average number of fires per year is 48. The highest number of reported fires - 108 took place in 2007, and the least - 2 in 2009. The data has a rising trend.
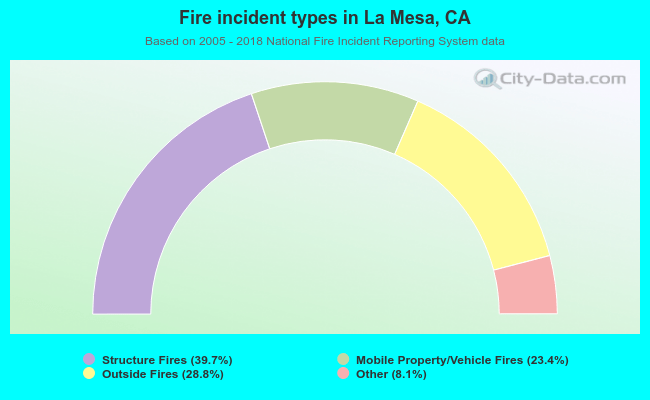 When looking into fire subcategories, the most reports belonged to: Structure Fires (39.7%), and Outside Fires (28.8%).
Fire-safe hotels and motels in La Mesa, California:
- Time Motel, 7682 El Cajon Blvd, La Mesa, California 92041 , Phone: (619) 470-0500
- Heritage Inn La Mesa, 7851 Fletcher Pkwy, La Mesa, California 92042 , Phone: (619) 698-9444
- Holiday Inn - La Mesa, 8000 Parkway Dr, La Mesa, California 91942 , Phone: (619) 698-7747, Fax: (619) 698-6347
- Holiday Inn Express, 9550 Murray Dr, La Mesa, California 91942 , Phone: (619) 466-0200
- Travelodge Of La Mesa, 7911 University Ave, La Mesa, California 91941 , Phone: (619) 466-5988, Fax: (619) 698-0404
- Super 8, 6952 University Ave, La Mesa, California 91942 , Phone: (619) 698-7333, Fax: (619) 589-1172
- Days Inn San Diego / Sdsu, 7475 El Cajon Blvd, La Mesa, California 91941 , Phone: (619) 697-9005, Fax: (619) 461-2121
- Best Western Plus La Mesa, 9550 Murray Dr, La mesa, California 91942 , Phone: (619) 466-0200, Fax: (619) 460-6674
| Most common first names in La Mesa, CA among deceased individuals | ||
| Name | Count | Lived (average) |
|---|---|---|
| John | 237 | 78.4 years |
| Mary | 229 | 82.4 years |
| Robert | 206 | 77.0 years |
| William | 180 | 78.6 years |
| James | 171 | 76.0 years |
| Helen | 150 | 83.8 years |
| Dorothy | 128 | 83.7 years |
| Margaret | 125 | 83.9 years |
| Charles | 113 | 80.0 years |
| Ruth | 112 | 84.6 years |
| Most common last names in La Mesa, CA among deceased individuals | ||
| Last name | Count | Lived (average) |
|---|---|---|
| Smith | 73 | 81.1 years |
| Johnson | 67 | 78.9 years |
| Brown | 49 | 80.8 years |
| Miller | 47 | 79.1 years |
| Anderson | 44 | 84.1 years |
| Martin | 36 | 77.9 years |
| Jones | 35 | 80.8 years |
| Davis | 34 | 78.1 years |
| Williams | 29 | 81.7 years |
| Thompson | 28 | 79.6 years |
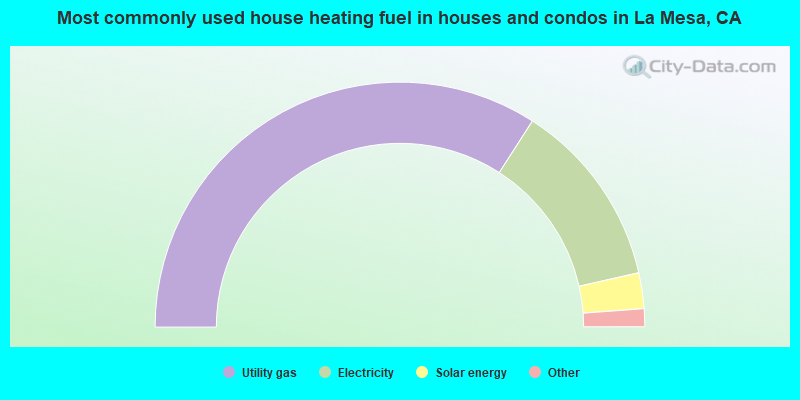
- 68.2%Utility gas
- 24.7%Electricity
- 4.7%Solar energy
- 1.2%Bottled, tank, or LP gas
- 0.6%No fuel used
- 0.5%Wood
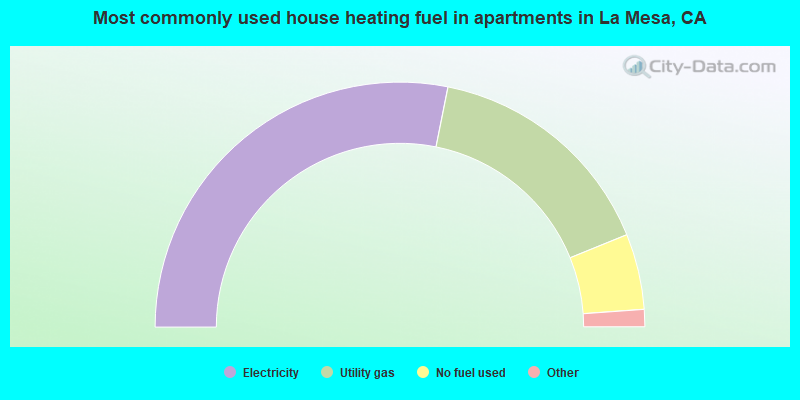
- 56.3%Electricity
- 31.4%Utility gas
- 10.0%No fuel used
- 0.8%Wood
- 0.7%Bottled, tank, or LP gas
- 0.5%Solar energy
- 0.2%Other fuel
La Mesa compared to California state average:
- Unemployed percentage significantly below state average.
- Median age above state average.
- Foreign-born population percentage below state average.
- Length of stay since moving in above state average.
La Mesa on our top lists:
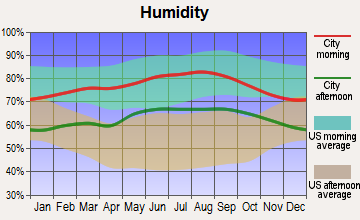
- #24 on the list of "Top 101 cities with the smallest differences between morning and afternoon humidity (population 50,000+)"
- #27 on the list of "Top 101 cities with the smallest humidity differences during a year (population 50,000+)"
- #30 on the list of "Top 101 cities with largest percentage of females in industries: arts, entertainment, and recreation (population 50,000+)"
- #32 on the list of "Top 101 cities with largest percentage of males in occupations: personal care and service occupations (population 50,000+)"
- #35 on the list of "Top 101 cities with largest percentage of males in industries: utilities (population 50,000+)"
- #57 on the list of "Top 100 cities with smallest houses (pop. 50,000+)"
- #65 on the list of "Top 100 cities with highest percentage of college students (pop. 50,000+)"
- #71 on the list of "Top 101 cities with largest percentage of males in occupations: installation, maintenance, and repair occupations (population 50,000+)"
- #75 on the list of "Top 101 cities with largest percentage of males in occupations: architecture and engineering occupations (population 50,000+)"
- #77 on the list of "Top 101 cities with largest percentage of males in occupations: community and social service occupations (population 50,000+)"
- #89 on the list of "Top 100 cities with highest ratio of median house value to median household income (pop. 50,000+)"
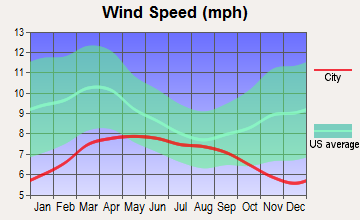
- #91 on the list of "Top 101 cities with the lowest average wind speeds (population 50,000+)"
- #101 on the list of "Top 101 cities with the smallest house values disparities (population 50,000+)"
- #4 on the list of "Top 101 counties with the most Catholic adherents"
- #4 on the list of "Top 101 counties with the highest lead air pollution readings in 2012 (µg/m3)"
- #7 on the list of "Top 101 counties with the most Evangelical Protestant congregations"
- #7 on the list of "Top 101 counties with the most Catholic congregations"
- #7 on the list of "Top 101 counties with the highest surface withdrawal of fresh water for public supply (pop. 50,000+)"

|
|
Total of 569 patent applications in 2008-2024.