Estimated zip code population in 2022: 40,654 Zip code population in 2010: 38,069 Zip code population in 2000: 24,000
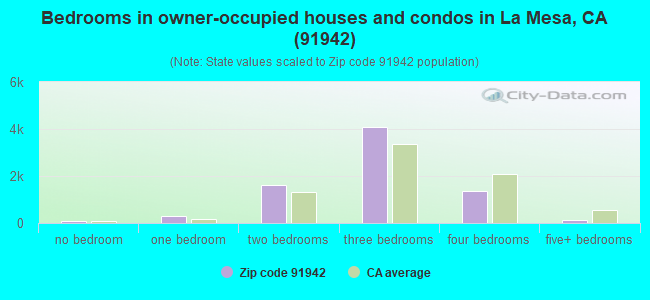
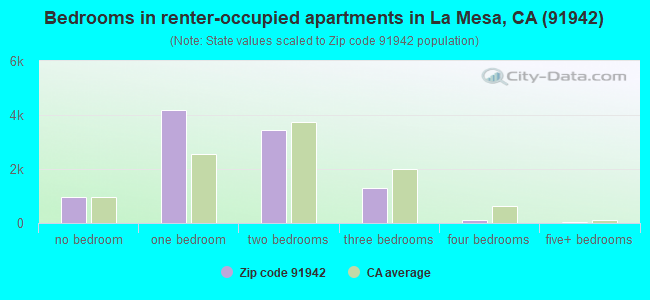
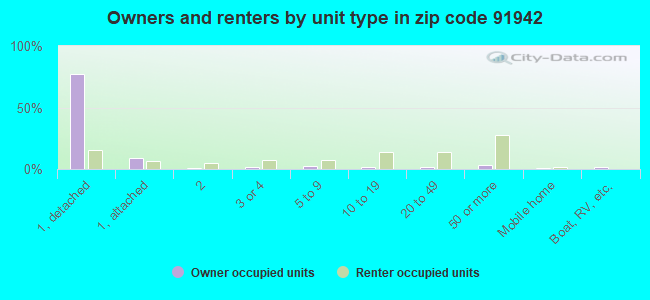
Houses and condos: 18,645 Renter-occupied apartments: 10,029
% of renters here:
57%
State:
44%
March 2022 cost of living index in zip code 91942: 122.9 (high, U.S. average is 100)
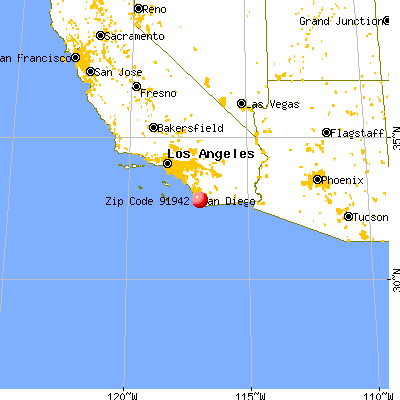
Land area: 5.8 sq. mi. Water area: 0.0 sq. mi.
Population density: 6,968 people per square mile
(high).
OSM Map
General Map
Google Map
MSN Map
OSM Map
General Map
Google Map
MSN Map
OSM Map
General Map
Google Map
MSN Map
OSM Map
General Map
Google Map
MSN Map
Please wait while loading the map...
Real estate property taxes paid for housing units in 2022:
This zip code:
0.6% ($4,421)
California:
0.7% ($4,831)
Median real estate property taxes paid for housing units with mortgages in 2022: $4,997 (0.7%) Median real estate property taxes paid for housing units with no mortgage in 2022: $2,904 (0.4%)
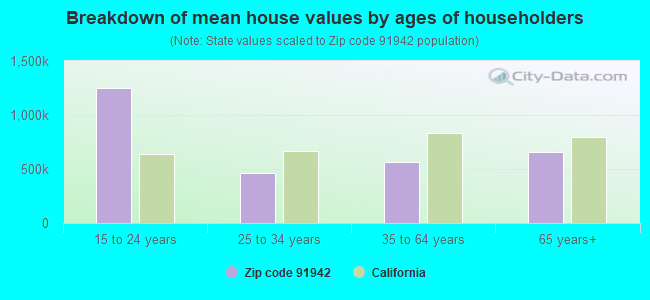
Estimated median house/condo value in 2022: $700,915
91942:
$700,915
California:
$715,900
According to our research of California and other state lists, there were 56 registered sex offenders living in 91942 zip code as of April 27, 2024. The ratio of all residents to sex offenders in zip code 91942 is 721 to 1. The ratio of registered sex offenders to all residents in this zip code is near the state average.
Median resident age:
This zip code:
37.0 years
California median age:
37.9 years
Average household size:
This zip code:
2.3 people
California:
2.8 people
Averages for the 2020 tax year for zip code 91942, filed in 2021:
Average Adjusted Gross Income (AGI) in 2020: $67,515 (Individual Income Tax Returns)
Here:
$67,515
State:
$95,910
Salary/wage: $61,409 (reported on 80.4% of returns)
Here:
$61,409
State:
$77,331
(% of AGI for various income ranges: 1124.5% for AGIs below $25k, 3801.0% for AGIs $25k-50k, 7021.6% for AGIs $50k-75k, 10066.7% for AGIs $75k-100k, 19032.3% for AGIs $100k-200k, 59064.0% for AGIs over 200k)
Taxable interest for individuals: $925 (reported on 34.8% of returns)
This zip code:
$925
California:
$2,294
(% of AGI for various income ranges: 19.7% for AGIs below $25k, 20.1% for AGIs $25k-50k, 36.5% for AGIs $50k-75k, 55.2% for AGIs $75k-100k, 95.5% for AGIs $100k-200k, 653.2% for AGIs over 200k)
Ordinary dividends: $5,007 (reported on 18.1% of returns)
Here:
$5,007
State:
$10,949
(% of AGI for various income ranges: 32.5% for AGIs below $25k, 42.3% for AGIs $25k-50k, 85.7% for AGIs $50k-75k, 128.6% for AGIs $75k-100k, 225.2% for AGIs $100k-200k, 3090.4% for AGIs over 200k)
Net capital gain/loss in AGI: +$14,351 (reported on 17.8% of returns)
Here:
+$14,351
State:
+$49,306
(% of AGI for various income ranges: 10.7% for AGIs below $25k, 26.2% for AGIs $25k-50k, 66.7% for AGIs $50k-75k, 157.8% for AGIs $75k-100k, 402.5% for AGIs $100k-200k, 16144.0% for AGIs over 200k)
Profit/loss from business: +$10,128 (reported on 16.2% of returns)
Here:
+$10,128
State:
+$15,671
(% of AGI for various income ranges: 131.4% for AGIs below $25k, 135.6% for AGIs $25k-50k, 167.6% for AGIs $50k-75k, 236.9% for AGIs $75k-100k, 576.8% for AGIs $100k-200k, 2092.4% for AGIs over 200k)
Taxable individual retirement arrangement distribution: $17,035 (reported on 7.7% of returns)
91942:
$17,035
California:
$23,505
(% of AGI for various income ranges: 52.7% for AGIs below $25k, 84.8% for AGIs $25k-50k, 158.6% for AGIs $50k-75k, 319.5% for AGIs $75k-100k, 480.7% for AGIs $100k-200k, 1694.4% for AGIs over 200k)
Self-employed (Keogh) retirement plans: $15,875 (reported on 0.4% of returns)
91942:
$15,875
California:
$30,163
(% of AGI for various income ranges: 9.5% for AGIs $50k-75k, 20.1% for AGIs $100k-200k, 253.2% for AGIs over 200k)
Total itemized deductions: $29,467 (reported on 13.8% of returns)
Here:
$29,467
State:
$39,517
(% of AGI for various income ranges: 77.6% for AGIs below $25k, 160.0% for AGIs $25k-50k, 415.9% for AGIs $50k-75k, 924.6% for AGIs $75k-100k, 1795.5% for AGIs $100k-200k, 6662.8% for AGIs over 200k)
Charity contributions: $5,139 (reported on 11.1% of returns)
Here:
$5,139
State:
$12,598
(% of AGI for various income ranges: 4.7% for AGIs below $25k, 15.1% for AGIs $25k-50k, 54.4% for AGIs $50k-75k, 112.2% for AGIs $75k-100k, 240.7% for AGIs $100k-200k, 1361.6% for AGIs over 200k)
Taxes paid: $8,179 (reported on 13.8% of returns)
91942:
$8,179
State:
$8,807
(% of AGI for various income ranges: 14.7% for AGIs below $25k, 28.2% for AGIs $25k-50k, 107.1% for AGIs $50k-75k, 286.4% for AGIs $75k-100k, 582.1% for AGIs $100k-200k, 1418.8% for AGIs over 200k)
Earned income credit: $1,699 (reported on 11.6% of returns)
Here:
$1,699
State:
$2,074
(% of AGI for various income ranges: 65.3% for AGIs below $25k, 44.6% for AGIs $25k-50k, 0.8% for AGIs $50k-75k)
Percentage of individuals using paid preparers for their 2020 taxes: 93.7%
Here:
94%
State:
92%
(% for various income ranges: 92.0% for AGIs below $25k, 94.3% for AGIs $25k-50k, 93.2% for AGIs $50k-75k, 94.1% for AGIs $75k-100k, 95.1% for AGIs $100k-200k, 96.0% for AGIs over 200k)
Averages for the 2012 tax year for zip code 91942, filed in 2013:
Average Adjusted Gross Income (AGI) in 2012: $51,776 (Individual Income Tax Returns)
Here:
$51,776
State:
$72,726
Salary/wage: $48,109 (reported on 81.0% of returns)
Here:
$48,109
State:
$59,079
(% of AGI for various income ranges: 68.8% for AGIs below $25k, 79.4% for AGIs $25k-50k, 78.4% for AGIs $50k-75k, 77.0% for AGIs $75k-100k, 76.9% for AGIs $100k-200k, 54.3% for AGIs over 200k)
Taxable interest for individuals: $902 (reported on 36.0% of returns)
This zip code:
$902
California:
$2,146
(% of AGI for various income ranges: 1.2% for AGIs below $25k, 0.6% for AGIs $25k-50k, 0.5% for AGIs $50k-75k, 0.5% for AGIs $75k-100k, 0.4% for AGIs $100k-200k, 1.1% for AGIs over 200k)
Ordinary dividends: $3,863 (reported on 17.9% of returns)
Here:
$3,863
State:
$9,308
(% of AGI for various income ranges: 1.9% for AGIs below $25k, 0.9% for AGIs $25k-50k, 1.1% for AGIs $50k-75k, 1.0% for AGIs $75k-100k, 1.2% for AGIs $100k-200k, 3.9% for AGIs over 200k)
Net capital gain/loss in AGI: +$5,061 (reported on 14.5% of returns)
Here:
+$5,061
State:
+$30,460
(% of AGI for various income ranges: 0.2% for AGIs $50k-75k, 0.4% for AGIs $75k-100k, 1.0% for AGIs $100k-200k, 13.8% for AGIs over 200k)
Profit/loss from business: +$11,880 (reported on 15.4% of returns)
Here:
+$11,880
State:
+$17,064
(% of AGI for various income ranges: 9.4% for AGIs below $25k, 4.1% for AGIs $25k-50k, 2.7% for AGIs $50k-75k, 2.2% for AGIs $75k-100k, 3.0% for AGIs $100k-200k, 3.0% for AGIs over 200k)
Taxable individual retirement arrangement distribution: $12,396 (reported on 9.6% of returns)
91942:
$12,396
California:
$19,557
(% of AGI for various income ranges: 3.1% for AGIs below $25k, 2.0% for AGIs $25k-50k, 2.2% for AGIs $50k-75k, 2.3% for AGIs $75k-100k, 2.3% for AGIs $100k-200k, 2.2% for AGIs over 200k)
Self-employment retirement plans: $15,038 (reported on 0.4% of returns)
91942:
$15,038
California:
$24,530
Total itemized deductions: $22,285 (26% of AGI, reported on 33.4% of returns)
Here:
$22,285
State:
$34,004
Here:
25.6% of AGI
State:
22.7% of AGI
(% of AGI for various income ranges: 11.4% for AGIs below $25k, 9.8% for AGIs $25k-50k, 13.3% for AGIs $50k-75k, 15.9% for AGIs $75k-100k, 17.9% for AGIs $100k-200k, 15.0% for AGIs over 200k)
Charity contributions: $2,665 (reported on 27.6% of returns)
Here:
$2,665
State:
$4,659
(% of AGI for various income ranges: 0.7% for AGIs below $25k, 0.9% for AGIs $25k-50k, 1.3% for AGIs $50k-75k, 1.6% for AGIs $75k-100k, 1.8% for AGIs $100k-200k, 1.7% for AGIs over 200k)
Taxes paid: $7,270 (reported on 33.2% of returns)
91942:
$7,270
State:
$14,448
(% of AGI for various income ranges: 1.8% for AGIs below $25k, 2.0% for AGIs $25k-50k, 3.7% for AGIs $50k-75k, 5.1% for AGIs $75k-100k, 6.8% for AGIs $100k-200k, 8.1% for AGIs over 200k)
Earned income credit: $1,852 (reported on 14.2% of returns)
Here:
$1,852
State:
$2,286
(% of AGI for various income ranges: 4.5% for AGIs below $25k, 0.6% for AGIs $25k-50k)
Percentage of individuals using paid preparers for their 2012 taxes: 53.0%
Here:
53%
State:
64%
(% for various income ranges: 48.5% for AGIs below $25k, 51.8% for AGIs $25k-50k, 54.4% for AGIs $50k-75k, 57.0% for AGIs $75k-100k, 61.9% for AGIs $100k-200k, 73.9% for AGIs over 200k)
Averages for the 2004 tax year for zip code 91942, filed in 2005:
Average Adjusted Gross Income (AGI) in 2004: $43,527 (Individual Income Tax Returns)
Here:
$43,527
State:
$58,600
Salary/wage: $40,350 (reported on 79.6% of returns)
Here:
$40,350
State:
$49,455
(% of AGI for various income ranges: 104.4% for AGIs below $10k, 70.6% for AGIs $10k-25k, 78.4% for AGIs $25k-50k, 78.6% for AGIs $50k-75k, 78.9% for AGIs $75k-100k, 62.0% for AGIs over 100k)
Taxable interest for individuals: $1,450 (reported on 49.0% of returns)
This zip code:
$1,450
California:
$2,365
(% of AGI for various income ranges: 8.4% for AGIs below $10k, 3.0% for AGIs $10k-25k, 1.4% for AGIs $25k-50k, 1.2% for AGIs $50k-75k, 1.0% for AGIs $75k-100k, 1.8% for AGIs over 100k)
Taxable dividends: $2,810 (reported on 24.3% of returns)
Here:
$2,810
State:
$4,746
(% of AGI for various income ranges: 6.0% for AGIs below $10k, 2.5% for AGIs $10k-25k, 1.3% for AGIs $25k-50k, 1.1% for AGIs $50k-75k, 0.9% for AGIs $75k-100k, 2.1% for AGIs over 100k)
Net capital gain/loss: +$6,189 (reported on 20.3% of returns)
Here:
+$6,189
State:
+$23,418
(% of AGI for various income ranges: -2.1% for AGIs below $10k, -0.0% for AGIs $10k-25k, 0.1% for AGIs $25k-50k, 0.8% for AGIs $50k-75k, 1.4% for AGIs $75k-100k, 9.6% for AGIs over 100k)
Profit/loss from business: +$10,053 (reported on 13.9% of returns)
Here:
+$10,053
State:
+$16,826
(% of AGI for various income ranges: 1.3% for AGIs below $10k, 6.0% for AGIs $10k-25k, 3.5% for AGIs $25k-50k, 2.7% for AGIs $50k-75k, 3.2% for AGIs $75k-100k, 2.3% for AGIs over 100k)
IRA payment deduction: $2,748 (reported on 2.6% of returns)
91942:
$2,748
California:
$3,192
(% of AGI for various income ranges: 0.3% for AGIs $10k-25k, 0.2% for AGIs $25k-50k, 0.2% for AGIs $50k-75k, 0.2% for AGIs $75k-100k, 0.1% for AGIs over 100k)
Self-employed pension: $9,853 (reported on 0.8% of returns)
Here:
$9,853
California:
$17,688
(% of AGI for various income ranges: 0.1% for AGIs $10k-25k, 0.1% for AGIs $25k-50k, 0.1% for AGIs $50k-75k, 0.2% for AGIs $75k-100k, 0.4% for AGIs over 100k)
Total itemized deductions: $20,401 (28% of AGI, reported on 34.2% of returns)
Here:
$20,401
State:
$28,113
Here:
27.5% of AGI
State:
25.3% of AGI
(% of AGI for various income ranges: 33.3% for AGIs below $10k, 10.8% for AGIs $10k-25k, 12.3% for AGIs $25k-50k, 17.1% for AGIs $50k-75k, 19.3% for AGIs $75k-100k, 17.7% for AGIs over 100k)
Charity contributions deductions: $2,585 (3% of AGI, reported on 29.8% of returns)
Here:
$2,585
State:
$3,923
Here:
3.3% of AGI
State:
3.3% of AGI
(% of AGI for various income ranges: 1.5% for AGIs below $10k, 1.0% for AGIs $10k-25k, 1.2% for AGIs $25k-50k, 1.9% for AGIs $50k-75k, 2.3% for AGIs $75k-100k, 2.2% for AGIs over 100k)
Total tax: $5,676 (reported on 82.4% of returns)
91942:
$5,676
State:
$10,761
(% of AGI for various income ranges: 3.9% for AGIs below $10k, 5.0% for AGIs $10k-25k, 8.1% for AGIs $25k-50k, 9.8% for AGIs $50k-75k, 10.6% for AGIs $75k-100k, 16.6% for AGIs over 100k)
Earned income credit: $1,306 (reported on 9.8% of returns)
Here:
$1,306
State:
$1,763
Percentage of individuals using paid preparers for their 2004 taxes: 56.2%
Here:
56%
State:
66%
(% for various income ranges: 47.5% for AGIs below $10k, 54.5% for AGIs $10k-25k, 54.5% for AGIs $25k-50k, 60.2% for AGIs $50k-75k, 63.9% for AGIs $75k-100k, 70.7% for AGIs over 100k)
Likely homosexual households (counted as self-reported same-sex unmarried-partner households)
Lesbian couples: 0.2% of all households
Gay men: 0.2% of all households
Household received Food Stamps/SNAP in the past 12 months: 1,861 Household did not receive Food Stamps/SNAP in the past 12 months: 15,729
Women who had a birth in the past 12 months: 644 (460 now married, 184 unmarried) Women who did not have a birth in the past 12 months: 10,028 (3,651 now married, 6,390 unmarried)
Housing units in zip code 91942 with a mortgage: 5,149 (468 second mortgage, 346 both second mortgage and home equity loan) Houses without a mortgage: 53
Median monthly owner costs for units with a mortgage: $2,560 Median monthly owner costs for units without a mortgage: $649
Residents with income below the poverty level in 2022:
This zip code:
11.9%
Whole state:
12.2%
Residents with income below 50% of the poverty level in 2022:
This zip code:
5.9%
Whole state:
6.2%
Median number of rooms in houses and condos:
Here:
5.7
State:
6.0
Median number of rooms in apartments:
Here:
3.4
State:
3.9
Notable locations in this zip code not listed on our city pages
Notable locations in zip code 91942: Sun Valley Golf Course (A), La Mesa Memorial Fine Arts Center (B), South County Regional Center San Diego County Library (C), La Mesa Civic Center (D), Americare Ambulance Service La Mesa (E), La Mesa Fire District Station 12 (F), La Mesa Fire District Station 11 (G), La Mesa Library (H), Herrick Community Health Library (I), Grossmont Healthcare District Library (J). Display/hide their locations on the map
Shopping Centers: Village Station Shopping Center (1), Village Shopping Center (2), Lake Murray Square Shopping Center (3), La Mesa Town and Country Shopping Center (4), La Mesa Square Shopping Center (5), La Mesa Springs Shopping Center (6), La Mesa Crossroads Shopping Center (7), Grossmont Shopping Center (8), Fletcher Hills Shopping Center (9). Display/hide their locations on the map
Churches in zip code 91942 include: Del Cerro Baptist Church (A), Calvary Chapel of La Mesa (B), First Assembly of God Church (C), First Missionary Baptist Church (D), Lake Murray Evangelical Free Church (E), Saint Lukes Lutheran Church (F), United Church of Christ (G), Christ Lutheran Church (H), The Church of Jesus Christ of Latter Day Saints (I). Display/hide their locations on the map
Parks in zip code 91942 include: Jackson Park (1), MacArthur Park (2), Porter Park (3), Rolando Park (4), Sunset Park (5), Aztec Park (6), Briercrest Park (7), La Mesita Park (8), MacArthur Park Recreation Center (9). Display/hide their locations on the map
4,651 married couples with children.
2,165 single-parent households (754 men, 1,411 women).
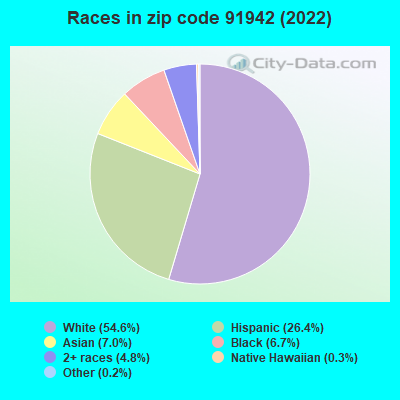
74.9% of residents of 91942 zip code speak English at home.
13.5% of residents speak Spanish at home (76% very well, 11% well, 9% not well, 4% not at all).
4.1% of residents speak other Indo-European language at home (64% very well, 26% well, 6% not well, 4% not at all).
5.1% of residents speak Asian or Pacific Island language at home (68% very well, 19% well, 13% not well, 1% not at all).
2.1% of residents speak other language at home (85% very well, 13% well, 2% not well).
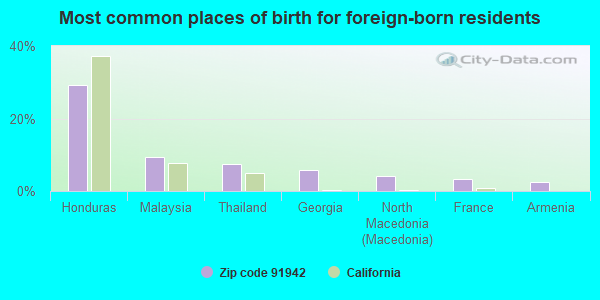
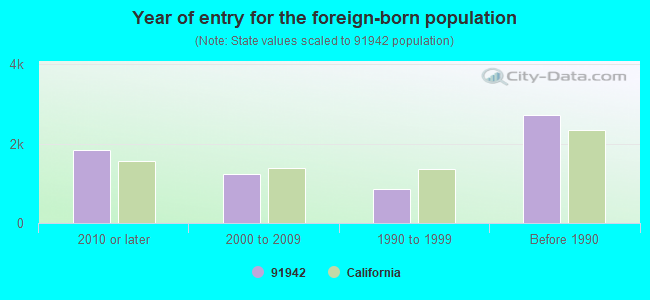
Foreign born population: 5,856 (14.4%) (67.5% of them are naturalized citizens)
Major facilities with environmental interests located in this zip code:
EXXONMOBIL OIL CORPORATION (5900 SEVERIN DRIVE in LA MESA, CA)
CRITERIA AND HAZARDOUS AIR POLLUTANT INVENTORY (Inventory of air pollution sources) HAZARDOUS WASTE BIENNIAL REPORTER (Resource Conservation and Recovery Act (tracking hazardous waste)) Large Quantity Generators, more that 1000 kg of hazardous waste/month (Resource Conservation and Recovery Act (tracking hazardous waste)) Large Quantity Generators, more that 1000 kg of hazardous waste/month (Resource Conservation and Recovery Act (tracking hazardous waste)) Business SIC classification: GASOLINE SERVICE STATIONS Alternative names: EXXONMOBIL OIL CORPORATION 12268, MOBIL / LA MESA
CHEVRON STATION NO 92884 (5600 BALTIMORE DRIVE in LA MESA, CA)
STATE MASTER (California - Hazardous Waste Tracking) - HAZARDOU WASTE PROGRAM CRITERIA AND HAZARDOUS AIR POLLUTANT INVENTORY (Inventory of air pollution sources) Small Quantity Generators, between 100 kg and 1000 kg of hazardous waste/month (Resource Conservation and Recovery Act (tracking hazardous waste)) Small Quantity Generators, between 100 kg and 1000 kg of hazardous waste/month (Resource Conservation and Recovery Act (tracking hazardous waste)) - notification Business SIC classification: GASOLINE SERVICE STATIONS Organizations: CHEVRON PRODUCTS CO (CONTACT/OWNER)
Alternative names: CHEVRON STATION 9 2884
ARCO #9578 (9600 MURRAY DRIVE in LA MESA, CA)
STATE MASTER (California - Hazardous Waste Tracking) - HAZARDOU WASTE PROGRAM CRITERIA AND HAZARDOUS AIR POLLUTANT INVENTORY (Inventory of air pollution sources) Small Quantity Generators, between 100 kg and 1000 kg of hazardous waste/month (Resource Conservation and Recovery Act (tracking hazardous waste)) - notification Business SIC classification: GASOLINE SERVICE STATIONS Organizations: B P WEST COAST PRODUCTS L L C (CONTACT/OWNER)
Alternative names: ARCO FACILITY NO 09578, BP WEST COAST PRODUCTS LLC 09578, PRESTIGE STATIONS INC NO 9578
MURRAY MANOR ELEMENTARY (8305 EL PASO ST. in LA MESA, CA)
(National Center for Education Statistics) - STATE ID-6038533 Organizations: LA MESA-SPRING VALLEY (SCHOOL DISTRICT)
NORTHMONT ELEMENTARY (9405 GREGORY ST. in LA MESA, CA)
(National Center for Education Statistics) - STATE ID-6038541 Organizations: LA MESA-SPRING VALLEY (SCHOOL DISTRICT)
ALVARADO WATER TREATMENT PLANT (5540 KIOWA DRIVE in LA MESA, CA)
Conditionally Exempt Small Quantity Generators, less than 100 kg/month of hazardous waste (Resource Conservation and Recovery Act (tracking hazardous waste)) HAZARDOUS WASTE BIENNIAL REPORTER (Resource Conservation and Recovery Act (tracking hazardous waste)) Organizations: WATER DEPT CITY OF SD (CONTACT/OPERATOR)
Alternative names: ALVARADO WATER TRETMENT PLANT, SDCITY WATER ALVARADO WFP, SDCTY-ALVARADO WATER FILTRATION PLANT
LOUIS J LEVY M D (8881 FLETCHER PKWT STE 108 in LA MESA, CA)
(Resource Conservation and Recovery Act (tracking hazardous waste))
AFFORDABLE PAINT AND BODY (8181 CENTER ST in LA MESA, CA)
Small Quantity Generators, between 100 kg and 1000 kg of hazardous waste/month (Resource Conservation and Recovery Act (tracking hazardous waste)) Organizations: DLRV ENTERPRISES INC (CONTACT/OPERATOR)
, BRIAN (CONTACT/OWNER)
EXXON SERVICE STATION (5302 LAKE MURRAY in LA MESA, CA)
Small Quantity Generators, between 100 kg and 1000 kg of hazardous waste/month (Resource Conservation and Recovery Act (tracking hazardous waste)) - notification Organizations: EQUILON ENTERPRISES L L C (CONTACT/OWNER)
FLIERS INC (5364 LAKE MURRAY BLVD in LA MESA, CA)
TRANSPORTER (Resource Conservation and Recovery Act (tracking hazardous waste)) Organizations: EARL F TRITT JR (CONTACT/OWNER)
GROSSMONT PERINATAL ASSOC (8851 CENTER DR STE 502 in LA MESA, CA)
Small Quantity Generators, between 100 kg and 1000 kg of hazardous waste/month (Resource Conservation and Recovery Act (tracking hazardous waste)) - notification Organizations: THOMAS C KEY MD GROSSMONT HOSP (CONTACT/OWNER)
LAMESA SHEET METAL WORKS INC (8135 CENTER ST in LA MESA, CA)
Small Quantity Generators, between 100 kg and 1000 kg of hazardous waste/month (Resource Conservation and Recovery Act (tracking hazardous waste))
ARCO #1712 (8303 PARKWAY DR in LA MESA, CA)
CRITERIA AND HAZARDOUS AIR POLLUTANT INVENTORY (Inventory of air pollution sources) Business SIC classification: GASOLINE SERVICE STATIONS
Housing units lacking complete plumbing facilities: 0.4% Housing units lacking complete kitchen facilities: 1.5%
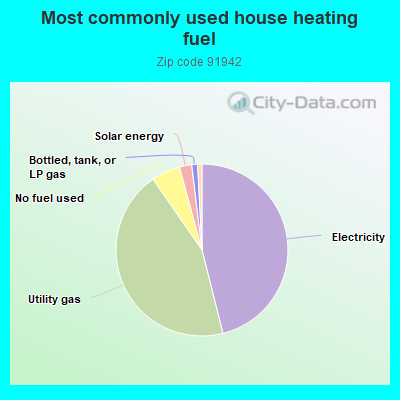
46.0%Electricity
44.2%Utility gas
5.4%No fuel used
2.3%Solar energy
1.1%Bottled, tank, or LP gas
0.8%Wood
Population in 1990: 23,944. Population change in the 1990s: +56 (+0.2%).
Place of birth for U.S.-born residents:
This state: 23,480
Northeast: 2,154
Midwest: 3,237
South: 3,140
West: 1,843
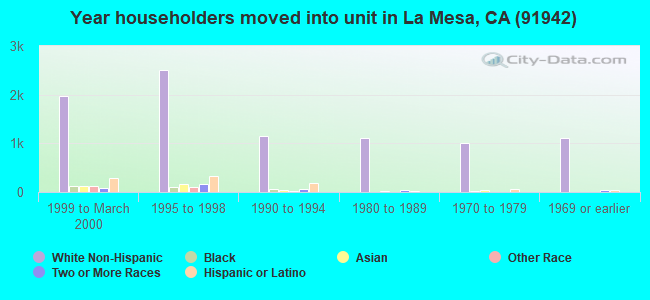
50% of the 91942 zip code residents lived in the same house 5 years ago. Out of people who lived in different houses, 68% lived in this county. Out of people who lived in different counties, 50% lived in California.
86% of the 91942 zip code residents lived in the same house 1 year ago. Out of people who lived in different houses, 69% moved from this county. Out of people who lived in different houses, 13% moved from different county within same state. Out of people who lived in different houses, 10% moved from different state. Out of people who lived in different houses, 4% moved from abroad.
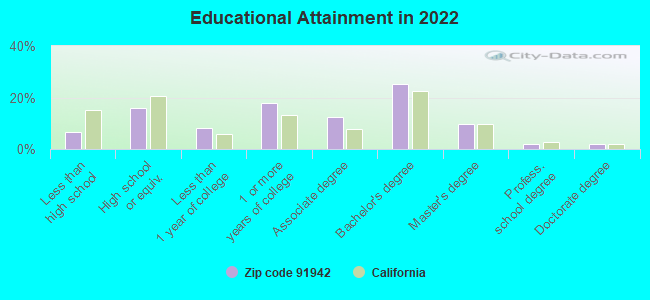
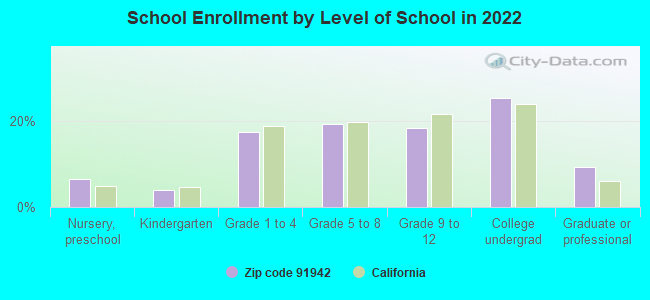
Private vs. public school enrollment:
Students in private schools in grades 1 to 8 (elementary and middle school): 530
Here:
15.8%
California:
10.5%
Students in private schools in grades 9 to 12 (high school): 195
Here:
11.6%
California:
8.5%
Students in private undergraduate colleges: 334
Here:
14.5%
California:
15.9%
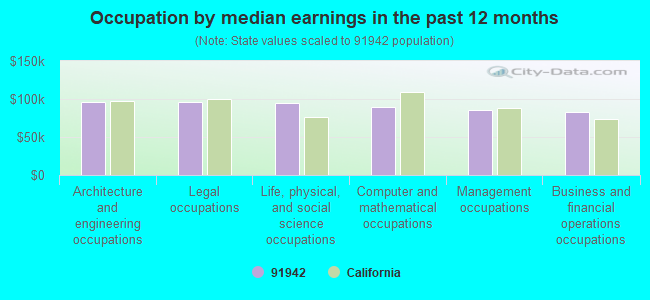
Occupation by median earnings in the past 12 months ($)
96,119Architecture and engineering occupations
95,501Legal occupations
94,951Life, physical, and social science occupations
89,144Computer and mathematical occupations
85,986Management occupations
82,803Business and financial operations occupations
Companies with biggest federal contracts located in this zip code (LA MESA, CA):
WM G TADLOCK, INC (9131 FLETCHER PARKWAY SUIT; small business) : $598,260 in 40 contractsfrom 1999 to 2002
Contracts for Construction of Structures and Facilities -- Office Buildings, Construction of Structures and Facilities -- Laboratories and Clinics, Maintenance, Repair or Alteration of Real Property -- Troop Housing Facilities by Public Buildings Service, Navy Signed by year:2000: $479,640; 2001: $15,137; 2002: $77,419; 2003: $0; 2004: $0; 2005: $0; 2006: $0.
Biggest contracts:
$260,000 with Public Buildings Service for Construction of Structures and Facilities -- Office Buildings. Signed on 2000-10-15. Completion date: 2000-02-15.
$260,000, same as above.Signed on 2000-05-15. Completion date: 2000-02-15.
$62,435 with Navy for Construction of Structures and Facilities -- Laboratories and Clinics. Taking place in WA. Signed on 2000-03-28. Completion date: 2000-08-13.
$37,110, same as above.Signed on 2000-05-04. Completion date: 2000-08-13.
WAGERS,TANYA L (5560 SHASTA LANE; small business) : $190,861 in 3 contractsfrom 2004 to 2005
$86,861 with Navy for Other Medical Services. Signed on 2005-10-20. Completion date: 2005-09-30.
$83,520, same as above.Signed on 2004-10-21. Completion date: 2005-09-30.
$20,480, same as above.Signed on 2004-07-01. Completion date: 2004-09-30.
RHONDA L S DUTTON (5590 SHASTA LANE; small business)
$42,463 with Navy for Other Medical Services. Taking place in NC. Signed on 2000-02-08. Completion date: 2000-09-30.
ACE COATING CO , INC (8333 CASE ST; small business)
$39,472 with Air Force for Paints, Dopes, Varnishes, and Related Products. Taking place in NM. Signed on 2001-02-28. Completion date: 2001-03-06.
AUDIO ASSOCIATES OF SAN DIEGO (8200 CENTER DRIVE; small business) : $20,611 in 2 contractsin 2003
$12,911 with Navy for Video Recording and Reproducing Equipment. Signed on 2003-08-14. Completion date: 2003-09-26.
$7,700 with Navy for Inspection Services (including commercial testing and lab services, except medical/dental) -- Maintenance and Repair Shop Equipment. Signed on 2003-09-27. Completion date: 2004-09-30.
TELCOM DATA, INC (8265 COMMERCIAL ST STE 17; small business) : $18,640 in 3 contractsfrom 2002 to 2006
$37,840 with Navy for Maintenance, Repair and Rebuilding of Equipment -- Fire Fighting, Rescue, and Safety Equipment; and Environmental Protection Equipment and Materials. Signed on 2002-10-10. Completion date: 2003-10-09.
$5,000 with Navy for Telephone and/or Communications Services (includes Telegraph, Telex, and Cablevision Services). Signed on 2006-03-14. Completion date: 2006-03-15.
-$24,200 with Navy for Maintenance, Repair and Rebuilding of Equipment -- Fire Fighting, Rescue, and Safety Equipment; and Environmental Protection Equipment and Materials. Signed on 2002-12-12. Completion date: 2003-10-09.
COAST RESTAURANT SUPPLY (8120 COMMERCIAL STREET; small business) : $15,312 in 2 contractsin 2003
$12,644 with Navy for Kitchen Hand Tools and Utensils. Signed on 2003-05-29. Completion date: 2003-06-20.
$2,668 with Navy for Kitchen Equipment and Appliances. Signed on 2003-04-11. Completion date: 2003-04-24.
BRODINGS BATTERY WAREHOUSE, IN (8188 COMMERICAL STREET; small business) : $7,426 in 2 contractsin 2003
$3,972 with Navy for Miscellaneous Vehicular Components. Signed on 2003-03-18. Completion date: 2003-04-12.
$3,454 with Navy for Batteries, Nonrechargeable. Signed on 2003-06-18. Completion date: 2003-07-09.
COMMERCIAL ELECTRIC APPLIANCE (8110 COMMERCIAL ST; small business)
$3,284 with Navy for Fastening Device. Signed on 2004-11-12. Completion date: 2004-12-02.
EMERGE INDUSTRIES, INC (8186 CENTER ST STE H; small business)
$680 with Navy for Textile Fabrics. Signed on 2006-01-26. Completion date: 2006-02-06.
Top industries in this zip code by the number of employees in 2005:
Health Care and Social Assistance: Offices of Physicians (except Mental Health Specialists) (100-249: 1, 50-99: 1, 20-49: 3, 10-19: 11, 5-9: 17, 1-4: 53)
2005 - 2018 National Fire Incident Reporting System (NFIRS) incidents
According to the data from the years 2005 - 2018 the average number of fires per year is 21. The highest number of reported fire incidents - 48 took place in 2013, and the least - 4 in 2012. The data has an increasing trend.
When looking into fire subcategories, the most incidents belonged to: Structure Fires (40.8%), and Outside Fires (28.7%).
Fire incident types reported to NFIRS in Zip Code 91942


 Nearest zip codes: 91941, 92119, 91945, 92120, 92115, 92020.


 According to the data from the years 2005 - 2018 the average number of fires per year is 21. The highest number of reported fire incidents - 48 took place in 2013, and the least - 4 in 2012. The data has an increasing trend.
 When looking into fire subcategories, the most incidents belonged to: Structure Fires (40.8%), and Outside Fires (28.7%).