Estimated zip code population in 2022: 33,323 Zip code population in 2010: 31,779 Zip code population in 2000: 44,651
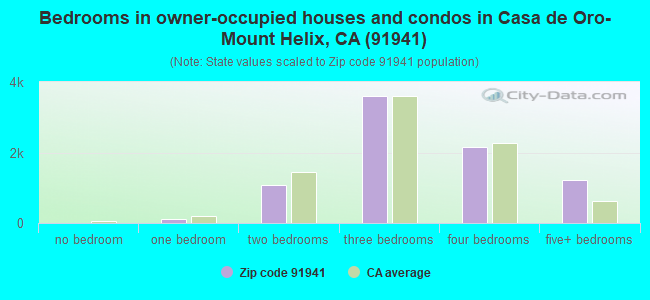
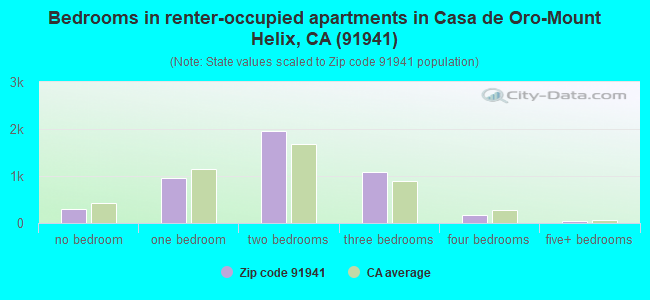
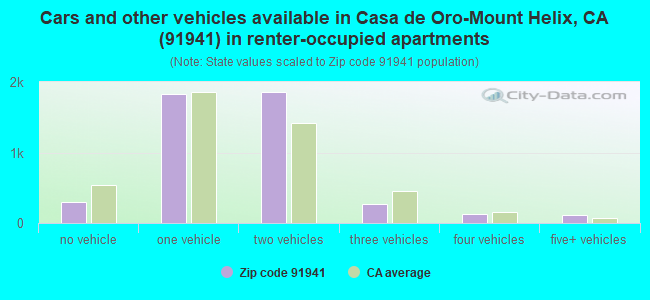
Houses and condos: 13,116 Renter-occupied apartments: 4,493
% of renters here:
35%
State:
44%
March 2022 cost of living index in zip code 91941: 122.9 (high, U.S. average is 100)
Land area: 8.1 sq. mi. Water area: 0.0 sq. mi.
Population density: 4,132 people per square mile
(average).
OSM Map
General Map
Google Map
MSN Map
OSM Map
General Map
Google Map
MSN Map
OSM Map
General Map
Google Map
MSN Map
OSM Map
General Map
Google Map
MSN Map
Please wait while loading the map...
Real estate property taxes paid for housing units in 2022:
This zip code:
0.7% ($6,031)
California:
0.7% ($4,831)
Median real estate property taxes paid for housing units with mortgages in 2022: $6,787 (0.7%) Median real estate property taxes paid for housing units with no mortgage in 2022: $4,034 (0.4%)
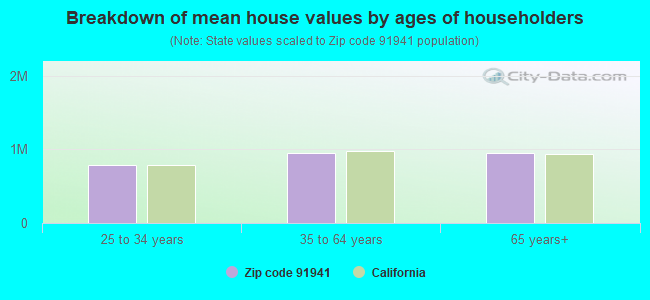
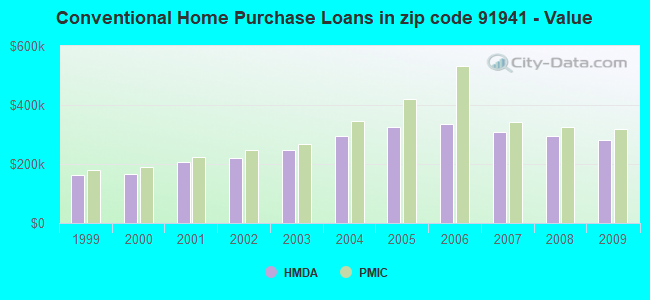
Estimated median house/condo value in 2022: $914,610
91941:
$914,610
California:
$715,900
According to our research of California and other state lists, there were 33 registered sex offenders living in 91941 zip code as of April 27, 2024. The ratio of all residents to sex offenders in zip code 91941 is 1,017 to 1. The ratio of registered sex offenders to all residents in this zip code is lower than the state average.
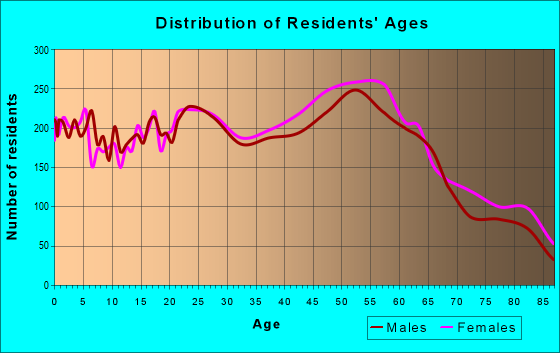
Median resident age:
This zip code:
41.5 years
California median age:
37.9 years
Average household size:
This zip code:
2.6 people
California:
2.8 people
Averages for the 2020 tax year for zip code 91941, filed in 2021:
Average Adjusted Gross Income (AGI) in 2020: $94,912 (Individual Income Tax Returns)
Here:
$94,912
State:
$95,910
Salary/wage: $75,534 (reported on 77.2% of returns)
Here:
$75,534
State:
$77,331
(% of AGI for various income ranges: 1158.9% for AGIs below $25k, 3793.8% for AGIs $25k-50k, 6667.4% for AGIs $50k-75k, 9588.5% for AGIs $75k-100k, 18859.1% for AGIs $100k-200k, 72539.4% for AGIs over 200k)
Taxable interest for individuals: $1,873 (reported on 43.0% of returns)
This zip code:
$1,873
California:
$2,294
(% of AGI for various income ranges: 24.3% for AGIs below $25k, 26.2% for AGIs $25k-50k, 62.1% for AGIs $50k-75k, 117.3% for AGIs $75k-100k, 233.1% for AGIs $100k-200k, 1314.5% for AGIs over 200k)
Ordinary dividends: $6,993 (reported on 25.4% of returns)
Here:
$6,993
State:
$10,949
(% of AGI for various income ranges: 42.8% for AGIs below $25k, 57.0% for AGIs $25k-50k, 138.2% for AGIs $50k-75k, 227.6% for AGIs $75k-100k, 524.2% for AGIs $100k-200k, 2993.2% for AGIs over 200k)
Net capital gain/loss in AGI: +$21,832 (reported on 24.4% of returns)
Here:
+$21,832
State:
+$49,306
(% of AGI for various income ranges: 13.4% for AGIs below $25k, 33.7% for AGIs $25k-50k, 117.0% for AGIs $50k-75k, 259.2% for AGIs $75k-100k, 689.2% for AGIs $100k-200k, 15247.9% for AGIs over 200k)
Profit/loss from business: +$14,940 (reported on 18.4% of returns)
Here:
+$14,940
State:
+$15,671
(% of AGI for various income ranges: 137.7% for AGIs below $25k, 174.6% for AGIs $25k-50k, 272.7% for AGIs $50k-75k, 297.1% for AGIs $75k-100k, 751.2% for AGIs $100k-200k, 3912.3% for AGIs over 200k)
Taxable individual retirement arrangement distribution: $24,065 (reported on 10.1% of returns)
91941:
$24,065
California:
$23,505
(% of AGI for various income ranges: 53.9% for AGIs below $25k, 90.6% for AGIs $25k-50k, 240.3% for AGIs $50k-75k, 455.7% for AGIs $75k-100k, 892.6% for AGIs $100k-200k, 2990.2% for AGIs over 200k)
Self-employed (Keogh) retirement plans: $25,711 (reported on 1.1% of returns)
91941:
$25,711
California:
$30,163
(% of AGI for various income ranges: 15.6% for AGIs $50k-75k, 52.3% for AGIs $100k-200k, 811.1% for AGIs over 200k)
Total itemized deductions: $35,364 (reported on 20.9% of returns)
Here:
$35,364
State:
$39,517
(% of AGI for various income ranges: 126.1% for AGIs below $25k, 220.2% for AGIs $25k-50k, 589.7% for AGIs $50k-75k, 1248.2% for AGIs $75k-100k, 2720.9% for AGIs $100k-200k, 10365.3% for AGIs over 200k)
Charity contributions: $6,936 (reported on 17.8% of returns)
Here:
$6,936
State:
$12,598
(% of AGI for various income ranges: 8.2% for AGIs below $25k, 26.8% for AGIs $25k-50k, 59.8% for AGIs $50k-75k, 144.7% for AGIs $75k-100k, 397.0% for AGIs $100k-200k, 2318.1% for AGIs over 200k)
Taxes paid: $8,842 (reported on 20.8% of returns)
91941:
$8,842
State:
$8,807
(% of AGI for various income ranges: 26.4% for AGIs below $25k, 48.4% for AGIs $25k-50k, 151.1% for AGIs $50k-75k, 361.8% for AGIs $75k-100k, 811.1% for AGIs $100k-200k, 2079.4% for AGIs over 200k)
Earned income credit: $1,808 (reported on 10.8% of returns)
Here:
$1,808
State:
$2,074
(% of AGI for various income ranges: 64.1% for AGIs below $25k, 59.0% for AGIs $25k-50k, 0.8% for AGIs $50k-75k)
Percentage of individuals using paid preparers for their 2020 taxes: 93.2%
Here:
93%
State:
92%
(% for various income ranges: 91.4% for AGIs below $25k, 93.1% for AGIs $25k-50k, 93.1% for AGIs $50k-75k, 93.3% for AGIs $75k-100k, 94.2% for AGIs $100k-200k, 95.8% for AGIs over 200k)
Averages for the 2012 tax year for zip code 91941, filed in 2013:
Average Adjusted Gross Income (AGI) in 2012: $74,108 (Individual Income Tax Returns)
Here:
$74,108
State:
$72,726
Salary/wage: $60,283 (reported on 77.8% of returns)
Here:
$60,283
State:
$59,079
(% of AGI for various income ranges: 71.7% for AGIs below $25k, 75.0% for AGIs $25k-50k, 70.4% for AGIs $50k-75k, 65.4% for AGIs $75k-100k, 67.7% for AGIs $100k-200k, 49.4% for AGIs over 200k)
Taxable interest for individuals: $1,869 (reported on 44.5% of returns)
This zip code:
$1,869
California:
$2,146
(% of AGI for various income ranges: 1.4% for AGIs below $25k, 0.8% for AGIs $25k-50k, 0.9% for AGIs $50k-75k, 1.1% for AGIs $75k-100k, 0.9% for AGIs $100k-200k, 1.5% for AGIs over 200k)
Ordinary dividends: $7,051 (reported on 25.7% of returns)
Here:
$7,051
State:
$9,308
(% of AGI for various income ranges: 2.2% for AGIs below $25k, 1.4% for AGIs $25k-50k, 1.6% for AGIs $50k-75k, 1.8% for AGIs $75k-100k, 1.9% for AGIs $100k-200k, 4.1% for AGIs over 200k)
Net capital gain/loss in AGI: +$15,177 (reported on 22.3% of returns)
Here:
+$15,177
State:
+$30,460
(% of AGI for various income ranges: 0.3% for AGIs $25k-50k, 0.4% for AGIs $50k-75k, 0.7% for AGIs $75k-100k, 1.4% for AGIs $100k-200k, 13.3% for AGIs over 200k)
Profit/loss from business: +$16,330 (reported on 17.7% of returns)
Here:
+$16,330
State:
+$17,064
(% of AGI for various income ranges: 8.9% for AGIs below $25k, 4.9% for AGIs $25k-50k, 3.6% for AGIs $50k-75k, 3.5% for AGIs $75k-100k, 3.5% for AGIs $100k-200k, 3.4% for AGIs over 200k)
Taxable individual retirement arrangement distribution: $18,911 (reported on 12.5% of returns)
91941:
$18,911
California:
$19,557
(% of AGI for various income ranges: 3.8% for AGIs below $25k, 2.6% for AGIs $25k-50k, 3.6% for AGIs $50k-75k, 3.9% for AGIs $75k-100k, 3.4% for AGIs $100k-200k, 2.7% for AGIs over 200k)
Self-employment retirement plans: $23,365 (reported on 1.3% of returns)
91941:
$23,365
California:
$24,530
(% of AGI for various income ranges: 0.3% for AGIs below $25k, 0.2% for AGIs $50k-75k, 0.4% for AGIs $100k-200k, 0.8% for AGIs over 200k)
Total itemized deductions: $30,453 (24% of AGI, reported on 43.1% of returns)
Here:
$30,453
State:
$34,004
Here:
23.6% of AGI
State:
22.7% of AGI
(% of AGI for various income ranges: 13.9% for AGIs below $25k, 13.1% for AGIs $25k-50k, 17.3% for AGIs $50k-75k, 19.6% for AGIs $75k-100k, 20.6% for AGIs $100k-200k, 16.4% for AGIs over 200k)
Charity contributions: $3,686 (reported on 36.9% of returns)
Here:
$3,686
State:
$4,659
(% of AGI for various income ranges: 0.9% for AGIs below $25k, 1.1% for AGIs $25k-50k, 1.7% for AGIs $50k-75k, 2.0% for AGIs $75k-100k, 2.2% for AGIs $100k-200k, 1.9% for AGIs over 200k)
Taxes paid: $11,928 (reported on 42.9% of returns)
91941:
$11,928
State:
$14,448
(% of AGI for various income ranges: 2.8% for AGIs below $25k, 3.0% for AGIs $25k-50k, 4.8% for AGIs $50k-75k, 6.1% for AGIs $75k-100k, 8.0% for AGIs $100k-200k, 9.1% for AGIs over 200k)
Earned income credit: $2,033 (reported on 13.8% of returns)
Here:
$2,033
State:
$2,286
(% of AGI for various income ranges: 5.2% for AGIs below $25k, 0.9% for AGIs $25k-50k)
Percentage of individuals using paid preparers for their 2012 taxes: 58.4%
Here:
58%
State:
64%
(% for various income ranges: 50.2% for AGIs below $25k, 54.0% for AGIs $25k-50k, 59.7% for AGIs $50k-75k, 64.4% for AGIs $75k-100k, 68.5% for AGIs $100k-200k, 79.8% for AGIs over 200k)
Averages for the 2004 tax year for zip code 91941, filed in 2005:
Average Adjusted Gross Income (AGI) in 2004: $55,867 (Individual Income Tax Returns)
Here:
$55,867
State:
$58,600
Salary/wage: $46,428 (reported on 78.9% of returns)
Here:
$46,428
State:
$49,455
(% of AGI for various income ranges: 119.8% for AGIs below $10k, 72.3% for AGIs $10k-25k, 77.7% for AGIs $25k-50k, 73.7% for AGIs $50k-75k, 73.4% for AGIs $75k-100k, 53.9% for AGIs over 100k)
Taxable interest for individuals: $2,146 (reported on 52.3% of returns)
This zip code:
$2,146
California:
$2,365
(% of AGI for various income ranges: 8.5% for AGIs below $10k, 2.6% for AGIs $10k-25k, 1.7% for AGIs $25k-50k, 1.7% for AGIs $50k-75k, 1.6% for AGIs $75k-100k, 2.1% for AGIs over 100k)
Taxable dividends: $3,632 (reported on 27.7% of returns)
Here:
$3,632
State:
$4,746
(% of AGI for various income ranges: 8.0% for AGIs below $10k, 2.0% for AGIs $10k-25k, 1.5% for AGIs $25k-50k, 1.5% for AGIs $50k-75k, 1.3% for AGIs $75k-100k, 2.0% for AGIs over 100k)
Net capital gain/loss: +$17,768 (reported on 23.7% of returns)
Here:
+$17,768
State:
+$23,418
(% of AGI for various income ranges: -5.5% for AGIs below $10k, 0.0% for AGIs $10k-25k, 0.5% for AGIs $25k-50k, 0.9% for AGIs $50k-75k, 1.9% for AGIs $75k-100k, 15.5% for AGIs over 100k)
Profit/loss from business: +$17,120 (reported on 17.6% of returns)
Here:
+$17,120
State:
+$16,826
(% of AGI for various income ranges: 14.0% for AGIs below $10k, 7.6% for AGIs $10k-25k, 4.7% for AGIs $25k-50k, 4.8% for AGIs $50k-75k, 5.3% for AGIs $75k-100k, 5.4% for AGIs over 100k)
IRA payment deduction: $3,079 (reported on 3.3% of returns)
91941:
$3,079
California:
$3,192
(% of AGI for various income ranges: 0.8% for AGIs below $10k, 0.2% for AGIs $10k-25k, 0.3% for AGIs $25k-50k, 0.2% for AGIs $50k-75k, 0.2% for AGIs $75k-100k, 0.1% for AGIs over 100k)
Self-employed pension: $15,883 (reported on 1.7% of returns)
Here:
$15,883
California:
$17,688
(% of AGI for various income ranges: 0.1% for AGIs $10k-25k, 0.1% for AGIs $25k-50k, 0.2% for AGIs $50k-75k, 0.3% for AGIs $75k-100k, 0.8% for AGIs over 100k)
Total itemized deductions: $25,269 (26% of AGI, reported on 40.8% of returns)
Here:
$25,269
State:
$28,113
Here:
25.6% of AGI
State:
25.3% of AGI
(% of AGI for various income ranges: 27.8% for AGIs below $10k, 13.4% for AGIs $10k-25k, 14.7% for AGIs $25k-50k, 21.1% for AGIs $50k-75k, 22.8% for AGIs $75k-100k, 18.1% for AGIs over 100k)
Charity contributions deductions: $3,410 (3% of AGI, reported on 36.4% of returns)
Here:
$3,410
State:
$3,923
Here:
3.3% of AGI
State:
3.3% of AGI
(% of AGI for various income ranges: 1.4% for AGIs below $10k, 1.2% for AGIs $10k-25k, 1.5% for AGIs $25k-50k, 2.3% for AGIs $50k-75k, 2.5% for AGIs $75k-100k, 2.5% for AGIs over 100k)
Total tax: $8,674 (reported on 80.7% of returns)
91941:
$8,674
State:
$10,761
(% of AGI for various income ranges: 5.7% for AGIs below $10k, 4.9% for AGIs $10k-25k, 7.6% for AGIs $25k-50k, 9.4% for AGIs $50k-75k, 10.3% for AGIs $75k-100k, 17.4% for AGIs over 100k)
Earned income credit: $1,523 (reported on 11.2% of returns)
Here:
$1,523
State:
$1,763
Percentage of individuals using paid preparers for their 2004 taxes: 62.0%
Here:
62%
State:
66%
(% for various income ranges: 52.8% for AGIs below $10k, 59.0% for AGIs $10k-25k, 59.8% for AGIs $25k-50k, 65.3% for AGIs $50k-75k, 66.7% for AGIs $75k-100k, 76.6% for AGIs over 100k)
Likely homosexual households (counted as self-reported same-sex unmarried-partner households)
Lesbian couples: 0.0% of all households
Gay men: 0.1% of all households
Household received Food Stamps/SNAP in the past 12 months: 1,242 Household did not receive Food Stamps/SNAP in the past 12 months: 11,337
Women who had a birth in the past 12 months: 327 (187 now married, 140 unmarried) Women who did not have a birth in the past 12 months: 7,366 (3,575 now married, 3,763 unmarried)
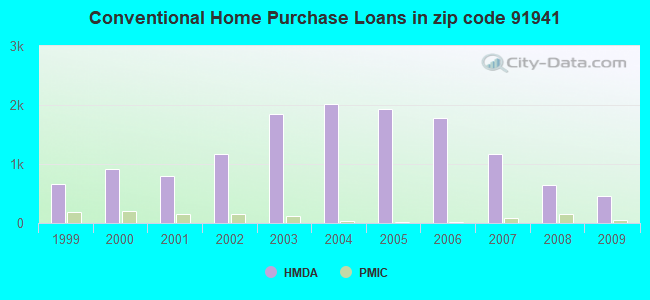
Housing units in zip code 91941 with a mortgage: 5,896 (749 second mortgage, 39 home equity loan, 612 both second mortgage and home equity loan) Houses without a mortgage: 221
Median monthly owner costs for units with a mortgage: $3,196 Median monthly owner costs for units without a mortgage: $829
Residents with income below the poverty level in 2022:
This zip code:
8.7%
Whole state:
12.2%
Residents with income below 50% of the poverty level in 2022:
This zip code:
5.4%
Whole state:
6.2%
Median number of rooms in houses and condos:
Here:
6.6
State:
6.0
Median number of rooms in apartments:
Here:
4.1
State:
3.9
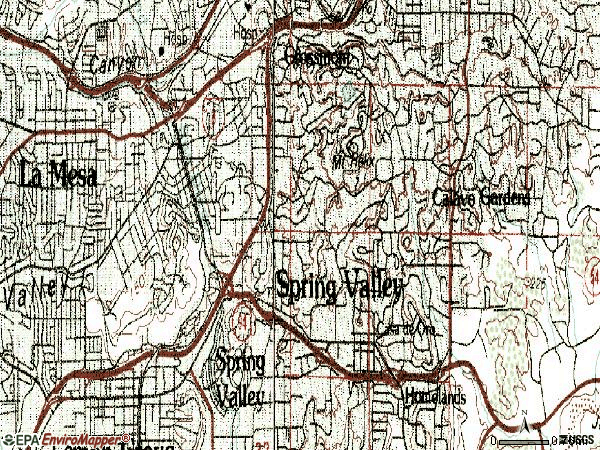
Notable locations in this zip code not listed on our city pages
Notable locations in zip code 91941: Helix Cross (A), Little Flower Haven (B), Schaefer Ambulance Service (C), San Miguel Consolidated Fire Protection District Station 21 (D), La Mesa Fire District Station 13 (E). Display/hide their locations on the map
Churches in zip code 91941 include: Evangelical Bible Church (A), Vista La Mesa Christian Church (B), Windsor Hills Baptist Church (C), Central Congregational Church (D), First United Methodist Church (E), Foothills United Methodist Church (F), Saint Andrews Episcopal Church (G), Shepherd of the Valley Lutheran Church (H), La Mesa Adventist Community Church (I). Display/hide their locations on the map
Parks in zip code 91941 include: Collier Park (1), Eucalyptus Park (2), Highwood Park (3), Vista La Mesa Park (4), Deputy Lonnie G Brewer County Park (5). Display/hide their locations on the map
4,591 married couples with children.
1,426 single-parent households (419 men, 1,007 women).
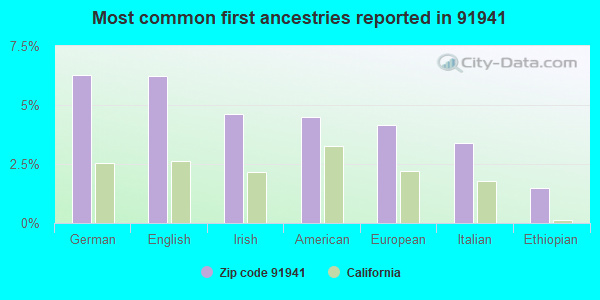
77.4% of residents of 91941 zip code speak English at home.
13.3% of residents speak Spanish at home (82% very well, 11% well, 7% not well, 1% not at all).
3.0% of residents speak other Indo-European language at home (79% very well, 13% well, 7% not well, 1% not at all).
3.8% of residents speak Asian or Pacific Island language at home (63% very well, 20% well, 15% not well, 2% not at all).
2.3% of residents speak other language at home (63% very well, 25% well, 12% not well).
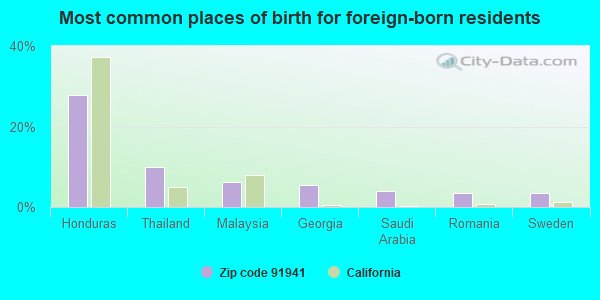
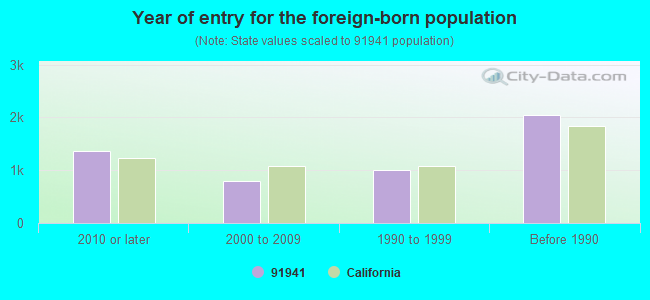
Foreign born population: 4,320 (13.0%) (74.6% of them are naturalized citizens)
Major facilities with environmental interests located in this zip code:
EASTRIDGE SUBDIVSION (LUCAS AND MERCIER INC.) (MURRAY HILL ROAD AND HIGH STREET in LA MESA, CA)
ENFORCEMENT/COMPLIANCE ACTIVITY (Integrated Compliance Information System) - ICIS-09-2005-0016, FORMAL ENFORCEMENT ACTION (Integrated Compliance Information System) - ICIS-09-2005-0016, FORMAL ENFORCEMENT ACTION National Pollutant Discharge Elimination System NON-MAJOR (Tracking pollutant discharge elimination systems) - permit
LA MESA MIDDLE SCHOOL (4200 PARKS AVE in LA MESA, CA)
(National Center for Education Statistics) - STATE ID-6038491 Large Quantity Generators, more that 1000 kg of hazardous waste/month (Resource Conservation and Recovery Act (tracking hazardous waste)) Organizations: LA MESA-SPRING VALLEY SCHOOL DISTRICT (CONTACT/OPERATOR)
, LA MESA-SPRING VALLEY (SCHOOL DISTRICT)
LA MESA DALE ELEMENTARY SCHOOL (4370 PARKS AVE in LA MESA, CA)
(National Center for Education Statistics) - STATE ID-6038475 Large Quantity Generators, more that 1000 kg of hazardous waste/month (Resource Conservation and Recovery Act (tracking hazardous waste)) Organizations: LA MESA-SPRING VALLEY SCHOOL DISTRICT (CONTACT/OPERATOR)
, LA MESA-SPRING VALLEY (SCHOOL DISTRICT)
EQUALITY PLATING CO (8172 CENTER ST in LA MESA, CA)
STATE MASTER (California - Hazardous Waste Tracking) - HAZARDOU WASTE PROGRAM CRITERIA AND HAZARDOUS AIR POLLUTANT INVENTORY (Inventory of air pollution sources) Large Quantity Generators, more that 1000 kg of hazardous waste/month (Resource Conservation and Recovery Act (tracking hazardous waste)) Business SIC and NAICS classification: ELECTROPLATING, PLATING, POLISHING, ANODIZING, AND COLORING
CHEVRON / UNIVERSITY AVE LA ME (8200 UNIVERSITY AVENUE in LA MESA, CA)
STATE MASTER (California - Hazardous Waste Tracking) - HAZARDOU WASTE PROGRAM CRITERIA AND HAZARDOUS AIR POLLUTANT INVENTORY (Inventory of air pollution sources) Small Quantity Generators, between 100 kg and 1000 kg of hazardous waste/month (Resource Conservation and Recovery Act (tracking hazardous waste)) - notification Small Quantity Generators, between 100 kg and 1000 kg of hazardous waste/month (Resource Conservation and Recovery Act (tracking hazardous waste)) - notification Business SIC classification: GASOLINE SERVICE STATIONS Organizations: CHEVRON PRODUCTS CO (CONTACT/OWNER)
, CHEVRON USA PRODUCTS CO (CONTACT/OWNER)
Alternative names: CHEVRON STATION 9 2235, CHEVRON STATION 92235
LA MESA PAINT & BODY SHOP (8170 PARKWAY DR in LA MESA, CA)
STATE MASTER (California - Hazardous Waste Tracking) - HAZARDOU WASTE PROGRAM CRITERIA AND HAZARDOUS AIR POLLUTANT INVENTORY (Inventory of air pollution sources) Small Quantity Generators, between 100 kg and 1000 kg of hazardous waste/month (Resource Conservation and Recovery Act (tracking hazardous waste)) - notification Business SIC classification: TOP, BODY, AND UPHOLSTERY REPAIR SHOPS AND PAINT SHOPS Business NAICS classification: AUTOMOTIVE BODY, PAINT, AND INTERIOR REPAIR AND MAINTENANCE. Organizations: DAVE J BERTHAIUME (CONTACT/OWNER)
KLEEN RITE (8755 LA MESA BLVD in LA MESA, CA)
STATE MASTER (California - Hazardous Waste Tracking) - HAZARDOU WASTE PROGRAM CRITERIA AND HAZARDOUS AIR POLLUTANT INVENTORY (Inventory of air pollution sources) Small Quantity Generators, between 100 kg and 1000 kg of hazardous waste/month (Resource Conservation and Recovery Act (tracking hazardous waste)) - notification Business SIC classification: DRYCLEANING PLANTS, EXCEPT RUG CLEANING Organizations: DON PAULEY (CONTACT/OWNER)
HERITAGE CLEANERS (9122 FLETCHER PKWY in LA MESA, CA)
STATE MASTER (California - Hazardous Waste Tracking) - HAZARDOU WASTE PROGRAM CRITERIA AND HAZARDOUS AIR POLLUTANT INVENTORY (Inventory of air pollution sources) Small Quantity Generators, between 100 kg and 1000 kg of hazardous waste/month (Resource Conservation and Recovery Act (tracking hazardous waste)) - notification Business SIC classification: DRYCLEANING PLANTS, EXCEPT RUG CLEANING Organizations: JAMES KANG (CONTACT/OWNER)
JACK ORR'S AUTO BODY INCORPORATED (7253 UNIVERSITY AVENUE in LA MESA, CA)
STATE MASTER (California - Hazardous Waste Tracking) - HAZARDOU WASTE PROGRAM CRITERIA AND HAZARDOUS AIR POLLUTANT INVENTORY (Inventory of air pollution sources) Small Quantity Generators, between 100 kg and 1000 kg of hazardous waste/month (Resource Conservation and Recovery Act (tracking hazardous waste)) - notification Business SIC classification: TOP, BODY, AND UPHOLSTERY REPAIR SHOPS AND PAINT SHOPS Business NAICS classification: AUTOMOTIVE BODY, PAINT, AND INTERIOR REPAIR AND MAINTENANCE.
CHEVRON STATION 9 0780 (5322 JACKSON DR in LA MESA, CA)
STATE MASTER (California - Hazardous Waste Tracking) - HAZARDOU WASTE PROGRAM CRITERIA AND HAZARDOUS AIR POLLUTANT INVENTORY (Inventory of air pollution sources) Small Quantity Generators, between 100 kg and 1000 kg of hazardous waste/month (Resource Conservation and Recovery Act (tracking hazardous waste)) - notification Business SIC classification: GASOLINE SERVICE STATIONS Organizations: CHEVRON USA PRODUCTS CO (CONTACT/OWNER)
Alternative names: CHEVRON 90780
LA MESA AUTO CARE (8692 LA MESA BLVD in LA MESA, CA)
STATE MASTER (California - Hazardous Waste Tracking) - HAZARDOU WASTE PROGRAM Small Quantity Generators, between 100 kg and 1000 kg of hazardous waste/month (Resource Conservation and Recovery Act (tracking hazardous waste)) - notification Organizations: RAEBURN BRUCE (CONTACT/OWNER)
EQUILON ENTERPRISES (5151 N 70TH SAP 121355 in LA MESA, CA) . Federal Facility
STATE MASTER (California - Hazardous Waste Tracking) - HAZARDOU WASTE PROGRAM CRITERIA AND HAZARDOUS AIR POLLUTANT INVENTORY (Inventory of air pollution sources) Small Quantity Generators, between 100 kg and 1000 kg of hazardous waste/month (Resource Conservation and Recovery Act (tracking hazardous waste)) - notification Business SIC classification: GASOLINE SERVICE STATIONS Alternative names: TEXACO SERVICE STATION
GROSSMONT UHSD WORK TRAINING CTR (230 JAMACHA RD in LA MESA, CA)
STATE MASTER (California - Hazardous Waste Tracking) - HAZARDOU WASTE PROGRAM Small Quantity Generators, between 100 kg and 1000 kg of hazardous waste/month (Resource Conservation and Recovery Act (tracking hazardous waste)) - notification Alternative names: GROSSMONT UNION H.S. DIST
Housing units lacking complete plumbing facilities: 0.3% Housing units lacking complete kitchen facilities: 0.4%
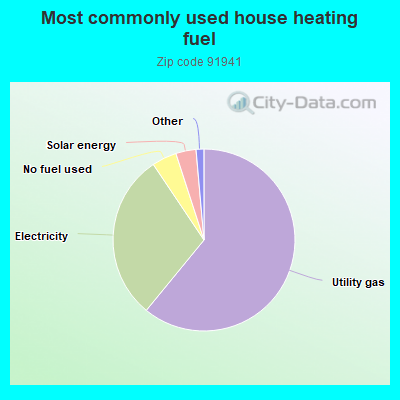
61.0%Utility gas
29.7%Electricity
4.4%No fuel used
3.6%Solar energy
0.9%Wood
0.5%Bottled, tank, or LP gas
Population in 1990: 42,536. Population change in the 1990s: +2,115 (+5.0%).
Place of birth for U.S.-born residents:
This state: 19,559
Northeast: 1,907
Midwest: 2,746
South: 2,179
West: 1,558
52% of the 91941 zip code residents lived in the same house 5 years ago. Out of people who lived in different houses, 72% lived in this county. Out of people who lived in different counties, 50% lived in California.
87% of the 91941 zip code residents lived in the same house 1 year ago. Out of people who lived in different houses, 77% moved from this county. Out of people who lived in different houses, 9% moved from different county within same state. Out of people who lived in different houses, 9% moved from different state. Out of people who lived in different houses, 1% moved from abroad.
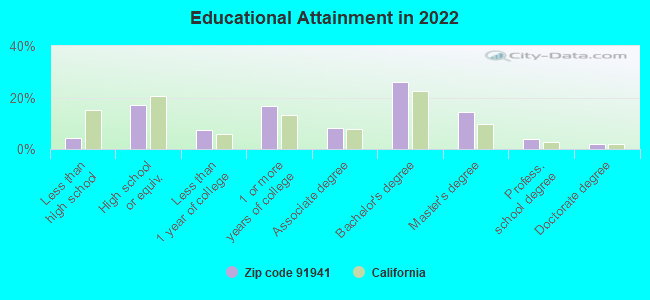
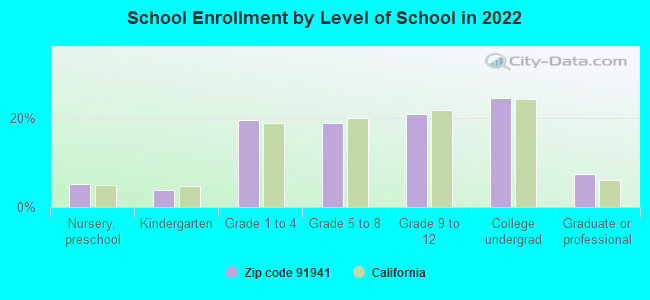
Private vs. public school enrollment:
Students in private schools in grades 1 to 8 (elementary and middle school): 221
Here:
7.7%
California:
10.5%
Students in private schools in grades 9 to 12 (high school): 164
Here:
10.5%
California:
8.5%
Students in private undergraduate colleges: 190
Here:
10.4%
California:
15.9%
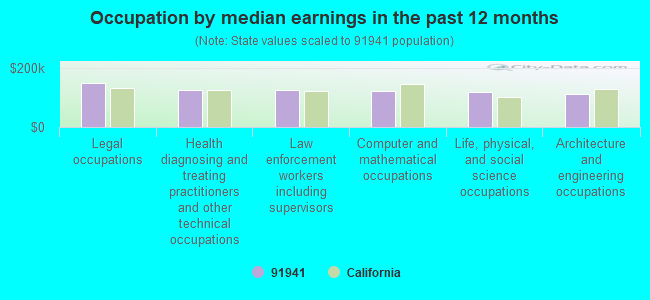
Occupation by median earnings in the past 12 months ($)
148,115Legal occupations
125,286Health diagnosing and treating practitioners and other technical occupations
124,895Law enforcement workers including supervisors
121,194Computer and mathematical occupations
116,841Life, physical, and social science occupations
111,811Architecture and engineering occupations
Companies with biggest federal contracts located in this zip code (LA MESA, CA):
JAYNES CORPORATION OF CALIFORN (8530 LA MESA BLVD , SUITE) : $13,377,142 in 23 contractsfrom 2002 to 2004
Contracts for Construction of Structures and Facilities -- Other Industrial Buildings by Navy Signed by year:2000: $0; 2001: $0; 2002: $11,446,210; 2003: $96,325; 2004: $1,834,607; 2005: $0; 2006: $0.
Biggest contracts:
$8,296,000 with Navy for Construction of Structures and Facilities -- Other Industrial Buildings. Signed on 2002-09-11. Completion date: 2004-03-20.
$2,918,264, same as above.Signed on 2002-01-31. Completion date: 2003-07-03.
$1,834,607, same as above.Signed on 2004-07-19. Completion date: 2005-07-18.
$207,667, same as above.Signed on 2002-08-07. Completion date: 2003-12-27.
KVAAS CONSTRUCTION CO , INC (8111 UNIVERSITY AVENUE) : $9,053,092 in 28 contractsfrom 1999 to 2005
Contracts for Construction of Structures and Facilities -- Other Industrial Buildings, Construction of Structures and Facilities -- Ship Construction and Repair Facilities by Navy Signed by year:2000: $378,331; 2001: $8,144,829; 2002: $0; 2003: $0; 2004: $0; 2005: $489,130; 2006: $0.
Biggest contracts:
$5,745,136 with Navy for Construction of Structures and Facilities -- Other Industrial Buildings. Signed on 2001-08-24. Completion date: 2003-06-30.
$2,342,017, same as above.Signed on 2001-12-27. Completion date: 2003-12-27.
$357,321, same as above.Signed on 2005-12-14. Completion date: 2006-01-31.
$150,000 with Navy for Construction of Structures and Facilities -- Ship Construction and Repair Facilities. Signed on 2000-03-01. Completion date: 2000-03-20.
HALL, LEE (4021 PAULA ST; small business) : $1,301,125 in 4 contractsfrom 2003 to 2005
$399,998 with Navy for Radiology Services. Signed on 2005-10-19. Completion date: 2005-09-30.
$399,998, same as above.Signed on 2004-10-14. Completion date: 2005-09-30.
$399,980, same as above.Signed on 2003-10-01. Completion date: 2004-09-30.
$101,149, same as above.Signed on 2003-06-20. Completion date: 2008-06-30.
STEPHEN J YENCHO (11214 AVENIDA THOMAS; small business) : $648,330 in 10 contractsfrom 2000 to 2005
Contracts for Other Medical Services, Radiology Services by Navy Signed by year:2000: $135,344; 2001: $78,266; 2002: $102,867; 2003: $117,659; 2004: $105,615; 2005: $108,579; 2006: $0.
Biggest contracts:
$108,579 with Navy for Other Medical Services. Signed on 2005-10-20. Completion date: 2005-09-30.
$105,615, same as above.Signed on 2004-10-21. Completion date: 2005-09-30.
$94,446 with Navy for Radiology Services. Signed on 2002-10-01. Completion date: 2003-09-30.
$76,095 with Navy for Other Medical Services. Signed on 2003-12-18. Completion date: 2004-09-30.
BETTY A BENGTSON (7755-45 SARANAC PLACE; small business) : $441,393 in 7 contractsfrom 1999 to 2003
Contracts for Radiology Services, Other Medical Services by Navy Signed by year:2000: $78,300; 2001: $87,526; 2002: $89,990; 2003: $111,035; 2004: $0; 2005: $0; 2006: $0.
Biggest contracts:
$89,990 with Navy for Radiology Services. Signed on 2002-10-01. Completion date: 2003-09-30.
$80,701, same as above.Signed on 2001-10-01. Completion date: 2001-09-30.
$78,300, same as above.Signed on 2000-10-01. Completion date: 2001-09-30.
$74,542, same as above.Signed on 1999-11-29. Completion date: 2000-10-31.
GILBERT MD, WALTER L (4133 S TROPICO DR; small business) : $416,476 in 3 contractsfrom 2004 to 2005
$189,716 with Navy for Other Medical Services. Signed on 2005-10-20. Completion date: 2005-09-30.
$182,408, same as above.Signed on 2004-10-14. Completion date: 2005-09-30.
$44,352, same as above.Signed on 2004-04-26. Completion date: 2009-06-30.
JESSE G WOOD (8080 LA MESA BOULVARD, SUI; small business) : $371,273 in 24 contractsfrom 2002 to 2006
Contracts for Architect - Engineer Services (including landscaping, interior layout, and designing), Invalid code: AT17 by Navy Signed by year:2000: $0; 2001: $0; 2002: $61,152; 2003: $74,947; 2004: $124,366; 2005: $25,650; 2006: $85,158.
Biggest contracts:
$66,502 with Navy for Architect - Engineer Services (including landscaping, interior layout, and designing). Signed on 2006-01-17. Completion date: 2006-09-30.
$59,810, same as above.Signed on 2004-08-23. Completion date: 2006-02-28.
$38,375, same as above.Signed on 2005-12-21. Completion date: 2006-08-01.
$36,663 with Navy for Architect - Engineer Services (including landscaping, interior layout, and designing). Taking place in AZ. Signed on 2003-06-26. Completion date: 2003-12-23.
SOONA B JAHINA, D D S , M SC (10862 CALLE VERDE STE C; small business) : $338,690 in 12 contractsfrom 2004 to 2005
Contracts for Dentistry Services, Other Medical Services, Cardio-Vascular Services by Navy Signed by year:2000: $0; 2001: $0; 2002: $0; 2003: $0; 2004: $271,445; 2005: $67,245; 2006: $0.
Biggest contracts:
$66,500 with Navy for Dentistry Services. Signed on 2004-07-26. Completion date: 2004-09-30.
$55,050 with Navy for Other Medical Services. Signed on 2004-11-29. Completion date: 2005-09-30.
$55,050 with Navy for Dentistry Services. Signed on 2005-02-01. Completion date: 2005-03-31.
$55,050 with Navy for Other Medical Services. Signed on 2004-12-13. Completion date: 2005-09-30.
HELIX ENVIRONMENTAL PLANNING I (8100 LA MESA BLVD STE 150; small business) : $217,499 in 12 contractsfrom 2004 to 2006
Contracts for Architect - Engineer Services (including landscaping, interior layout, and designing), Administrative and Service Buildings by Navy Signed by year:2000: $0; 2001: $0; 2002: $0; 2003: $0; 2004: $13,940; 2005: $165,121; 2006: $38,438.
Biggest contracts:
$60,346 with Navy for Architect - Engineer Services (including landscaping, interior layout, and designing). Taking place in AZ. Signed on 2005-09-26. Completion date: 2006-06-01.
$52,199 with Navy for Architect - Engineer Services (including landscaping, interior layout, and designing). Taking place in NV. Signed on 2005-03-15. Completion date: 2005-07-06.
$30,000 with Navy for Administrative and Service Buildings. Signed on 2005-04-07. Completion date: 2005-05-05.
$23,138 with Navy for Architect - Engineer Services (including landscaping, interior layout, and designing). Taking place in NV. Signed on 2006-01-26. Completion date: 2006-03-12.
ORBITRAN SYSTEMS INC (8501 TIA MARIA WAY; small business) : $118,978 in 3 contractsfrom 2003 to 2004
$69,124 with Navy for Miscellaneous Service and Trade Equipment. Signed on 2004-08-24. Completion date: 2004-10-18.
$39,810 with Navy for Building Components, Prefabricated. Signed on 2004-04-13. Completion date: 2004-04-27.
$10,044 with Navy for Blocks, Tackle, Rigging, and Slings. Signed on 2003-09-30. Completion date: 2003-11-06.
Top industries in this zip code by the number of employees in 2005:
2005 - 2018 National Fire Incident Reporting System (NFIRS) incidents
According to the data from the years 2005 - 2018 the average number of fires per year is 32. The highest number of reported fire incidents - 77 took place in 2007, and the least - 1 in 2010. The data has an increasing trend.
When looking into fire subcategories, the most incidents belonged to: Structure Fires (39.2%), and Outside Fires (30.2%).
Fire incident types reported to NFIRS in Zip Code 91941
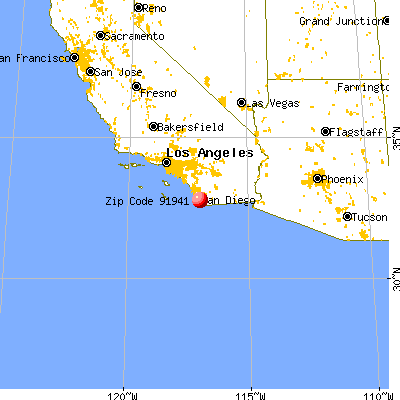


 Nearest zip codes: 91942, 91977, 91945, 92020, 91978, 92119.


 According to the data from the years 2005 - 2018 the average number of fires per year is 32. The highest number of reported fire incidents - 77 took place in 2007, and the least - 1 in 2010. The data has an increasing trend.
 When looking into fire subcategories, the most incidents belonged to: Structure Fires (39.2%), and Outside Fires (30.2%).