Estimated zip code population in 2022: 64,953 Zip code population in 2010: 58,368 Zip code population in 2000: 56,098
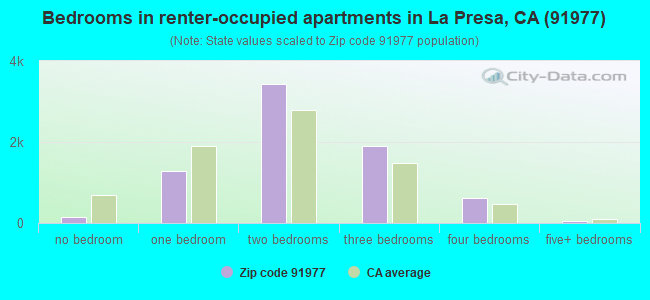
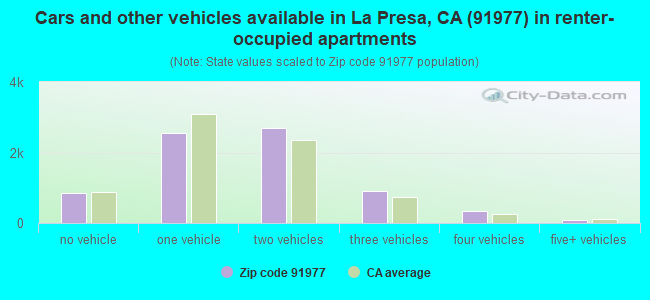
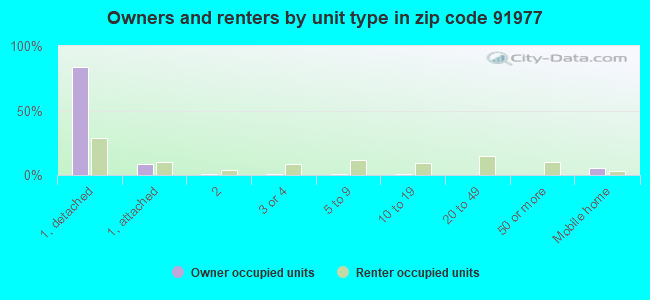
Houses and condos: 20,584 Renter-occupied apartments: 7,465
% of renters here:
37%
State:
44%
March 2022 cost of living index in zip code 91977: 121.4 (high, U.S. average is 100)
Land area: 9.7 sq. mi. Water area: 0.0 sq. mi.
Population density: 6,723 people per square mile
(high).
OSM Map
General Map
Google Map
MSN Map
OSM Map
General Map
Google Map
MSN Map
OSM Map
General Map
Google Map
MSN Map
OSM Map
General Map
Google Map
MSN Map
Please wait while loading the map...
Real estate property taxes paid for housing units in 2022:
This zip code:
0.7% ($4,197)
California:
0.7% ($4,831)
Median real estate property taxes paid for housing units with mortgages in 2022: $4,636 (0.7%) Median real estate property taxes paid for housing units with no mortgage in 2022: $2,889 (0.5%)
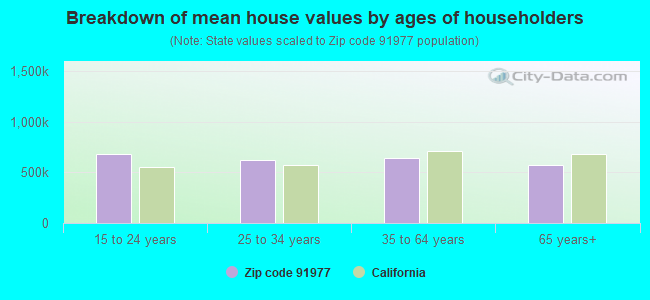
Estimated median house/condo value in 2022: $639,999
91977:
$639,999
California:
$715,900
According to our research of California and other state lists, there were 96 registered sex offenders living in 91977 zip code as of April 27, 2024. The ratio of all residents to sex offenders in zip code 91977 is 656 to 1. The ratio of registered sex offenders to all residents in this zip code is near the state average.
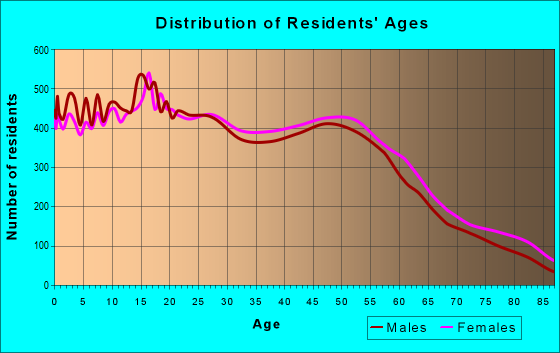
Median resident age:
This zip code:
35.6 years
California median age:
37.9 years
Average household size:
This zip code:
3.2 people
California:
2.8 people
Averages for the 2020 tax year for zip code 91977, filed in 2021:
Average Adjusted Gross Income (AGI) in 2020: $54,748 (Individual Income Tax Returns)
Here:
$54,748
State:
$95,910
Salary/wage: $49,582 (reported on 82.9% of returns)
Here:
$49,582
State:
$77,331
(% of AGI for various income ranges: 1159.5% for AGIs below $25k, 3761.2% for AGIs $25k-50k, 6921.8% for AGIs $50k-75k, 10200.7% for AGIs $75k-100k, 19028.2% for AGIs $100k-200k, 56350.0% for AGIs over 200k)
Taxable interest for individuals: $572 (reported on 28.4% of returns)
This zip code:
$572
California:
$2,294
(% of AGI for various income ranges: 8.0% for AGIs below $25k, 10.3% for AGIs $25k-50k, 23.1% for AGIs $50k-75k, 37.4% for AGIs $75k-100k, 63.2% for AGIs $100k-200k, 497.8% for AGIs over 200k)
Ordinary dividends: $3,188 (reported on 10.1% of returns)
Here:
$3,188
State:
$10,949
(% of AGI for various income ranges: 11.2% for AGIs below $25k, 13.6% for AGIs $25k-50k, 35.8% for AGIs $50k-75k, 88.0% for AGIs $75k-100k, 176.4% for AGIs $100k-200k, 910.6% for AGIs over 200k)
Net capital gain/loss in AGI: +$9,481 (reported on 10.1% of returns)
Here:
+$9,481
State:
+$49,306
(% of AGI for various income ranges: 1.6% for AGIs below $25k, 14.4% for AGIs $25k-50k, 31.2% for AGIs $50k-75k, 96.1% for AGIs $75k-100k, 395.5% for AGIs $100k-200k, 9421.7% for AGIs over 200k)
Profit/loss from business: +$7,636 (reported on 15.6% of returns)
Here:
+$7,636
State:
+$15,671
(% of AGI for various income ranges: 149.5% for AGIs below $25k, 105.7% for AGIs $25k-50k, 126.4% for AGIs $50k-75k, 199.3% for AGIs $75k-100k, 309.8% for AGIs $100k-200k, 2356.7% for AGIs over 200k)
Taxable individual retirement arrangement distribution: $16,256 (reported on 5.3% of returns)
91977:
$16,256
California:
$23,505
(% of AGI for various income ranges: 27.9% for AGIs below $25k, 46.5% for AGIs $25k-50k, 101.9% for AGIs $50k-75k, 229.3% for AGIs $75k-100k, 496.9% for AGIs $100k-200k, 1805.0% for AGIs over 200k)
Self-employed (Keogh) retirement plans: $18,033 (reported on 0.1% of returns)
91977:
$18,033
California:
$30,163
(% of AGI for various income ranges: 26.4% for AGIs $100k-200k)
Total itemized deductions: $29,002 (reported on 12.5% of returns)
Here:
$29,002
State:
$39,517
(% of AGI for various income ranges: 68.6% for AGIs below $25k, 157.4% for AGIs $25k-50k, 512.8% for AGIs $50k-75k, 1059.2% for AGIs $75k-100k, 2215.5% for AGIs $100k-200k, 6875.6% for AGIs over 200k)
Charity contributions: $5,546 (reported on 9.6% of returns)
Here:
$5,546
State:
$12,598
(% of AGI for various income ranges: 3.4% for AGIs below $25k, 15.3% for AGIs $25k-50k, 56.7% for AGIs $50k-75k, 137.7% for AGIs $75k-100k, 345.4% for AGIs $100k-200k, 1802.8% for AGIs over 200k)
Taxes paid: $7,988 (reported on 12.5% of returns)
91977:
$7,988
State:
$8,807
(% of AGI for various income ranges: 12.9% for AGIs below $25k, 37.5% for AGIs $25k-50k, 136.6% for AGIs $50k-75k, 313.0% for AGIs $75k-100k, 659.4% for AGIs $100k-200k, 1604.4% for AGIs over 200k)
Earned income credit: $2,163 (reported on 18.7% of returns)
Here:
$2,163
State:
$2,074
(% of AGI for various income ranges: 102.6% for AGIs below $25k, 75.9% for AGIs $25k-50k, 1.4% for AGIs $50k-75k)
Percentage of individuals using paid preparers for their 2020 taxes: 93.3%
Here:
93%
State:
92%
(% for various income ranges: 92.4% for AGIs below $25k, 93.6% for AGIs $25k-50k, 93.4% for AGIs $50k-75k, 94.0% for AGIs $75k-100k, 93.5% for AGIs $100k-200k, 96.6% for AGIs over 200k)
Averages for the 2012 tax year for zip code 91977, filed in 2013:
Average Adjusted Gross Income (AGI) in 2012: $44,791 (Individual Income Tax Returns)
Here:
$44,791
State:
$72,726
Salary/wage: $40,787 (reported on 84.6% of returns)
Here:
$40,787
State:
$59,079
(% of AGI for various income ranges: 74.9% for AGIs below $25k, 82.2% for AGIs $25k-50k, 79.2% for AGIs $50k-75k, 77.5% for AGIs $75k-100k, 76.8% for AGIs $100k-200k, 52.4% for AGIs over 200k)
Taxable interest for individuals: $624 (reported on 29.4% of returns)
This zip code:
$624
California:
$2,146
(% of AGI for various income ranges: 0.6% for AGIs below $25k, 0.3% for AGIs $25k-50k, 0.3% for AGIs $50k-75k, 0.3% for AGIs $75k-100k, 0.4% for AGIs $100k-200k, 0.8% for AGIs over 200k)
Ordinary dividends: $2,770 (reported on 10.4% of returns)
Here:
$2,770
State:
$9,308
(% of AGI for various income ranges: 0.6% for AGIs below $25k, 0.5% for AGIs $25k-50k, 0.6% for AGIs $50k-75k, 0.6% for AGIs $75k-100k, 0.7% for AGIs $100k-200k, 1.2% for AGIs over 200k)
Net capital gain/loss in AGI: +$3,208 (reported on 8.3% of returns)
Here:
+$3,208
State:
+$30,460
(% of AGI for various income ranges: 0.3% for AGIs $50k-75k, 0.3% for AGIs $75k-100k, 0.8% for AGIs $100k-200k, 5.7% for AGIs over 200k)
Profit/loss from business: +$9,825 (reported on 14.5% of returns)
Here:
+$9,825
State:
+$17,064
(% of AGI for various income ranges: 10.5% for AGIs below $25k, 3.2% for AGIs $25k-50k, 1.8% for AGIs $50k-75k, 1.1% for AGIs $75k-100k, 1.8% for AGIs $100k-200k, 4.5% for AGIs over 200k)
Taxable individual retirement arrangement distribution: $12,122 (reported on 6.4% of returns)
91977:
$12,122
California:
$19,557
(% of AGI for various income ranges: 1.4% for AGIs below $25k, 1.2% for AGIs $25k-50k, 1.7% for AGIs $50k-75k, 2.4% for AGIs $75k-100k, 1.8% for AGIs $100k-200k, 2.6% for AGIs over 200k)
Self-employment retirement plans: $11,140 (reported on 0.2% of returns)
91977:
$11,140
California:
$24,530
Total itemized deductions: $22,848 (28% of AGI, reported on 31.0% of returns)
Here:
$22,848
State:
$34,004
Here:
28.3% of AGI
State:
22.7% of AGI
(% of AGI for various income ranges: 8.7% for AGIs below $25k, 11.7% for AGIs $25k-50k, 16.3% for AGIs $50k-75k, 18.7% for AGIs $75k-100k, 19.7% for AGIs $100k-200k, 19.5% for AGIs over 200k)
Charity contributions: $2,931 (reported on 24.4% of returns)
Here:
$2,931
State:
$4,659
(% of AGI for various income ranges: 0.5% for AGIs below $25k, 1.0% for AGIs $25k-50k, 1.5% for AGIs $50k-75k, 1.9% for AGIs $75k-100k, 2.3% for AGIs $100k-200k, 2.4% for AGIs over 200k)
Taxes paid: $6,550 (reported on 30.9% of returns)
91977:
$6,550
State:
$14,448
(% of AGI for various income ranges: 1.5% for AGIs below $25k, 2.4% for AGIs $25k-50k, 4.1% for AGIs $50k-75k, 5.3% for AGIs $75k-100k, 6.7% for AGIs $100k-200k, 8.5% for AGIs over 200k)
Earned income credit: $2,396 (reported on 24.4% of returns)
Here:
$2,396
State:
$2,286
(% of AGI for various income ranges: 8.2% for AGIs below $25k, 1.5% for AGIs $25k-50k)
Percentage of individuals using paid preparers for their 2012 taxes: 60.5%
Here:
61%
State:
64%
(% for various income ranges: 57.3% for AGIs below $25k, 61.0% for AGIs $25k-50k, 62.4% for AGIs $50k-75k, 64.2% for AGIs $75k-100k, 66.7% for AGIs $100k-200k, 71.4% for AGIs over 200k)
Averages for the 2004 tax year for zip code 91977, filed in 2005:
Average Adjusted Gross Income (AGI) in 2004: $40,956 (Individual Income Tax Returns)
Here:
$40,956
State:
$58,600
Salary/wage: $37,355 (reported on 86.2% of returns)
Here:
$37,355
State:
$49,455
(% of AGI for various income ranges: 149.1% for AGIs below $10k, 79.4% for AGIs $10k-25k, 84.5% for AGIs $25k-50k, 83.1% for AGIs $50k-75k, 83.4% for AGIs $75k-100k, 60.7% for AGIs over 100k)
Taxable interest for individuals: $884 (reported on 40.3% of returns)
This zip code:
$884
California:
$2,365
(% of AGI for various income ranges: 3.6% for AGIs below $10k, 1.2% for AGIs $10k-25k, 0.7% for AGIs $25k-50k, 0.7% for AGIs $50k-75k, 0.6% for AGIs $75k-100k, 1.1% for AGIs over 100k)
Taxable dividends: $1,979 (reported on 14.3% of returns)
Here:
$1,979
State:
$4,746
(% of AGI for various income ranges: 2.9% for AGIs below $10k, 0.8% for AGIs $10k-25k, 0.5% for AGIs $25k-50k, 0.5% for AGIs $50k-75k, 0.5% for AGIs $75k-100k, 1.0% for AGIs over 100k)
Net capital gain/loss: +$7,683 (reported on 11.4% of returns)
Here:
+$7,683
State:
+$23,418
(% of AGI for various income ranges: -1.2% for AGIs below $10k, 0.2% for AGIs $10k-25k, 0.2% for AGIs $25k-50k, 0.4% for AGIs $50k-75k, 1.0% for AGIs $75k-100k, 7.9% for AGIs over 100k)
Profit/loss from business: +$9,666 (reported on 13.8% of returns)
Here:
+$9,666
State:
+$16,826
(% of AGI for various income ranges: 4.8% for AGIs below $10k, 6.1% for AGIs $10k-25k, 3.1% for AGIs $25k-50k, 2.5% for AGIs $50k-75k, 2.3% for AGIs $75k-100k, 3.4% for AGIs over 100k)
IRA payment deduction: $2,579 (reported on 2.1% of returns)
91977:
$2,579
California:
$3,192
(% of AGI for various income ranges: 0.2% for AGIs below $10k, 0.1% for AGIs $10k-25k, 0.2% for AGIs $25k-50k, 0.2% for AGIs $50k-75k, 0.1% for AGIs $75k-100k, 0.1% for AGIs over 100k)
Self-employed pension: $10,216 (reported on 0.4% of returns)
Here:
$10,216
California:
$17,688
(% of AGI for various income ranges: 0.1% for AGIs $25k-50k, 0.0% for AGIs $50k-75k, 0.1% for AGIs $75k-100k, 0.3% for AGIs over 100k)
Total itemized deductions: $21,857 (31% of AGI, reported on 36.8% of returns)
Here:
$21,857
State:
$28,113
Here:
31.2% of AGI
State:
25.3% of AGI
(% of AGI for various income ranges: 22.6% for AGIs below $10k, 11.9% for AGIs $10k-25k, 17.2% for AGIs $25k-50k, 23.4% for AGIs $50k-75k, 23.8% for AGIs $75k-100k, 19.4% for AGIs over 100k)
Charity contributions deductions: $2,730 (4% of AGI, reported on 31.7% of returns)
Here:
$2,730
State:
$3,923
Here:
3.7% of AGI
State:
3.3% of AGI
(% of AGI for various income ranges: 1.1% for AGIs below $10k, 1.0% for AGIs $10k-25k, 1.6% for AGIs $25k-50k, 2.3% for AGIs $50k-75k, 2.5% for AGIs $75k-100k, 2.9% for AGIs over 100k)
Total tax: $4,768 (reported on 72.7% of returns)
91977:
$4,768
State:
$10,761
(% of AGI for various income ranges: 4.4% for AGIs below $10k, 3.8% for AGIs $10k-25k, 5.7% for AGIs $25k-50k, 7.3% for AGIs $50k-75k, 8.8% for AGIs $75k-100k, 14.7% for AGIs over 100k)
Earned income credit: $1,820 (reported on 19.0% of returns)
Here:
$1,820
State:
$1,763
Percentage of individuals using paid preparers for their 2004 taxes: 66.1%
Here:
66%
State:
66%
(% for various income ranges: 57.1% for AGIs below $10k, 67.8% for AGIs $10k-25k, 66.7% for AGIs $25k-50k, 68.8% for AGIs $50k-75k, 67.9% for AGIs $75k-100k, 70.1% for AGIs over 100k)
Likely homosexual households (counted as self-reported same-sex unmarried-partner households)
Lesbian couples: 0.1% of all households
Gay men: 0.2% of all households
Household received Food Stamps/SNAP in the past 12 months: 3,676 Household did not receive Food Stamps/SNAP in the past 12 months: 16,556
Women who had a birth in the past 12 months: 1,024 (598 now married, 428 unmarried) Women who did not have a birth in the past 12 months: 15,384 (5,498 now married, 9,911 unmarried)
Housing units in zip code 91977 with a mortgage: 9,233 (840 second mortgage, 40 home equity loan, 521 both second mortgage and home equity loan) Houses without a mortgage: 37
Median monthly owner costs for units with a mortgage: $2,496 Median monthly owner costs for units without a mortgage: $616
Residents with income below the poverty level in 2022:
This zip code:
10.7%
Whole state:
12.2%
Residents with income below 50% of the poverty level in 2022:
This zip code:
6.0%
Whole state:
6.2%
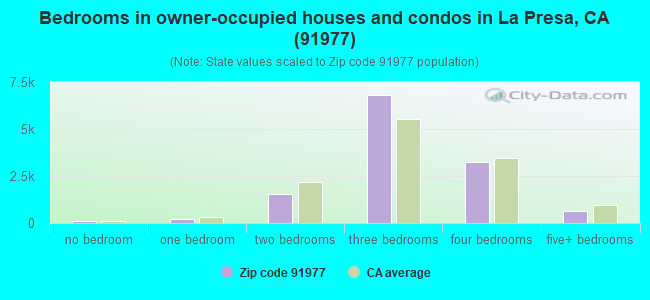
Median number of rooms in houses and condos:
Here:
5.9
State:
6.0
Median number of rooms in apartments:
Here:
4.2
State:
3.9
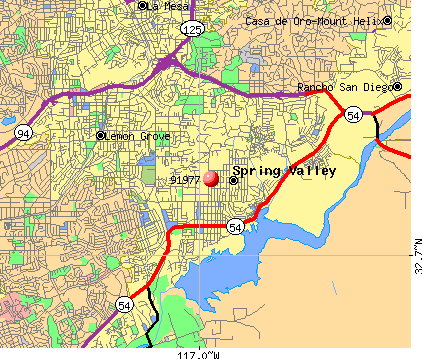
Notable locations in this zip code not listed on our city pages
Notable locations in zip code 91977: Casa de Oro Chamber of Commerce (A), Casa de Oro Branch San Diego County Library (B), Spring Valley Branch San Diego County Library (C), Medfleet Ambulance Service (D), San Miguel Consolidated Fire Protection District Station 14 (E), San Miguel Consolidated Fire Protection District Station 16 (F), Bancroft Ranch House (G). Display/hide their locations on the map
Shopping Centers: Sweetwater Village Shopping Center (1), Rancho San Diego Village Shopping Center (2), Casa de Oro Shopping Center (3), Spring Valley Shopping Center (4), El Kelton Shopping Center (5). Display/hide their locations on the map
Churches in zip code 91977 include: Bancroft Baptist Church (A), La Presa Community Church (B), Mount Miguel Covenant Church (C), Trinity Baptist Church of Spring Valley (D), Visions of God Christian Ministries (E), First Baptist Church of Spring Valley (F), Kingdom Hall of Jehovahs Witnesses (G), Spring Valley Church of the Nazarene (H), United Pentecostal Church (I). Display/hide their locations on the map
Parks in zip code 91977 include: Goodland Acres Park (1), Estrella County Park (2), Spring Valley County Park (3), Sweetwater Lane City Park (4), Bancroft City Park (5), Lamar County Park (6), Bancroft County Park (7). Display/hide their locations on the map
8,491 married couples with children.
4,209 single-parent households (1,064 men, 3,145 women).
59.3% of residents of 91977 zip code speak English at home.
31.5% of residents speak Spanish at home (71% very well, 17% well, 11% not well, 2% not at all).
1.1% of residents speak other Indo-European language at home (62% very well, 30% well, 8% not well).
5.4% of residents speak Asian or Pacific Island language at home (58% very well, 32% well, 9% not well, 1% not at all).
2.4% of residents speak other language at home (57% very well, 19% well, 23% not well, 1% not at all).
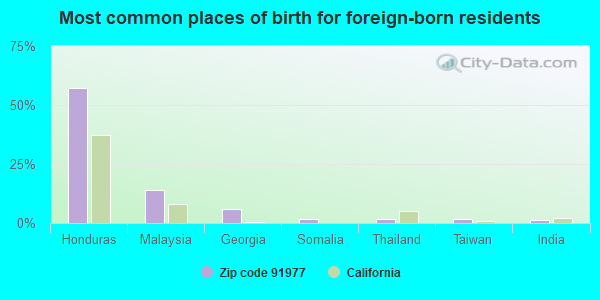
Foreign born population: 12,791 (19.7%) (64.2% of them are naturalized citizens)
This zip code:
19.7%
Whole state:
26.7%
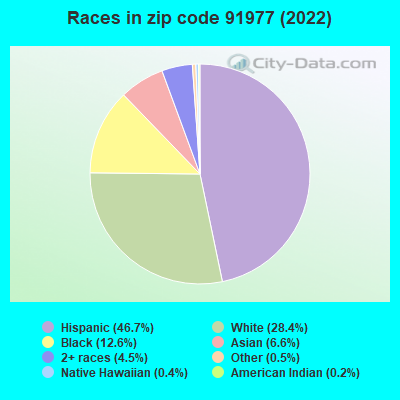
57%Honduras
14%Malaysia
6%Georgia
2%Somalia
2%Thailand
2%Taiwan
1%India
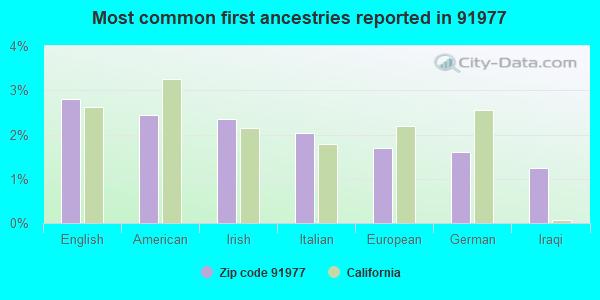
3%English
2%American
2%Irish
2%Italian
2%European
2%German
1%Iraqi
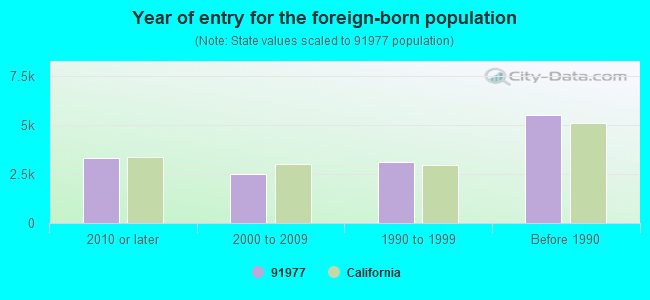
Year of entry for the foreign-born population
3,3192010 or later
2,5162000 to 2009
3,0991990 to 1999
5,509Before 1990
Major facilities with environmental interests located in this zip code:
EXXONMOBIL OIL CORPORATION (3520 SWEETWATER SPRINGS BOULEVARD in SPRING VALLEY, CA)
CRITERIA AND HAZARDOUS AIR POLLUTANT INVENTORY (Inventory of air pollution sources) Small Quantity Generators, between 100 kg and 1000 kg of hazardous waste/month (Resource Conservation and Recovery Act (tracking hazardous waste)) - notification HAZARDOUS WASTE BIENNIAL REPORTER (Resource Conservation and Recovery Act (tracking hazardous waste)) Large Quantity Generators, more that 1000 kg of hazardous waste/month (Resource Conservation and Recovery Act (tracking hazardous waste)) Business SIC classification: GASOLINE SERVICE STATIONS Organizations: BAKER AND BAKHSHI ENTERPRISES INC (CONTACT/OWNER)
Alternative names: RANCHO MOBIL INC
HIGHLANDS ELEMENTARY (3131 S. BARCELONA ST. in SPRING VALLEY, CA)
(National Center for Education Statistics) - STATE ID-6038459 Organizations: LA MESA-SPRING VALLEY (SCHOOL DISTRICT)
KEMPTON STREET ELEMENTARY (740 KEMPTON ST. in SPRING VALLEY, CA)
(National Center for Education Statistics) - STATE ID-6038467 Organizations: LA MESA-SPRING VALLEY (SCHOOL DISTRICT)
LA PRESA ELEMENTARY (519 LA PRESA ST. in SPRING VALLEY, CA)
(National Center for Education Statistics) - STATE ID-6038509 Organizations: LA MESA-SPRING VALLEY (SCHOOL DISTRICT)
LA PRESA MIDDLE (1001 LELAND ST. in SPRING VALLEY, CA)
(National Center for Education Statistics) - STATE ID-6067003 Organizations: LA MESA-SPRING VALLEY (SCHOOL DISTRICT)
BANCROFT ELEMENTARY (8805 TYLER ST. in SPRING VALLEY, CA)
(National Center for Education Statistics) - STATE ID-6038418 Organizations: LA MESA-SPRING VALLEY (SCHOOL DISTRICT)
MONTE VISTA HIGH (3230 SWEETWATER SPRINGS BLVD. in SPRING VALLEY, CA)
(National Center for Education Statistics) - STATE ID-3734548 Organizations: GROSSMONT UNION HIGH (SCHOOL DISTRICT)
MOUNT MIGUEL HIGH (1800 SWEETWATER ROAD in SPRING VALLEY, CA)
(National Center for Education Statistics) - STATE ID-3734761 Organizations: GROSSMONT UNION HIGH (SCHOOL DISTRICT)
CASA DE ORO ELEMENTARY (10227 RAMONA DR. in SPRING VALLEY, CA)
(National Center for Education Statistics) - STATE ID-6038434 Organizations: LA MESA-SPRING VALLEY (SCHOOL DISTRICT)
CHEVRON NO 98983 (9111 CAMPO RD in SPRING VALLEY, CA)
HAZARDOUS WASTE BIENNIAL REPORTER (Resource Conservation and Recovery Act (tracking hazardous waste)) Large Quantity Generators, more that 1000 kg of hazardous waste/month (Resource Conservation and Recovery Act (tracking hazardous waste)) Organizations: CHEVRON PRODUCTS CO (CONTACT/OWNER)
IRON CO (2500 SWEETWATER SPRINGS BLVD in SPRING VALLEY, CA)
Conditionally Exempt Small Quantity Generators, less than 100 kg/month of hazardous waste (Resource Conservation and Recovery Act (tracking hazardous waste)) - notification TRANSPORTER (Resource Conservation and Recovery Act (tracking hazardous waste)) - notification Organizations: CALIFORNIA CORP (CONTACT/OWNER)
ALL VALLEY AUTO BODY (8740 JAMACHA ROAD in SPRING VALLEY, CA)
Small Quantity Generators, between 100 kg and 1000 kg of hazardous waste/month (Resource Conservation and Recovery Act (tracking hazardous waste)) - notification Organizations: SIGALOV LENNY (CONTACT/OWNER)
B&L FENCE STORE THE (9015 OLIVE ST in SPRING VALLEY, CA)
Small Quantity Generators, between 100 kg and 1000 kg of hazardous waste/month (Resource Conservation and Recovery Act (tracking hazardous waste)) - notification Organizations: STELLA V BUCHAN (CONTACT/OWNER)
Housing units lacking complete plumbing facilities: 0.4% Housing units lacking complete kitchen facilities: 0.6%
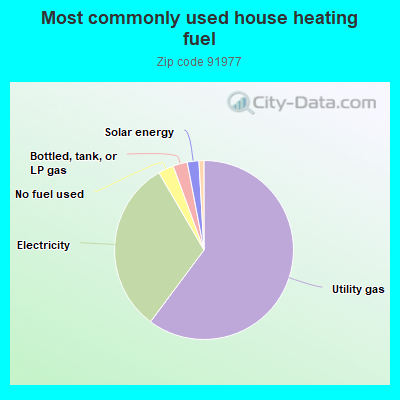
60.2%Utility gas
31.4%Electricity
2.8%No fuel used
2.6%Bottled, tank, or LP gas
2.1%Solar energy
0.9%Wood
Population in 1990: 52,403. Population change in the 1990s: +3,695 (+7.1%).
Place of birth for U.S.-born residents:
This state: 37,947
Northeast: 2,380
Midwest: 2,946
South: 4,786
West: 2,297
51% of the 91977 zip code residents lived in the same house 5 years ago. Out of people who lived in different houses, 79% lived in this county. Out of people who lived in different counties, 50% lived in California.
91% of the 91977 zip code residents lived in the same house 1 year ago. Out of people who lived in different houses, 60% moved from this county. Out of people who lived in different houses, 16% moved from different county within same state. Out of people who lived in different houses, 15% moved from different state. Out of people who lived in different houses, 9% moved from abroad.
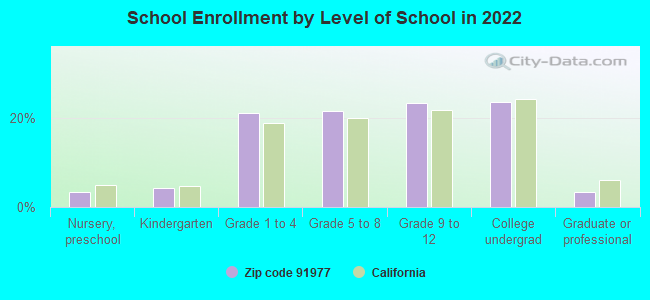
Private vs. public school enrollment:
Students in private schools in grades 1 to 8 (elementary and middle school): 855
Here:
11.5%
California:
10.5%
Students in private schools in grades 9 to 12 (high school): 158
Here:
3.9%
California:
8.5%
Students in private undergraduate colleges: 675
Here:
16.5%
California:
15.9%
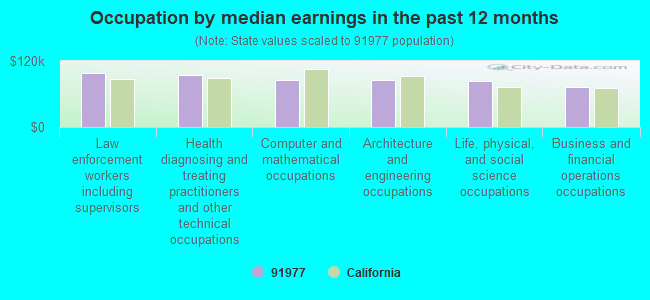
Occupation by median earnings in the past 12 months ($)
98,029Law enforcement workers including supervisors
94,300Health diagnosing and treating practitioners and other technical occupations
86,305Computer and mathematical occupations
85,134Architecture and engineering occupations
82,889Life, physical, and social science occupations
72,009Business and financial operations occupations
Companies with biggest federal contracts located in this zip code (SPRING VALLEY, CA):
ELKEN CONTRACTING INC (3763 BANCROFT DR; small business) : $16,317,845 in 109 contractsfrom 2000 to 2006
Contracts for Construction of Structures and Facilities -- Other Non-Building Facilities, Maintenance, Repair or Alteration of Real Property -- Recreational Buildings, Maintenance, Repair or Alteration of Real Property -- Other Utilities, Maintenance, Repair or Alteration of Real Property -- Sewage and Waste Facilities, and moreby Navy, Forest Service, Forest Service (disused code: now 12C2), Bureau of Prisoners/Federal Prison System, and others Signed by year:2000: $376,429; 2001: $2,326,120; 2002: $2,380,572; 2003: $7,308,050; 2004: $2,257,032; 2005: $1,488,427; 2006: $181,215.
Biggest contracts:
$2,904,780 with Navy for Construction of Structures and Facilities -- Other Non-Building Facilities. Signed on 2003-09-29. Completion date: 2004-04-13.
$1,174,692 with Navy for Maintenance, Repair or Alteration of Real Property -- Recreational Buildings. Signed on 2004-12-03. Completion date: 2005-06-16.
$1,160,274 with Navy for Maintenance, Repair or Alteration of Real Property -- Other Utilities. Signed on 2003-08-08. Completion date: 2004-05-14.
$839,573 with Navy for Maintenance, Repair or Alteration of Real Property -- Sewage and Waste Facilities. Signed on 2003-09-30. Completion date: 2004-05-12.
PREMIER ROOFING INC (9054 OLIVE DR; small business) : $12,603,134 in 165 contractsfrom 2000 to 2005
Contracts for Maintenance, Repair or Alteration of Real Property -- Miscellaneous Buildings, Construction of Structures and Facilities -- Maintenance Buildings, Maintenance, Repair or Alteration of Real Property -- Other Non-Building Facilities, Maintenance, Repair or Alteration of Real Property -- Other Administrative Facilities and Service Buildings, and moreby Navy Signed by year:2000: $484,476; 2001: $3,088,409; 2002: $2,534,043; 2003: $1,304,551; 2004: $4,266,963; 2005: $924,692; 2006: $0.
Biggest contracts:
$900,000 with Navy for Maintenance, Repair or Alteration of Real Property -- Miscellaneous Buildings. Signed on 2005-01-26. Completion date: 2005-08-09.
$663,355, same as above.Signed on 2004-06-17. Completion date: 2004-09-30.
$432,692, same as above.Signed on 2002-04-12. Completion date: 2002-07-11.
$373,413, same as above.Signed on 2002-03-22. Completion date: 2002-09-04.
DATA DISPOSAL INC (3704 S GRANADA AVE STE C; small business) : $902,049 in 18 contractsfrom 1999 to 2006
Contracts for ADP Backup and Security Services, Paper Shredding Services, Facilities Operations Support Services, Trash/Garbage Collection Services - Including Portable Sanitation Services, and moreby Navy Signed by year:2000: $112,235; 2001: $116,724; 2002: $121,393; 2003: $137,054; 2004: $141,882; 2005: $30,200; 2006: $134,854.
Biggest contracts:
$134,854 with Navy for ADP Backup and Security Services. Signed on 2006-05-16. Completion date: 2007-05-16.
$131,298 with Navy for Paper Shredding Services. Signed on 2004-12-07. Completion date: 2005-12-06.
$126,248, same as above.Signed on 2003-12-03. Completion date: 2004-12-06.
$121,393, same as above.Signed on 2002-11-26. Completion date: 2003-12-06.
OSWALD CELISE (9511 SUMMERFIELD STREET; small business) : $581,744 in 9 contractsfrom 2000 to 2005
Contracts for Other Medical Services, Neurology Services by Navy Signed by year:2000: $99,840; 2001: $0; 2002: $136,376; 2003: $110,520; 2004: $115,056; 2005: $119,952; 2006: $0.
Biggest contracts:
$115,056 with Navy for Other Medical Services. Signed on 2004-10-14. Completion date: 2005-09-30.
$110,520, same as above.Signed on 2003-10-01. Completion date: 2004-09-30.
$107,712, same as above.Signed on 2002-10-01. Completion date: 2003-09-30.
$102,312, same as above.Signed on 2005-10-19. Completion date: 2005-09-30.
ATLAS ENVIRONMENTAL SERVICES, (9032 OLIVE DR; small business) : $285,551 in 17 contractsfrom 2001 to 2004
Contracts for Maintenance, Repair or Alteration of Real Property -- Miscellaneous Buildings, Landscaping/Groundskeeping Services, Seedling Production/Transplanting Services, Maintenance, Repair or Alteration of Real Property -- Other Administrative Facilities and Service Buildings by Navy Signed by year:2000: $0; 2001: $109,439; 2002: $80,495; 2003: $85,632; 2004: $9,985; 2005: $0; 2006: $0.
Biggest contracts:
$77,538 with Navy for Maintenance, Repair or Alteration of Real Property -- Miscellaneous Buildings. Signed on 2003-07-31. Completion date: 2003-10-03.
$60,130, same as above.Signed on 2001-10-01. Completion date: 2001-08-15.
$41,085 with Navy for Landscaping/Groundskeeping Services. Signed on 2002-01-15. Completion date: 2003-01-15.
$35,000 with Navy for Maintenance, Repair or Alteration of Real Property -- Miscellaneous Buildings. Signed on 2002-09-20. Completion date: 2002-12-14.
AMERICAN SERVICE & REPAIR, INC (3270 BANCROFT DRIVE; small business) : $97,621 in 19 contractsfrom 2000 to 2006
Contracts for Maintenance, Repair or Alteration of Real Property -- Miscellaneous Buildings, Maintenance, Repair or Alteration of Real Property -- Other Administrative Facilities and Service Buildings by Navy Signed by year:2000: $7,962; 2001: $12,217; 2002: $10,534; 2003: $20,366; 2004: $23,578; 2005: $16,017; 2006: $6,947.
Biggest contracts:
$13,895 with Navy for Maintenance, Repair or Alteration of Real Property -- Miscellaneous Buildings. Signed on 2005-06-29. Completion date: 2005-06-30.
$13,837, same as above.Signed on 2003-07-02. Completion date: 2003-06-30.
$12,430, same as above.Signed on 2004-06-30. Completion date: 2005-06-30.
$10,404, same as above.Signed on 2002-06-26. Completion date: 2003-06-30.
TODD CHRISTOPHER DEAN (2612 CLIFFTOP LANE; small business) : $75,348 in 3 contractsin 2000
$38,373 with Navy for Other Medical Services. Signed on 2000-10-01. Completion date: 2001-09-30.
$36,975, same as above.Signed on 2000-10-01. Completion date: 2000-09-30.
$0, same as above.Signed on 2000-10-01. Completion date: 2000-09-30.
BURNS & SONS TRUCKING INC (9157 OLIVE DR; small business) : $67,640 in 4 contractsfrom 2003 to 2006
$24,360 with Navy for Preparation and Disposal of Excess and Surplus Property. Signed on 2003-08-01. Completion date: 2003-08-04.
$17,800 with Navy for Lease or Rental of Equipment -- Materials Handling Equipment. Signed on 2004-10-05. Completion date: 2004-05-30.
$17,800, same as above.Signed on 2004-05-03. Completion date: 2004-05-30.
$7,680 with Army for Trash/Garbage Collection Services - Including Portable Sanitation Services. Signed on 2006-05-23. Completion date: 2006-05-25.
KATHLEEN J BURNS (8956 HARNESS ST #G2; small business) : $64,892 in 4 contractsfrom 2003 to 2006
$24,960 with Navy for Other Professional Services. Signed on 2005-09-28. Completion date: 2006-09-30.
$22,924, same as above.Signed on 2004-09-29. Completion date: 2005-08-31.
$13,008, same as above.Signed on 2003-09-27. Completion date: 2004-10-01.
$4,000, same as above.Signed on 2006-05-31. Completion date: 2006-09-30.
COMFORT ZONE AIR COND & HTG S (9952 DOLORES STREET; small business) : $59,527 in 7 contractsfrom 2000 to 2001
Contracts for Construction of Structures and Facilities -- Other Residential Buildings, Maintenance, Repair or Alteration of Real Property -- Other Administrative Facilities and Service Buildings by Navy Signed by year:2000: $56,527; 2001: $3,000; 2002: $0; 2003: $0; 2004: $0; 2005: $0; 2006: $0.
Biggest contracts:
$22,788 with Navy for Construction of Structures and Facilities -- Other Residential Buildings. Signed on 2000-05-22. Completion date: 2000-06-12.
$14,363, same as above.Signed on 2000-07-24. Completion date: 2000-06-12.
$6,044 with Navy for Maintenance, Repair or Alteration of Real Property -- Other Administrative Facilities and Service Buildings. Signed on 2000-08-09. Completion date: 1999-08-29.
$5,935, same as above.Signed on 2000-02-02. Completion date: 1999-08-29.
Top industries in this zip code by the number of employees in 2005:
2005 - 2018 National Fire Incident Reporting System (NFIRS) incidents
According to the data from the years 2005 - 2018 the average number of fires per year is 65. The highest number of reported fire incidents - 107 took place in 2006, and the least - 1 in 2009. The data has a decreasing trend.
When looking into fire subcategories, the most incidents belonged to: Outside Fires (38.3%), and Structure Fires (33.7%).
Fire incident types reported to NFIRS in Zip Code 91977


 Nearest zip codes: 91941, 91945, 91978, 91942, 92114, 91902.
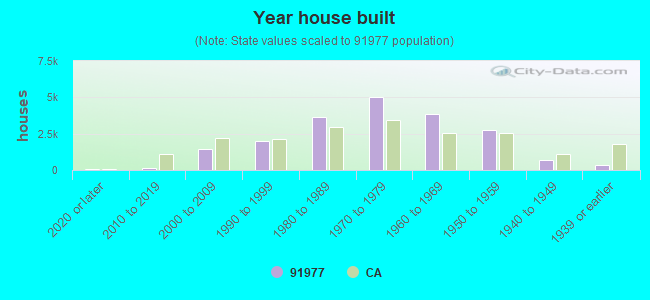


 According to the data from the years 2005 - 2018 the average number of fires per year is 65. The highest number of reported fire incidents - 107 took place in 2006, and the least - 1 in 2009. The data has a decreasing trend.
 When looking into fire subcategories, the most incidents belonged to: Outside Fires (38.3%), and Structure Fires (33.7%).