Estimated zip code population in 2022: 16,978 Zip code population in 2010: 17,653 Zip code population in 2000: 17,379
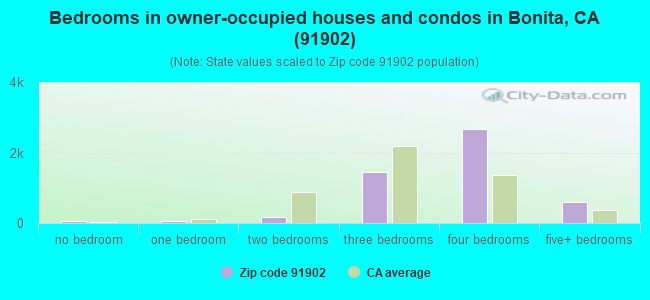
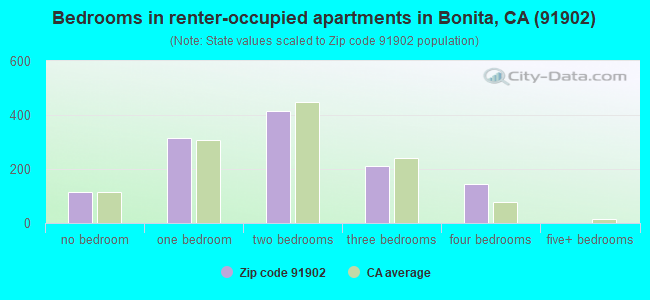
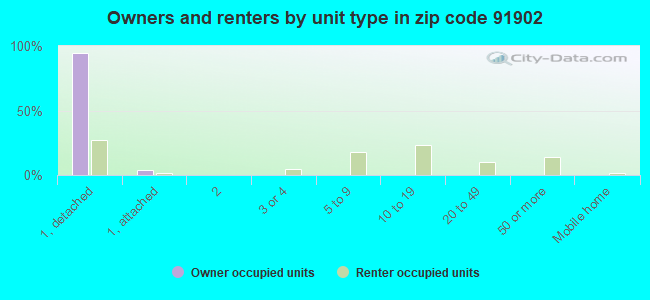
Houses and condos: 6,383 Renter-occupied apartments: 1,199
% of renters here:
19%
State:
44%
March 2022 cost of living index in zip code 91902: 121.9 (high, U.S. average is 100)
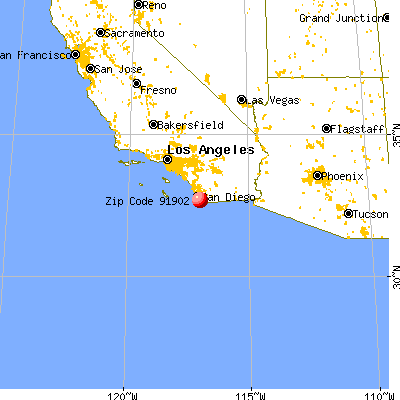
Land area: 8.7 sq. mi. Water area: 0.3 sq. mi.
Population density: 1,948 people per square mile
(low).
OSM Map
General Map
Google Map
MSN Map
OSM Map
General Map
Google Map
MSN Map
OSM Map
General Map
Google Map
MSN Map
OSM Map
General Map
Google Map
MSN Map
Please wait while loading the map...
Real estate property taxes paid for housing units in 2022:
This zip code:
0.6% ($5,901)
California:
0.7% ($4,831)
Median real estate property taxes paid for housing units with mortgages in 2022: $6,724 (0.7%) Median real estate property taxes paid for housing units with no mortgage in 2022: $4,145 (0.5%)
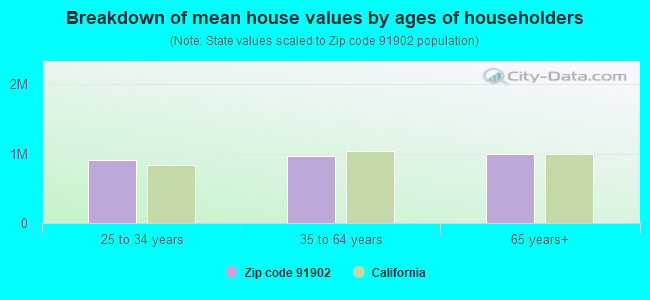
Estimated median house/condo value in 2022: $915,805
91902:
$915,805
California:
$715,900
According to our research of California and other state lists, there were 8 registered sex offenders living in 91902 zip code as of April 27, 2024. The ratio of all residents to sex offenders in zip code 91902 is 2,463 to 1. The ratio of registered sex offenders to all residents in this zip code is much lower than the state average.
Median resident age:
This zip code:
47.2 years
California median age:
37.9 years
Average household size:
This zip code:
2.8 people
California:
2.8 people
Averages for the 2020 tax year for zip code 91902, filed in 2021:
Average Adjusted Gross Income (AGI) in 2020: $91,247 (Individual Income Tax Returns)
Here:
$91,247
State:
$95,910
Salary/wage: $71,772 (reported on 73.1% of returns)
Here:
$71,772
State:
$77,331
(% of AGI for various income ranges: 1204.0% for AGIs below $25k, 3625.6% for AGIs $25k-50k, 6806.1% for AGIs $50k-75k, 8649.5% for AGIs $75k-100k, 18154.6% for AGIs $100k-200k, 67177.0% for AGIs over 200k)
Taxable interest for individuals: $1,843 (reported on 43.6% of returns)
This zip code:
$1,843
California:
$2,294
(% of AGI for various income ranges: 19.1% for AGIs below $25k, 27.4% for AGIs $25k-50k, 57.5% for AGIs $50k-75k, 108.5% for AGIs $75k-100k, 217.6% for AGIs $100k-200k, 1614.8% for AGIs over 200k)
Ordinary dividends: $6,406 (reported on 21.9% of returns)
Here:
$6,406
State:
$10,949
(% of AGI for various income ranges: 21.1% for AGIs below $25k, 43.5% for AGIs $25k-50k, 147.9% for AGIs $50k-75k, 239.1% for AGIs $75k-100k, 501.9% for AGIs $100k-200k, 2194.3% for AGIs over 200k)
Net capital gain/loss in AGI: +$17,286 (reported on 21.3% of returns)
Here:
+$17,286
State:
+$49,306
(% of AGI for various income ranges: 8.1% for AGIs below $25k, 26.8% for AGIs $25k-50k, 125.1% for AGIs $50k-75k, 207.3% for AGIs $75k-100k, 684.0% for AGIs $100k-200k, 10860.0% for AGIs over 200k)
Profit/loss from business: +$15,676 (reported on 18.6% of returns)
Here:
+$15,676
State:
+$15,671
(% of AGI for various income ranges: 176.7% for AGIs below $25k, 176.4% for AGIs $25k-50k, 381.7% for AGIs $50k-75k, 459.6% for AGIs $75k-100k, 792.1% for AGIs $100k-200k, 3970.9% for AGIs over 200k)
Taxable individual retirement arrangement distribution: $22,363 (reported on 10.8% of returns)
91902:
$22,363
California:
$23,505
(% of AGI for various income ranges: 37.9% for AGIs below $25k, 86.2% for AGIs $25k-50k, 282.1% for AGIs $50k-75k, 505.6% for AGIs $75k-100k, 1042.9% for AGIs $100k-200k, 2675.2% for AGIs over 200k)
Self-employed (Keogh) retirement plans: $33,720 (reported on 0.5% of returns)
91902:
$33,720
California:
$30,163
(% of AGI for various income ranges: 733.0% for AGIs over 200k)
Total itemized deductions: $35,452 (reported on 22.7% of returns)
Here:
$35,452
State:
$39,517
(% of AGI for various income ranges: 123.6% for AGIs below $25k, 289.4% for AGIs $25k-50k, 720.4% for AGIs $50k-75k, 1306.4% for AGIs $75k-100k, 3329.5% for AGIs $100k-200k, 11076.1% for AGIs over 200k)
Charity contributions: $6,896 (reported on 18.8% of returns)
Here:
$6,896
State:
$12,598
(% of AGI for various income ranges: 7.2% for AGIs below $25k, 25.1% for AGIs $25k-50k, 68.9% for AGIs $50k-75k, 137.6% for AGIs $75k-100k, 482.1% for AGIs $100k-200k, 2517.8% for AGIs over 200k)
Taxes paid: $8,966 (reported on 22.6% of returns)
91902:
$8,966
State:
$8,807
(% of AGI for various income ranges: 27.6% for AGIs below $25k, 68.4% for AGIs $25k-50k, 179.4% for AGIs $50k-75k, 372.7% for AGIs $75k-100k, 928.8% for AGIs $100k-200k, 2378.3% for AGIs over 200k)
Earned income credit: $1,805 (reported on 10.4% of returns)
Here:
$1,805
State:
$2,074
(% of AGI for various income ranges: 65.8% for AGIs below $25k, 53.0% for AGIs $25k-50k)
Percentage of individuals using paid preparers for their 2020 taxes: 93.4%
Here:
93%
State:
92%
(% for various income ranges: 91.3% for AGIs below $25k, 94.3% for AGIs $25k-50k, 93.2% for AGIs $50k-75k, 94.7% for AGIs $75k-100k, 94.4% for AGIs $100k-200k, 94.3% for AGIs over 200k)
Averages for the 2012 tax year for zip code 91902, filed in 2013:
Average Adjusted Gross Income (AGI) in 2012: $77,026 (Individual Income Tax Returns)
Here:
$77,026
State:
$72,726
Salary/wage: $60,528 (reported on 75.6% of returns)
Here:
$60,528
State:
$59,079
(% of AGI for various income ranges: 69.4% for AGIs below $25k, 71.1% for AGIs $25k-50k, 64.3% for AGIs $50k-75k, 59.4% for AGIs $75k-100k, 63.3% for AGIs $100k-200k, 47.1% for AGIs over 200k)
Taxable interest for individuals: $1,818 (reported on 45.0% of returns)
This zip code:
$1,818
California:
$2,146
(% of AGI for various income ranges: 2.0% for AGIs below $25k, 1.5% for AGIs $25k-50k, 0.9% for AGIs $50k-75k, 1.0% for AGIs $75k-100k, 0.8% for AGIs $100k-200k, 1.2% for AGIs over 200k)
Ordinary dividends: $4,503 (reported on 22.7% of returns)
Here:
$4,503
State:
$9,308
(% of AGI for various income ranges: 1.6% for AGIs below $25k, 1.5% for AGIs $25k-50k, 1.3% for AGIs $50k-75k, 1.3% for AGIs $75k-100k, 1.3% for AGIs $100k-200k, 1.3% for AGIs over 200k)
Net capital gain/loss in AGI: +$7,276 (reported on 20.8% of returns)
Here:
+$7,276
State:
+$30,460
(% of AGI for various income ranges: 0.2% for AGIs below $25k, 0.7% for AGIs $50k-75k, 1.0% for AGIs $75k-100k, 1.3% for AGIs $100k-200k, 4.6% for AGIs over 200k)
Profit/loss from business: +$20,458 (reported on 19.7% of returns)
Here:
+$20,458
State:
+$17,064
(% of AGI for various income ranges: 13.4% for AGIs below $25k, 4.9% for AGIs $25k-50k, 4.6% for AGIs $50k-75k, 4.2% for AGIs $75k-100k, 3.8% for AGIs $100k-200k, 6.4% for AGIs over 200k)
Taxable individual retirement arrangement distribution: $21,645 (reported on 12.1% of returns)
91902:
$21,645
California:
$19,557
(% of AGI for various income ranges: 2.2% for AGIs below $25k, 2.7% for AGIs $25k-50k, 2.7% for AGIs $50k-75k, 3.9% for AGIs $75k-100k, 3.5% for AGIs $100k-200k, 3.8% for AGIs over 200k)
Self-employment retirement plans: $21,000 (reported on 1.1% of returns)
91902:
$21,000
California:
$24,530
(% of AGI for various income ranges: 0.3% for AGIs $25k-50k, 0.2% for AGIs $100k-200k, 0.7% for AGIs over 200k)
Total itemized deductions: $33,201 (26% of AGI, reported on 45.5% of returns)
Here:
$33,201
State:
$34,004
Here:
25.7% of AGI
State:
22.7% of AGI
(% of AGI for various income ranges: 18.4% for AGIs below $25k, 15.5% for AGIs $25k-50k, 18.8% for AGIs $50k-75k, 20.2% for AGIs $75k-100k, 20.8% for AGIs $100k-200k, 19.7% for AGIs over 200k)
Charity contributions: $3,826 (reported on 38.4% of returns)
Here:
$3,826
State:
$4,659
(% of AGI for various income ranges: 0.9% for AGIs below $25k, 1.1% for AGIs $25k-50k, 1.5% for AGIs $50k-75k, 2.1% for AGIs $75k-100k, 2.2% for AGIs $100k-200k, 2.1% for AGIs over 200k)
Taxes paid: $11,921 (reported on 45.3% of returns)
91902:
$11,921
State:
$14,448
(% of AGI for various income ranges: 4.0% for AGIs below $25k, 3.3% for AGIs $25k-50k, 5.1% for AGIs $50k-75k, 6.0% for AGIs $75k-100k, 7.6% for AGIs $100k-200k, 9.2% for AGIs over 200k)
Earned income credit: $1,901 (reported on 12.3% of returns)
Here:
$1,901
State:
$2,286
(% of AGI for various income ranges: 4.6% for AGIs below $25k, 0.8% for AGIs $25k-50k)
Percentage of individuals using paid preparers for their 2012 taxes: 66.8%
Here:
67%
State:
64%
(% for various income ranges: 59.6% for AGIs below $25k, 64.0% for AGIs $25k-50k, 66.4% for AGIs $50k-75k, 73.3% for AGIs $75k-100k, 74.7% for AGIs $100k-200k, 77.6% for AGIs over 200k)
Averages for the 2004 tax year for zip code 91902, filed in 2005:
Average Adjusted Gross Income (AGI) in 2004: $74,965 (Individual Income Tax Returns)
Here:
$74,965
State:
$58,600
Salary/wage: $54,811 (reported on 77.4% of returns)
Here:
$54,811
State:
$49,455
(% of AGI for various income ranges: 73.9% for AGIs $10k-25k, 70.3% for AGIs $25k-50k, 66.2% for AGIs $50k-75k, 63.6% for AGIs $75k-100k, 48.4% for AGIs over 100k)
Taxable interest for individuals: $2,397 (reported on 57.6% of returns)
This zip code:
$2,397
California:
$2,365
(% of AGI for various income ranges: 2.0% for AGIs $10k-25k, 2.3% for AGIs $25k-50k, 1.8% for AGIs $50k-75k, 1.6% for AGIs $75k-100k, 1.7% for AGIs over 100k)
Taxable dividends: $2,978 (reported on 30.3% of returns)
Here:
$2,978
State:
$4,746
(% of AGI for various income ranges: 1.7% for AGIs $10k-25k, 1.4% for AGIs $25k-50k, 1.3% for AGIs $50k-75k, 1.5% for AGIs $75k-100k, 1.0% for AGIs over 100k)
Net capital gain/loss: +$14,795 (reported on 26.3% of returns)
Here:
+$14,795
State:
+$23,418
(% of AGI for various income ranges: 0.1% for AGIs $10k-25k, 0.5% for AGIs $25k-50k, 1.1% for AGIs $50k-75k, 1.6% for AGIs $75k-100k, 7.8% for AGIs over 100k)
Profit/loss from business: +$25,646 (reported on 19.7% of returns)
Here:
+$25,646
State:
+$16,826
(% of AGI for various income ranges: 8.0% for AGIs $10k-25k, 8.5% for AGIs $25k-50k, 6.8% for AGIs $50k-75k, 6.5% for AGIs $75k-100k, 6.5% for AGIs over 100k)
Profit/loss from farming: +$1,412 (reported on 0.2% of returns)
Here:
+$1,412
State:
-$7,562
IRA payment deduction: $3,502 (reported on 2.7% of returns)
91902:
$3,502
California:
$3,192
(% of AGI for various income ranges: 0.2% for AGIs $10k-25k, 0.2% for AGIs $25k-50k, 0.2% for AGIs $50k-75k, 0.2% for AGIs $75k-100k, 0.1% for AGIs over 100k)
Self-employed pension: $18,243 (reported on 2.3% of returns)
Here:
$18,243
California:
$17,688
(% of AGI for various income ranges: 0.3% for AGIs $25k-50k, 0.4% for AGIs $50k-75k, 0.3% for AGIs $75k-100k, 0.7% for AGIs over 100k)
Total itemized deductions: $29,601 (23% of AGI, reported on 49.5% of returns)
Here:
$29,601
State:
$28,113
Here:
23.4% of AGI
State:
25.3% of AGI
(% of AGI for various income ranges: 16.8% for AGIs $10k-25k, 20.6% for AGIs $25k-50k, 25.2% for AGIs $50k-75k, 25.3% for AGIs $75k-100k, 17.0% for AGIs over 100k)
Charity contributions deductions: $3,810 (3% of AGI, reported on 44.0% of returns)
Here:
$3,810
State:
$3,923
Here:
2.9% of AGI
State:
3.3% of AGI
(% of AGI for various income ranges: 1.4% for AGIs $10k-25k, 1.7% for AGIs $25k-50k, 2.4% for AGIs $50k-75k, 2.7% for AGIs $75k-100k, 2.2% for AGIs over 100k)
Total tax: $14,658 (reported on 80.8% of returns)
91902:
$14,658
State:
$10,761
(% of AGI for various income ranges: 4.9% for AGIs $10k-25k, 7.6% for AGIs $25k-50k, 8.8% for AGIs $50k-75k, 9.9% for AGIs $75k-100k, 20.2% for AGIs over 100k)
Earned income credit: $1,405 (reported on 8.2% of returns)
Here:
$1,405
State:
$1,763
Percentage of individuals using paid preparers for their 2004 taxes: 68.0%
Here:
68%
State:
66%
(% for various income ranges: 57.6% for AGIs below $10k, 65.9% for AGIs $10k-25k, 65.7% for AGIs $25k-50k, 70.9% for AGIs $50k-75k, 71.8% for AGIs $75k-100k, 77.3% for AGIs over 100k)
Likely homosexual households (counted as self-reported same-sex unmarried-partner households)
Lesbian couples: 0.1% of all households
Gay men: 0.0% of all households
Household received Food Stamps/SNAP in the past 12 months: 269 Household did not receive Food Stamps/SNAP in the past 12 months: 5,760
Women who had a birth in the past 12 months: 136 (127 now married, 8 unmarried) Women who did not have a birth in the past 12 months: 3,191 (1,173 now married, 2,021 unmarried)
Housing units in zip code 91902 with a mortgage: 3,294 (296 second mortgage, 251 both second mortgage and home equity loan) Houses without a mortgage: 9
Median monthly owner costs for units with a mortgage: $3,058 Median monthly owner costs for units without a mortgage: $883
Residents with income below the poverty level in 2022:
This zip code:
5.2%
Whole state:
12.2%
Residents with income below 50% of the poverty level in 2022:
This zip code:
2.7%
Whole state:
6.2%
Median number of rooms in houses and condos:
Here:
7.1
State:
6.0
Median number of rooms in apartments:
Here:
4.3
State:
3.9
Notable locations in this zip code not listed on our city pages
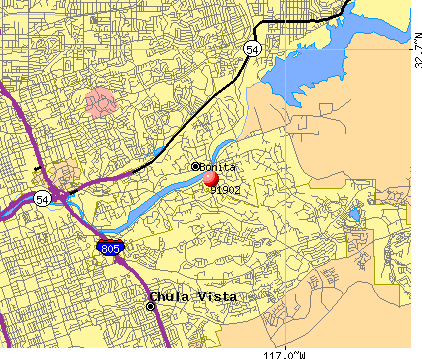
Notable locations in zip code 91902: Bonita Golf Club (A), Chula Vista Municipal Golf Course (B), Bonita Golf Course (C), Bonita-Sunnyside Branch San Diego Public Library (D), Bonita Sunnyside Fire Protection District (E). Display/hide their locations on the map
Churches in zip code 91902 include: Church of the Good Shepherd (A), Center for Joyful Living (B), Bonita Wesleyan Church (C), Bonita Valley Community Church (D), Bonita Valley Baptist Church (E), Bonita Presbyterian Church (F), Bonita Church of Religious Science (G). Display/hide their locations on the map
Parks in zip code 91902 include: Fred H Rohr Elementary School (1), Rohr Park (2), Summit Park (3), Sweetwater Regional Park (4), Bonita Long Canyon Park (5). Display/hide their locations on the map
1,890 married couples with children.
383 single-parent households (125 men, 258 women).
59.1% of residents of 91902 zip code speak English at home.
31.5% of residents speak Spanish at home (82% very well, 12% well, 6% not well, 1% not at all).
2.1% of residents speak other Indo-European language at home (68% very well, 16% well, 17% not well).
8.1% of residents speak Asian or Pacific Island language at home (68% very well, 24% well, 6% not well, 1% not at all).
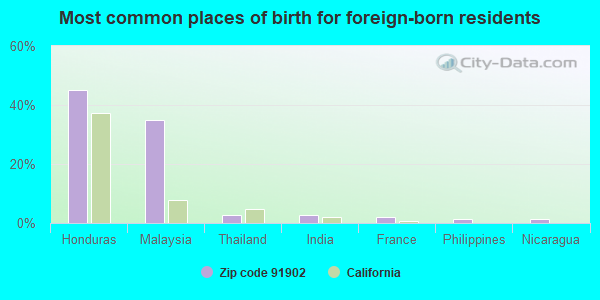
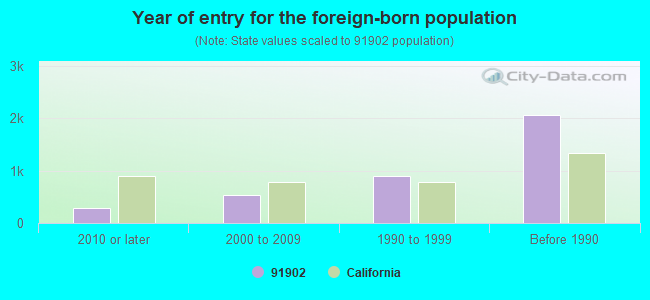
Foreign born population: 3,586 (21.1%) (79.3% of them are naturalized citizens)
This zip code:
21.1%
Whole state:
26.7%
45%Honduras
35%Malaysia
3%Thailand
3%India
2%France
1%Philippines
1%Nicaragua
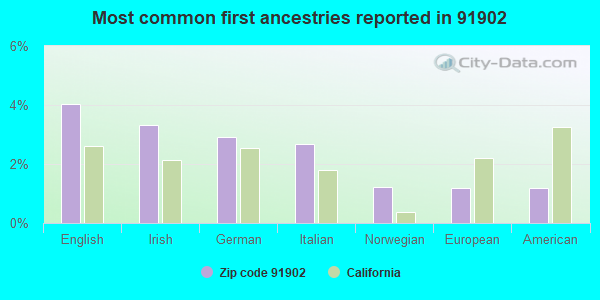
4%English
3%Irish
3%German
3%Italian
1%Norwegian
1%European
1%American
Year of entry for the foreign-born population
2882010 or later
5402000 to 2009
8991990 to 1999
2,058Before 1990
Facilities with environmental interests located in this zip code:
ALLEN (ELLA B.)/DALY (ANN) ELEMENTARY (4300 ALLEN SCHOOL ROAD in BONITA, CA)
(National Center for Education Statistics) - STATE ID-6037832 Organizations: CHULA VISTA ELEMENTARY (SCHOOL DISTRICT)
MCMILLIN DEVELOPMENT WARRANTY (1227 PASEO RANCHERO in BONITA, CA)
Small Quantity Generators, between 100 kg and 1000 kg of hazardous waste/month (Resource Conservation and Recovery Act (tracking hazardous waste)) - notification
GLEN ABBEY MEMORIAL PARK (3838 BONITA RD in BONITA, CA)
Small Quantity Generators, between 100 kg and 1000 kg of hazardous waste/month (Resource Conservation and Recovery Act (tracking hazardous waste))
ARCO #1806 (4498 BONITA RD in BONITA, CA)
CRITERIA AND HAZARDOUS AIR POLLUTANT INVENTORY (Inventory of air pollution sources) Business SIC classification: GASOLINE SERVICE STATIONS
Housing units lacking complete plumbing facilities: 0.7% Housing units lacking complete kitchen facilities: 1.5%
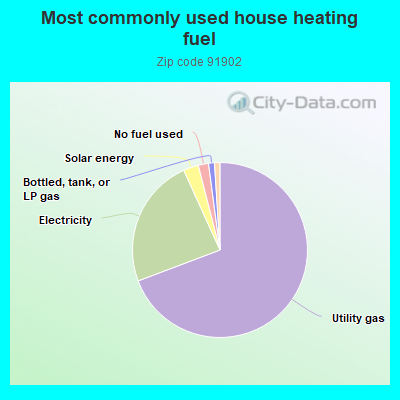
69.4%Utility gas
24.0%Electricity
2.8%Solar energy
1.9%No fuel used
1.1%Bottled, tank, or LP gas
Population in 1990: 16,579. Population change in the 1990s: +800 (+4.8%).
Place of birth for U.S.-born residents:
This state: 9,521
Northeast: 798
Midwest: 1,269
South: 835
West: 589
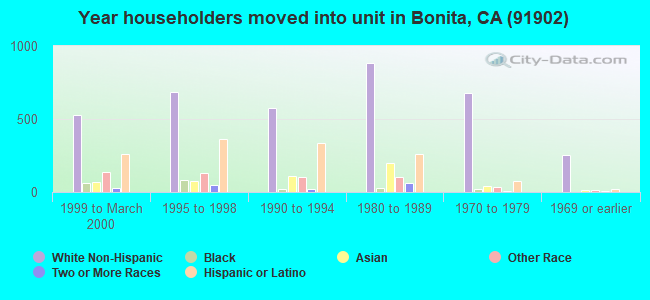
63% of the 91902 zip code residents lived in the same house 5 years ago. Out of people who lived in different houses, 70% lived in this county. Out of people who lived in different counties, 50% lived in California.
96% of the 91902 zip code residents lived in the same house 1 year ago. Out of people who lived in different houses, 63% moved from this county. Out of people who lived in different houses, 24% moved from different county within same state. Out of people who lived in different houses, 14% moved from different state. Out of people who lived in different houses, 8% moved from abroad.
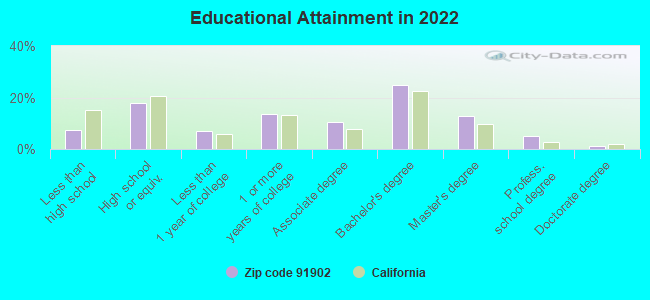
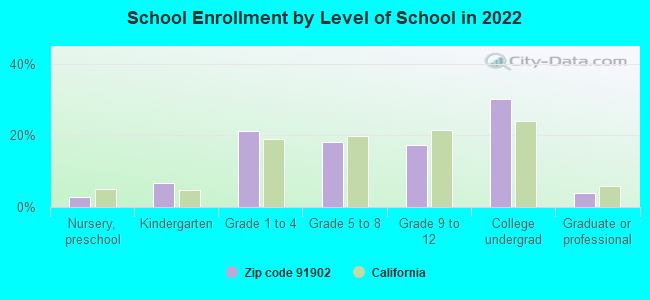
Private vs. public school enrollment:
Students in private schools in grades 1 to 8 (elementary and middle school): 342
Here:
24.9%
California:
10.5%
Students in private schools in grades 9 to 12 (high school): 62
Here:
10.5%
California:
8.5%
Students in private undergraduate colleges: 241
Here:
23.2%
California:
15.9%
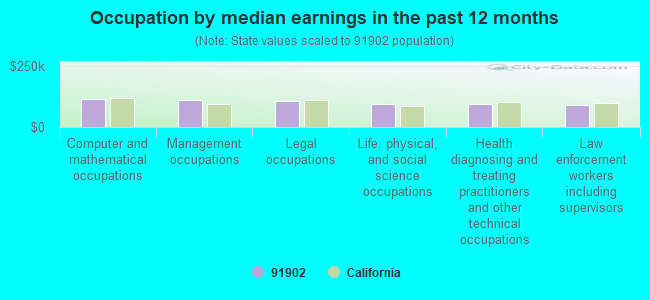
Occupation by median earnings in the past 12 months ($)
115,943Computer and mathematical occupations
111,308Management occupations
105,621Legal occupations
95,307Life, physical, and social science occupations
93,326Health diagnosing and treating practitioners and other technical occupations
92,226Law enforcement workers including supervisors
Companies with biggest federal contracts located in this zip code (BONITA, CA):
SOUTH BAY EDC, INC (4050 ACACIA AVE; small business) : $37,694,405 in 225 contractsfrom 1999 to 2006
Contracts for Maintenance, Repair or Alteration of Real Property -- Other Utilities, Maintenance, Repair or Alteration of Real Property -- Miscellaneous Buildings, Construction of Structures and Facilities -- Other Non-Building Facilities, Construction of Structures and Facilities -- Other Utilities, and moreby Navy, Air Force Signed by year:2000: $1,072,089; 2001: $1,566,137; 2002: $4,726,693; 2003: $14,344,979; 2004: $5,819,047; 2005: $8,458,367; 2006: $1,622,271.
Biggest contracts:
$3,300,000 with Navy for Maintenance, Repair or Alteration of Real Property -- Other Utilities. Signed on 2003-09-30. Completion date: 2004-09-29.
$2,956,781 with Navy for Maintenance, Repair or Alteration of Real Property -- Miscellaneous Buildings. Signed on 2003-09-29. Completion date: 2004-10-15.
$2,300,000 with Navy for Construction of Structures and Facilities -- Other Non-Building Facilities. Signed on 2003-09-29. Completion date: 2005-04-07.
$2,108,906 with Navy for Construction of Structures and Facilities -- Other Utilities. Signed on 2005-08-30. Completion date: 2005-10-15.
SOUTH BAY EDC INC (4050 ACACIA AVE; small business) : $14,688,700 in 33 contractsfrom 2001 to 2006
Contracts for Maintenance, Repair or Alteration of Real Property -- Hospitals and Infirmaries, Modification of Equipment -- Fire Control Equipment, Maintenance, Repair or Alteration of Real Property -- Other Non-Building Facilities, Construction of Structures and Facilities -- Other Airfield Structures, and moreby Department of Veterans Affairs, Army, Navy Signed by year:2000: $0; 2001: $1,564,000; 2002: $0; 2003: $2,989,317; 2004: $2,060,684; 2005: $4,275,797; 2006: $3,798,902.
Biggest contracts:
$2,441,217 with Department of Veterans Affairs for Maintenance, Repair or Alteration of Real Property -- Hospitals and Infirmaries. Signed on 2003-09-15. Completion date: 2007-11-15.
$2,000,000 with Army for Modification of Equipment -- Fire Control Equipment. Taking place in TX. Signed on 2006-03-31. Completion date: 2007-02-23.
$1,886,455 with Department of Veterans Affairs for Maintenance, Repair or Alteration of Real Property -- Hospitals and Infirmaries. Signed on 2004-09-30. Completion date: 2005-10-30.
$1,627,914 with Army for Maintenance, Repair or Alteration of Real Property -- Other Non-Building Facilities. Taking place in NV. Signed on 2005-09-30. Completion date: 2006-07-28.
A & D/ SOUTHBAY JOINT VENTURE (4050 ACACIA AVE; small business) : $3,866,948 in 16 contractsfrom 2004 to 2006
Contracts for Construction of Structures and Facilities -- Other Administrative Facilities and Service Buildings, Construction of Structures and Facilities -- Troop Housing Facilities, Maintenance, Repair or Alteration of Real Property -- Other Non-Building Facilities by Navy Signed by year:2000: $0; 2001: $0; 2002: $0; 2003: $0; 2004: $348,500; 2005: $2,933,308; 2006: $585,140.
Biggest contracts:
$1,224,305 with Navy for Construction of Structures and Facilities -- Other Administrative Facilities and Service Buildings. Signed on 2005-09-26. Completion date: 2006-10-11.
$703,100, same as above.Signed on 2005-06-21. Completion date: 2006-04-01.
$656,895 with Navy for Construction of Structures and Facilities -- Troop Housing Facilities. Taking place in AZ. Signed on 2006-01-12. Completion date: 2006-10-24.
$343,500 with Navy for Maintenance, Repair or Alteration of Real Property -- Other Non-Building Facilities. Signed on 2004-12-21. Completion date: 2005-07-05.
LINDA ANN COLE (5619 SPRINTER LN; small business) : $1,220,121 in 139 contractsfrom 2000 to 2006
Contracts for Aircraft Hydraulic, Vacuum, and De-icing System Components, Gas Turbines and Jet Engines, Non-Aircraft; and Components, Miscellaneous Aircraft Accessories and Components, Switches, and moreby Defense Logistics Agency, Navy Signed by year:2000: $144,176; 2001: $0; 2002: $0; 2003: $0; 2004: $465,459; 2005: $484,938; 2006: $125,548.
Biggest contracts:
$70,150 with Defense Logistics Agency for Aircraft Hydraulic, Vacuum, and De-icing System Components. Signed on 2005-12-27. Completion date: 2006-01-26.
$56,076 with Navy for Gas Turbines and Jet Engines, Non-Aircraft; and Components. Signed on 2000-08-22. Completion date: 2000-12-26.
$40,500 with Navy for Miscellaneous Aircraft Accessories and Components. Signed on 2005-03-22. Completion date: 2005-06-20.
$36,500 with Defense Logistics Agency for Switches. Signed on 2004-07-20. Completion date: 2004-12-02.
SANDPIPER OF CALIFORNIA INC (3875 THE HILL ROAD; small business) : $189,861 in 6 contractsfrom 2003 to 2006
Contracts for Cleaning and Polishing Compounds and Preparations, Individual Equipment by Air Force, Department of Defense, Army Signed by year:2000: $0; 2001: $0; 2002: $0; 2003: $168,106; 2004: $0; 2005: $0; 2006: $21,755.
Biggest contracts:
$89,100 with Air Force for Cleaning and Polishing Compounds and Preparations. Taking place in MD. Signed on 2003-09-26. Completion date: 2003-11-27.
$45,000 with Department of Defense for Individual Equipment. Taking place in VA. Signed on 2003-04-02. Completion date: 2003-07-18.
$34,006 with Air Force for Cleaning and Polishing Compounds and Preparations. Taking place in MD. Signed on 2003-09-25. Completion date: 2003-10-27.
$21,340 with Army for Individual Equipment. Signed on 2006-02-16. Completion date: 2006-02-27.
LEXICONUSA, LLC (3723 BONITA GLEN TERRACE; small business) : $37,378 in 2 contractsfrom 2003 to 2005
$33,144 with Army for Miscellaneous Communication Equipment. Signed on 2003-09-01. Completion date: 2003-10-17.
$4,234, same as above.Signed on 2005-02-17. Completion date: 2005-02-25.
CASILLAS, H A LANDSCAPE (3498 WALLACE DR; small business) : $36,216 in 5 contractsfrom 2003 to 2006
Contracts for Landscaping/Groundskeeping Services by Army Signed by year:2000: $0; 2001: $0; 2002: $0; 2003: $9,720; 2004: $15,680; 2005: $0; 2006: $10,816.
Biggest contracts:
$10,816 with Army for Landscaping/Groundskeeping Services. Signed on 2006-03-01. Completion date: 2007-02-28.
$10,680, same as above.Signed on 2004-12-06. Completion date: 2004-09-30.
$9,720, same as above.Signed on 2003-10-01. Completion date: 2004-09-30.
$5,000, same as above.Signed on 2004-05-18. Completion date: 2004-06-02.
MORANS CONSTRUCTION INC (3840 ALTA LOMA DR; small business)
$24,200 with Navy for Prefabricated and Portable Buildings. Signed on 2005-09-25. Completion date: 2005-12-12.
CHILL AIR MECHANICAL (301 MAVERICK PL; small business) : $12,485 in 2 contractsin 2005
$7,485 with Navy for Refrigeration Equipment. Signed on 2005-04-04. Completion date: 2005-04-29.
$5,000 with Navy for Maintenance, Repair and Rebuilding of Equipment -- Electrical and Electronic Equipment Components. Signed on 2005-04-04. Completion date: 2005-04-15.
CONSULTING SERVICES (4415 ACACIA AVENUE; small business)
$6,405 with Air Force for Other Medical Services. Signed on 2003-08-26. Completion date: 2003-08-30.
Top industries in this zip code by the number of employees in 2005:
2005 - 2018 National Fire Incident Reporting System (NFIRS) incidents
According to the data from the years 2005 - 2018 the average number of fires per year is 21. The highest number of reported fire incidents - 45 took place in 2017, and the least - 4 in 2009. The data has an increasing trend.
When looking into fire subcategories, the most incidents belonged to: Structure Fires (39.0%), and Outside Fires (34.8%).
Fire incident types reported to NFIRS in Zip Code 91902


+$1,412
-$7,562
 Nearest zip codes: 92139, 91910, 92114, 91913, 91977, 91911.


 According to the data from the years 2005 - 2018 the average number of fires per year is 21. The highest number of reported fire incidents - 45 took place in 2017, and the least - 4 in 2009. The data has an increasing trend.
 When looking into fire subcategories, the most incidents belonged to: Structure Fires (39.0%), and Outside Fires (34.8%).