Estimated zip code population in 2022: 55,636 Zip code population in 2010: 40,971 Zip code population in 2000: 12,880
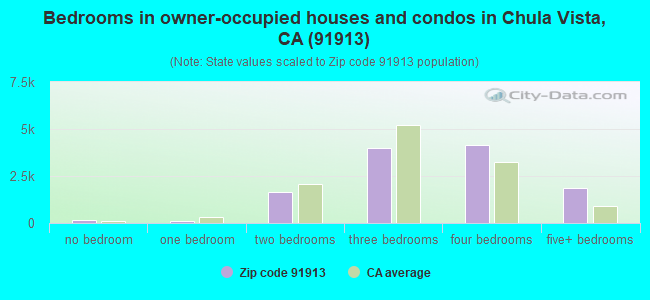
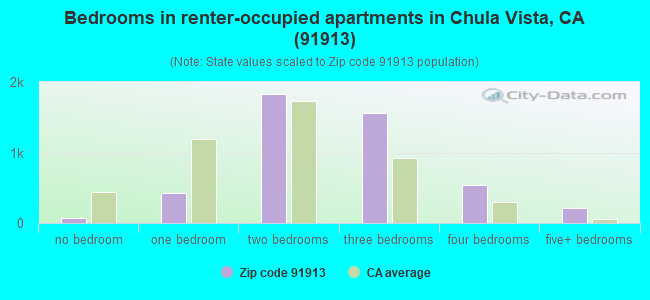
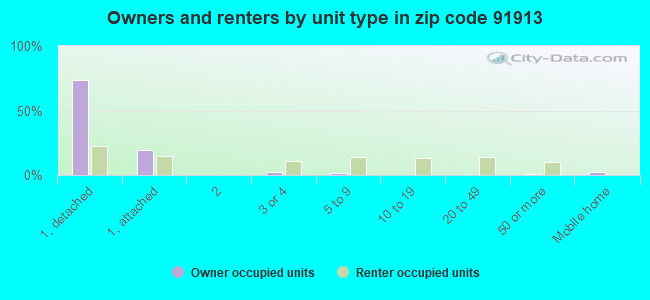
Houses and condos: 17,189 Renter-occupied apartments: 4,640
% of renters here:
28%
State:
44%
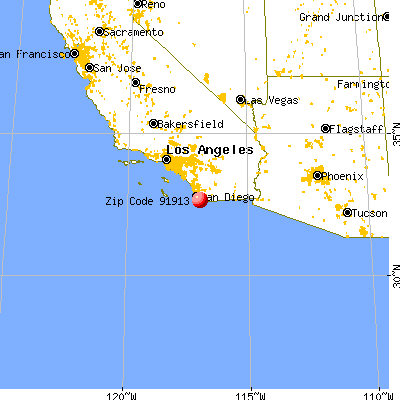
March 2022 cost of living index in zip code 91913: 121.8 (high, U.S. average is 100)
Land area: 10.2 sq. mi. Water area: 0.0 sq. mi.
Population density: 5,457 people per square mile
(average).
OSM Map
General Map
Google Map
MSN Map
OSM Map
General Map
Google Map
MSN Map
OSM Map
General Map
Google Map
MSN Map
OSM Map
General Map
Google Map
MSN Map
Please wait while loading the map...
Real estate property taxes paid for housing units in 2022:
This zip code:
1.1% ($7,784)
California:
0.7% ($4,831)
Median real estate property taxes paid for housing units with mortgages in 2022: $7,845 (1.1%) Median real estate property taxes paid for housing units with no mortgage in 2022: $7,883 (1.1%)
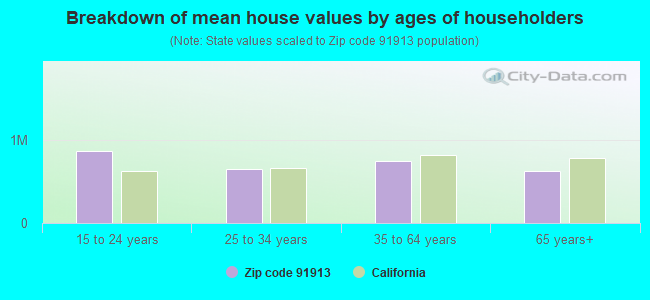
Estimated median house/condo value in 2022: $733,599
91913:
$733,599
California:
$715,900
According to our research of California and other state lists, there were 17 registered sex offenders living in 91913 zip code as of April 27, 2024. The ratio of all residents to sex offenders in zip code 91913 is 2,834 to 1. The ratio of registered sex offenders to all residents in this zip code is much lower than the state average.
Median resident age:
This zip code:
35.3 years
California median age:
37.9 years
Average household size:
This zip code:
3.4 people
California:
2.8 people
Averages for the 2020 tax year for zip code 91913, filed in 2021:
Average Adjusted Gross Income (AGI) in 2020: $82,036 (Individual Income Tax Returns)
Here:
$82,036
State:
$95,910
Salary/wage: $75,541 (reported on 86.7% of returns)
Here:
$75,541
State:
$77,331
(% of AGI for various income ranges: 1127.0% for AGIs below $25k, 3777.8% for AGIs $25k-50k, 6728.4% for AGIs $50k-75k, 10008.7% for AGIs $75k-100k, 20179.9% for AGIs $100k-200k, 73261.9% for AGIs over 200k)
Taxable interest for individuals: $559 (reported on 39.2% of returns)
This zip code:
$559
California:
$2,294
(% of AGI for various income ranges: 7.6% for AGIs below $25k, 13.1% for AGIs $25k-50k, 27.7% for AGIs $50k-75k, 40.1% for AGIs $75k-100k, 58.9% for AGIs $100k-200k, 214.2% for AGIs over 200k)
Ordinary dividends: $2,079 (reported on 14.0% of returns)
Here:
$2,079
State:
$10,949
(% of AGI for various income ranges: 7.6% for AGIs below $25k, 13.0% for AGIs $25k-50k, 23.5% for AGIs $50k-75k, 46.9% for AGIs $75k-100k, 71.2% for AGIs $100k-200k, 481.5% for AGIs over 200k)
Net capital gain/loss in AGI: +$7,934 (reported on 15.3% of returns)
Here:
+$7,934
State:
+$49,306
(% of AGI for various income ranges: 3.2% for AGIs below $25k, 11.9% for AGIs $25k-50k, 36.1% for AGIs $50k-75k, 99.9% for AGIs $75k-100k, 211.4% for AGIs $100k-200k, 3857.2% for AGIs over 200k)
Profit/loss from business: +$7,552 (reported on 16.1% of returns)
Here:
+$7,552
State:
+$15,671
(% of AGI for various income ranges: 102.0% for AGIs below $25k, 79.2% for AGIs $25k-50k, 127.1% for AGIs $50k-75k, 196.5% for AGIs $75k-100k, 194.4% for AGIs $100k-200k, 1706.4% for AGIs over 200k)
Taxable individual retirement arrangement distribution: $18,649 (reported on 4.1% of returns)
91913:
$18,649
California:
$23,505
(% of AGI for various income ranges: 15.7% for AGIs below $25k, 35.8% for AGIs $25k-50k, 65.0% for AGIs $50k-75k, 119.9% for AGIs $75k-100k, 224.3% for AGIs $100k-200k, 1015.8% for AGIs over 200k)
Self-employed (Keogh) retirement plans: $22,683 (reported on 0.2% of returns)
91913:
$22,683
California:
$30,163
(% of AGI for various income ranges: 24.3% for AGIs $75k-100k, 162.1% for AGIs over 200k)
Total itemized deductions: $34,022 (reported on 24.0% of returns)
Here:
$34,022
State:
$39,517
(% of AGI for various income ranges: 65.9% for AGIs below $25k, 227.1% for AGIs $25k-50k, 692.0% for AGIs $50k-75k, 1404.1% for AGIs $75k-100k, 2730.7% for AGIs $100k-200k, 10458.5% for AGIs over 200k)
Charity contributions: $6,059 (reported on 19.0% of returns)
Here:
$6,059
State:
$12,598
(% of AGI for various income ranges: 3.2% for AGIs below $25k, 17.9% for AGIs $25k-50k, 64.0% for AGIs $50k-75k, 147.4% for AGIs $75k-100k, 353.5% for AGIs $100k-200k, 2234.9% for AGIs over 200k)
Taxes paid: $9,367 (reported on 23.9% of returns)
91913:
$9,367
State:
$8,807
(% of AGI for various income ranges: 18.1% for AGIs below $25k, 61.3% for AGIs $25k-50k, 207.6% for AGIs $50k-75k, 446.6% for AGIs $75k-100k, 823.7% for AGIs $100k-200k, 2048.3% for AGIs over 200k)
Earned income credit: $2,026 (reported on 11.2% of returns)
Here:
$2,026
State:
$2,074
(% of AGI for various income ranges: 67.5% for AGIs below $25k, 60.8% for AGIs $25k-50k, 1.6% for AGIs $50k-75k)
Percentage of individuals using paid preparers for their 2020 taxes: 94.3%
Here:
94%
State:
92%
(% for various income ranges: 92.7% for AGIs below $25k, 95.1% for AGIs $25k-50k, 94.5% for AGIs $50k-75k, 94.9% for AGIs $75k-100k, 95.0% for AGIs $100k-200k, 94.1% for AGIs over 200k)
Averages for the 2012 tax year for zip code 91913, filed in 2013:
Average Adjusted Gross Income (AGI) in 2012: $67,968 (Individual Income Tax Returns)
Here:
$67,968
State:
$72,726
Salary/wage: $64,267 (reported on 89.1% of returns)
Here:
$64,267
State:
$59,079
(% of AGI for various income ranges: 79.1% for AGIs below $25k, 85.0% for AGIs $25k-50k, 84.8% for AGIs $50k-75k, 85.8% for AGIs $75k-100k, 86.4% for AGIs $100k-200k, 75.2% for AGIs over 200k)
Taxable interest for individuals: $461 (reported on 38.8% of returns)
This zip code:
$461
California:
$2,146
(% of AGI for various income ranges: 0.5% for AGIs below $25k, 0.3% for AGIs $25k-50k, 0.3% for AGIs $50k-75k, 0.3% for AGIs $75k-100k, 0.2% for AGIs $100k-200k, 0.4% for AGIs over 200k)
Ordinary dividends: $2,362 (reported on 12.0% of returns)
Here:
$2,362
State:
$9,308
(% of AGI for various income ranges: 0.5% for AGIs below $25k, 0.3% for AGIs $25k-50k, 0.4% for AGIs $50k-75k, 0.3% for AGIs $75k-100k, 0.3% for AGIs $100k-200k, 1.2% for AGIs over 200k)
Net capital gain/loss in AGI: +$3,149 (reported on 10.0% of returns)
Here:
+$3,149
State:
+$30,460
(% of AGI for various income ranges: 0.2% for AGIs $75k-100k, 0.4% for AGIs $100k-200k, 2.4% for AGIs over 200k)
Profit/loss from business: +$11,440 (reported on 13.8% of returns)
Here:
+$11,440
State:
+$17,064
(% of AGI for various income ranges: 10.7% for AGIs below $25k, 3.7% for AGIs $25k-50k, 2.8% for AGIs $50k-75k, 1.8% for AGIs $75k-100k, 1.2% for AGIs $100k-200k, 1.7% for AGIs over 200k)
Taxable individual retirement arrangement distribution: $13,621 (reported on 4.9% of returns)
91913:
$13,621
California:
$19,557
(% of AGI for various income ranges: 0.9% for AGIs below $25k, 0.8% for AGIs $25k-50k, 1.0% for AGIs $50k-75k, 1.1% for AGIs $75k-100k, 1.0% for AGIs $100k-200k, 1.1% for AGIs over 200k)
Self-employment retirement plans: $13,675 (reported on 0.2% of returns)
91913:
$13,675
California:
$24,530
Total itemized deductions: $29,301 (28% of AGI, reported on 46.9% of returns)
Here:
$29,301
State:
$34,004
Here:
27.9% of AGI
State:
22.7% of AGI
(% of AGI for various income ranges: 11.0% for AGIs below $25k, 14.7% for AGIs $25k-50k, 19.8% for AGIs $50k-75k, 21.6% for AGIs $75k-100k, 22.5% for AGIs $100k-200k, 19.5% for AGIs over 200k)
Charity contributions: $2,790 (reported on 37.6% of returns)
Here:
$2,790
State:
$4,659
(% of AGI for various income ranges: 0.5% for AGIs below $25k, 0.9% for AGIs $25k-50k, 1.3% for AGIs $50k-75k, 1.6% for AGIs $75k-100k, 1.9% for AGIs $100k-200k, 1.5% for AGIs over 200k)
Taxes paid: $10,854 (reported on 46.6% of returns)
91913:
$10,854
State:
$14,448
(% of AGI for various income ranges: 2.9% for AGIs below $25k, 4.4% for AGIs $25k-50k, 6.3% for AGIs $50k-75k, 7.5% for AGIs $75k-100k, 8.7% for AGIs $100k-200k, 9.3% for AGIs over 200k)
Earned income credit: $2,142 (reported on 14.4% of returns)
Here:
$2,142
State:
$2,286
(% of AGI for various income ranges: 6.0% for AGIs below $25k, 1.3% for AGIs $25k-50k)
Percentage of individuals using paid preparers for their 2012 taxes: 62.1%
Here:
62%
State:
64%
(% for various income ranges: 55.6% for AGIs below $25k, 59.3% for AGIs $25k-50k, 64.7% for AGIs $50k-75k, 65.3% for AGIs $75k-100k, 67.9% for AGIs $100k-200k, 76.0% for AGIs over 200k)
Averages for the 2004 tax year for zip code 91913, filed in 2005:
Average Adjusted Gross Income (AGI) in 2004: $56,780 (Individual Income Tax Returns)
Here:
$56,780
State:
$58,600
Salary/wage: $53,598 (reported on 90.4% of returns)
Here:
$53,598
State:
$49,455
(% of AGI for various income ranges: 135.2% for AGIs below $10k, 83.0% for AGIs $10k-25k, 86.7% for AGIs $25k-50k, 88.6% for AGIs $50k-75k, 89.9% for AGIs $75k-100k, 80.3% for AGIs over 100k)
Taxable interest for individuals: $676 (reported on 51.6% of returns)
This zip code:
$676
California:
$2,365
(% of AGI for various income ranges: 2.7% for AGIs below $10k, 1.0% for AGIs $10k-25k, 0.6% for AGIs $25k-50k, 0.7% for AGIs $50k-75k, 0.4% for AGIs $75k-100k, 0.6% for AGIs over 100k)
Taxable dividends: $973 (reported on 16.0% of returns)
Here:
$973
State:
$4,746
(% of AGI for various income ranges: 1.7% for AGIs below $10k, 0.6% for AGIs $10k-25k, 0.3% for AGIs $25k-50k, 0.3% for AGIs $50k-75k, 0.1% for AGIs $75k-100k, 0.3% for AGIs over 100k)
Net capital gain/loss: +$8,565 (reported on 13.9% of returns)
Here:
+$8,565
State:
+$23,418
(% of AGI for various income ranges: -0.9% for AGIs below $10k, 0.1% for AGIs $10k-25k, 0.4% for AGIs $25k-50k, 0.3% for AGIs $50k-75k, 0.6% for AGIs $75k-100k, 4.7% for AGIs over 100k)
Profit/loss from business: +$16,430 (reported on 15.4% of returns)
Here:
+$16,430
State:
+$16,826
(% of AGI for various income ranges: 5.5% for AGIs below $10k, 7.7% for AGIs $10k-25k, 5.4% for AGIs $25k-50k, 3.2% for AGIs $50k-75k, 2.9% for AGIs $75k-100k, 5.0% for AGIs over 100k)
IRA payment deduction: $2,859 (reported on 2.2% of returns)
91913:
$2,859
California:
$3,192
(% of AGI for various income ranges: 0.1% for AGIs $10k-25k, 0.2% for AGIs $25k-50k, 0.1% for AGIs $50k-75k, 0.1% for AGIs $75k-100k, 0.1% for AGIs over 100k)
Self-employed pension: $17,765 (reported on 0.6% of returns)
Here:
$17,765
California:
$17,688
(% of AGI for various income ranges: 0.1% for AGIs $50k-75k, 0.0% for AGIs $75k-100k, 0.4% for AGIs over 100k)
Total itemized deductions: $28,995 (34% of AGI, reported on 52.5% of returns)
Here:
$28,995
State:
$28,113
Here:
34.0% of AGI
State:
25.3% of AGI
(% of AGI for various income ranges: 23.6% for AGIs below $10k, 13.3% for AGIs $10k-25k, 23.5% for AGIs $25k-50k, 31.2% for AGIs $50k-75k, 31.4% for AGIs $75k-100k, 25.6% for AGIs over 100k)
Charity contributions deductions: $2,551 (3% of AGI, reported on 45.3% of returns)
Here:
$2,551
State:
$3,923
Here:
2.9% of AGI
State:
3.3% of AGI
(% of AGI for various income ranges: 0.5% for AGIs below $10k, 0.8% for AGIs $10k-25k, 1.6% for AGIs $25k-50k, 2.2% for AGIs $50k-75k, 2.3% for AGIs $75k-100k, 2.2% for AGIs over 100k)
Total tax: $6,556 (reported on 78.1% of returns)
91913:
$6,556
State:
$10,761
(% of AGI for various income ranges: 4.1% for AGIs below $10k, 4.3% for AGIs $10k-25k, 5.7% for AGIs $25k-50k, 6.4% for AGIs $50k-75k, 7.3% for AGIs $75k-100k, 13.2% for AGIs over 100k)
Earned income credit: $1,650 (reported on 11.5% of returns)
Here:
$1,650
State:
$1,763
Percentage of individuals using paid preparers for their 2004 taxes: 67.7%
Here:
68%
State:
66%
(% for various income ranges: 56.1% for AGIs below $10k, 68.3% for AGIs $10k-25k, 68.0% for AGIs $25k-50k, 70.5% for AGIs $50k-75k, 71.0% for AGIs $75k-100k, 70.7% for AGIs over 100k)
Likely homosexual households (counted as self-reported same-sex unmarried-partner households)
Lesbian couples: 0.2% of all households
Gay men: 0.0% of all households
Household received Food Stamps/SNAP in the past 12 months: 1,328 Household did not receive Food Stamps/SNAP in the past 12 months: 14,928
Women who had a birth in the past 12 months: 595 (467 now married, 127 unmarried) Women who did not have a birth in the past 12 months: 13,369 (6,035 now married, 7,303 unmarried)
Housing units in zip code 91913 with a mortgage: 9,140 (720 second mortgage, 59 home equity loan, 422 both second mortgage and home equity loan) Houses without a mortgage: 29
Median monthly owner costs for units with a mortgage: $3,124 Median monthly owner costs for units without a mortgage: $1,018
Residents with income below the poverty level in 2022:
This zip code:
5.5%
Whole state:
12.2%
Residents with income below 50% of the poverty level in 2022:
This zip code:
2.6%
Whole state:
6.2%
Median number of rooms in houses and condos:
Here:
6.2
State:
6.0
Median number of rooms in apartments:
Here:
4.7
State:
3.9
Notable locations in this zip code not listed on our city pages
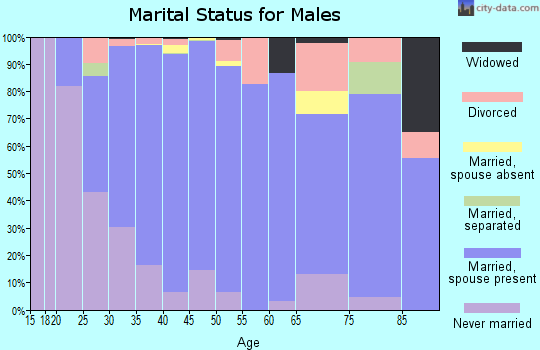
10,461 married couples with children.
3,151 single-parent households (713 men, 2,438 women).
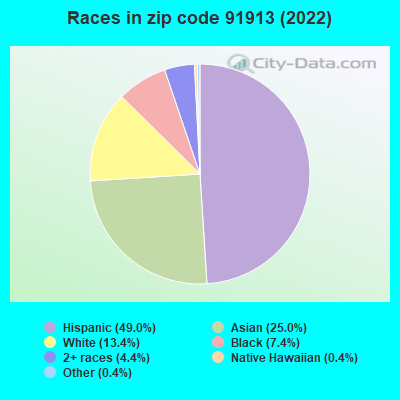
48.8% of residents of 91913 zip code speak English at home.
35.0% of residents speak Spanish at home (75% very well, 14% well, 8% not well, 3% not at all).
0.8% of residents speak other Indo-European language at home (82% very well, 15% well, 3% not well).
14.7% of residents speak Asian or Pacific Island language at home (66% very well, 23% well, 10% not well, 1% not at all).
0.3% of residents speak other language at home (100% very well).
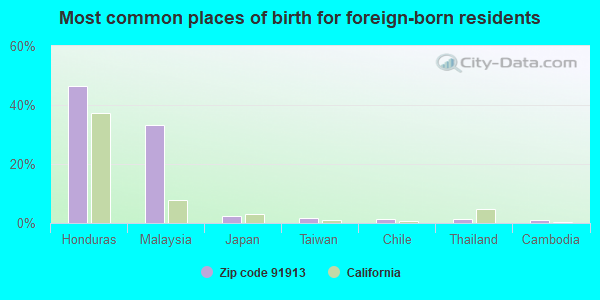
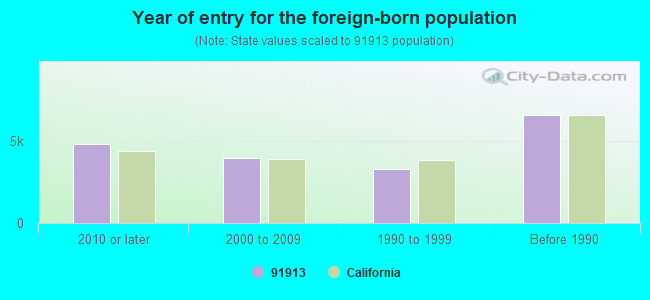
Foreign born population: 16,791 (30.2%) (69.2% of them are naturalized citizens)
Facilities with environmental interests located in this zip code:
CHEVRON STATION 93599 (903 OTAY LAKE RD in CHULA VISTA, CA)
STATE MASTER (California - Hazardous Waste Tracking) - HAZARDOU WASTE PROGRAM CRITERIA AND HAZARDOUS AIR POLLUTANT INVENTORY (Inventory of air pollution sources) Small Quantity Generators, between 100 kg and 1000 kg of hazardous waste/month (Resource Conservation and Recovery Act (tracking hazardous waste)) - notification STATE MASTER (California - Used Oil Recycling System ) - USED OIL RECYCLING Business SIC classification: GASOLINE SERVICE STATIONS Organizations: CHEVRON PRODUCTS CO (CONTACT/OWNER)
Alternative names: BONITA VISTA GAS & AUTO, CHEVRON STATION NO 93599
EASTLAKE ELEMENTARY (1955 HILLSIDE DR. in CHULA VISTA, CA)
(National Center for Education Statistics) - STATE ID-6108492 Organizations: CHULA VISTA ELEMENTARY (SCHOOL DISTRICT)
HERITAGE ELEMENTARY (1450 SANTA LUCIA ROAD in CHULA VISTA, CA)
(National Center for Education Statistics) - STATE ID-6118970 Organizations: CHULA VISTA ELEMENTARY (SCHOOL DISTRICT)
FORMER OTAY SKEET AND TRAP SHOOTING (5350 HERITAGE ROAD in CHULA VISTA, CA)
Large Quantity Generators, more that 1000 kg of hazardous waste/month (Resource Conservation and Recovery Act (tracking hazardous waste)) Organizations: FLAT ROCK LAND CO LLC (CONTACT/OPERATOR)
Housing units lacking complete plumbing facilities: 0.2% Housing units lacking complete kitchen facilities: 0.5%
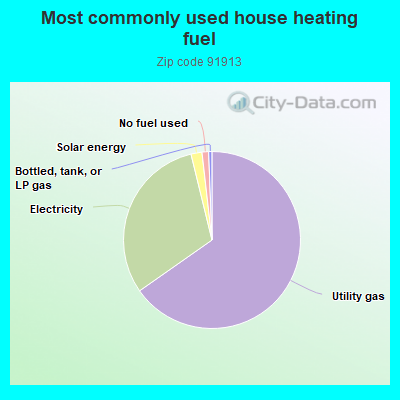
65.2%Utility gas
30.9%Electricity
2.0%Solar energy
1.2%No fuel used
0.6%Bottled, tank, or LP gas
Population in 1990: 10,079. Population change in the 1990s: +2,801 (+27.8%).
Place of birth for U.S.-born residents:
This state: 28,590
Northeast: 1,626
Midwest: 1,662
South: 3,719
West: 1,401
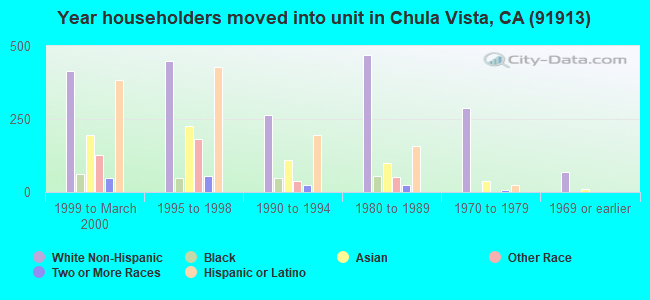
54% of the 91913 zip code residents lived in the same house 5 years ago. Out of people who lived in different houses, 75% lived in this county. Out of people who lived in different counties, 50% lived in California.
89% of the 91913 zip code residents lived in the same house 1 year ago. Out of people who lived in different houses, 65% moved from this county. Out of people who lived in different houses, 12% moved from different county within same state. Out of people who lived in different houses, 11% moved from different state. Out of people who lived in different houses, 12% moved from abroad.
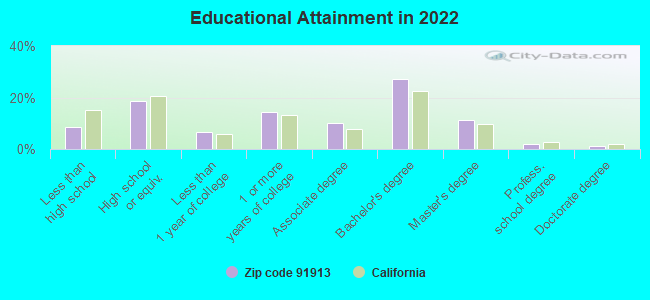
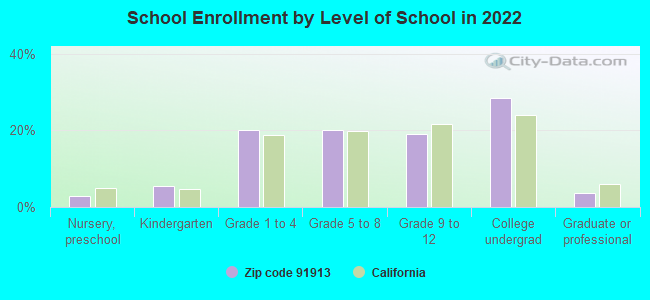
Private vs. public school enrollment:
Students in private schools in grades 1 to 8 (elementary and middle school): 363
Here:
4.7%
California:
10.5%
Students in private schools in grades 9 to 12 (high school): 72
Here:
1.9%
California:
8.5%
Students in private undergraduate colleges: 1,267
Here:
22.9%
California:
15.9%
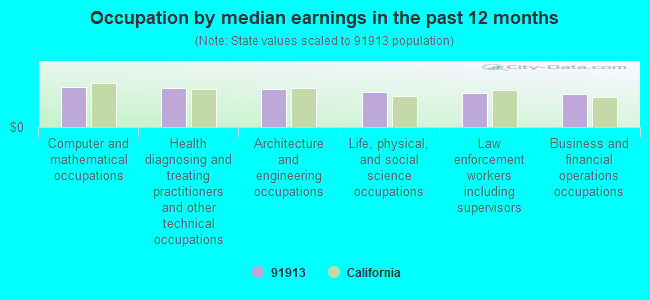
Occupation by median earnings in the past 12 months ($)
102,836Computer and mathematical occupations
99,342Health diagnosing and treating practitioners and other technical occupations
97,341Architecture and engineering occupations
88,931Life, physical, and social science occupations
86,250Law enforcement workers including supervisors
84,967Business and financial operations occupations
Companies with federal contracts located in this zip code (CHULA VISTA, CA):
GREENTOES G R P & COATINGS INC (1816 CABERNET DR; small business) 100 employees, $0 revenue. Woman Owned Business, Emerging Small Business: $173,579 in 13 contractsfrom 2002 to 2006
Contracts for Ship and Boat Propulsion Components, Non-nuclear Ship Repair (West) Ship repair (including overhauls and conversions) performed on. non-nuclear propelled and nonpropelled ships west of the 108th meridian, Miscellaneous Fabricated Nonmetallic Materials, Miscellaneous Items by Navy, Army Signed by year:2000: $0; 2001: $0; 2002: $10,100; 2003: $0; 2004: $35,200; 2005: $92,031; 2006: $36,248.
Biggest contracts:
$35,200 with Navy for Ship and Boat Propulsion Components. Signed on 2004-06-01. Completion date: 2004-12-01.
$24,498 with Navy for Non-nuclear Ship Repair (West) Ship repair (including overhauls and conversions) performed on. non-nuclear propelled and nonpropelled ships west of the 108th meridian. Signed on 2005-11-28. Completion date: 2005-12-05.
$22,400 with Army for Miscellaneous Fabricated Nonmetallic Materials. Signed on 2006-05-31. Effective on 2006-05-30. Completion date: 2006-08-31.
$21,498 with Navy for Non-nuclear Ship Repair (West) Ship repair (including overhauls and conversions) performed on. non-nuclear propelled and nonpropelled ships west of the 108th meridian. Taking place in HI. Signed on 2005-12-28. Completion date: 2006-01-24.
NLD (798 CAMINITO FRANCISCO; small business) : $108,844 in 3 contractsfrom 2002 to 2004
$54,800 with Navy for Medical and Health Studies. Signed on 2004-10-01. Completion date: 2005-09-30.
$46,982 with Navy for Biomedical -- Basic Research (R&D). Signed on 2002-07-29. Completion date: 2002-08-12.
$7,062 with Navy for Biomedical -- Engineering Development (R&D). Signed on 2004-09-01. Completion date: 2004-09-30.
JOANNE UEBLACKER (673 RUE LE BLANC; small business) : $36,595 in 6 contractsfrom 2001 to 2005
Contracts for Dentistry Services by Navy Signed by year:2000: $0; 2001: $7,735; 2002: $0; 2003: $9,360; 2004: $9,620; 2005: $9,880; 2006: $0.
Biggest contracts:
$9,880 with Navy for Dentistry Services. Signed on 2005-10-20. Completion date: 2004-09-30.
$9,620, same as above.Signed on 2004-10-22. Completion date: 2004-09-30.
$9,360, same as above.Signed on 2003-10-01. Completion date: 2004-09-30.
$8,359, same as above.Signed on 2001-10-01. Completion date: 2002-09-30.
SHAWN NELSON (1975 PARKER MTN RD; small business) : $20,755 in 2 contractsin 2005
$11,980 with Navy for Medical and Surgical Instruments, Equipment, and Supplies. Signed on 2005-12-09. Completion date: 2005-11-01.
$8,775 with Navy for Maintenance, Repair and Rebuilding of Equipment -- Instruments and Laboratory Equipment. Signed on 2005-12-14. Completion date: 2006-09-30.
WHITE, JAMES C (1961 MARQUIS COURT; small business)
$13,992 with Navy for Maintenance, Repair or Alteration of Real Property -- Miscellaneous Buildings. Signed on 2002-06-26. Completion date: 2002-07-31.
TRIDENT TECHNICAL ENGINEERING (1179 SANTA OLIVIA RD; small business) : $12,587 in 2 contractsin 2006
$8,537 with Navy for Filters and Networks. Signed on 2006-02-16. Completion date: 2006-03-06.
$4,050 with Navy for Miscellaneous Electrical and Electronic Components. Signed on 2006-02-21. Completion date: 2006-04-19.
MARTIN, PORT (1172 TRISTAN RIVER ROAD; small business)
$11,226 with Navy for Miscellaneous Items. Taking place in RI. Signed on 2005-08-16. Completion date: 2006-05-26.
Top industries in this zip code by the number of employees in 2005:
2005 - 2018 National Fire Incident Reporting System (NFIRS) incidents
According to the data from the years 2005 - 2018 the average number of fires per year is 17. The highest number of reported fire incidents - 37 took place in 2007, and the least - 1 in 2012. The data has a decreasing trend.
When looking into fire subcategories, the most incidents belonged to: Outside Fires (38.4%), and Structure Fires (35.5%).
Fire incident types reported to NFIRS in Zip Code 91913


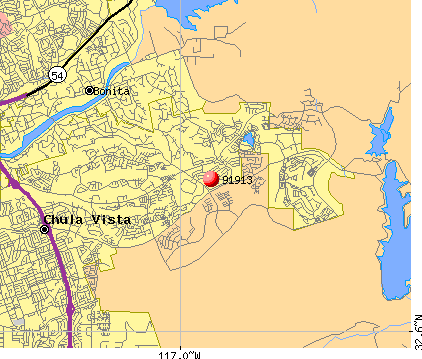 Nearest zip codes: 91915, 91902, 92154, 91914, 91911, 91910.


 According to the data from the years 2005 - 2018 the average number of fires per year is 17. The highest number of reported fire incidents - 37 took place in 2007, and the least - 1 in 2012. The data has a decreasing trend.
 When looking into fire subcategories, the most incidents belonged to: Outside Fires (38.4%), and Structure Fires (35.5%).