Estimated zip code population in 2022: 87,070 Zip code population in 2010: 82,999 Zip code population in 2000: 71,124
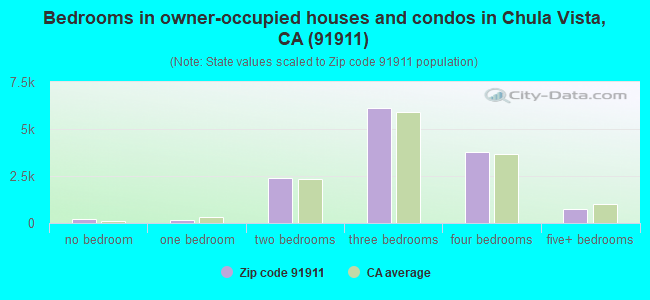
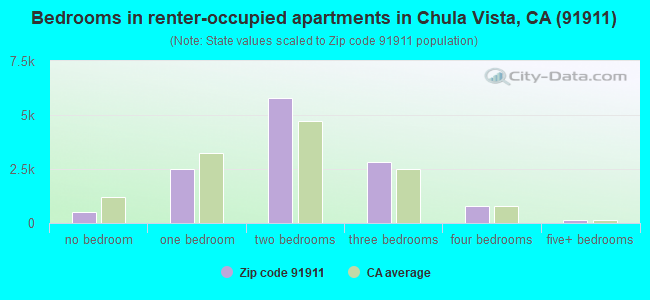
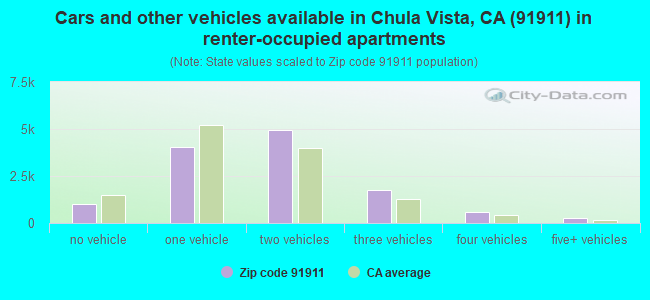
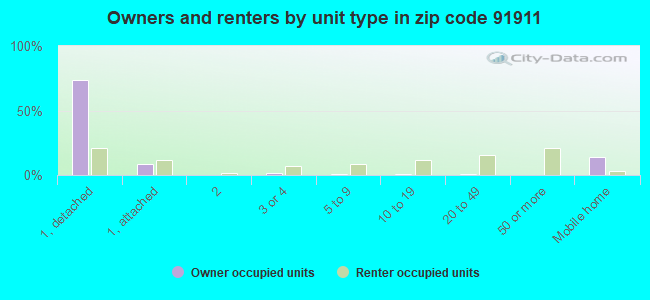
Houses and condos: 27,910 Renter-occupied apartments: 12,626
% of renters here:
49%
State:
44%
March 2022 cost of living index in zip code 91911: 122.3 (high, U.S. average is 100)
Land area: 11.7 sq. mi. Water area: 0.2 sq. mi.
Population density: 7,434 people per square mile
(high).
OSM Map
General Map
Google Map
MSN Map
OSM Map
General Map
Google Map
MSN Map
OSM Map
General Map
Google Map
MSN Map
OSM Map
General Map
Google Map
MSN Map
Please wait while loading the map...
Real estate property taxes paid for housing units in 2022:
This zip code:
0.6% ($3,490)
California:
0.7% ($4,831)
Median real estate property taxes paid for housing units with mortgages in 2022: $4,403 (0.7%) Median real estate property taxes paid for housing units with no mortgage in 2022: $1,800 (0.3%)
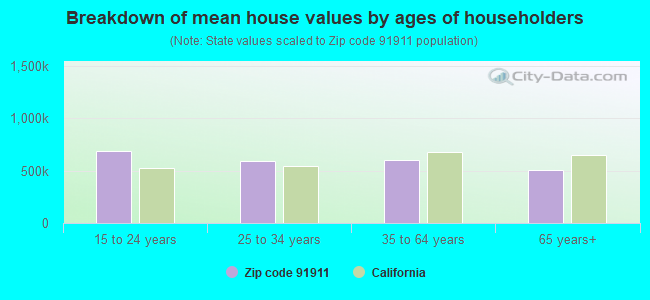
Estimated median house/condo value in 2022: $623,494
91911:
$623,494
California:
$715,900
According to our research of California and other state lists, there were 76 registered sex offenders living in 91911 zip code as of April 27, 2024. The ratio of all residents to sex offenders in zip code 91911 is 1,124 to 1. The ratio of registered sex offenders to all residents in this zip code is lower than the state average.
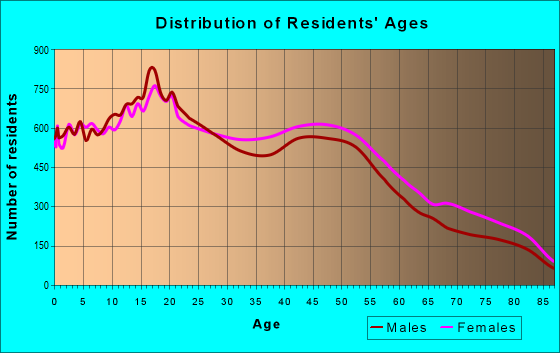
Median resident age:
This zip code:
36.0 years
California median age:
37.9 years
Average household size:
This zip code:
3.3 people
California:
2.8 people
Averages for the 2020 tax year for zip code 91911, filed in 2021:
Average Adjusted Gross Income (AGI) in 2020: $47,728 (Individual Income Tax Returns)
Here:
$47,728
State:
$95,910
Salary/wage: $44,385 (reported on 83.9% of returns)
Here:
$44,385
State:
$77,331
(% of AGI for various income ranges: 1151.5% for AGIs below $25k, 3687.7% for AGIs $25k-50k, 7008.7% for AGIs $50k-75k, 10581.2% for AGIs $75k-100k, 19228.0% for AGIs $100k-200k, 75765.4% for AGIs over 200k)
Taxable interest for individuals: $458 (reported on 21.3% of returns)
This zip code:
$458
California:
$2,294
(% of AGI for various income ranges: 4.6% for AGIs below $25k, 5.8% for AGIs $25k-50k, 15.1% for AGIs $50k-75k, 22.0% for AGIs $75k-100k, 62.3% for AGIs $100k-200k, 399.2% for AGIs over 200k)
Ordinary dividends: $2,135 (reported on 5.9% of returns)
Here:
$2,135
State:
$10,949
(% of AGI for various income ranges: 5.0% for AGIs below $25k, 6.4% for AGIs $25k-50k, 16.9% for AGIs $50k-75k, 25.4% for AGIs $75k-100k, 74.9% for AGIs $100k-200k, 952.3% for AGIs over 200k)
Net capital gain/loss in AGI: +$7,633 (reported on 6.1% of returns)
Here:
+$7,633
State:
+$49,306
(% of AGI for various income ranges: 2.2% for AGIs below $25k, 5.7% for AGIs $25k-50k, 22.6% for AGIs $50k-75k, 29.5% for AGIs $75k-100k, 213.5% for AGIs $100k-200k, 10290.0% for AGIs over 200k)
Profit/loss from business: +$7,594 (reported on 15.2% of returns)
Here:
+$7,594
State:
+$15,671
(% of AGI for various income ranges: 161.7% for AGIs below $25k, 128.1% for AGIs $25k-50k, 148.6% for AGIs $50k-75k, 120.2% for AGIs $75k-100k, 252.5% for AGIs $100k-200k, 2453.1% for AGIs over 200k)
Taxable individual retirement arrangement distribution: $13,704 (reported on 3.2% of returns)
91911:
$13,704
California:
$23,505
(% of AGI for various income ranges: 15.7% for AGIs below $25k, 23.6% for AGIs $25k-50k, 53.5% for AGIs $50k-75k, 116.1% for AGIs $75k-100k, 322.9% for AGIs $100k-200k, 1730.0% for AGIs over 200k)
Self-employed (Keogh) retirement plans: $16,850 (reported on 0.0% of returns)
91911:
$16,850
California:
$30,163
(% of AGI for various income ranges: 3.1% for AGIs $25k-50k)
Total itemized deductions: $28,902 (reported on 7.9% of returns)
Here:
$28,902
State:
$39,517
(% of AGI for various income ranges: 35.5% for AGIs below $25k, 88.3% for AGIs $25k-50k, 335.5% for AGIs $50k-75k, 754.9% for AGIs $75k-100k, 1876.9% for AGIs $100k-200k, 8516.9% for AGIs over 200k)
Charity contributions: $4,661 (reported on 6.0% of returns)
Here:
$4,661
State:
$12,598
(% of AGI for various income ranges: 1.9% for AGIs below $25k, 7.9% for AGIs $25k-50k, 32.5% for AGIs $50k-75k, 75.5% for AGIs $75k-100k, 255.0% for AGIs $100k-200k, 1713.1% for AGIs over 200k)
Taxes paid: $8,081 (reported on 7.9% of returns)
91911:
$8,081
State:
$8,807
(% of AGI for various income ranges: 7.1% for AGIs below $25k, 19.2% for AGIs $25k-50k, 86.9% for AGIs $50k-75k, 228.5% for AGIs $75k-100k, 569.6% for AGIs $100k-200k, 2170.8% for AGIs over 200k)
Earned income credit: $2,175 (reported on 21.9% of returns)
Here:
$2,175
State:
$2,074
(% of AGI for various income ranges: 109.2% for AGIs below $25k, 79.5% for AGIs $25k-50k, 1.8% for AGIs $50k-75k)
Percentage of individuals using paid preparers for their 2020 taxes: 92.8%
Here:
93%
State:
92%
(% for various income ranges: 91.8% for AGIs below $25k, 93.6% for AGIs $25k-50k, 93.0% for AGIs $50k-75k, 92.8% for AGIs $75k-100k, 93.6% for AGIs $100k-200k, 94.4% for AGIs over 200k)
Averages for the 2012 tax year for zip code 91911, filed in 2013:
Average Adjusted Gross Income (AGI) in 2012: $39,516 (Individual Income Tax Returns)
Here:
$39,516
State:
$72,726
Salary/wage: $37,247 (reported on 85.3% of returns)
Here:
$37,247
State:
$59,079
(% of AGI for various income ranges: 74.9% for AGIs below $25k, 84.8% for AGIs $25k-50k, 82.3% for AGIs $50k-75k, 80.8% for AGIs $75k-100k, 81.6% for AGIs $100k-200k, 55.2% for AGIs over 200k)
Taxable interest for individuals: $538 (reported on 22.0% of returns)
This zip code:
$538
California:
$2,146
(% of AGI for various income ranges: 0.3% for AGIs below $25k, 0.2% for AGIs $25k-50k, 0.3% for AGIs $50k-75k, 0.4% for AGIs $75k-100k, 0.3% for AGIs $100k-200k, 0.6% for AGIs over 200k)
Ordinary dividends: $1,992 (reported on 6.4% of returns)
Here:
$1,992
State:
$9,308
(% of AGI for various income ranges: 0.4% for AGIs below $25k, 0.2% for AGIs $25k-50k, 0.2% for AGIs $50k-75k, 0.3% for AGIs $75k-100k, 0.4% for AGIs $100k-200k, 0.7% for AGIs over 200k)
Net capital gain/loss in AGI: +$3,982 (reported on 4.8% of returns)
Here:
+$3,982
State:
+$30,460
(% of AGI for various income ranges: 0.1% for AGIs $50k-75k, 0.2% for AGIs $75k-100k, 0.7% for AGIs $100k-200k, 7.5% for AGIs over 200k)
Profit/loss from business: +$9,659 (reported on 13.5% of returns)
Here:
+$9,659
State:
+$17,064
(% of AGI for various income ranges: 10.6% for AGIs below $25k, 3.1% for AGIs $25k-50k, 1.8% for AGIs $50k-75k, 1.1% for AGIs $75k-100k, 1.2% for AGIs $100k-200k, 2.8% for AGIs over 200k)
Taxable individual retirement arrangement distribution: $10,355 (reported on 4.4% of returns)
91911:
$10,355
California:
$19,557
(% of AGI for various income ranges: 1.0% for AGIs below $25k, 0.8% for AGIs $25k-50k, 1.2% for AGIs $50k-75k, 1.3% for AGIs $75k-100k, 1.4% for AGIs $100k-200k, 1.5% for AGIs over 200k)
Self-employment retirement plans: $13,567 (reported on 0.1% of returns)
91911:
$13,567
California:
$24,530
Total itemized deductions: $22,460 (28% of AGI, reported on 22.3% of returns)
Here:
$22,460
State:
$34,004
Here:
28.4% of AGI
State:
22.7% of AGI
(% of AGI for various income ranges: 5.4% for AGIs below $25k, 8.1% for AGIs $25k-50k, 13.3% for AGIs $50k-75k, 16.5% for AGIs $75k-100k, 19.7% for AGIs $100k-200k, 16.6% for AGIs over 200k)
Charity contributions: $2,402 (reported on 16.9% of returns)
Here:
$2,402
State:
$4,659
(% of AGI for various income ranges: 0.3% for AGIs below $25k, 0.6% for AGIs $25k-50k, 1.0% for AGIs $50k-75k, 1.5% for AGIs $75k-100k, 1.8% for AGIs $100k-200k, 1.4% for AGIs over 200k)
Taxes paid: $6,545 (reported on 22.2% of returns)
91911:
$6,545
State:
$14,448
(% of AGI for various income ranges: 1.1% for AGIs below $25k, 1.7% for AGIs $25k-50k, 3.4% for AGIs $50k-75k, 4.7% for AGIs $75k-100k, 6.8% for AGIs $100k-200k, 8.1% for AGIs over 200k)
Earned income credit: $2,414 (reported on 28.7% of returns)
Here:
$2,414
State:
$2,286
(% of AGI for various income ranges: 8.6% for AGIs below $25k, 1.8% for AGIs $25k-50k)
Percentage of individuals using paid preparers for their 2012 taxes: 68.8%
Here:
69%
State:
64%
(% for various income ranges: 67.8% for AGIs below $25k, 69.2% for AGIs $25k-50k, 70.0% for AGIs $50k-75k, 71.6% for AGIs $75k-100k, 68.9% for AGIs $100k-200k, 72.2% for AGIs over 200k)
Averages for the 2004 tax year for zip code 91911, filed in 2005:
Average Adjusted Gross Income (AGI) in 2004: $34,458 (Individual Income Tax Returns)
Here:
$34,458
State:
$58,600
Salary/wage: $33,068 (reported on 86.5% of returns)
Here:
$33,068
State:
$49,455
(% of AGI for various income ranges: 92.2% for AGIs below $10k, 81.4% for AGIs $10k-25k, 86.2% for AGIs $25k-50k, 84.3% for AGIs $50k-75k, 84.2% for AGIs $75k-100k, 74.1% for AGIs over 100k)
Taxable interest for individuals: $801 (reported on 32.1% of returns)
This zip code:
$801
California:
$2,365
(% of AGI for various income ranges: 1.9% for AGIs below $10k, 0.8% for AGIs $10k-25k, 0.6% for AGIs $25k-50k, 0.6% for AGIs $50k-75k, 0.7% for AGIs $75k-100k, 0.9% for AGIs over 100k)
Taxable dividends: $1,605 (reported on 9.3% of returns)
Here:
$1,605
State:
$4,746
(% of AGI for various income ranges: 1.3% for AGIs below $10k, 0.4% for AGIs $10k-25k, 0.3% for AGIs $25k-50k, 0.4% for AGIs $50k-75k, 0.4% for AGIs $75k-100k, 0.7% for AGIs over 100k)
Net capital gain/loss: +$5,782 (reported on 7.1% of returns)
Here:
+$5,782
State:
+$23,418
(% of AGI for various income ranges: -0.5% for AGIs below $10k, -0.0% for AGIs $10k-25k, 0.2% for AGIs $25k-50k, 0.5% for AGIs $50k-75k, 0.6% for AGIs $75k-100k, 6.1% for AGIs over 100k)
Profit/loss from business: +$8,925 (reported on 12.0% of returns)
Here:
+$8,925
State:
+$16,826
(% of AGI for various income ranges: 8.4% for AGIs below $10k, 5.7% for AGIs $10k-25k, 2.8% for AGIs $25k-50k, 1.8% for AGIs $50k-75k, 2.3% for AGIs $75k-100k, 3.0% for AGIs over 100k)
IRA payment deduction: $2,453 (reported on 1.4% of returns)
91911:
$2,453
California:
$3,192
(% of AGI for various income ranges: 0.1% for AGIs below $10k, 0.1% for AGIs $10k-25k, 0.1% for AGIs $25k-50k, 0.1% for AGIs $50k-75k, 0.1% for AGIs $75k-100k, 0.1% for AGIs over 100k)
Self-employed pension: $9,604 (reported on 0.2% of returns)
Here:
$9,604
California:
$17,688
Total itemized deductions: $23,977 (38% of AGI, reported on 26.2% of returns)
Here:
$23,977
State:
$28,113
Here:
37.6% of AGI
State:
25.3% of AGI
(% of AGI for various income ranges: 8.5% for AGIs below $10k, 7.2% for AGIs $10k-25k, 12.8% for AGIs $25k-50k, 28.9% for AGIs $50k-75k, 23.8% for AGIs $75k-100k, 21.3% for AGIs over 100k)
Charity contributions deductions: $2,216 (3% of AGI, reported on 21.8% of returns)
Here:
$2,216
State:
$3,923
Here:
3.3% of AGI
State:
3.3% of AGI
(% of AGI for various income ranges: 0.4% for AGIs below $10k, 0.5% for AGIs $10k-25k, 1.0% for AGIs $25k-50k, 1.6% for AGIs $50k-75k, 2.2% for AGIs $75k-100k, 2.4% for AGIs over 100k)
Total tax: $3,547 (reported on 68.6% of returns)
91911:
$3,547
State:
$10,761
(% of AGI for various income ranges: 3.1% for AGIs below $10k, 3.6% for AGIs $10k-25k, 5.3% for AGIs $25k-50k, 7.0% for AGIs $50k-75k, 8.5% for AGIs $75k-100k, 13.6% for AGIs over 100k)
Earned income credit: $1,809 (reported on 23.0% of returns)
Here:
$1,809
State:
$1,763
Percentage of individuals using paid preparers for their 2004 taxes: 72.4%
Here:
72%
State:
66%
(% for various income ranges: 67.2% for AGIs below $10k, 74.0% for AGIs $10k-25k, 73.7% for AGIs $25k-50k, 73.8% for AGIs $50k-75k, 70.1% for AGIs $75k-100k, 71.7% for AGIs over 100k)
Likely homosexual households (counted as self-reported same-sex unmarried-partner households)
Lesbian couples: 0.1% of all households
Gay men: 0.0% of all households
Household received Food Stamps/SNAP in the past 12 months: 4,487 Household did not receive Food Stamps/SNAP in the past 12 months: 21,750
Women who had a birth in the past 12 months: 1,991 (1,396 now married, 594 unmarried) Women who did not have a birth in the past 12 months: 19,939 (7,466 now married, 12,490 unmarried)
Housing units in zip code 91911 with a mortgage: 7,980 (660 second mortgage, 58 home equity loan, 517 both second mortgage and home equity loan) Houses without a mortgage: 34
Median monthly owner costs for units with a mortgage: $2,559 Median monthly owner costs for units without a mortgage: $499
Residents with income below the poverty level in 2022:
This zip code:
11.1%
Whole state:
12.2%
Residents with income below 50% of the poverty level in 2022:
This zip code:
7.4%
Whole state:
6.2%
Median number of rooms in houses and condos:
Here:
5.6
State:
6.0
Median number of rooms in apartments:
Here:
3.6
State:
3.9
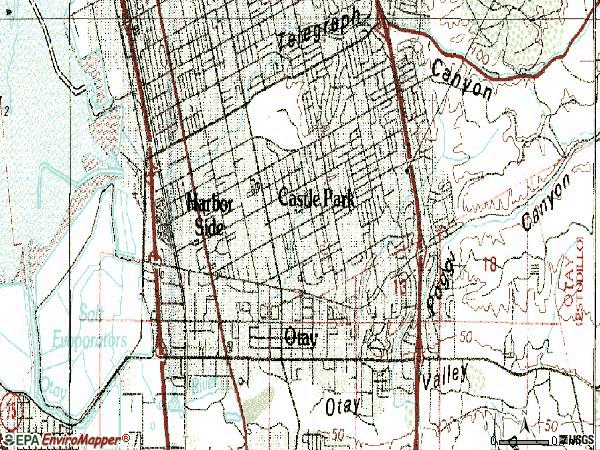
Notable locations in this zip code not listed on our city pages
Notable locations in zip code 91911: San Diego Country Club (A), Woodlawn Park Branch Chula Vista Public Library (B), Castle Park-Otay Branch Chula Vista Public Library (C), Chula Vista Fire Department Station 5 (D), Chula Vista Fire Department Station 3 (E), Chula Vista Fire Department Station 9 (F), Saint Pius X Catholic Church Religious Education Office (G), International Christian Center (H). Display/hide their locations on the map
Shopping Centers: Price Bazaar Shopping Center (1), Oxford Shopping Center (2), Genesis Square Shopping Center (3), Florence Shopping Center (4), Country Club Square Shopping Center (5), Country Club Shopping Center (6). Display/hide their locations on the map
Churches in zip code 91911 include: First Methodist Church (A), Life Christian Center (B), International Light Church (C), Iglesia Universal del Reino de Dios (D), Iglesia de Cristo de Chula Vista (E), Templo Ebenezer (F), Templo De Alabanza (G), Spanish Faith Center (H), South Bay Baptist Church (I). Display/hide their locations on the map
Parks in zip code 91911 include: Lauderbach Park (1), Los Ninos Park (2), Otay Park (3), Palomar Park (4), Sunbow Park (5), Valle Lindo Park (6), Loma Verde Park (7), Rogers Park (8). Display/hide their locations on the map
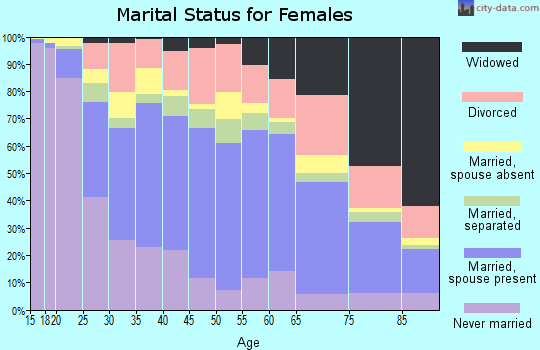
10,954 married couples with children.
4,917 single-parent households (1,190 men, 3,727 women).
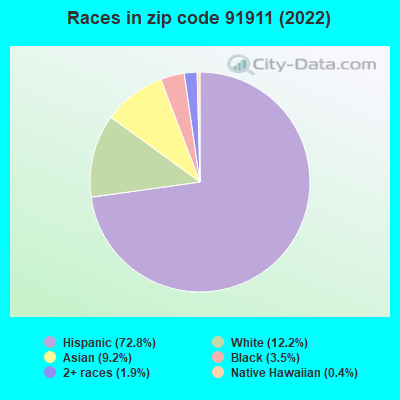
35.6% of residents of 91911 zip code speak English at home.
57.4% of residents speak Spanish at home (62% very well, 19% well, 15% not well, 4% not at all).
0.6% of residents speak other Indo-European language at home (88% very well, 10% well, 3% not well).
6.3% of residents speak Asian or Pacific Island language at home (78% very well, 12% well, 7% not well, 3% not at all).
0.2% of residents speak other language at home (81% very well, 19% well).
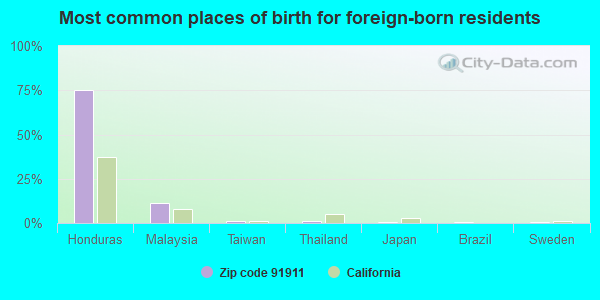
Foreign born population: 27,865 (32.0%) (50.0% of them are naturalized citizens)
Major facilities with environmental interests located in this zip code:
FORMER DARLING INTL OMAR RENDERING SITE (4826 AUTO PARK DR in CHULA VISTA, CA)
STATE MASTER (California - Hazardous Waste Tracking) - HAZARDOU WASTE PROGRAM Large Quantity Generators, more that 1000 kg of hazardous waste/month (Resource Conservation and Recovery Act (tracking hazardous waste)) Business NAICS classification: RENDERING AND MEAT BYPRODUCT PROCESSING. Organizations: OTAY MESA VENTURES II LLC (CONTACT/OPERATOR)
, KNOWLTON REALTY ADVISORS LLC (CONTACT/OWNER)
ANTEON CORPORATION (1675 BRANDYWINE STE A in CHULA VISTA, CA)
STATE MASTER (California - Hazardous Waste Tracking) - HAZARDOU WASTE PROGRAM Conditionally Exempt Small Quantity Generators, less than 100 kg/month of hazardous waste (Resource Conservation and Recovery Act (tracking hazardous waste)) - notification TRANSPORTER (Resource Conservation and Recovery Act (tracking hazardous waste)) - notification
C & V AUTOMOTIVE (1131 BROADWAY in CHULA VISTA, CA)
Small Quantity Generators, between 100 kg and 1000 kg of hazardous waste/month (Resource Conservation and Recovery Act (tracking hazardous waste)) - notification STATE MASTER (California - Used Oil Recycling System ) - USED OIL RECYCLING Organizations: CHARLES C VAZQUEZ (CONTACT/OWNER)
Alternative names: C&V MOTORS
FULLER FORD HONDA (560 AUTO PARK DR in CHULA VISTA, CA)
STATE MASTER (California - Hazardous Waste Tracking) - HAZARDOU WASTE PROGRAM CRITERIA AND HAZARDOUS AIR POLLUTANT INVENTORY (Inventory of air pollution sources) Small Quantity Generators, between 100 kg and 1000 kg of hazardous waste/month (Resource Conservation and Recovery Act (tracking hazardous waste)) - notification Business SIC classification: TOP, BODY, AND UPHOLSTERY REPAIR SHOPS AND PAINT SHOPS Organizations: DOUGLAS FULLER (CONTACT/OWNER)
GCE INDUSTRIES INC (1891 NIRVANA AVE in CHULA VISTA, CA)
Large Quantity Generators, more that 1000 kg of hazardous waste/month (Resource Conservation and Recovery Act (tracking hazardous waste)) Large Quantity Generators, more that 1000 kg of hazardous waste/month (Resource Conservation and Recovery Act (tracking hazardous waste)) Organizations: D. PALUMBO, C. SUTHERLAND (CONTACT/OWNER)
, FASTENTECH INC (CONTACT/OWNER)
CHEVRON STATION NO 209663 (695 E PALOMAR ST in CHULA VISTA, CA)
STATE MASTER (California - Hazardous Waste Tracking) - HAZARDOU WASTE PROGRAM Small Quantity Generators, between 100 kg and 1000 kg of hazardous waste/month (Resource Conservation and Recovery Act (tracking hazardous waste)) - notification Organizations: CHEVRON PRODUCTS CO (CONTACT/OWNER)
NYPRO SAN DIEGO INC (505 OTAY VALLEY RD in CHULA VISTA, CA)
STATE MASTER (California - Hazardous Waste Tracking) - HAZARDOU WASTE PROGRAM Small Quantity Generators, between 100 kg and 1000 kg of hazardous waste/month (Resource Conservation and Recovery Act (tracking hazardous waste)) - notification
F T C (1165 WALNUT AVE in CHULA VISTA, CA)
STATE MASTER (California - Hazardous Waste Tracking) - HAZARDOU WASTE PROGRAM Small Quantity Generators, between 100 kg and 1000 kg of hazardous waste/month (Resource Conservation and Recovery Act (tracking hazardous waste)) - notification Organizations: MAX FRIEDHEIM (CONTACT/OWNER)
FUEL SYSTEM PARTS (1403 BROADWAY UNIT 110 in CHULA VISTA, CA)
STATE MASTER (California - Hazardous Waste Tracking) - HAZARDOU WASTE PROGRAM Small Quantity Generators, between 100 kg and 1000 kg of hazardous waste/month (Resource Conservation and Recovery Act (tracking hazardous waste)) - notification Organizations: GABRIEL H VELAZQUEZ (CONTACT/OWNER)
KELLOGG (KARL H.) ELEMENTARY (229 E. NAPLES ST. in CHULA VISTA, CA)
(National Center for Education Statistics) - STATE ID-6037923 Organizations: CHULA VISTA ELEMENTARY (SCHOOL DISTRICT)
CASTLE PARK SENIOR HIGH (1395 HILLTOP DR. in CHULA VISTA, CA)
(National Center for Education Statistics) - STATE ID-3730801 Organizations: SWEETWATER UNION HIGH (SCHOOL DISTRICT)
HARBORSIDE ELEMENTARY (681 NAPLES ST. in CHULA VISTA, CA)
(National Center for Education Statistics) - STATE ID-6037873 Organizations: CHULA VISTA ELEMENTARY (SCHOOL DISTRICT)
ALLEN GAS / CHEVRON (3205 MAIN ST in CHULA VISTA, CA)
CRITERIA AND HAZARDOUS AIR POLLUTANT INVENTORY (Inventory of air pollution sources) STATE MASTER (California - Used Oil Recycling System ) - USED OIL RECYCLING Business SIC classification: GASOLINE SERVICE STATIONS Alternative names: ALLEN GAS AND TRUCK STOP
Housing units lacking complete plumbing facilities: 0.7% Housing units lacking complete kitchen facilities: 3.4%
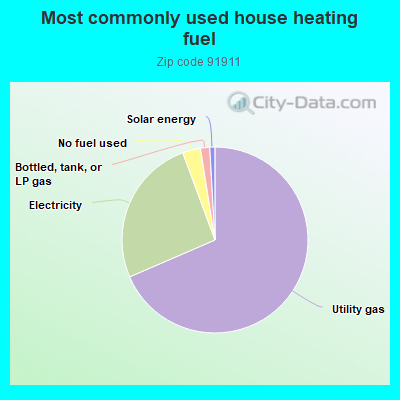
68.3%Utility gas
25.8%Electricity
3.1%No fuel used
1.6%Bottled, tank, or LP gas
0.9%Solar energy
Population in 1990: 65,952. Population change in the 1990s: +5,172 (+7.8%).
Place of birth for U.S.-born residents:
This state: 48,504
Northeast: 1,735
Midwest: 2,665
South: 2,114
West: 2,215
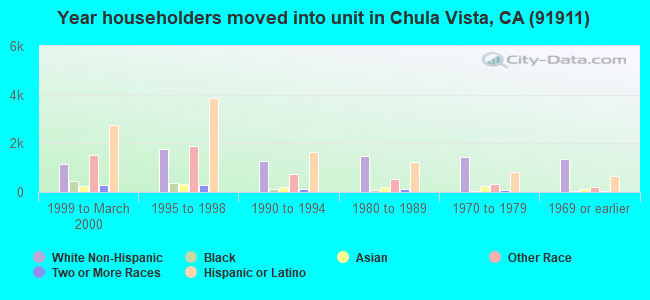
55% of the 91911 zip code residents lived in the same house 5 years ago. Out of people who lived in different houses, 80% lived in this county. Out of people who lived in different counties, 50% lived in California.
93% of the 91911 zip code residents lived in the same house 1 year ago. Out of people who lived in different houses, 79% moved from this county. Out of people who lived in different houses, 9% moved from different county within same state. Out of people who lived in different houses, 7% moved from different state. Out of people who lived in different houses, 6% moved from abroad.
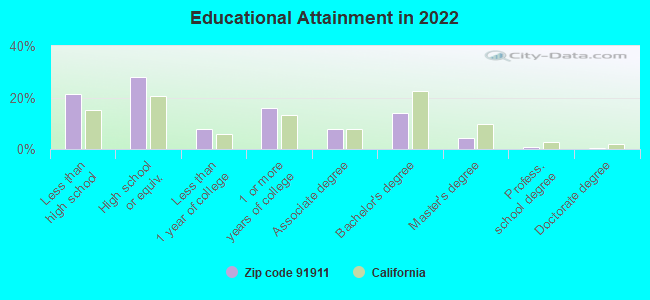
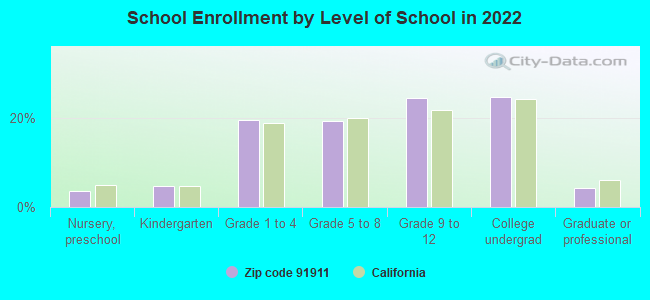
Private vs. public school enrollment:
Students in private schools in grades 1 to 8 (elementary and middle school): 381
Here:
4.4%
California:
10.5%
Students in private schools in grades 9 to 12 (high school): 401
Here:
7.3%
California:
8.5%
Students in private undergraduate colleges: 467
Here:
8.5%
California:
15.9%
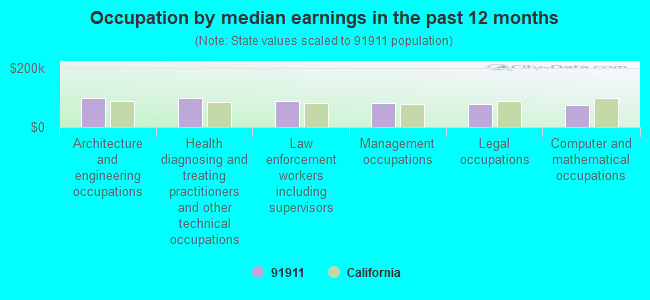
Occupation by median earnings in the past 12 months ($)
98,766Architecture and engineering occupations
98,364Health diagnosing and treating practitioners and other technical occupations
86,136Law enforcement workers including supervisors
82,156Management occupations
76,450Legal occupations
73,579Computer and mathematical occupations
Companies with biggest federal contracts located in this zip code (CHULA VISTA, CA):
RAYTHEON TECHNICAL SERVICE CO (1650 INDUSTRIAL BLVD) : $50,944,553 in 309 contractsfrom 1999 to 2006
Contracts for Miscellaneous Communication Equipment, Antennas, Waveguides, and Related Equipment, Radar Equipment, Except Airborne, Filters and Networks, and moreby Air Force, Navy, Army, Defense Logistics Agency, and others Signed by year:2000: $8,408,919; 2001: $17,082,950; 2002: $5,104,138; 2003: $7,930,286; 2004: $7,554,841; 2005: $1,246,216; 2006: $2,351,879.
Biggest contracts:
$3,930,015 with Air Force for Miscellaneous Communication Equipment. Signed on 2004-06-16. Completion date: 2005-06-30.
$3,583,494 with Air Force for Antennas, Waveguides, and Related Equipment. Signed on 2003-09-12. Completion date: 2004-07-16.
$2,383,220 with Air Force for Radar Equipment, Except Airborne. Signed on 2001-09-28. Completion date: 2002-10-31.
$1,927,260 with Air Force for Filters and Networks. Signed on 2000-09-28. Completion date: 2002-12-31.
NIRVANA PRODUCE DISTRIBUTOR, I (1872 NIRVANA AVE; small business) : $5,761,543 in 527 contractsfrom 2001 to 2006
Contracts for Non-Food Items For Resale, Fruits and Vegetables by Defense Commissary Agency, Defense Logistics Agency Signed by year:2000: $0; 2001: $277,817; 2002: $79,739; 2003: $38,628; 2004: $431,428; 2005: $2,080,248; 2006: $2,853,683.
Biggest contracts:
$402,494 with Defense Commissary Agency for Non-Food Items For Resale. Signed on 2006-01-01. Completion date: 2006-03-31.
$98,266, same as above.Signed on 2005-10-01. Completion date: 2005-12-31.
$70,665 with Defense Logistics Agency for Fruits and Vegetables. Signed on 2006-06-03. Completion date: 2006-06-03.
$67,496, same as above.Signed on 2006-05-20. Completion date: 2006-05-20.
T R PRODUCE INC (684 ANITA ST STE E; small business) : $4,121,148 in 487 contractsfrom 2000 to 2006
Contracts for Fruits and Vegetables by Defense Logistics Agency Signed by year:2000: $25,584; 2001: $0; 2002: $0; 2003: $25,465; 2004: $1,098,584; 2005: $2,483,041; 2006: $488,474.
Biggest contracts:
$36,825 with Defense Logistics Agency for Fruits and Vegetables. Signed on 2004-11-27. Completion date: 2004-11-27.
$30,083, same as above.Signed on 2004-12-08. Completion date: 2004-12-08.
$26,743, same as above.Signed on 2004-09-14. Completion date: 2004-09-14.
$26,433, same as above.Signed on 2004-11-30. Completion date: 2004-11-30.
NOVA ELECTRIC INC (2471 MAIN STREET, UNIT 17; small business) : $3,045,784 in 10 contractsfrom 1999 to 2006
Contracts for Maintenance, Repair or Alteration of Real Property -- Airport Runways, Construction of Structures and Facilities -- Other Airfield Structures, Maintenance, Repair or Alteration of Real Property -- Other Airfield Structures, Maintenance, Repair and Rebuilding of Equipment -- Aircraft Components and Accessories by Navy, Air Force, U.S. Coast Guard Signed by year:2000: -$103,464; 2001: $691,000; 2002: $363,937; 2003: $0; 2004: $0; 2005: $0; 2006: $2,080,833.
Biggest contracts:
$2,074,833 with Navy for Maintenance, Repair or Alteration of Real Property -- Airport Runways. Signed on 2006-03-30. Completion date: 2007-01-16.
$610,000 with Air Force for Construction of Structures and Facilities -- Other Airfield Structures. Taking place in NV. Signed on 2001-08-14. Completion date: 2002-03-21.
$343,000 with Air Force for Maintenance, Repair or Alteration of Real Property -- Other Airfield Structures. Taking place in GA. Signed on 2002-09-30. Completion date: 2003-07-03.
$81,000 with Navy for Maintenance, Repair or Alteration of Real Property -- Airport Runways. Signed on 2001-02-28. Completion date: 2001-07-13.
DRESSER-RAND COMPANY (1675 BRANDYWINE AVE , SUIT) : $1,571,463 in 26 contractsfrom 2000 to 2006
Contracts for Packing and Gasket Materials, Technical Representation Services -- Refrigeration, Air Conditioning, and Air Circulating Equipment, Compressors and Vacuum Pumps, Driers, Dehydrators, and Anhydrators, and moreby Navy Signed by year:2000: $413,504; 2001: $598,809; 2002: $228,423; 2003: $0; 2004: $2,780; 2005: $138,006; 2006: $189,941.
Biggest contracts:
$551,084 with Navy for Packing and Gasket Materials. Signed on 2001-09-14. Completion date: 2001-11-15.
$183,395 with Navy for Technical Representation Services -- Refrigeration, Air Conditioning, and Air Circulating Equipment. Signed on 2002-01-28. Completion date: 2002-09-30.
$104,200 with Navy for Compressors and Vacuum Pumps. Signed on 2000-04-10. Completion date: 2000-07-30.
$99,000 with Navy for Driers, Dehydrators, and Anhydrators. Signed on 2006-02-28. Completion date: 2006-11-04.
PREMIER PRODUCE COMPANY INC (698 ANITA ST; small business) : $964,596 in 221 contractsfrom 2004 to 2006
Contracts for Fruits and Vegetables by Defense Logistics Agency Signed by year:2000: $0; 2001: $0; 2002: $0; 2003: $0; 2004: $29,382; 2005: $527,035; 2006: $408,179.
Biggest contracts:
$19,375 with Defense Logistics Agency for Fruits and Vegetables. Signed on 2006-06-13. Completion date: 2006-06-13.
$13,169, same as above.Signed on 2005-05-12. Completion date: 2005-05-12.
$12,136, same as above.Signed on 2005-06-25. Completion date: 2005-06-25.
$12,071, same as above.Signed on 2005-02-08. Completion date: 2005-02-08.
EBERT COMPOSITES CORPORATION (651 ANITA ST STE B8; small business) : $767,000 in 6 contractsfrom 2000 to 2001
Contracts for Other Defense -- Management and Support (R&D), Other Research and Development -- Applied Research and Exploratory Development (R&D), Technical Assistance by Navy, Research and Innovative Technology Administration Signed by year:2000: $159,000; 2001: $608,000; 2002: $0; 2003: $0; 2004: $0; 2005: $0; 2006: $0.
Biggest contracts:
$300,000 with Navy for Other Defense -- Management and Support (R&D). Signed on 2001-11-14. Completion date: 2002-10-29.
$150,000, same as above.Signed on 2001-02-26. Completion date: 2002-09-29.
$99,000 with Research and Innovative Technology Administration for Other Research and Development -- Applied Research and Exploratory Development (R&D). Signed on 2000-03-15. Completion date: 2001-03-15.
$90,000 with Navy for Other Defense -- Management and Support (R&D). Signed on 2001-09-14. Completion date: 2002-09-29.
BROTHERS MARKET INC (1872 NIRVANA AVE; small business) : $426,888 in 99 contractsfrom 2004 to 2005
Contracts for Fruits and Vegetables by Defense Logistics Agency Signed by year:2000: $0; 2001: $0; 2002: $0; 2003: $0; 2004: $113,355; 2005: $313,533; 2006: $0.
Biggest contracts:
$16,111 with Defense Logistics Agency for Fruits and Vegetables. Signed on 2005-09-14. Completion date: 2005-09-14.
$15,946, same as above.Signed on 2005-05-13. Completion date: 2005-05-13.
$10,259, same as above.Signed on 2005-06-24. Completion date: 2005-06-24.
$9,815, same as above.Signed on 2004-11-09. Completion date: 2004-11-09.
BARBEE VALVE & SUPPLY INC (751 DESIGN COURT, SUITE B; small business) : $423,055 in 22 contractsfrom 2001 to 2006
Contracts for Aircraft Maintenance and Repair Shop Specialized Equipment, Heat Exchangers and Steam Condensers, Miscellaneous Maintenance and Repair Shop Specialized Equipment, Combination and Miscellaneous Instruments, and moreby Air Force, Navy, Army, U.S. Army Corps of Engineers - civil program financing only, and others Signed by year:2000: $0; 2001: $169,750; 2002: $108,863; 2003: $63,296; 2004: $10,494; 2005: $62,777; 2006: $7,875.
Biggest contracts:
$169,750 with Air Force for Aircraft Maintenance and Repair Shop Specialized Equipment. Signed on 2001-11-30. Completion date: 2002-04-30.
$34,975 with Air Force for Heat Exchangers and Steam Condensers. Taking place in OK. Signed on 2002-11-15. Completion date: 2003-02-03.
$34,963 with Air Force for Miscellaneous Maintenance and Repair Shop Specialized Equipment. Signed on 2002-09-10. Completion date: 2002-12-06.
$26,750 with Navy for Miscellaneous Maintenance and Repair Shop Specialized Equipment. Signed on 2002-01-23. Completion date: 2002-05-23.
DUGAZO INC (815 3RD AVE STE 321; small business) : $412,025 in 5 contractsfrom 2001 to 2003
Contracts for Guard Services, Snow Removal/Salt Service (also spreading aggregate or other snow melting material) by Navy Signed by year:2000: $0; 2001: $36,720; 2002: $220,320; 2003: $154,985; 2004: $0; 2005: $0; 2006: $0.
Biggest contracts:
$154,985 with Navy for Guard Services. Signed on 2003-07-10. Completion date: 2004-07-15.
$146,880 with Navy for Snow Removal/Salt Service (also spreading aggregate or other snow melting material). Signed on 2002-07-17. Completion date: 2003-07-16.
$36,720 with Navy for Guard Services. Signed on 2002-05-02. Completion date: 2002-07-15.
$36,720, same as above.Signed on 2002-01-16. Completion date: 2002-04-16.
Top industries in this zip code by the number of employees in 2005:
Health Care and Social Assistance: General Medical and Surgical Hospitals (over 1000 employees: 1 establishment)
2005 - 2018 National Fire Incident Reporting System (NFIRS) incidents
According to the data from the years 2005 - 2018 the average number of fires per year is 108. The highest number of reported fire incidents - 164 took place in 2017, and the least - 35 in 2012. The data has a decreasing trend.
When looking into fire subcategories, the most incidents belonged to: Outside Fires (41.8%), and Structure Fires (30.1%).
Fire incident types reported to NFIRS in Zip Code 91911


 Nearest zip codes: 91910, 92173, 91902, 92154, 91913, 92139.
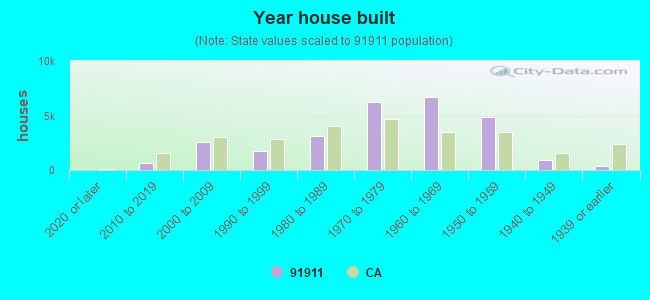


 According to the data from the years 2005 - 2018 the average number of fires per year is 108. The highest number of reported fire incidents - 164 took place in 2017, and the least - 35 in 2012. The data has a decreasing trend.
 When looking into fire subcategories, the most incidents belonged to: Outside Fires (41.8%), and Structure Fires (30.1%).