Estimated zip code population in 2022: 28,371 Zip code population in 2010: 29,429 Zip code population in 2000: 28,481
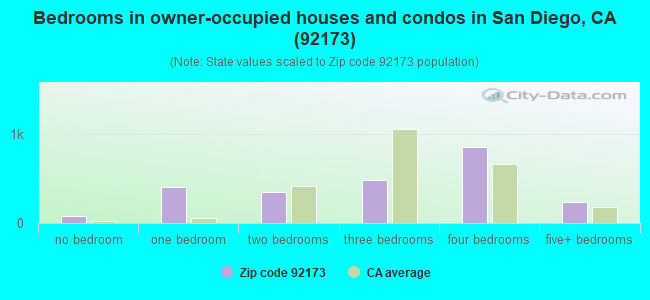
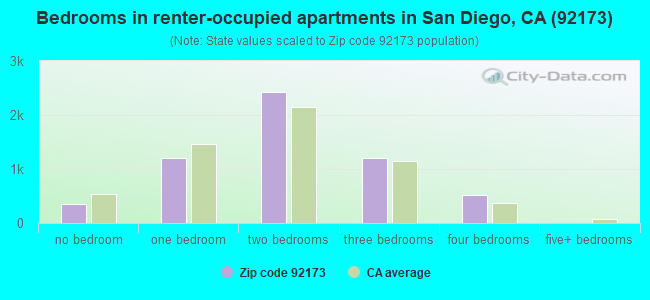
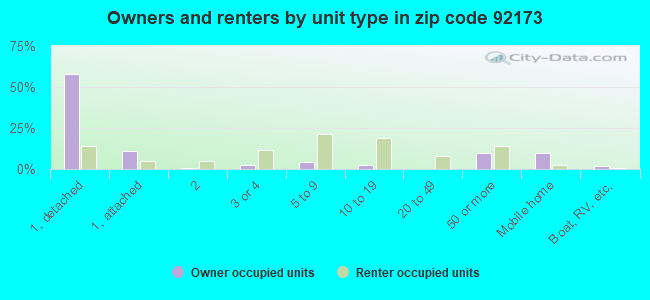
Houses and condos: 8,437 Renter-occupied apartments: 5,733
% of renters here:
71%
State:
44%
March 2022 cost of living index in zip code 92173: 122.1 (high, U.S. average is 100)
Land area: 5.1 sq. mi. Water area: 0.2 sq. mi.
Population density: 5,600 people per square mile
(average).
OSM Map
General Map
Google Map
MSN Map
OSM Map
General Map
Google Map
MSN Map
OSM Map
General Map
Google Map
MSN Map
OSM Map
General Map
Google Map
MSN Map
Please wait while loading the map...
Real estate property taxes paid for housing units in 2022:
This zip code:
0.7% ($3,461)
California:
0.7% ($4,831)
Median real estate property taxes paid for housing units with mortgages in 2022: $3,963 (0.7%) Median real estate property taxes paid for housing units with no mortgage in 2022: $1,798 (0.5%)
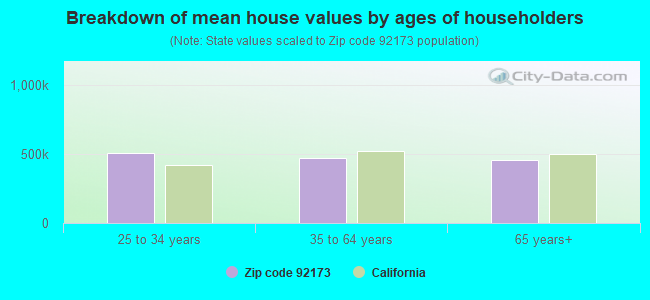
Estimated median house/condo value in 2022: $504,377
92173:
$504,377
California:
$715,900
According to our research of California and other state lists, there were 9 registered sex offenders living in 92173 zip code as of April 27, 2024. The ratio of all residents to sex offenders in zip code 92173 is 3,653 to 1. The ratio of registered sex offenders to all residents in this zip code is much lower than the state average.
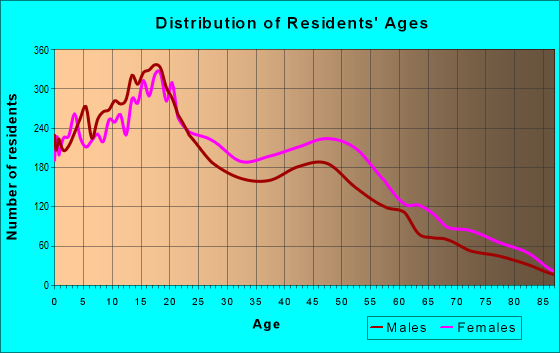
Median resident age:
This zip code:
34.8 years
California median age:
37.9 years
Average household size:
This zip code:
3.5 people
California:
2.8 people
Averages for the 2020 tax year for zip code 92173, filed in 2021:
Average Adjusted Gross Income (AGI) in 2020: $34,924 (Individual Income Tax Returns)
Here:
$34,924
State:
$95,910
Salary/wage: $32,590 (reported on 84.3% of returns)
Here:
$32,590
State:
$77,331
(% of AGI for various income ranges: 1174.7% for AGIs below $25k, 3736.1% for AGIs $25k-50k, 7168.4% for AGIs $50k-75k, 10336.0% for AGIs $75k-100k, 17024.3% for AGIs $100k-200k)
Taxable interest for individuals: $454 (reported on 9.9% of returns)
This zip code:
$454
California:
$2,294
(% of AGI for various income ranges: 2.9% for AGIs below $25k, 4.9% for AGIs $25k-50k, 5.5% for AGIs $50k-75k, 15.5% for AGIs $75k-100k, 24.9% for AGIs $100k-200k)
Ordinary dividends: $3,776 (reported on 2.1% of returns)
Here:
$3,776
State:
$10,949
(% of AGI for various income ranges: 2.6% for AGIs below $25k, 4.6% for AGIs $25k-50k, 8.6% for AGIs $50k-75k, 35.7% for AGIs $75k-100k, 64.3% for AGIs $100k-200k)
Net capital gain/loss in AGI: +$16,428 (reported on 2.6% of returns)
Here:
+$16,428
State:
+$49,306
(% of AGI for various income ranges: 1.2% for AGIs below $25k, 6.7% for AGIs $25k-50k, 17.4% for AGIs $50k-75k, 64.2% for AGIs $75k-100k, 272.5% for AGIs $100k-200k)
Profit/loss from business: +$7,434 (reported on 15.1% of returns)
Here:
+$7,434
State:
+$15,671
(% of AGI for various income ranges: 188.7% for AGIs below $25k, 97.3% for AGIs $25k-50k, 146.3% for AGIs $50k-75k, 211.7% for AGIs $75k-100k, 253.0% for AGIs $100k-200k)
Taxable individual retirement arrangement distribution: $12,678 (reported on 1.3% of returns)
92173:
$12,678
California:
$23,505
(% of AGI for various income ranges: 7.3% for AGIs below $25k, 11.1% for AGIs $25k-50k, 27.7% for AGIs $50k-75k, 64.6% for AGIs $75k-100k, 341.1% for AGIs $100k-200k)
Total itemized deductions: $27,698 (reported on 1.9% of returns)
Here:
$27,698
State:
$39,517
(% of AGI for various income ranges: 8.9% for AGIs below $25k, 34.8% for AGIs $25k-50k, 140.6% for AGIs $50k-75k, 305.9% for AGIs $75k-100k, 948.5% for AGIs $100k-200k)
Charity contributions: $5,367 (reported on 1.3% of returns)
Here:
$5,367
State:
$12,598
(% of AGI for various income ranges: 4.0% for AGIs $25k-50k, 21.9% for AGIs $50k-75k, 52.2% for AGIs $75k-100k, 115.8% for AGIs $100k-200k)
Taxes paid: $7,930 (reported on 1.9% of returns)
92173:
$7,930
State:
$8,807
(% of AGI for various income ranges: 2.3% for AGIs below $25k, 9.5% for AGIs $25k-50k, 42.5% for AGIs $50k-75k, 87.0% for AGIs $75k-100k, 272.1% for AGIs $100k-200k)
Earned income credit: $2,342 (reported on 30.2% of returns)
Here:
$2,342
State:
$2,074
(% of AGI for various income ranges: 138.9% for AGIs below $25k, 95.0% for AGIs $25k-50k, 2.7% for AGIs $50k-75k)
Percentage of individuals using paid preparers for their 2020 taxes: 91.1%
Here:
91%
State:
92%
(% for various income ranges: 90.6% for AGIs below $25k, 91.2% for AGIs $25k-50k, 91.9% for AGIs $50k-75k, 91.7% for AGIs $75k-100k, 92.0% for AGIs $100k-200k, 100.0% for AGIs over 200k)
Averages for the 2012 tax year for zip code 92173, filed in 2013:
Average Adjusted Gross Income (AGI) in 2012: $27,647 (Individual Income Tax Returns)
Here:
$27,647
State:
$72,726
Salary/wage: $26,837 (reported on 85.9% of returns)
Here:
$26,837
State:
$59,079
(% of AGI for various income ranges: 76.5% for AGIs below $25k, 89.3% for AGIs $25k-50k, 87.0% for AGIs $50k-75k, 85.2% for AGIs $75k-100k, 81.2% for AGIs $100k-200k, 38.4% for AGIs over 200k)
Taxable interest for individuals: $399 (reported on 9.9% of returns)
This zip code:
$399
California:
$2,146
(% of AGI for various income ranges: 0.2% for AGIs below $25k, 0.1% for AGIs $25k-50k, 0.1% for AGIs $50k-75k, 0.4% for AGIs $100k-200k)
Ordinary dividends: $3,242 (reported on 1.9% of returns)
Here:
$3,242
State:
$9,308
(% of AGI for various income ranges: 0.1% for AGIs below $25k, 0.1% for AGIs $25k-50k, 0.1% for AGIs $50k-75k, 0.3% for AGIs $75k-100k, 1.2% for AGIs $100k-200k)
Net capital gain/loss in AGI: +$1,853 (reported on 1.6% of returns)
Here:
+$1,853
State:
+$30,460
(% of AGI for various income ranges: 0.1% for AGIs $50k-75k, 1.0% for AGIs $100k-200k)
Profit/loss from business: +$9,951 (reported on 15.3% of returns)
Here:
+$9,951
State:
+$17,064
(% of AGI for various income ranges: 13.8% for AGIs below $25k, 2.7% for AGIs $25k-50k, 1.8% for AGIs $50k-75k, 1.9% for AGIs $75k-100k, 1.3% for AGIs $100k-200k)
Taxable individual retirement arrangement distribution: $11,748 (reported on 1.5% of returns)
92173:
$11,748
California:
$19,557
(% of AGI for various income ranges: 0.3% for AGIs below $25k, 0.4% for AGIs $25k-50k, 0.7% for AGIs $50k-75k, 1.1% for AGIs $75k-100k, 2.1% for AGIs $100k-200k)
Total itemized deductions: $19,744 (31% of AGI, reported on 9.2% of returns)
Here:
$19,744
State:
$34,004
Here:
30.8% of AGI
State:
22.7% of AGI
(% of AGI for various income ranges: 2.4% for AGIs below $25k, 4.5% for AGIs $25k-50k, 9.6% for AGIs $50k-75k, 13.6% for AGIs $75k-100k, 14.5% for AGIs $100k-200k, 14.8% for AGIs over 200k)
Charity contributions: $1,666 (reported on 6.1% of returns)
Here:
$1,666
State:
$4,659
(% of AGI for various income ranges: 0.3% for AGIs $25k-50k, 0.5% for AGIs $50k-75k, 0.7% for AGIs $75k-100k, 1.2% for AGIs $100k-200k)
Taxes paid: $5,178 (reported on 9.1% of returns)
92173:
$5,178
State:
$14,448
(% of AGI for various income ranges: 0.4% for AGIs below $25k, 0.9% for AGIs $25k-50k, 2.3% for AGIs $50k-75k, 4.1% for AGIs $75k-100k, 5.1% for AGIs $100k-200k, 4.9% for AGIs over 200k)
Earned income credit: $2,646 (reported on 41.3% of returns)
Here:
$2,646
State:
$2,286
(% of AGI for various income ranges: 11.1% for AGIs below $25k, 2.2% for AGIs $25k-50k)
Percentage of individuals using paid preparers for their 2012 taxes: 76.9%
Here:
77%
State:
64%
(% for various income ranges: 75.6% for AGIs below $25k, 79.2% for AGIs $25k-50k, 78.5% for AGIs $50k-75k, 78.6% for AGIs $75k-100k, 73.5% for AGIs $100k-200k, 66.7% for AGIs over 200k)
Averages for the 2004 tax year for zip code 92173, filed in 2005:
Average Adjusted Gross Income (AGI) in 2004: $24,932 (Individual Income Tax Returns)
Here:
$24,932
State:
$58,600
Salary/wage: $24,622 (reported on 90.6% of returns)
Here:
$24,622
State:
$49,455
(% of AGI for various income ranges: 94.5% for AGIs below $10k, 89.9% for AGIs $10k-25k, 93.0% for AGIs $25k-50k, 91.6% for AGIs $50k-75k, 89.8% for AGIs $75k-100k, 54.9% for AGIs over 100k)
Taxable interest for individuals: $460 (reported on 14.7% of returns)
This zip code:
$460
California:
$2,365
(% of AGI for various income ranges: 0.9% for AGIs below $10k, 0.2% for AGIs $10k-25k, 0.2% for AGIs $25k-50k, 0.4% for AGIs $50k-75k, 0.2% for AGIs $75k-100k, 0.7% for AGIs over 100k)
Taxable dividends: $1,522 (reported on 2.4% of returns)
Here:
$1,522
State:
$4,746
(% of AGI for various income ranges: 0.3% for AGIs below $10k, 0.1% for AGIs $10k-25k, 0.1% for AGIs $25k-50k, 0.3% for AGIs $50k-75k, 0.1% for AGIs $75k-100k, 0.4% for AGIs over 100k)
Net capital gain/loss: +$16,403 (reported on 1.8% of returns)
Here:
+$16,403
State:
+$23,418
(% of AGI for various income ranges: -0.2% for AGIs below $10k, 0.1% for AGIs $10k-25k, 0.0% for AGIs $25k-50k, 0.2% for AGIs $50k-75k, -0.0% for AGIs $75k-100k, 18.8% for AGIs over 100k)
Profit/loss from business: +$8,191 (reported on 10.7% of returns)
Here:
+$8,191
State:
+$16,826
(% of AGI for various income ranges: 15.8% for AGIs below $10k, 5.9% for AGIs $10k-25k, 2.4% for AGIs $25k-50k, 1.3% for AGIs $50k-75k, 0.7% for AGIs $75k-100k, 0.2% for AGIs over 100k)
IRA payment deduction: $2,021 (reported on 0.6% of returns)
92173:
$2,021
California:
$3,192
Total itemized deductions: $19,582 (35% of AGI, reported on 12.2% of returns)
Here:
$19,582
State:
$28,113
Here:
35.2% of AGI
State:
25.3% of AGI
(% of AGI for various income ranges: 3.8% for AGIs below $10k, 2.6% for AGIs $10k-25k, 7.6% for AGIs $25k-50k, 17.3% for AGIs $50k-75k, 21.6% for AGIs $75k-100k, 25.1% for AGIs over 100k)
Charity contributions deductions: $1,551 (3% of AGI, reported on 9.3% of returns)
Here:
$1,551
State:
$3,923
Here:
2.7% of AGI
State:
3.3% of AGI
(% of AGI for various income ranges: 0.1% for AGIs below $10k, 0.1% for AGIs $10k-25k, 0.4% for AGIs $25k-50k, 1.1% for AGIs $50k-75k, 1.6% for AGIs $75k-100k, 1.4% for AGIs over 100k)
Total tax: $2,067 (reported on 54.2% of returns)
92173:
$2,067
State:
$10,761
(% of AGI for various income ranges: 3.3% for AGIs below $10k, 2.6% for AGIs $10k-25k, 3.8% for AGIs $25k-50k, 5.9% for AGIs $50k-75k, 7.3% for AGIs $75k-100k, 11.9% for AGIs over 100k)
Earned income credit: $1,957 (reported on 34.8% of returns)
Here:
$1,957
State:
$1,763
Percentage of individuals using paid preparers for their 2004 taxes: 83.3%
Here:
83%
State:
66%
(% for various income ranges: 78.8% for AGIs below $10k, 85.9% for AGIs $10k-25k, 84.3% for AGIs $25k-50k, 81.7% for AGIs $50k-75k, 77.6% for AGIs $75k-100k, 76.1% for AGIs over 100k)
Household received Food Stamps/SNAP in the past 12 months: 2,254 Household did not receive Food Stamps/SNAP in the past 12 months: 6,143
Women who had a birth in the past 12 months: 327 (223 now married, 104 unmarried) Women who did not have a birth in the past 12 months: 6,684 (2,435 now married, 4,258 unmarried)
Housing units in zip code 92173 with a mortgage: 1,579 (84 second mortgage, 4 home equity loan, 78 both second mortgage and home equity loan) Houses without a mortgage: 15
Median monthly owner costs for units with a mortgage: $1,921 Median monthly owner costs for units without a mortgage: $444
Residents with income below the poverty level in 2022:
This zip code:
16.4%
Whole state:
12.2%
Residents with income below 50% of the poverty level in 2022:
This zip code:
8.9%
Whole state:
6.2%
Median number of rooms in houses and condos:
Here:
5.6
State:
6.0
Median number of rooms in apartments:
Here:
3.8
State:
3.9
Notable locations in this zip code not listed on our city pages
Notable locations in zip code 92173: South Bay International Wastewater Treatment Plant (A), South Bay Water Reclamation Plant (B), San Ysidro Station (C), San Ysidro Community Activity Center (D), San Ysidro Branch San Diego Public Library (E), San Diego Fire - Rescue Department Station 29 (F), Apostolic Assembly District Offices (G). Display/hide their locations on the map
Shopping Centers: Las Americas Shopping Center (1), San Ysidro Village Shopping Center (2), San Diego Factory Outlet Shopping Center (3), Plaza Major Shopping Center (4). Display/hide their locations on the map
Churches in zip code 92173 include: First Southern Baptist Church (A), Faith Apostolic Assembly Church (B), Our Lady of Mount Carmel Catholic Church (C), San Ysidro Spanish Seventh Day Adventist Church (D), Victory Outreach Church (E), San Ysidro First Assembly of God (F), Ministerio Evenezer (G), Armando Perez Ministries (H). Display/hide their locations on the map
3,293 married couples with children.
1,689 single-parent households (99 men, 1,590 women).
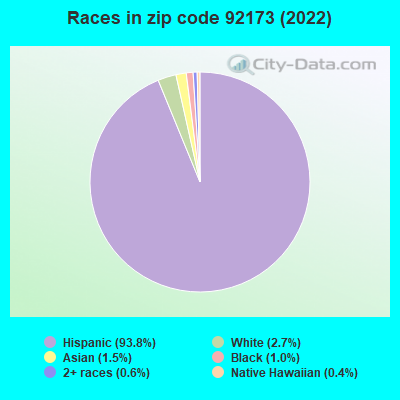
11.5% of residents of 92173 zip code speak English at home.
87.3% of residents speak Spanish at home (54% very well, 19% well, 20% not well, 7% not at all).
1.6% of residents speak Asian or Pacific Island language at home (77% very well, 12% well, 11% not well).
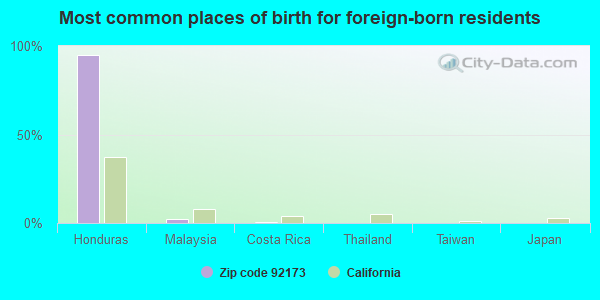
Foreign born population: 13,533 (47.7%) (53.0% of them are naturalized citizens)
This zip code:
47.7%
Whole state:
26.7%
95%Honduras
2%Malaysia
1%Costa Rica
0%Thailand
0%Taiwan
0%Japan
0%Chile
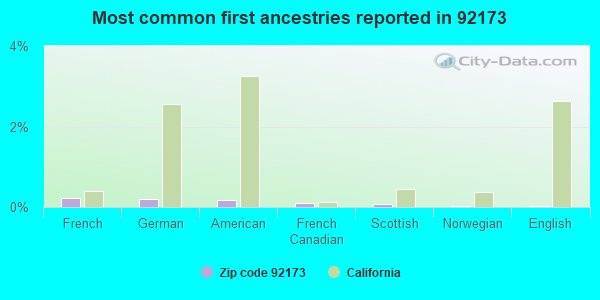
0%French
0%German
0%American
0%French Canadian
0%Scottish
0%Norwegian
0%English
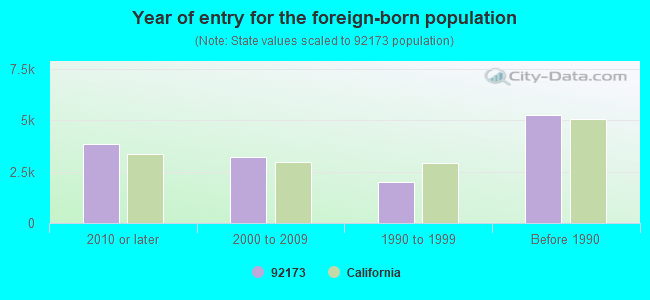
Year of entry for the foreign-born population
3,8562010 or later
3,2002000 to 2009
1,9741990 to 1999
5,243Before 1990
Major facilities with environmental interests located in this zip code:
HONEYWELL INCORPORATED HOME & BUILDING CONTROLS W COAST OPER (2055 DUBLIN DR. in SAN DIEGO, CA)
STATE MASTER (California - Hazardous Waste Tracking) - HAZARDOU WASTE PROGRAM CRITERIA AND HAZARDOUS AIR POLLUTANT INVENTORY (Inventory of air pollution sources) Small Quantity Generators, between 100 kg and 1000 kg of hazardous waste/month (Resource Conservation and Recovery Act (tracking hazardous waste)) - notification TRI REPORTER (Tracking of toxic chemicals releasing facilities) Business SIC classification: AUTOMATIC CONTROLS FOR REGULATING RESIDENTIAL AND COMMERCIAL ENVIRONMENTS AND APPLIANCES Business NAICS classification: AUTOMATIC ENVIRONMENTAL CONTROL MANUFACTURING FOR RESIDENTIAL, COMMERCIAL, AND APPLIANCE USE. Organizations: CALIFORNIA STRUCTURES (CONTACT/OWNER)
Alternative names: HONEYWELL INC SAN DIEGO
EQUILON ENTERPRISES (314 SAN YSIDRO SAP 121091 in SAN DIEGO, CA) . Federal Facility
STATE MASTER (California - Hazardous Waste Tracking) - HAZARDOU WASTE PROGRAM CRITERIA AND HAZARDOUS AIR POLLUTANT INVENTORY (Inventory of air pollution sources) Small Quantity Generators, between 100 kg and 1000 kg of hazardous waste/month (Resource Conservation and Recovery Act (tracking hazardous waste)) - notification Business SIC classification: GASOLINE SERVICE STATIONS Alternative names: TEXACO / E SAN YSIDRO BLVD, TEXACO SERVICE STATION
EQUILON ENTERPRISES (108 W SAN YSIDRO @ SYCAMORE in SAN DIEGO, CA) . Federal Facility
STATE MASTER (California - Hazardous Waste Tracking) - HAZARDOU WASTE PROGRAM Small Quantity Generators, between 100 kg and 1000 kg of hazardous waste/month (Resource Conservation and Recovery Act (tracking hazardous waste)) - notification Organizations: EQUILON ENTERPRISES, LLC (CONTACT/OWNER)
Alternative names: SHELL OIL CO
CHEVRON STATION NO 95195 (220 SYCAMORE RD in SAN YSIDRO, CA)
STATE MASTER (California - Hazardous Waste Tracking) - HAZARDOU WASTE PROGRAM CRITERIA AND HAZARDOUS AIR POLLUTANT INVENTORY (Inventory of air pollution sources) Small Quantity Generators, between 100 kg and 1000 kg of hazardous waste/month (Resource Conservation and Recovery Act (tracking hazardous waste)) - notification Business SIC classification: GASOLINE SERVICE STATIONS Organizations: CHEVRON PRODUCTS CO (CONTACT/OWNER)
LA MIRADA ELEMENTARY (222 AVENIDA DE LA MADRID in SAN YSIDRO, CA)
(National Center for Education Statistics) - STATE ID-6089007 Organizations: SAN YSIDRO ELEMENTARY (SCHOOL DISTRICT)
NICOLOFF (GEORGE) ELEMENTARY (1777 HOVARD AVE. in SAN YSIDRO, CA)
(National Center for Education Statistics) - STATE ID-6098487 Organizations: SOUTH BAY UNION ELEMENTARY (SCHOOL DISTRICT)
MARTIN FURNITURE (7757 ST ANDREWS AVENUE in SAN DIEGO, CA)
AIR SYNTHETIC MINOR (AIRS/AFS) COMPLIANCE ACTIVITY (Tracking inspections of insecticide, fungicide, and rodenticide, and toxic substances) CRITERIA AND HAZARDOUS AIR POLLUTANT INVENTORY (Inventory of air pollution sources) HAZARDOUS WASTE BIENNIAL REPORTER (Resource Conservation and Recovery Act (tracking hazardous waste)) Small Quantity Generators, between 100 kg and 1000 kg of hazardous waste/month (Resource Conservation and Recovery Act (tracking hazardous waste)) - notification Business SIC classification: WOOD HOUSEHOLD FURNITURE, EXCEPT UPHOLSTERED; WOOD OFFICE FURNITURE Organizations: GILBERT MARTIN (CONTACT/OWNER)
JVC INDUSTRIAL AMERICA INC (1790-1 DORNACH CT in SAN DIEGO, CA)
Large Quantity Generators, more that 1000 kg of hazardous waste/month (Resource Conservation and Recovery Act (tracking hazardous waste)) - notification
NSC BROWNFIELD PISTOL RANGE (99 HERITAGE RD in SAN DIEGO, CA)
HAZARDOUS WASTE BIENNIAL REPORTER (Resource Conservation and Recovery Act (tracking hazardous waste)) Large Quantity Generators, more that 1000 kg of hazardous waste/month (Resource Conservation and Recovery Act (tracking hazardous waste))
MAGIC FLOW CLEANERS NO 4 (416 W SAN YSIDRO BLVD in SAN DIEGO, CA)
Small Quantity Generators, between 100 kg and 1000 kg of hazardous waste/month (Resource Conservation and Recovery Act (tracking hazardous waste)) - notification Organizations: ALL SERVICE ENTERPRISES INC (CONTACT/OWNER)
CASMET TRUCKING INCORPORATED (223 VIA SAN YSIDRO SUITE 8 in SAN YSIDRO, CA)
AMMEX INTERNATIONAL (2235 AVENIDA COSTA ESTE NO 600 in SAN DIEGO, CA)
Small Quantity Generators, between 100 kg and 1000 kg of hazardous waste/month (Resource Conservation and Recovery Act (tracking hazardous waste)) - notification Organizations: RENE A ROMERO (CONTACT/OWNER)
EASTON COMPOSITES (2150 MICHAEL FARADAY DR UNIT A in SAN DIEGO, CA)
Small Quantity Generators, between 100 kg and 1000 kg of hazardous waste/month (Resource Conservation and Recovery Act (tracking hazardous waste)) - notification
Housing units lacking complete plumbing facilities: 1.5% Housing units lacking complete kitchen facilities: 2.6%
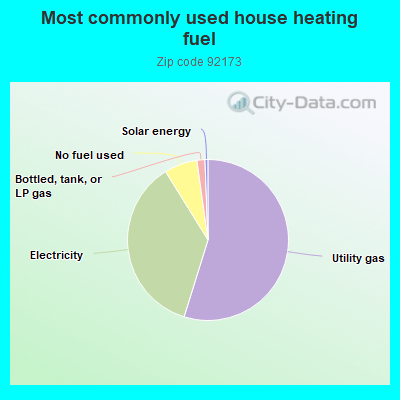
54.7%Utility gas
36.3%Electricity
6.6%No fuel used
1.6%Bottled, tank, or LP gas
0.6%Solar energy
Population in 1990: 30,131.
Place of birth for U.S.-born residents:
This state: 13,626
Northeast: 113
Midwest: 100
South: 314
West: 198
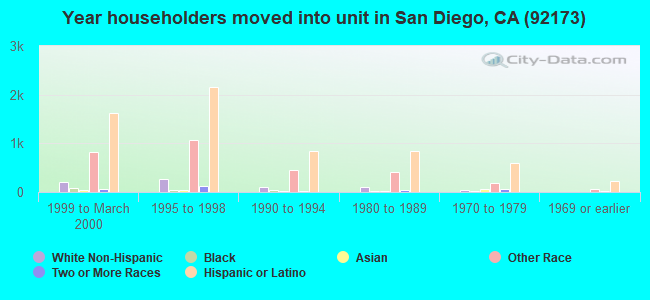
49% of the 92173 zip code residents lived in the same house 5 years ago. Out of people who lived in different houses, 80% lived in this county. Out of people who lived in different counties, 50% lived in California.
94% of the 92173 zip code residents lived in the same house 1 year ago. Out of people who lived in different houses, 87% moved from this county. Out of people who lived in different houses, 2% moved from different county within same state. Out of people who lived in different houses, 3% moved from different state. Out of people who lived in different houses, 10% moved from abroad.
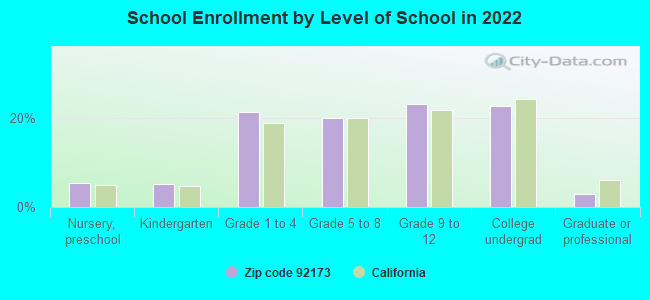
Private vs. public school enrollment:
Students in private schools in grades 1 to 8 (elementary and middle school): 120
Here:
3.9%
California:
10.5%
Students in private schools in grades 9 to 12 (high school): 133
Here:
7.6%
California:
8.5%
Students in private undergraduate colleges: 129
Here:
7.6%
California:
15.9%
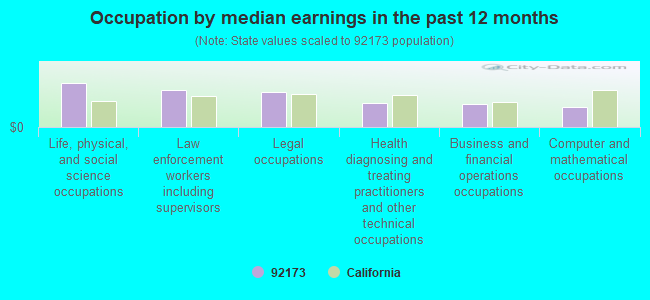
Occupation by median earnings in the past 12 months ($)
116,716Life, physical, and social science occupations
98,680Law enforcement workers including supervisors
93,344Legal occupations
63,772Health diagnosing and treating practitioners and other technical occupations
59,692Business and financial operations occupations
54,232Computer and mathematical occupations
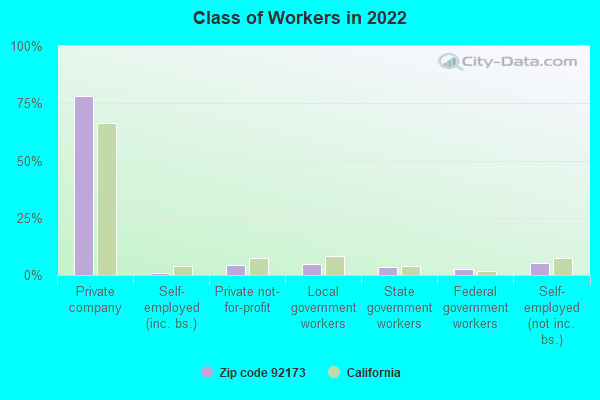
Companies with federal contracts located in this zip code:
MEDITROL MANAGEMENT SERVICES (125 ELIVO CT in SAN YSIDRO, CA; small business) : $147,422 in 2 contractsfrom 2004 to 2005
$168,482 with Navy for Guard Services. Signed on 2004-07-21. Completion date: 2005-07-15.
-$21,060, same as above.Signed on 2005-07-29. Completion date: 2005-07-15.
Top industries in this zip code by the number of employees in 2005:
2005 - 2018 National Fire Incident Reporting System (NFIRS) incidents
According to the data from the years 2005 - 2018 the average number of fires per year is 43. The highest number of reported fire incidents - 100 took place in 2018, and the least - 0 in 2006. The data has an increasing trend.
When looking into fire subcategories, the most reports belonged to: Outside Fires (46.4%), and Structure Fires (27.2%).
Fire incident types reported to NFIRS in Zip Code 92173
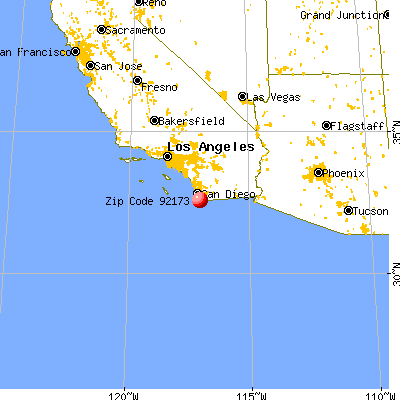


 Nearest zip codes: 92154, 91911, 91932, 91910, 91913, 91902.


 According to the data from the years 2005 - 2018 the average number of fires per year is 43. The highest number of reported fire incidents - 100 took place in 2018, and the least - 0 in 2006. The data has an increasing trend.
 When looking into fire subcategories, the most reports belonged to: Outside Fires (46.4%), and Structure Fires (27.2%).