Estimated zip code population in 2022: 29,989 Zip code population in 2010: 26,317 Zip code population in 2000: 25,553
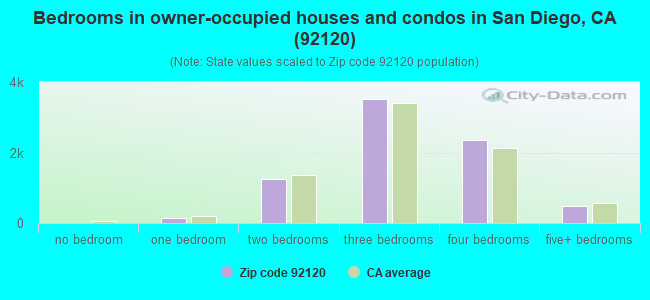
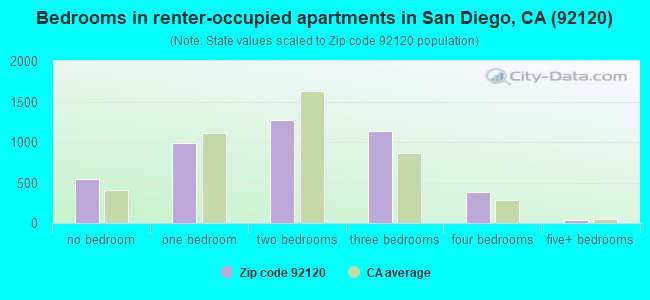
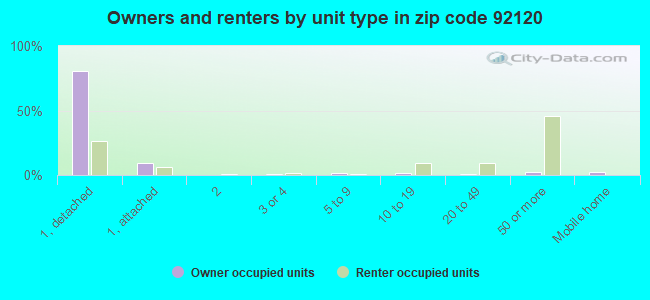
Houses and condos: 12,758 Renter-occupied apartments: 4,354
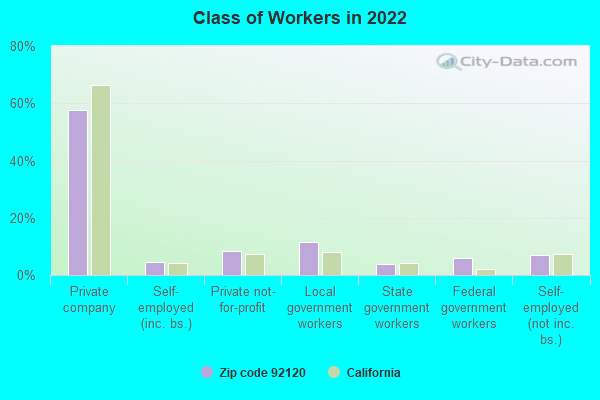
% of renters here:
36%
State:
44%
March 2022 cost of living index in zip code 92120: 122.9 (high, U.S. average is 100)
Land area: 6.7 sq. mi. Water area: 0.2 sq. mi.
Population density: 4,504 people per square mile
(average).
OSM Map
General Map
Google Map
MSN Map
OSM Map
General Map
Google Map
MSN Map
OSM Map
General Map
Google Map
MSN Map
OSM Map
General Map
Google Map
MSN Map
Please wait while loading the map...
Real estate property taxes paid for housing units in 2022:
This zip code:
0.6% ($5,234)
California:
0.7% ($4,831)
Median real estate property taxes paid for housing units with mortgages in 2022: $5,916 (0.7%) Median real estate property taxes paid for housing units with no mortgage in 2022: $2,671 (0.3%)
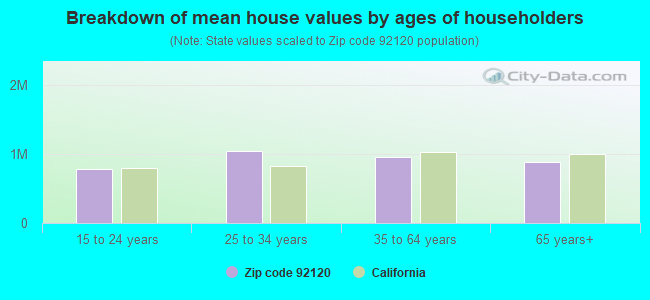
Estimated median house/condo value in 2022: $876,280
92120:
$876,280
California:
$715,900
According to our research of California and other state lists, there were 15 registered sex offenders living in 92120 zip code as of April 26, 2024. The ratio of all residents to sex offenders in zip code 92120 is 1,928 to 1. The ratio of registered sex offenders to all residents in this zip code is much lower than the state average.
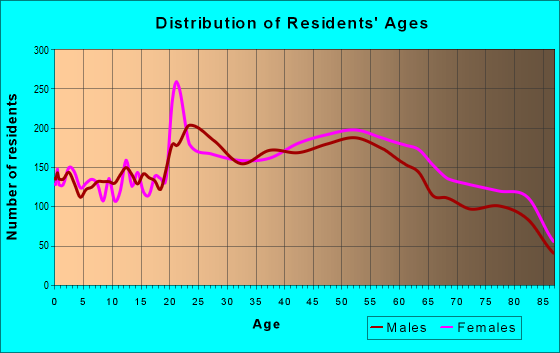
Median resident age:
This zip code:
38.3 years
California median age:
37.9 years
Average household size:
This zip code:
2.5 people
California:
2.8 people
Averages for the 2020 tax year for zip code 92120, filed in 2021:
Average Adjusted Gross Income (AGI) in 2020: $99,214 (Individual Income Tax Returns)
Here:
$99,214
State:
$95,910
Salary/wage: $83,420 (reported on 77.6% of returns)
Here:
$83,420
State:
$77,331
(% of AGI for various income ranges: 1118.0% for AGIs below $25k, 3768.6% for AGIs $25k-50k, 6812.8% for AGIs $50k-75k, 9641.4% for AGIs $75k-100k, 18954.4% for AGIs $100k-200k, 76086.3% for AGIs over 200k)
Taxable interest for individuals: $1,723 (reported on 45.9% of returns)
This zip code:
$1,723
California:
$2,294
(% of AGI for various income ranges: 24.9% for AGIs below $25k, 30.2% for AGIs $25k-50k, 78.7% for AGIs $50k-75k, 104.2% for AGIs $75k-100k, 177.9% for AGIs $100k-200k, 1187.1% for AGIs over 200k)
Ordinary dividends: $6,525 (reported on 30.2% of returns)
Here:
$6,525
State:
$10,949
(% of AGI for various income ranges: 57.2% for AGIs below $25k, 79.3% for AGIs $25k-50k, 165.5% for AGIs $50k-75k, 250.4% for AGIs $75k-100k, 476.3% for AGIs $100k-200k, 2954.1% for AGIs over 200k)
Net capital gain/loss in AGI: +$18,555 (reported on 28.5% of returns)
Here:
+$18,555
State:
+$49,306
(% of AGI for various income ranges: 23.9% for AGIs below $25k, 74.8% for AGIs $25k-50k, 92.1% for AGIs $50k-75k, 209.0% for AGIs $75k-100k, 579.7% for AGIs $100k-200k, 13630.0% for AGIs over 200k)
Profit/loss from business: +$15,663 (reported on 17.3% of returns)
Here:
+$15,663
State:
+$15,671
(% of AGI for various income ranges: 132.3% for AGIs below $25k, 163.2% for AGIs $25k-50k, 250.9% for AGIs $50k-75k, 374.6% for AGIs $75k-100k, 662.5% for AGIs $100k-200k, 3391.2% for AGIs over 200k)
Taxable individual retirement arrangement distribution: $22,543 (reported on 11.4% of returns)
92120:
$22,543
California:
$23,505
(% of AGI for various income ranges: 78.7% for AGIs below $25k, 118.9% for AGIs $25k-50k, 239.2% for AGIs $50k-75k, 501.4% for AGIs $75k-100k, 808.5% for AGIs $100k-200k, 2635.3% for AGIs over 200k)
Self-employed (Keogh) retirement plans: $26,128 (reported on 1.2% of returns)
92120:
$26,128
California:
$30,163
(% of AGI for various income ranges: 15.6% for AGIs $25k-50k, 65.1% for AGIs $100k-200k, 650.6% for AGIs over 200k)
Total itemized deductions: $33,085 (reported on 22.0% of returns)
Here:
$33,085
State:
$39,517
(% of AGI for various income ranges: 127.7% for AGIs below $25k, 261.7% for AGIs $25k-50k, 576.1% for AGIs $50k-75k, 1119.7% for AGIs $75k-100k, 2315.1% for AGIs $100k-200k, 9060.8% for AGIs over 200k)
Charity contributions: $6,511 (reported on 18.6% of returns)
Here:
$6,511
State:
$12,598
(% of AGI for various income ranges: 7.6% for AGIs below $25k, 21.6% for AGIs $25k-50k, 64.5% for AGIs $50k-75k, 130.1% for AGIs $75k-100k, 319.8% for AGIs $100k-200k, 2112.2% for AGIs over 200k)
Taxes paid: $8,806 (reported on 21.9% of returns)
92120:
$8,806
State:
$8,807
(% of AGI for various income ranges: 23.5% for AGIs below $25k, 57.7% for AGIs $25k-50k, 152.8% for AGIs $50k-75k, 339.2% for AGIs $75k-100k, 715.2% for AGIs $100k-200k, 2049.0% for AGIs over 200k)
Earned income credit: $1,707 (reported on 7.5% of returns)
Here:
$1,707
State:
$2,074
(% of AGI for various income ranges: 54.2% for AGIs below $25k, 36.5% for AGIs $25k-50k)
Percentage of individuals using paid preparers for their 2020 taxes: 93.7%
Here:
94%
State:
92%
(% for various income ranges: 92.5% for AGIs below $25k, 94.4% for AGIs $25k-50k, 92.7% for AGIs $50k-75k, 93.2% for AGIs $75k-100k, 94.5% for AGIs $100k-200k, 95.4% for AGIs over 200k)
Averages for the 2012 tax year for zip code 92120, filed in 2013:
Average Adjusted Gross Income (AGI) in 2012: $77,103 (Individual Income Tax Returns)
Here:
$77,103
State:
$72,726
Salary/wage: $64,823 (reported on 75.3% of returns)
Here:
$64,823
State:
$59,079
(% of AGI for various income ranges: 66.5% for AGIs below $25k, 69.8% for AGIs $25k-50k, 66.2% for AGIs $50k-75k, 67.7% for AGIs $75k-100k, 68.6% for AGIs $100k-200k, 50.0% for AGIs over 200k)
Taxable interest for individuals: $1,819 (reported on 50.4% of returns)
This zip code:
$1,819
California:
$2,146
(% of AGI for various income ranges: 1.9% for AGIs below $25k, 1.1% for AGIs $25k-50k, 1.3% for AGIs $50k-75k, 0.9% for AGIs $75k-100k, 0.9% for AGIs $100k-200k, 1.6% for AGIs over 200k)
Ordinary dividends: $6,389 (reported on 31.1% of returns)
Here:
$6,389
State:
$9,308
(% of AGI for various income ranges: 3.2% for AGIs below $25k, 1.9% for AGIs $25k-50k, 2.3% for AGIs $50k-75k, 1.7% for AGIs $75k-100k, 2.2% for AGIs $100k-200k, 3.8% for AGIs over 200k)
Net capital gain/loss in AGI: +$8,720 (reported on 26.7% of returns)
Here:
+$8,720
State:
+$30,460
(% of AGI for various income ranges: 0.5% for AGIs $25k-50k, 0.4% for AGIs $50k-75k, 0.5% for AGIs $75k-100k, 1.5% for AGIs $100k-200k, 8.9% for AGIs over 200k)
Profit/loss from business: +$18,035 (reported on 17.8% of returns)
Here:
+$18,035
State:
+$17,064
(% of AGI for various income ranges: 9.6% for AGIs below $25k, 4.6% for AGIs $25k-50k, 3.8% for AGIs $50k-75k, 4.4% for AGIs $75k-100k, 3.4% for AGIs $100k-200k, 4.1% for AGIs over 200k)
Taxable individual retirement arrangement distribution: $19,010 (reported on 15.9% of returns)
92120:
$19,010
California:
$19,557
(% of AGI for various income ranges: 5.6% for AGIs below $25k, 3.9% for AGIs $25k-50k, 3.6% for AGIs $50k-75k, 4.1% for AGIs $75k-100k, 3.6% for AGIs $100k-200k, 4.1% for AGIs over 200k)
Self-employment retirement plans: $23,526 (reported on 1.4% of returns)
92120:
$23,526
California:
$24,530
(% of AGI for various income ranges: 0.4% for AGIs $50k-75k, 0.4% for AGIs $100k-200k, 0.9% for AGIs over 200k)
Total itemized deductions: $29,088 (23% of AGI, reported on 45.3% of returns)
Here:
$29,088
State:
$34,004
Here:
23.2% of AGI
State:
22.7% of AGI
(% of AGI for various income ranges: 16.4% for AGIs below $25k, 12.6% for AGIs $25k-50k, 16.2% for AGIs $50k-75k, 17.0% for AGIs $75k-100k, 18.6% for AGIs $100k-200k, 17.3% for AGIs over 200k)
Charity contributions: $4,090 (reported on 39.4% of returns)
Here:
$4,090
State:
$4,659
(% of AGI for various income ranges: 1.0% for AGIs below $25k, 1.1% for AGIs $25k-50k, 1.7% for AGIs $50k-75k, 1.8% for AGIs $75k-100k, 2.0% for AGIs $100k-200k, 3.1% for AGIs over 200k)
Taxes paid: $10,756 (reported on 45.2% of returns)
92120:
$10,756
State:
$14,448
(% of AGI for various income ranges: 2.6% for AGIs below $25k, 2.5% for AGIs $25k-50k, 4.2% for AGIs $50k-75k, 5.5% for AGIs $75k-100k, 7.1% for AGIs $100k-200k, 8.6% for AGIs over 200k)
Earned income credit: $1,650 (reported on 8.7% of returns)
Here:
$1,650
State:
$2,286
(% of AGI for various income ranges: 3.1% for AGIs below $25k, 0.5% for AGIs $25k-50k)
Percentage of individuals using paid preparers for their 2012 taxes: 57.1%
Here:
57%
State:
64%
(% for various income ranges: 47.8% for AGIs below $25k, 51.6% for AGIs $25k-50k, 60.9% for AGIs $50k-75k, 61.5% for AGIs $75k-100k, 65.7% for AGIs $100k-200k, 76.0% for AGIs over 200k)
Averages for the 2004 tax year for zip code 92120, filed in 2005:
Average Adjusted Gross Income (AGI) in 2004: $61,510 (Individual Income Tax Returns)
Here:
$61,510
State:
$58,600
Salary/wage: $52,010 (reported on 73.0% of returns)
Here:
$52,010
State:
$49,455
(% of AGI for various income ranges: 4117.5% for AGIs below $10k, 63.2% for AGIs $10k-25k, 69.2% for AGIs $25k-50k, 65.1% for AGIs $50k-75k, 67.3% for AGIs $75k-100k, 54.9% for AGIs over 100k)
Taxable interest for individuals: $2,384 (reported on 63.1% of returns)
This zip code:
$2,384
California:
$2,365
(% of AGI for various income ranges: 474.0% for AGIs below $10k, 4.4% for AGIs $10k-25k, 2.5% for AGIs $25k-50k, 2.4% for AGIs $50k-75k, 1.7% for AGIs $75k-100k, 2.2% for AGIs over 100k)
Taxable dividends: $3,681 (reported on 37.9% of returns)
Here:
$3,681
State:
$4,746
(% of AGI for various income ranges: 365.5% for AGIs below $10k, 3.4% for AGIs $10k-25k, 2.3% for AGIs $25k-50k, 2.0% for AGIs $50k-75k, 2.4% for AGIs $75k-100k, 2.0% for AGIs over 100k)
Net capital gain/loss: +$11,099 (reported on 32.3% of returns)
Here:
+$11,099
State:
+$23,418
(% of AGI for various income ranges: -144.1% for AGIs below $10k, 0.5% for AGIs $10k-25k, 0.7% for AGIs $25k-50k, 0.7% for AGIs $50k-75k, 1.6% for AGIs $75k-100k, 10.8% for AGIs over 100k)
Profit/loss from business: +$18,905 (reported on 17.5% of returns)
Here:
+$18,905
State:
+$16,826
(% of AGI for various income ranges: 152.5% for AGIs below $10k, 8.1% for AGIs $10k-25k, 4.5% for AGIs $25k-50k, 4.6% for AGIs $50k-75k, 5.9% for AGIs $75k-100k, 5.4% for AGIs over 100k)
IRA payment deduction: $3,228 (reported on 3.5% of returns)
92120:
$3,228
California:
$3,192
(% of AGI for various income ranges: 20.3% for AGIs below $10k, 0.3% for AGIs $10k-25k, 0.3% for AGIs $25k-50k, 0.2% for AGIs $50k-75k, 0.2% for AGIs $75k-100k, 0.1% for AGIs over 100k)
Self-employed pension: $16,746 (reported on 2.3% of returns)
Here:
$16,746
California:
$17,688
(% of AGI for various income ranges: 0.2% for AGIs $10k-25k, 0.3% for AGIs $25k-50k, 0.3% for AGIs $50k-75k, 0.7% for AGIs $75k-100k, 0.8% for AGIs over 100k)
Total itemized deductions: $25,471 (25% of AGI, reported on 46.6% of returns)
Here:
$25,471
State:
$28,113
Here:
25.3% of AGI
State:
25.3% of AGI
(% of AGI for various income ranges: 1305.1% for AGIs below $10k, 16.6% for AGIs $10k-25k, 15.9% for AGIs $25k-50k, 20.0% for AGIs $50k-75k, 21.8% for AGIs $75k-100k, 19.0% for AGIs over 100k)
Charity contributions deductions: $3,800 (4% of AGI, reported on 42.4% of returns)
Here:
$3,800
State:
$3,923
Here:
3.6% of AGI
State:
3.3% of AGI
(% of AGI for various income ranges: 57.6% for AGIs below $10k, 1.6% for AGIs $10k-25k, 1.9% for AGIs $25k-50k, 2.2% for AGIs $50k-75k, 2.6% for AGIs $75k-100k, 3.0% for AGIs over 100k)
Total tax: $9,705 (reported on 84.1% of returns)
92120:
$9,705
State:
$10,761
(% of AGI for various income ranges: 211.3% for AGIs below $10k, 5.1% for AGIs $10k-25k, 8.0% for AGIs $25k-50k, 9.9% for AGIs $50k-75k, 10.7% for AGIs $75k-100k, 17.4% for AGIs over 100k)
Earned income credit: $1,206 (reported on 5.8% of returns)
Here:
$1,206
State:
$1,763
Percentage of individuals using paid preparers for their 2004 taxes: 61.4%
Here:
61%
State:
66%
(% for various income ranges: 52.6% for AGIs below $10k, 59.1% for AGIs $10k-25k, 57.5% for AGIs $25k-50k, 64.7% for AGIs $50k-75k, 65.0% for AGIs $75k-100k, 72.9% for AGIs over 100k)
Likely homosexual households (counted as self-reported same-sex unmarried-partner households)
Lesbian couples: 0.1% of all households
Gay men: 0.3% of all households
Household received Food Stamps/SNAP in the past 12 months: 381 Household did not receive Food Stamps/SNAP in the past 12 months: 11,463
Women who had a birth in the past 12 months: 366 (332 now married, 32 unmarried) Women who did not have a birth in the past 12 months: 6,976 (2,785 now married, 4,191 unmarried)
Housing units in zip code 92120 with a mortgage: 5,423 (506 second mortgage, 449 both second mortgage and home equity loan) Houses without a mortgage: 162
Median monthly owner costs for units with a mortgage: $2,829 Median monthly owner costs for units without a mortgage: $735
Residents with income below the poverty level in 2022:
This zip code:
8.6%
Whole state:
12.2%
Residents with income below 50% of the poverty level in 2022:
This zip code:
2.9%
Whole state:
6.2%
Median number of rooms in houses and condos:
Here:
6.3
State:
6.0
Median number of rooms in apartments:
Here:
4.1
State:
3.9
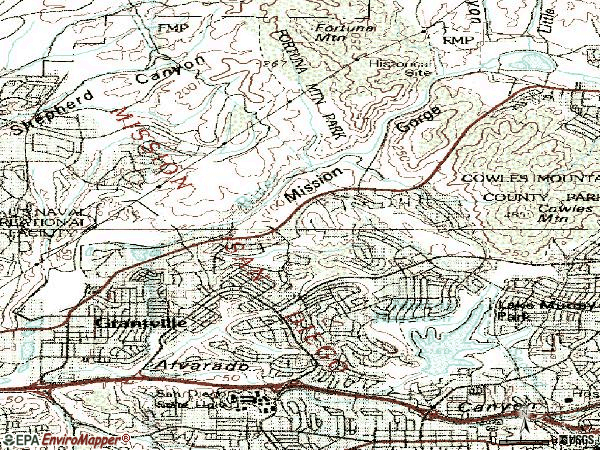
Notable locations in this zip code not listed on our city pages
Notable locations in zip code 92120: Villa Alvarado Residence Hall (A), Benjamin Branch San Diego Public Library (B), San Diego State University Villa Alvarado Residence Hall (C), San Diego Fire - Rescue Department Station 31 (D), Saint Therese Catechetical Center (E), Ascension Lutheran Church Childrens Center (F), Allied Gardens-Benjamin Branch Library San Diego City Public Library (G). Display/hide their locations on the map
Shopping Centers: Time Square Shopping Center (1), Del Cerro Shopping Center (2), Allied Gardens Shopping Center (3), Friars Road Shopping Center (4). Display/hide their locations on the map
Churches in zip code 92120 include: American Baptist Church (A), Ascension Lutheran Church (B), The Church of Jesus Christ of Latter Day Saints (C), Faith Deliverance Church of God in Christ (D), Grace Assembly Church (E), Kingdom Hall of Jehovahs Witnesses (F), Zion Avenue Baptist Church (G), Palisades Presbyterian Church (H), Saint Therese Church (I). Display/hide their locations on the map
Parks in zip code 92120 include: Del Cerro Park (1), Allied Gardens Community Park (2), Allied Gardens Recreation Center (3), Grantville Park (4), Dailard Park (5), Mission Trails Regional Park (6), Princess del Seno Park (7), Rancho Mission Canyon Park (8). Display/hide their locations on the map
4,559 married couples with children.
1,048 single-parent households (334 men, 714 women).
79.3% of residents of 92120 zip code speak English at home.
9.9% of residents speak Spanish at home (85% very well, 10% well, 5% not well).
3.8% of residents speak other Indo-European language at home (66% very well, 21% well, 11% not well, 2% not at all).
4.1% of residents speak Asian or Pacific Island language at home (70% very well, 23% well, 7% not well).
2.8% of residents speak other language at home (62% very well, 34% well, 5% not well).
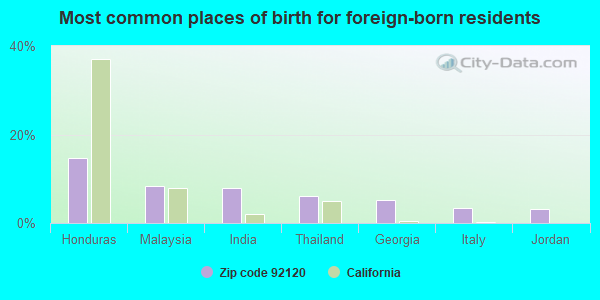
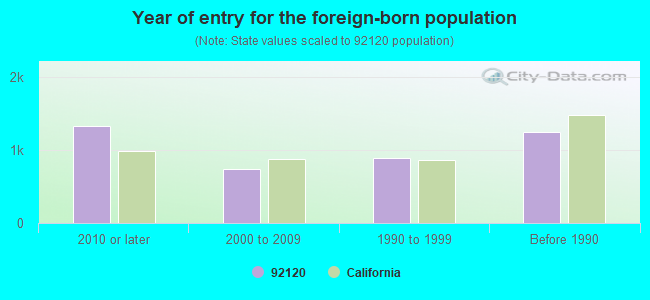
Foreign born population: 3,605 (12.0%) (63.7% of them are naturalized citizens)
Major facilities with environmental interests located in this zip code:
CALIFORNIA NEON PRODUCTS (4530 MISSION GORGE PLACE in SAN DIEGO, CA)
STATE MASTER (California - Hazardous Waste Tracking) - HAZARDOU WASTE PROGRAM CRITERIA AND HAZARDOUS AIR POLLUTANT INVENTORY (Inventory of air pollution sources) Small Quantity Generators, between 100 kg and 1000 kg of hazardous waste/month (Resource Conservation and Recovery Act (tracking hazardous waste)) - notification Business SIC classification: SIGNS AND ADVERTISING SPECIALTIES
HENRY SENIOR HIGH (6702 WANDERMERE DR. in SAN DIEGO, CA)
(National Center for Education Statistics) - STATE ID-3732781 Small Quantity Generators, between 100 kg and 1000 kg of hazardous waste/month (Resource Conservation and Recovery Act (tracking hazardous waste)) - notification Organizations: SAN DIEGO USD (CONTACT/OWNER)
, SAN DIEGO UNIFIED (SCHOOL DISTRICT)
Alternative names: SAN DIEGO USD PATRICK HENRY HS
ALVARADO HOSPITAL MEDICAL CENTER (6655 ALVARADO ROAD in SAN DIEGO, CA)
STATE MASTER (California - Hazardous Waste Tracking) - HAZARDOU WASTE PROGRAM CRITERIA AND HAZARDOUS AIR POLLUTANT INVENTORY (Inventory of air pollution sources) Small Quantity Generators, between 100 kg and 1000 kg of hazardous waste/month (Resource Conservation and Recovery Act (tracking hazardous waste)) Business SIC classification: GENERAL MEDICAL AND SURGICAL HOSPITALS Alternative names: ALVARADO COMMUNITY HOSPITAL, ALVARADO HOSPITAL CENTER, ALVARADO HOSP MED CTR
ARCO #9564 (6404 MISSION GORGE ROAD in SAN DIEGO, CA)
STATE MASTER (California - Hazardous Waste Tracking) - HAZARDOU WASTE PROGRAM CRITERIA AND HAZARDOUS AIR POLLUTANT INVENTORY (Inventory of air pollution sources) Small Quantity Generators, between 100 kg and 1000 kg of hazardous waste/month (Resource Conservation and Recovery Act (tracking hazardous waste)) - notification Business SIC classification: GASOLINE SERVICE STATIONS Organizations: B P WEST COAST PRODUCTS L L C (CONTACT/OWNER)
Alternative names: ARCO FACILITY NO 09564, BP WEST COAST PRODUCTS LLC 09564, PRESTIGE STATIONS INC NO 9564
FLAME SPRAY INC (4674 ALVARADO CYN RD in SAN DIEGO, CA)
STATE MASTER (California - Hazardous Waste Tracking) - HAZARDOU WASTE PROGRAM CRITERIA AND HAZARDOUS AIR POLLUTANT INVENTORY (Inventory of air pollution sources) Small Quantity Generators, between 100 kg and 1000 kg of hazardous waste/month (Resource Conservation and Recovery Act (tracking hazardous waste)) Business SIC classification: ELECTROPLATING, PLATING, POLISHING, ANODIZING, AND COLORING
LAIDLAW TRANSIT SERVICES INC (800 FESLER ST in SAN DIEGO, CA)
STATE MASTER (California - Hazardous Waste Tracking) - HAZARDOU WASTE PROGRAM Small Quantity Generators, between 100 kg and 1000 kg of hazardous waste/month (Resource Conservation and Recovery Act (tracking hazardous waste)) - notification
ALVARADO ORTHOPEDIC MEDICAL GRP (5555 RESERVOIR DR STE 104 in SAN DIEGO, CA)
STATE MASTER (California - Hazardous Waste Tracking) - HAZARDOU WASTE PROGRAM Small Quantity Generators, between 100 kg and 1000 kg of hazardous waste/month (Resource Conservation and Recovery Act (tracking hazardous waste)) - notification Business NAICS classification: OFFICES OF PHYSICIANS, MENTAL HEALTH SPECIALISTS. Alternative names: ALVARADO ORTHOPEDIC MEDICAL GP INC
EQUILON ENTERPRISES (5820 MISSION GORGE/FAIRMONT in SAN DIEGO, CA) . Federal Facility
STATE MASTER (California - Hazardous Waste Tracking) - HAZARDOU WASTE PROGRAM Small Quantity Generators, between 100 kg and 1000 kg of hazardous waste/month (Resource Conservation and Recovery Act (tracking hazardous waste)) - notification Organizations: EQUILON ENTERPRISES, LLC (CONTACT/OWNER)
Alternative names: SHELL OIL CO
FOSTER ELEMENTARY (6550 51ST ST. in SAN DIEGO, CA)
(National Center for Education Statistics) - STATE ID-6039598 Organizations: SAN DIEGO UNIFIED (SCHOOL DISTRICT)
HEARST ELEMENTARY (6230 DEL CERRO BLVD. in SAN DIEGO, CA)
(National Center for Education Statistics) - STATE ID-6039739 Organizations: SAN DIEGO UNIFIED (SCHOOL DISTRICT)
LEWIS MIDDLE (5170 GREENBRIER AVE. in SAN DIEGO, CA)
(National Center for Education Statistics) - STATE ID-6059638 Organizations: SAN DIEGO UNIFIED (SCHOOL DISTRICT)
MARVIN ELEMENTARY (5720 BRUNSWICK AVE. in SAN DIEGO, CA)
(National Center for Education Statistics) - STATE ID-6039960 Organizations: SAN DIEGO UNIFIED (SCHOOL DISTRICT)
AMERON SO CA DIV (7345 MISSION GORGE RD in SAN DIEGO, CA)
Housing units lacking complete plumbing facilities: 0.4% Housing units lacking complete kitchen facilities: 0.5%
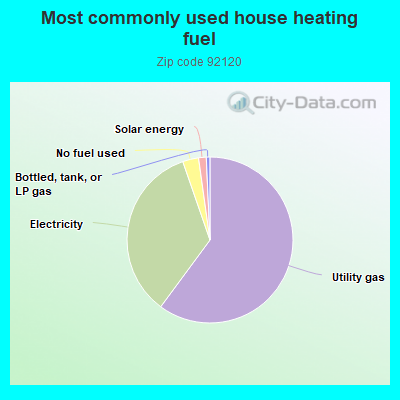
60.0%Utility gas
34.5%Electricity
3.1%No fuel used
1.5%Solar energy
0.7%Bottled, tank, or LP gas
Population in 1990: 25,375. Population change in the 1990s: +178 (+0.7%).
Place of birth for U.S.-born residents:
This state: 17,339
Northeast: 1,975
Midwest: 2,552
South: 2,357
West: 1,463
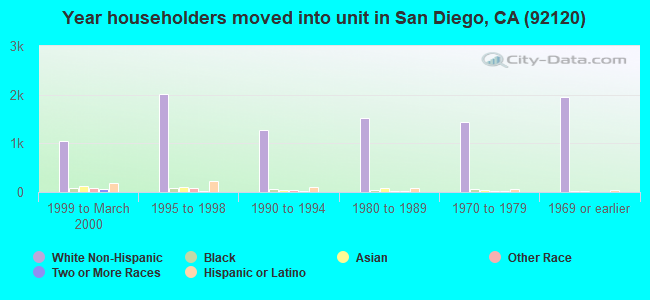
63% of the 92120 zip code residents lived in the same house 5 years ago. Out of people who lived in different houses, 71% lived in this county. Out of people who lived in different counties, 50% lived in California.
87% of the 92120 zip code residents lived in the same house 1 year ago. Out of people who lived in different houses, 58% moved from this county. Out of people who lived in different houses, 18% moved from different county within same state. Out of people who lived in different houses, 16% moved from different state. Out of people who lived in different houses, 7% moved from abroad.
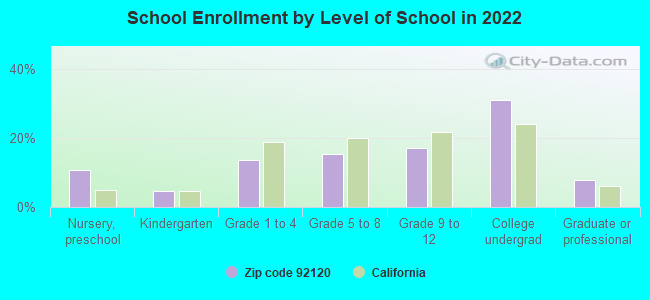
Private vs. public school enrollment:
Students in private schools in grades 1 to 8 (elementary and middle school): 144
Here:
6.6%
California:
10.5%
Students in private schools in grades 9 to 12 (high school): 30
Here:
2.3%
California:
8.5%
Students in private undergraduate colleges: 297
Here:
12.6%
California:
15.9%
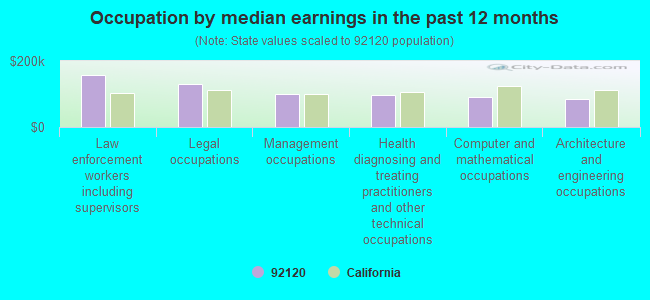
Occupation by median earnings in the past 12 months ($)
157,288Law enforcement workers including supervisors
130,147Legal occupations
100,377Management occupations
96,500Health diagnosing and treating practitioners and other technical occupations
91,204Computer and mathematical occupations
84,434Architecture and engineering occupations
Companies with biggest federal contracts located in this zip code (SAN DIEGO, CA):
DIAMOND CONCRETE SUPPLY, INC (6974 MISSION GORGE ROAD) : $1,807,529 in 17 contractsfrom 2000 to 2006
Contracts for Tile, Brick, and Block, Miscellaneous Construction Materials, Mineral Construction Materials, Bulk, Seeds and Nursery Stock, and moreby Immigration and Naturalization Service, Army, U.S. Army Corps of Engineers - civil program financing only, Bureau of Immigration and Customs Enforcement, and others Signed by year:2000: $776,000; 2001: $150,000; 2002: $551,000; 2003: $100,000; 2004: $0; 2005: $230,475; 2006: $54.
Biggest contracts:
$726,000 with Immigration and Naturalization Service for Tile, Brick, and Block. Signed on 2000-09-15. Completion date: 2001-01-15.
$281,000 with Immigration and Naturalization Service for Miscellaneous Construction Materials. Signed on 2002-09-15. Completion date: 2002-10-15.
$105,000 with Army for Mineral Construction Materials, Bulk. Signed on 2005-08-26. Completion date: 2006-01-31.
$105,000 with U.S. Army Corps of Engineers - civil program financing only for Mineral Construction Materials, Bulk. Signed on 2005-08-26. Completion date: 2006-01-31.
ANCHOR HARBOR SERVICES, INCORP (6436 LOCHMOOR DRIVE; small business) : $1,261,308 in 16 contractsfrom 2003 to 2006
Contracts for Other Quality Control, Testing and Inspection Services -- Special Industry Machinery, Motor Vehicle Maintenance and Repair Shop Specialized Equipment, Small Craft, Ship and Boat Propulsion Components, and moreby Navy, Department of Defense Signed by year:2000: $0; 2001: $0; 2002: $0; 2003: $113,841; 2004: $147,500; 2005: $869,767; 2006: $130,200.
Biggest contracts:
$326,000 with Navy for Other Quality Control, Testing and Inspection Services -- Special Industry Machinery. Signed on 2005-09-30. Completion date: 2006-09-30.
$122,000 with Navy for Motor Vehicle Maintenance and Repair Shop Specialized Equipment. Signed on 2006-04-21. Completion date: 2005-04-20.
$120,000, same as above.Signed on 2005-04-12. Completion date: 2005-04-20.
$118,000, same as above.Signed on 2004-04-21. Completion date: 2005-04-20.
BENDIX CONTRACTING CORPORATION (8861 BALBOA AVENUE; small business) : $1,028,749 in 18 contractsfrom 2000 to 2003
Contracts for Maintenance, Repair or Alteration of Real Property -- Hospitals and Infirmaries, Maintenance, Repair or Alteration of Real Property -- Other Non-Building Facilities, Construction of Structures and Facilities -- Other Non-Building Facilities, Maintenance, Repair or Alteration of Real Property -- Other Industrial Buildings, and moreby Department of Veterans Affairs, Navy Signed by year:2000: $957,511; 2001: $75,790; 2002: $0; 2003: -$4,552; 2004: $0; 2005: $0; 2006: $0.
Biggest contracts:
$473,000 with Department of Veterans Affairs for Maintenance, Repair or Alteration of Real Property -- Hospitals and Infirmaries. Signed on 2000-03-15. Completion date: 2000-07-15.
$198,821 with Navy for Maintenance, Repair or Alteration of Real Property -- Other Non-Building Facilities. Signed on 2000-09-21. Completion date: 2001-02-17.
$66,202, same as above.Signed on 2000-08-01. Completion date: 2000-12-28.
$59,301, same as above.Signed on 2000-11-17. Completion date: 2001-03-01.
G DAVIDSON COMPANY INC (4709 VANDEVER AVENUE; small business) : $808,931 in 9 contractsfrom 2000 to 2003
Contracts for Construction of Structures and Facilities -- Production Buildings, Maintenance, Repair or Alteration of Real Property -- Family Housing Facilities by Navy Signed by year:2000: $446,167; 2001: $369,694; 2002: $160,343; 2003: -$167,273; 2004: $0; 2005: $0; 2006: $0.
Biggest contracts:
$446,167 with Navy for Construction of Structures and Facilities -- Production Buildings. Signed on 2000-08-11. Completion date: 2001-08-26.
$184,800 with Navy for Maintenance, Repair or Alteration of Real Property -- Family Housing Facilities. Signed on 2001-09-27. Completion date: 2002-01-31.
$167,273, same as above.Signed on 2002-09-30. Completion date: 2003-07-07.
$166,783, same as above.Signed on 2001-09-27. Completion date: 2002-01-31.
AUTOMATED LEARNING SYSTEMS, IN (4410 GLACIER AVE; small business) : $697,888 in 32 contractsfrom 1999 to 2006
Contracts for Miscellaneous Engines and Components, Valves, Nonpowered, Power and Hand Pumps, Hand Tools, Power Driven, and moreby Navy, Defense Logistics Agency Signed by year:2000: $225,817; 2001: $44,296; 2002: $185,745; 2003: -$980; 2004: $23,099; 2005: $150,427; 2006: $36,409.
Biggest contracts:
$95,803 with Navy for Miscellaneous Engines and Components. Taking place in SC. Signed on 2000-12-15. Completion date: 2000-12-22.
$82,280 with Navy for Valves, Nonpowered. Signed on 2002-12-19. Completion date: 2003-06-02.
$80,006 with Defense Logistics Agency for Power and Hand Pumps. Signed on 2005-10-29. Completion date: 2006-02-06.
$46,757 with Navy for Hand Tools, Power Driven. Signed on 2000-03-08. Completion date: 2000-05-15.
FLAME SPRAY, INC (4674 ALVARADO CANYON RD; small business) : $379,901 in 5 contractsfrom 2001 to 2005
Contracts for Miscellaneous Special Industry Machinery, Maintenance, Repair and Rebuilding of Equipment -- Miscellaneous, Maintenance, Repair and Rebuilding of Equipment -- Valves by Navy Signed by year:2000: $0; 2001: $195,984; 2002: $0; 2003: $182,602; 2004: $0; 2005: $1,315; 2006: $0.
Biggest contracts:
$195,984 with Navy for Miscellaneous Special Industry Machinery. Signed on 2001-06-28. Completion date: 2001-08-17.
$99,456 with Navy for Maintenance, Repair and Rebuilding of Equipment -- Miscellaneous. Signed on 2003-08-14. Completion date: 2003-09-30.
$83,146, same as above.Signed on 2003-09-25. Completion date: 2003-12-31.
$719 with Navy for Maintenance, Repair and Rebuilding of Equipment -- Valves. Signed on 2005-05-05. Completion date: 2005-05-19.
LOCATOR SERVICES INC (5959 MISSION GEORGE ROAD,; small business) : $277,880 in 5 contractsfrom 2001 to 2005
Contracts for Guard Services by Navy Signed by year:2000: $0; 2001: $28,946; 2002: $61,485; 2003: $61,485; 2004: $62,982; 2005: $62,982; 2006: $0.
Biggest contracts:
$62,982 with Navy for Guard Services. Signed on 2005-08-03. Completion date: 2004-09-30.
$62,982, same as above.Signed on 2004-09-29. Completion date: 2004-09-30.
$61,485, same as above.Signed on 2003-06-17. Completion date: 2004-09-30.
$61,485, same as above.Signed on 2002-09-06. Completion date: 2003-09-30.
VALLEY DOOR AND WINDOW COMPANY (5857 MISSION GORGE ROAD; small business) : $271,085 in 3 contractsfrom 2001 to 2002
$206,672 with Navy for Maintenance, Repair or Alteration of Real Property -- Other Administrative Facilities and Service Buildings. Signed on 2001-09-28. Completion date: 2001-12-31.
$58,930, same as above.Signed on 2002-09-30. Completion date: 2002-12-13.
$5,483, same as above.Signed on 2001-12-13. Completion date: 2001-12-31.
NATIONAL SECURITY WORKS (4440 RAINIER AVE STE 210; small business) : $202,906 in 8 contractsfrom 2004 to 2006
Contracts for Miscellaneous Alarm, Signal and Security Detection Systems, Fire Fighting Equipment, Maintenance, Repair and Rebuilding of Equipment -- Alarm, Signal, and Security Detection Systems, Miscellaneous Items by Navy, U.S. Special Operations Command, Department of Defense Signed by year:2000: $0; 2001: $0; 2002: $0; 2003: $0; 2004: $73,390; 2005: $122,128; 2006: $7,388.
Biggest contracts:
$84,179 with Navy for Miscellaneous Alarm, Signal and Security Detection Systems. Signed on 2005-06-17. Completion date: 2005-08-03.
$59,990 with U.S. Special Operations Command for Fire Fighting Equipment. Signed on 2004-09-17. Completion date: 2004-10-22.
$13,900 with Navy for Maintenance, Repair and Rebuilding of Equipment -- Alarm, Signal, and Security Detection Systems. Signed on 2005-12-21. Completion date: 2005-11-30.
$13,400, same as above.Signed on 2004-11-18. Completion date: 2005-11-30.
PEGGY HOFFMAN (5421 FONTAINE ST; small business) : $163,866 in 4 contractsfrom 2000 to 2002
$68,841 with Navy for Radiology Services. Signed on 2001-10-01. Completion date: 2002-09-30.
$66,712, same as above.Signed on 2000-10-01. Completion date: 2004-09-30.
$28,313, same as above.Signed on 2002-10-01. Completion date: 2002-09-30.
$0, same as above.Signed on 2000-10-01. Completion date: 2004-09-30.
Top industries in this zip code by the number of employees in 2005:
Health Care and Social Assistance: General Medical and Surgical Hospitals (over 1000 employees: 2 establishments)
Health Care and Social Assistance: Offices of Physicians (except Mental Health Specialists) (over 1000: 1, 250-499: 1, 100-249: 1, 50-99: 2, 20-49: 3, 10-19: 15, 5-9: 20, 1-4: 58)
Administrative and Support and Waste Management and Remediation Services: Security Guards and Patrol Services (250-499: 1, 100-249: 1, 50-99: 4, 20-49: 1, 10-19: 3, 1-4: 4)
2005 - 2018 National Fire Incident Reporting System (NFIRS) incidents
Based on the data from the years 2005 - 2018 the average number of fires per year is 28. The highest number of reported fires - 57 took place in 2014, and the least - 0 in 2006. The data has a rising trend.
When looking into fire subcategories, the most reports belonged to: Structure Fires (39.6%), and Mobile Property/Vehicle Fires (26.9%).
Fire incident types reported to NFIRS in Zip Code 92120
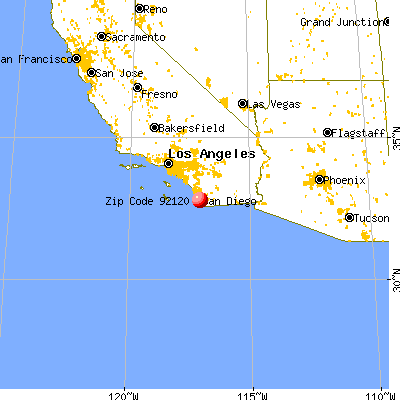


 Nearest zip codes: 92115, 92124, 92119, 91942, 92116, 92105.


 Based on the data from the years 2005 - 2018 the average number of fires per year is 28. The highest number of reported fires - 57 took place in 2014, and the least - 0 in 2006. The data has a rising trend.
 When looking into fire subcategories, the most reports belonged to: Structure Fires (39.6%), and Mobile Property/Vehicle Fires (26.9%).