Crime rate in Chula Vista, California (CA): murders, rapes, robberies, assaults, burglaries, thefts, auto thefts, arson, law enforcement employees, police officers, crime map
Crime rate in Chula Vista, CA
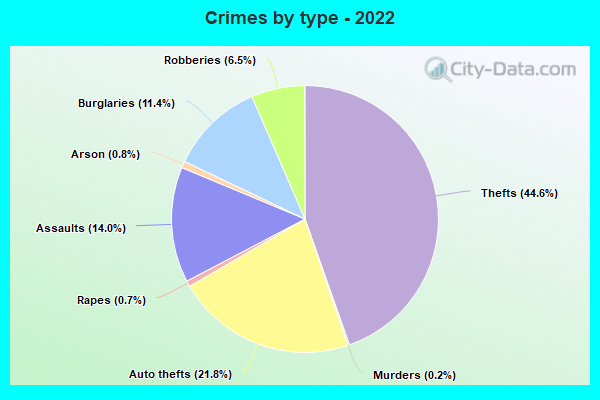
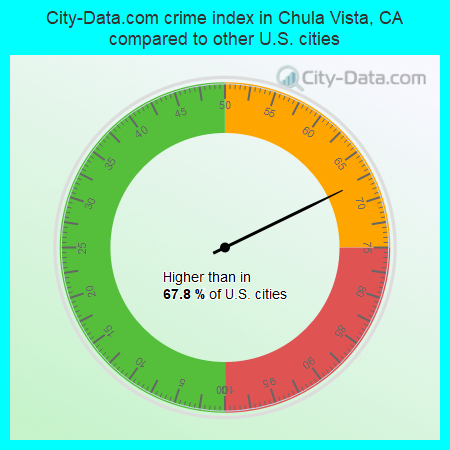
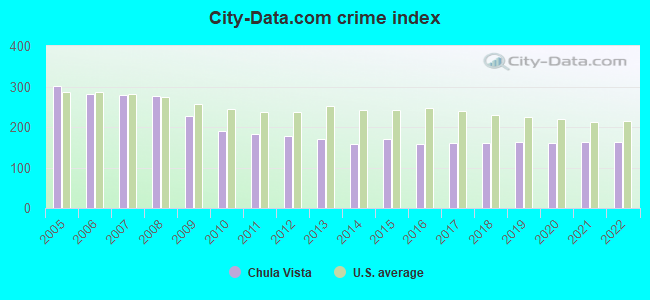
The 2022 crime rate in Chula Vista, CA is 164 (City-Data.com crime index), which is 1.5 times lower than the U.S. average. It was higher than in 67.8% U.S. cities. The 2022 Chula Vista crime rate rose by 0% compared to 2021. The number of homicides stood at 8 - a decrease of 1 compared to 2021. In the last 5 years Chula Vista has seen rise of violent crime and increasing property crime.See how dangerous Chula Vista, CA is compared to the nearest cities:
(Note: Higher means more crime)
(Note: Higher means more crime)
| Chula Vista: | 164.1 |
| National City: | 306.9 |
| Imperial Beach: | 168.2 |
| Lemon Grove: | 266.4 |
| Coronado: | 175.9 |
| La Mesa: | 187.2 |
| San Diego: | 219.4 |
| El Cajon: | 206.6 |
| Santee: | 114.9 |
The City-Data.com crime index weighs serious crimes and violent crimes more heavily. Higher means more crime, U.S. average is 246.1. It adjusts for the number of visitors and daily workers commuting into cities.
- means the value is smaller than the state average.- means the value is about the same as the state average.
- means the value is bigger than the state average.
- means the value is much bigger than the state average.
According to our research of California and other state lists, there were 204 registered sex offenders living in Chula Vista, California as of April 26, 2024.
The ratio of all residents to sex offenders in Chula Vista is 1,310 to 1.
The ratio of registered sex offenders to all residents in this city is lower than the state average.
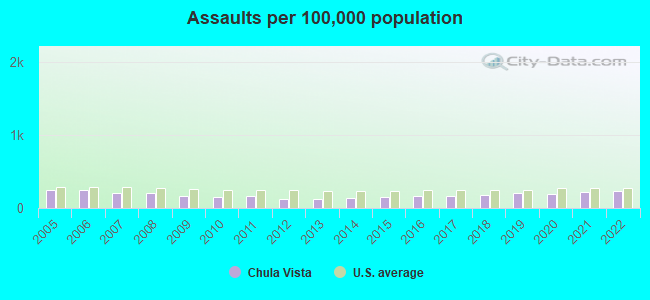
Violent crime rate in 2022
| Chula Vista: | 185.6 |
| U.S. Average: | 219.8 |
Violent crime rate in 2021
| Chula Vista: | 185.7 |
| U.S. Average: | 224.8 |
Violent crime rate in 2020
| Chula Vista: | 181.5 |
| U.S. Average: | 228.2 |
Violent crime rate in 2019
| Chula Vista: | 176.9 |
| U.S. Average: | 219.9 |
Violent crime rate in 2018
| Chula Vista: | 169.8 |
| U.S. Average: | 221.2 |
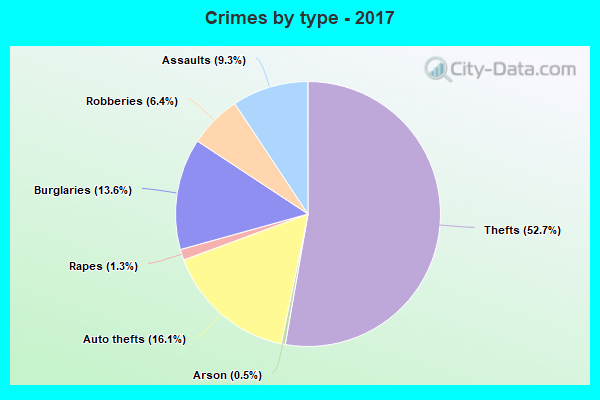
Violent crime rate in 2017
| Chula Vista: | 161.6 |
| U.S. Average: | 226.2 |
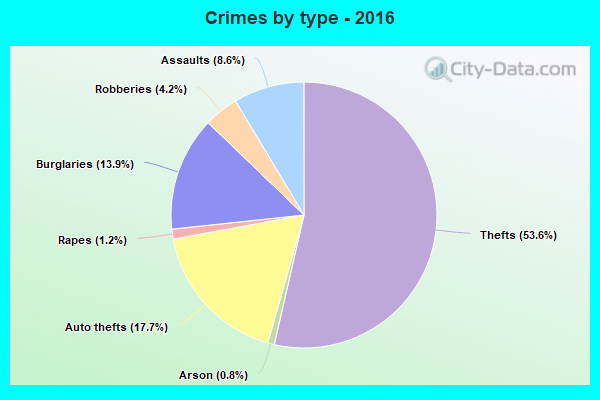
Violent crime rate in 2016
| Chula Vista: | 140.1 |
| U.S. Average: | 227.3 |
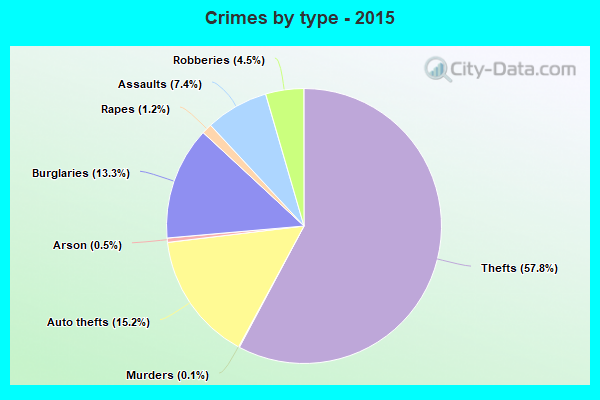
Violent crime rate in 2015
| Chula Vista: | 148.2 |
| U.S. Average: | 219.3 |
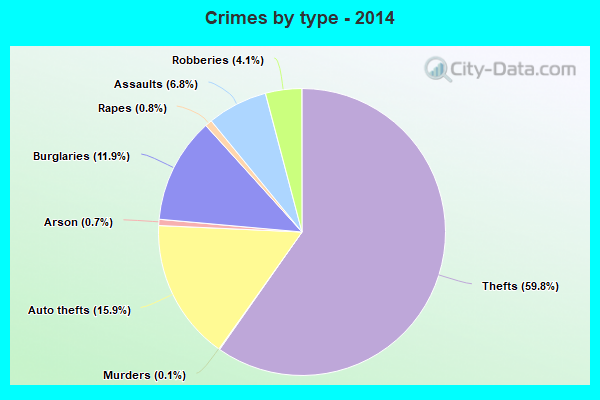
Violent crime rate in 2014
| Chula Vista: | 129.5 |
| U.S. Average: | 211.1 |
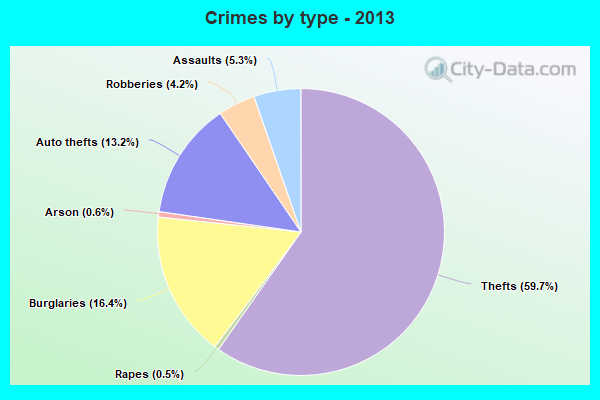
Violent crime rate in 2013
| Chula Vista: | 123.5 |
| U.S. Average: | 214.2 |
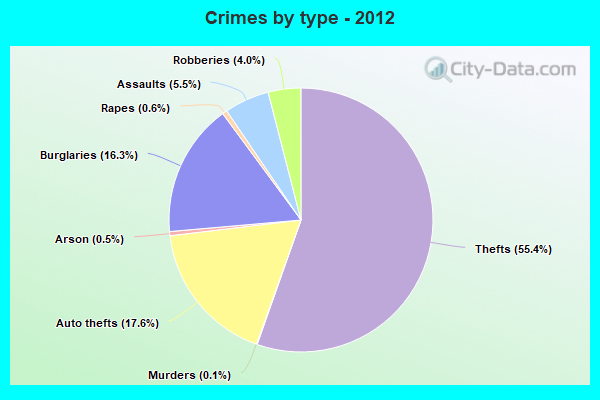
Violent crime rate in 2012
| Chula Vista: | 127.7 |
| U.S. Average: | 187.4 |
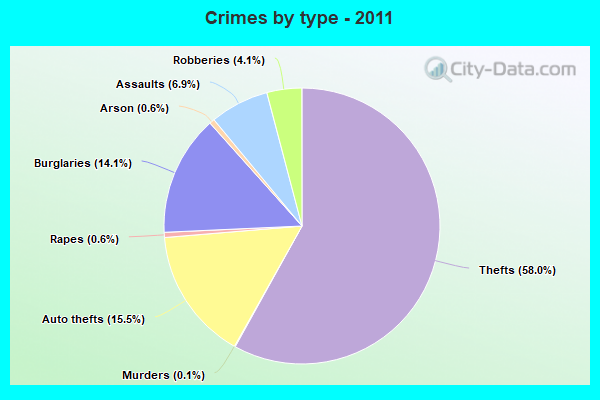
Violent crime rate in 2011
| Chula Vista: | 146.3 |
| U.S. Average: | 187.1 |
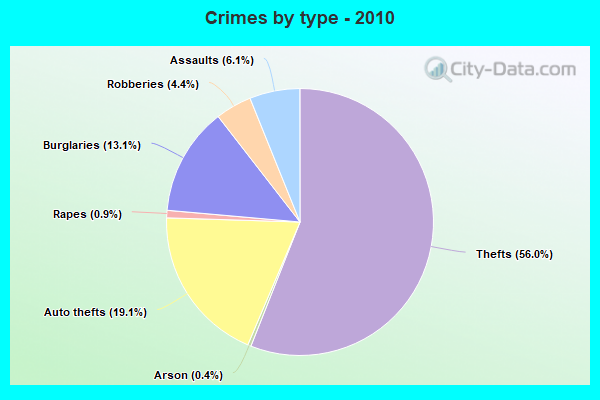
Violent crime rate in 2010
| Chula Vista: | 148.2 |
| U.S. Average: | 195.7 |
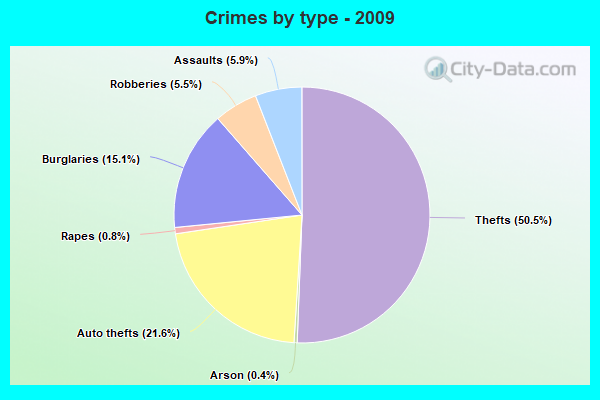
Violent crime rate in 2009
| Chula Vista: | 179.7 |
| U.S. Average: | 208.9 |
Violent crime rate in 2008
| Chula Vista: | 202.5 |
| U.S. Average: | 222.5 |
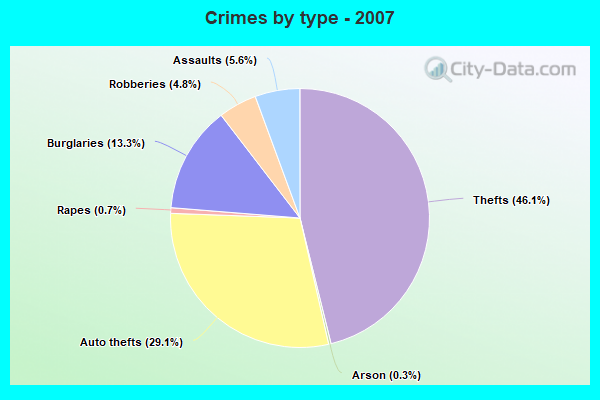
Violent crime rate in 2007
| Chula Vista: | 201.6 |
| U.S. Average: | 229.1 |
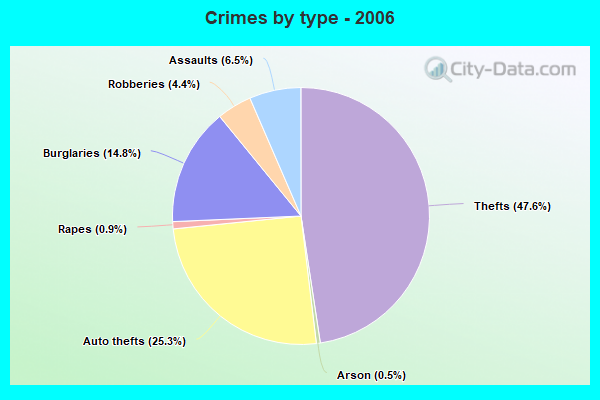
Violent crime rate in 2006
| Chula Vista: | 215.1 |
| U.S. Average: | 232.6 |
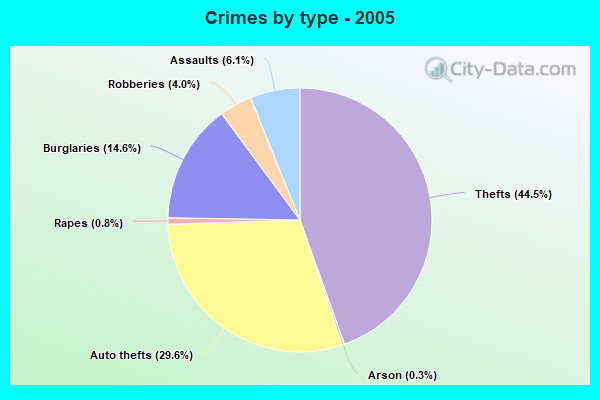
Violent crime rate in 2005
| Chula Vista: | 215.1 |
| U.S. Average: | 227.0 |
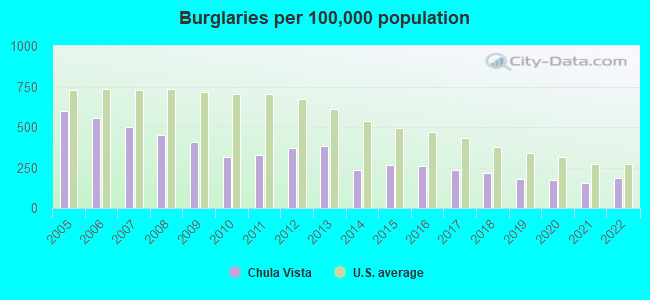
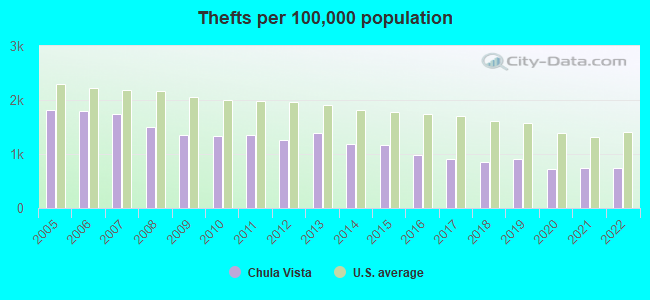
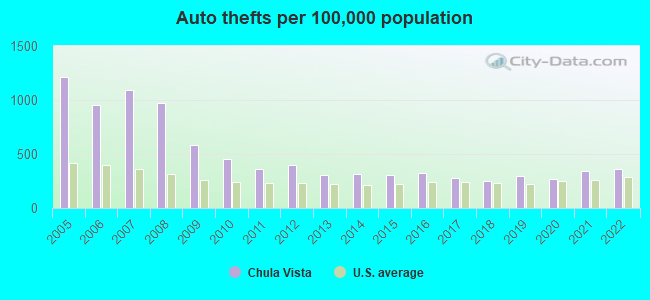
Property crime rate in 2022
| Chula Vista: | 127.7 |
| U.S. Average: | 166.5 |
Property crime rate in 2021
| Chula Vista: | 119.4 |
| U.S. Average: | 157.8 |
Property crime rate in 2020
| Chula Vista: | 111.6 |
| U.S. Average: | 169.6 |
Property crime rate in 2019
| Chula Vista: | 125.9 |
| U.S. Average: | 179.7 |
Property crime rate in 2018
| Chula Vista: | 122.9 |
| U.S. Average: | 190.2 |
Property crime rate in 2017
| Chula Vista: | 135.1 |
| U.S. Average: | 206.4 |
Property crime rate in 2016
| Chula Vista: | 150.0 |
| U.S. Average: | 216.6 |
Property crime rate in 2015
| Chula Vista: | 158.0 |
| U.S. Average: | 221.5 |
Property crime rate in 2014
| Chula Vista: | 154.0 |
| U.S. Average: | 230.8 |
Property crime rate in 2013
| Chula Vista: | 191.3 |
| U.S. Average: | 250.4 |
Property crime rate in 2012
| Chula Vista: | 197.4 |
| U.S. Average: | 267.3 |
Property crime rate in 2011
| Chula Vista: | 186.3 |
| U.S. Average: | 273.5 |
Property crime rate in 2010
| Chula Vista: | 197.2 |
| U.S. Average: | 276.4 |
Property crime rate in 2009
| Chula Vista: | 235.8 |
| U.S. Average: | 285.6 |
Property crime rate in 2008
| Chula Vista: | 310.5 |
| U.S. Average: | 302.2 |
Property crime rate in 2007
| Chula Vista: | 308.9 |
| U.S. Average: | 309.2 |
Property crime rate in 2006
| Chula Vista: | 303.6 |
| U.S. Average: | 317.3 |
Property crime rate in 2005
| Chula Vista: | 345.4 |
| U.S. Average: | 322.3 |

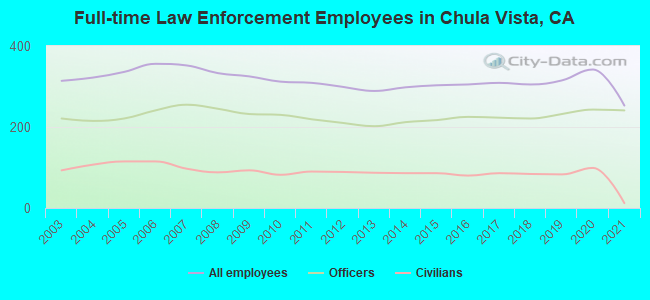
Full-time law enforcement employees in 2021, including police officers: 253 (241 officers - 194 male; 47 female).
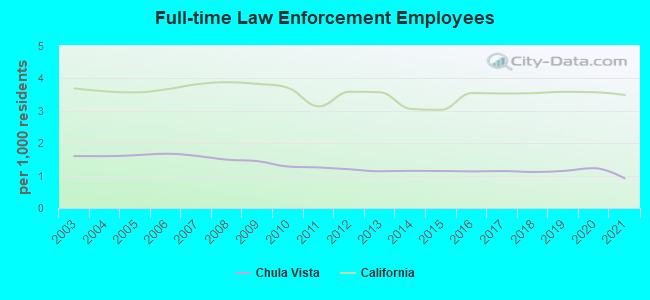
| Officers per 1,000 residents here: | 0.87 |
| California average: | 2.30 |
Full-time law enforcement employees in 2020, including police officers: 342 (243 officers - 197 male; 46 female).
| Officers per 1,000 residents here: | 0.87 |
| California average: | 2.36 |
Full-time law enforcement employees in 2019, including police officers: 315 (232 officers - 195 male; 37 female).
| Officers per 1,000 residents here: | 0.84 |
| California average: | 2.35 |
Full-time law enforcement employees in 2018, including police officers: 305 (221 officers - 187 male; 34 female).
| Officers per 1,000 residents here: | 0.81 |
| California average: | 2.34 |
Full-time law enforcement employees in 2017, including police officers: 309 (223 officers - 193 male; 30 female).
| Officers per 1,000 residents here: | 0.82 |
| California average: | 2.32 |
Full-time law enforcement employees in 2016, including police officers: 305 (225 officers - 196 male; 29 female).
| Officers per 1,000 residents here: | 0.83 |
| California average: | 2.32 |
Full-time law enforcement employees in 2015, including police officers: 303 (217 officers - 187 male; 30 female).
| Officers per 1,000 residents here: | 0.82 |
| California average: | 1.98 |
Full-time law enforcement employees in 2014, including police officers: 298 (212 officers - 184 male; 28 female).
| Officers per 1,000 residents here: | 0.82 |
| California average: | 2.00 |
Full-time law enforcement employees in 2013, including police officers: 289 (202 officers - 179 male; 23 female).
| Officers per 1,000 residents here: | 0.79 |
| California average: | 2.34 |
Full-time law enforcement employees in 2012, including police officers: 299 (210 officers - 189 male; 21 female).
| Officers per 1,000 residents here: | 0.84 |
| California average: | 2.36 |
Full-time law enforcement employees in 2011, including police officers: 309 (219 officers - 198 male; 21 female).
| Officers per 1,000 residents here: | 0.89 |
| California average: | 2.09 |
Full-time law enforcement employees in 2010, including police officers: 312 (230 officers - 204 male; 26 female).
| Officers per 1,000 residents here: | 0.94 |
| California average: | 2.46 |
Full-time law enforcement employees in 2009, including police officers: 325 (232 officers - 206 male; 26 female).
| Officers per 1,000 residents here: | 1.03 |
| California average: | 2.52 |
Full-time law enforcement employees in 2008, including police officers: 333 (245 officers - 223 male; 22 female).
| Officers per 1,000 residents here: | 1.10 |
| California average: | 2.55 |
Full-time law enforcement employees in 2007, including police officers: 352 (255 officers - 230 male; 25 female).
| Officers per 1,000 residents here: | 1.17 |
| California average: | 2.48 |
Full-time law enforcement employees in 2006, including police officers: 356 (241 officers - 218 male; 23 female).
| Officers per 1,000 residents here: | 1.13 |
| California average: | 2.38 |
Full-time law enforcement employees in 2005, including police officers: 336 (221 officers - 197 male; 24 female).
| Officers per 1,000 residents here: | 1.07 |
| California average: | 2.34 |
Full-time law enforcement employees in 2004, including police officers: 322 (215 officers - 191 male; 24 female).
| Officers per 1,000 residents here: | 1.07 |
| California average: | 2.36 |
Full-time law enforcement employees in 2003, including police officers: 314 (221 officers - 197 male; 24 female).
| Officers per 1,000 residents here: | 1.13 |
| California average: | 2.42 |