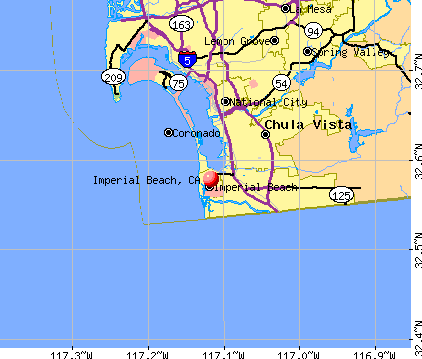
Imperial Beach, California
Imperial Beach: IB Forum (Bar & Grill)
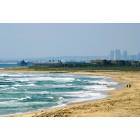
Imperial Beach: Imperial Beach & San Diego, California
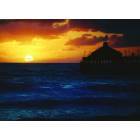
Imperial Beach: Portwood Pier, Imperial Beach (San Diego), California
Imperial Beach: Volkswagen bus
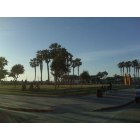
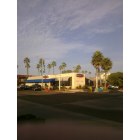
Imperial Beach: Palm Avenue & Silver Strand intersection
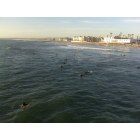
Imperial Beach: Imperial Beach surfers
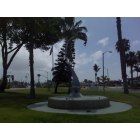
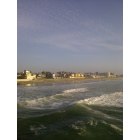
Imperial Beach: Imperial Beach
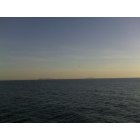
Imperial Beach: Coronado Islands from Imperial Beach
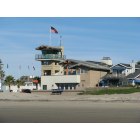
Imperial Beach: Imperial Beach Lifeguard Station
Imperial Beach: IB Forum
Imperial Beach: Imperial Beach from pier (south)
- see
21
more - add
your
Submit your own pictures of this city and show them to the world
- OSM Map
- General Map
- Google Map
- MSN Map
Population change since 2000: -4.4%
 |
| Males: 13,116 | |
| Females: 12,675 |
| Median resident age: | 34.3 years |
| California median age: | 37.9 years |
Zip codes: 91932.
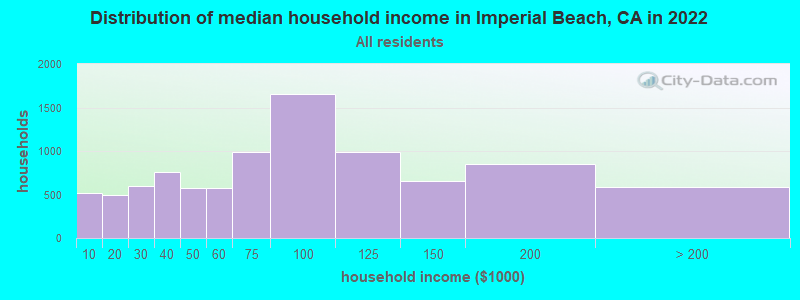
| Imperial Beach: | $77,257 |
| CA: | $91,551 |
Estimated per capita income in 2022: $34,083 (it was $16,003 in 2000)
Imperial Beach city income, earnings, and wages data
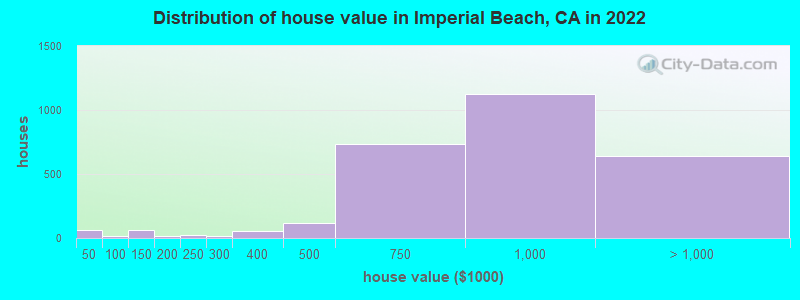
Estimated median house or condo value in 2022: $868,664 (it was $168,000 in 2000)
| Imperial Beach: | $868,664 |
| CA: | $715,900 |
Mean prices in 2022: all housing units: over $1,000,000; detached houses: over $1,000,000; townhouses or other attached units: $769,037; in 2-unit structures: over $1,000,000; in 3-to-4-unit structures: $948,790; in 5-or-more-unit structures: $697,244; mobile homes: $174,850; occupied boats, rvs, vans, etc.: $27,331
Median gross rent in 2022: $1,872.
Imperial Beach, CA residents, houses, and apartments details
(12.3% for White Non-Hispanic residents, 50.6% for Black residents, 16.0% for Hispanic or Latino residents, 41.1% for American Indian residents, 19.1% for other race residents, 9.1% for two or more races residents)
Detailed information about poverty and poor residents in Imperial Beach, CA

Compare current foreclosures near Imperial Beach, CA:
| Photo | Address | Area | Beds / Baths | Price | Details |
|---|---|---|---|---|---|

|
#1
Hickory Ct
Imperial Beach, CA 91932
|
1,408 sq. feet
|
2 baths 3 beds |
show details | |

|
#2
Seacoast Dr Unit 12
Imperial Beach, CA 91932
|
909 sq. feet
|
1 baths 2 beds |
show details | |

|
#3
8th St
Imperial Beach, CA 91932
|
813 sq. feet
|
1 baths 2 beds |
show details | |

|
#4
12th St
Imperial Beach, CA 91932
|
2,277 sq. feet
|
3 baths 5 beds |
show details | |

|
#5
14th St
Imperial Beach, CA 91932
|
- sq. feet
|
- baths - beds |
show details | |

|
#6
10th St
Imperial Beach, CA 91932
|
- sq. feet
|
- baths - beds |
show details | |

|
#7
12th St
Imperial Beach, CA 91932
|
- sq. feet
|
- baths - beds |
show details | |

|
#8
15th St
Imperial Beach, CA 91932
|
- sq. feet
|
- baths - beds |
show details | |

|
#9
13th St
Imperial Beach, CA 91932
|
- sq. feet
|
- baths - beds |
show details | |

|
#10
Grove Ave # 7
Imperial Beach, CA 91932
|
- sq. feet
|
- baths - beds |
show details |
| Photo | Address | Area | Beds / Baths | Price | Details |
|---|---|---|---|---|---|

|
#11
13th St
Imperial Beach, CA 91932
|
- sq. feet
|
- baths - beds |
show details | |

|
#12
Palm Ave
Imperial Beach, CA 91932
|
- sq. feet
|
- baths - beds |
show details | |

|
#13
Donax Ave Apt A
Imperial Beach, CA 91932
|
- sq. feet
|
- baths - beds |
show details | |

|
#14
Grove Ave
Imperial Beach, CA 91932
|
1,976 sq. feet
|
- baths - beds |
show details | |

|
#15
13th St Apt 219
Imperial Beach, CA 91932
|
- sq. feet
|
- baths - beds |
show details | |

|
#16
13th St, Ste 102 Pmb 105
Imperial Beach, CA 91932
|
- sq. feet
|
- baths - beds |
show details | |

|
#17
Otay Valley Rd Unit A
Chula Vista, CA 91911
|
1,212 sq. feet
|
2 baths 3 beds |
show details | |

|
#18
J St Unit 212
San Diego, CA 92101
|
623 sq. feet
|
1 baths 1 beds |
show details | |

|
#19
25th St
San Diego, CA 92102
|
1,661 sq. feet
|
2 baths 4 beds |
show details | |

|
#20
Macawa Ave
San Diego, CA 92123
|
900 sq. feet
|
1 baths 3 beds |
show details |
| Photo | Address | Area | Beds / Baths | Price | Details |
|---|---|---|---|---|---|

|
#21
45th St
San Diego, CA 92115
|
1,064 sq. feet
|
1 baths 2 beds |
show details | |

|
#22
Rangeview St
Spring Valley, CA 91977
|
- sq. feet
|
1 baths 3 beds |
show details | |

|
#23
S 41st St
San Diego, CA 92113
|
- sq. feet
|
1 baths 2 beds |
show details | |

|
#24
Choctaw Dr
San Diego, CA 92115
|
2,455 sq. feet
|
3 baths 5 beds |
show details | |

|
#25
E Rienstra St
Chula Vista, CA 91911
|
1,350 sq. feet
|
1 baths 3 beds |
show details | |

|
#26
Palmer Way
National City, CA 91950
|
1,183 sq. feet
|
2 baths 2 beds |
show details | |

|
#27
Alleghany St
San Diego, CA 92139
|
744 sq. feet
|
1 baths 2 beds |
show details | |

|
#28
Rhode Island St
San Diego, CA 92116
|
1,376 sq. feet
|
2 baths 3 beds |
show details | |

|
#29
Carver St
Chula Vista, CA 91911
|
1,475 sq. feet
|
3 baths 4 beds |
show details | |

|
#30
Maria Ave
Spring Valley, CA 91977
|
2,657 sq. feet
|
4 baths 3 beds |
show details |
| Photo | Address | Area | Beds / Baths | Price | Details |
|---|---|---|---|---|---|

|
#31
Mono Lake Dr
San Diego, CA 92119
|
1,714 sq. feet
|
2 baths 3 beds |
show details | |

|
#32
Tamayo Dr Apt 1
Chula Vista, CA 91910
|
1,006 sq. feet
|
2 baths 2 beds |
show details | |

|
#33
Florence St
San Diego, CA 92113
|
1,261 sq. feet
|
2 baths 2 beds |
show details | |

|
#34
Ramfos Cir
San Diego, CA 92139
|
1,682 sq. feet
|
2 baths 4 beds |
show details | |

|
#35
Ramona Dr
Spring Valley, CA 91977
|
1,124 sq. feet
|
2 baths 3 beds |
show details | |

|
#36
Camberley Ct
San Diego, CA 92154
|
2,231 sq. feet
|
2 baths 4 beds |
show details | |

|
#37
Lakeview Dr
Spring Valley, CA 91977
|
- sq. feet
|
2 baths 4 beds |
show details | |

|
#38
Arthur Ave
Chula Vista, CA 91910
|
- sq. feet
|
1 baths 2 beds |
show details | |

|
#39
Rancho Diego Cir
El Cajon, CA 92019
|
2,955 sq. feet
|
2 baths 4 beds |
show details | |

|
#40
Harbor Dr Unit 2404
San Diego, CA 92101
|
1,572 sq. feet
|
2 baths 2 beds |
show details |
| Photo | Address | Area | Beds / Baths | Price | Details |
|---|---|---|---|---|---|

|
#41
Tremont St
Chula Vista, CA 91911
|
912 sq. feet
|
2 baths 3 beds |
show details | |

|
#42
Myra Ct
Chula Vista, CA 91911
|
1,314 sq. feet
|
2 baths 3 beds |
show details | |

|
#43
E Chase Ave
El Cajon, CA 92020
|
2,617 sq. feet
|
3 baths 4 beds |
show details | |

|
#44
Mitra Ct
Spring Valley, CA 91977
|
1,760 sq. feet
|
2 baths 3 beds |
show details | |

|
#45
Baltimore Dr Unit 75
La Mesa, CA 91942
|
1,612 sq. feet
|
3 baths 3 beds |
show details | |

|
#46
Acheson St
San Diego, CA 92111
|
1,587 sq. feet
|
3 baths 5 beds |
show details | |

|
#47
Valley Vista Rd
Bonita, CA 91902
|
1,333 sq. feet
|
1 baths 2 beds |
show details | |

|
#48
Santa Olivia Rd
Chula Vista, CA 91913
|
2,207 sq. feet
|
2 baths 3 beds |
show details | |

|
#49
Alton Dr
Lemon Grove, CA 91945
|
1,723 sq. feet
|
2 baths 3 beds |
show details | |

|
Check over 1 million property listings on Foreclosure.com!
|
browse all offers | |||


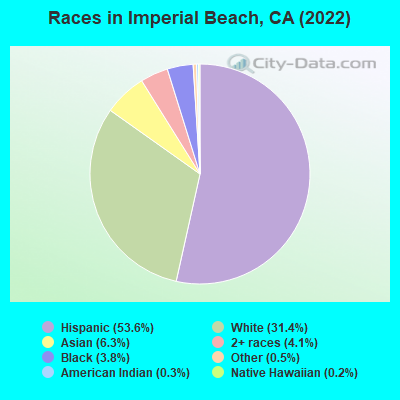
- 13,96553.6%Hispanic
- 8,18331.4%White alone
- 1,6496.3%Asian alone
- 1,0674.1%Two or more races
- 9913.8%Black alone
- 1370.5%Other race alone
- 880.3%American Indian alone
- 560.2%Native Hawaiian and Other
Pacific Islander alone
According to our research of California and other state lists, there were 20 registered sex offenders living in Imperial Beach, California as of April 27, 2024.
The ratio of all residents to sex offenders in Imperial Beach is 1,386 to 1.
The ratio of registered sex offenders to all residents in this city is lower than the state average.
Type |
2009 |
2010 |
2011 |
2012 |
2013 |
2014 |
2015 |
2016 |
2017 |
2018 |
2019 |
2020 |
2021 |
2022 |
|---|---|---|---|---|---|---|---|---|---|---|---|---|---|---|
| Murders (per 100,000) | 2 (7.6) | 0 (0.0) | 0 (0.0) | 2 (7.4) | 1 (3.7) | 0 (0.0) | 0 (0.0) | 1 (3.6) | 1 (3.6) | 0 (0.0) | 0 (0.0) | 1 (3.6) | 3 (10.9) | 2 (7.7) |
| Rapes (per 100,000) | 9 (34.0) | 9 (34.2) | 6 (22.5) | 12 (44.5) | 6 (22.2) | 8 (29.4) | 5 (18.3) | 7 (25.3) | 5 (18.1) | 3 (10.9) | 5 (18.1) | 8 (29.0) | 7 (25.5) | 3 (11.6) |
| Robberies (per 100,000) | 46 (173.7) | 23 (87.4) | 15 (56.3) | 25 (92.7) | 25 (92.6) | 19 (69.8) | 16 (58.5) | 17 (61.6) | 34 (123.2) | 18 (65.3) | 16 (58.0) | 21 (76.2) | 18 (65.6) | 25 (96.4) |
| Assaults (per 100,000) | 156 (588.9) | 113 (429.3) | 122 (458.1) | 108 (400.7) | 101 (374.1) | 85 (312.1) | 67 (245.1) | 46 (166.6) | 93 (337.0) | 58 (210.4) | 51 (184.9) | 65 (235.8) | 85 (310.0) | 73 (281.5) |
| Burglaries (per 100,000) | 125 (471.9) | 115 (436.9) | 119 (446.8) | 122 (452.6) | 125 (463.0) | 76 (279.1) | 76 (278.0) | 87 (315.0) | 69 (250.1) | 63 (228.5) | 57 (206.6) | 33 (119.7) | 31 (113.1) | 35 (135.0) |
| Thefts (per 100,000) | 237 (894.7) | 207 (786.4) | 193 (724.7) | 261 (968.2) | 228 (844.5) | 240 (881.3) | 214 (782.7) | 172 (622.8) | 211 (764.7) | 201 (729.1) | 195 (707.0) | 172 (624.1) | 154 (561.6) | 161 (620.8) |
| Auto thefts (per 100,000) | 193 (728.6) | 131 (497.6) | 121 (454.3) | 88 (326.5) | 101 (374.1) | 100 (367.2) | 69 (252.4) | 113 (409.2) | 84 (304.4) | 88 (319.2) | 79 (286.4) | 78 (283.0) | 90 (328.2) | 78 (300.8) |
| Arson (per 100,000) | 4 (15.1) | 1 (3.8) | 3 (11.3) | 0 (0.0) | 3 (11.1) | 3 (11.0) | 1 (3.7) | 2 (7.2) | 1 (3.6) | 1 (3.6) | 1 (3.6) | 4 (14.5) | 4 (14.6) | 0 (0.0) |
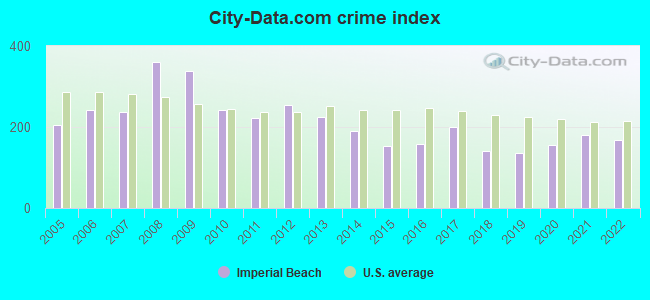
| City-Data.com crime index | 339.3 | 241.3 | 223.1 | 254.9 | 223.9 | 191.0 | 152.2 | 159.0 | 198.6 | 141.1 | 134.5 | 156.5 | 180.6 | 168.2 |
The City-Data.com crime index weighs serious crimes and violent crimes more heavily. Higher means more crime, U.S. average is 246.1. It adjusts for the number of visitors and daily workers commuting into cities.
Crime rate in Imperial Beach detailed stats: murders, rapes, robberies, assaults, burglaries, thefts, arson
Full-time law enforcement employees in 2015, including police officers: 1 (1 officers - 1 male; 0 female).
| Officers per 1,000 residents here: | 0.04 |
| California average: | 1.98 |
 Recent articles from our blog. Our writers, many of them Ph.D. graduates or candidates, create easy-to-read articles on a wide variety of topics.

 | Imperial Beach issues or not? (9 replies) |
| Imperial Beach grandmother punched in road rage attack (1 reply) |
| Sea Port Village (48 replies) |
| Goodbye Imperial Beach (47 replies) |
| Possible Relocation From Phoenix - Need Help Narrowing Down Towns (55 replies) |
| Surfers were right (14 replies) |
Latest news from Imperial Beach, CA collected exclusively by city-data.com from local newspapers, TV, and radio stations
Imperial Beach, CA City Guides:
Ancestries: American (3.7%), Irish (2.6%), English (2.2%), European (1.9%), German (1.9%).
Current Local Time: PST time zone
Elevation: 20 feet
Land area: 4.27 square miles.
Population density: 6,043 people per square mile (high).
4,452 residents are foreign born (12.9% Latin America, 3.4% Asia).
| This city: | 17.1% |
| California: | 26.5% |
Median real estate property taxes paid for housing units with mortgages in 2022: $4,618 (0.5%)
Median real estate property taxes paid for housing units with no mortgage in 2022: $3,591 (0.4%)
Nearest city with pop. 50,000+: Chula Vista, CA  (5.3 miles , pop. 173,556).
Nearest city with pop. 200,000+: San Diego, CA (14.0 miles , pop. 1,223,400).
Nearest cities:
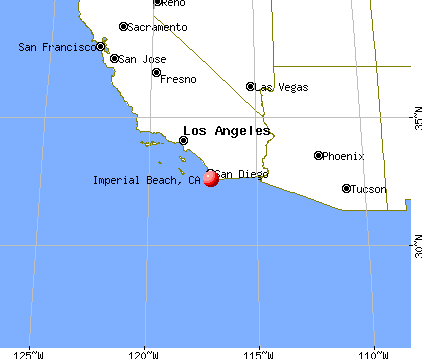
), ), Latitude: 32.58 N, Longitude: 117.12 W
Daytime population change due to commuting: -8,138 (-31.2%)
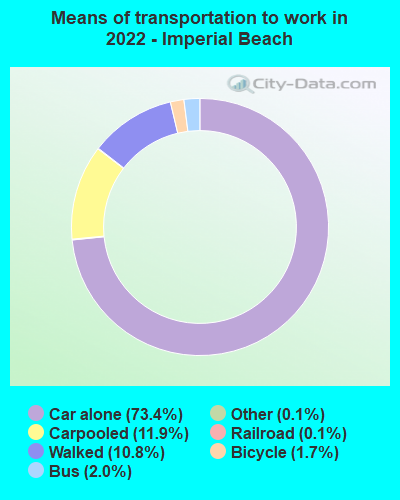
Workers who live and work in this city: 2,270 (17.0%)
Area code commonly used in this area: 619
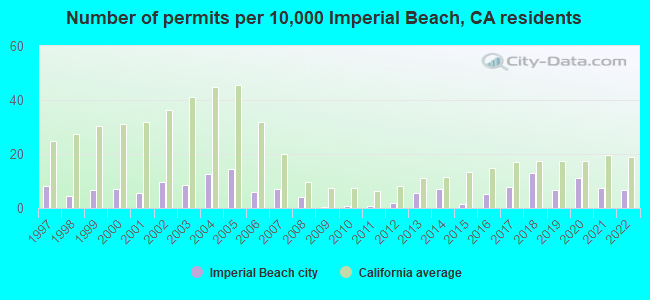
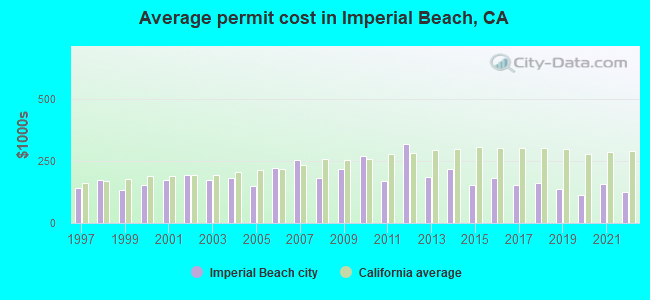
Single-family new house construction building permits:
- 2022: 18 buildings, average cost: $124,900
- 2021: 20 buildings, average cost: $158,900
- 2020: 30 buildings, average cost: $111,900
- 2019: 18 buildings, average cost: $136,700
- 2018: 35 buildings, average cost: $160,800
- 2017: 21 buildings, average cost: $152,600
- 2016: 14 buildings, average cost: $183,300
- 2015: 4 buildings, average cost: $151,700
- 2014: 19 buildings, average cost: $215,800
- 2013: 15 buildings, average cost: $186,100
- 2012: 5 buildings, average cost: $317,500
- 2011: 2 buildings, average cost: $168,400
- 2010: 2 buildings, average cost: $270,000
- 2009: 1 building, cost: $219,000
- 2008: 11 buildings, average cost: $182,600
- 2007: 19 buildings, average cost: $253,400
- 2006: 16 buildings, average cost: $222,500
- 2005: 39 buildings, average cost: $150,700
- 2004: 34 buildings, average cost: $179,600
- 2003: 23 buildings, average cost: $172,300
- 2002: 26 buildings, average cost: $194,500
- 2001: 15 buildings, average cost: $171,700
- 2000: 19 buildings, average cost: $155,000
- 1999: 18 buildings, average cost: $133,900
- 1998: 12 buildings, average cost: $172,500
- 1997: 22 buildings, average cost: $143,100
| Here: | 5.3% |
| California: | 5.1% |
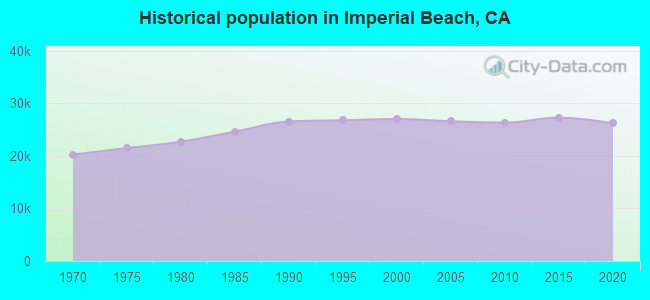
Population change in the 1990s: +335 (+1.3%).
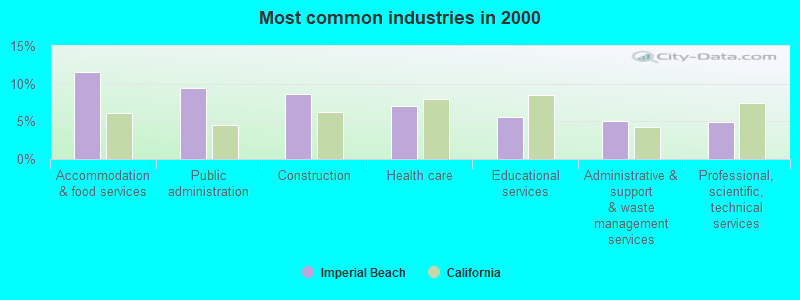
- Accommodation & food services (11.6%)
- Public administration (9.4%)
- Construction (8.6%)
- Health care (7.0%)
- Educational services (5.6%)
- Administrative & support & waste management services (5.0%)
- Professional, scientific, technical services (4.9%)
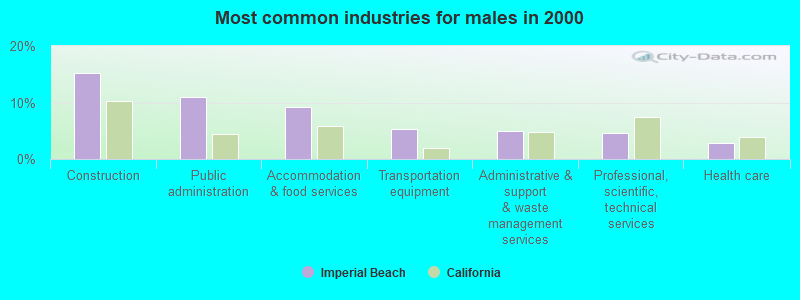
- Construction (15.2%)
- Public administration (10.9%)
- Accommodation & food services (9.2%)
- Transportation equipment (5.3%)
- Administrative & support & waste management services (5.0%)
- Professional, scientific, technical services (4.6%)
- Health care (2.9%)
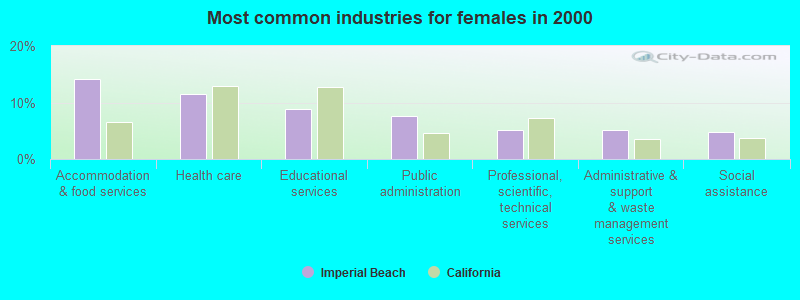
- Accommodation & food services (14.2%)
- Health care (11.4%)
- Educational services (8.8%)
- Public administration (7.6%)
- Professional, scientific, technical services (5.2%)
- Administrative & support & waste management services (5.1%)
- Social assistance (4.9%)

- Building and grounds cleaning and maintenance occupations (5.0%)
- Other office and administrative support workers, including supervisors (4.0%)
- Other sales and related occupations, including supervisors (3.8%)
- Retail sales workers, except cashiers (3.6%)
- Other management occupations, except farmers and farm managers (3.4%)
- Material recording, scheduling, dispatching, and distributing workers (3.1%)
- Cashiers (3.0%)
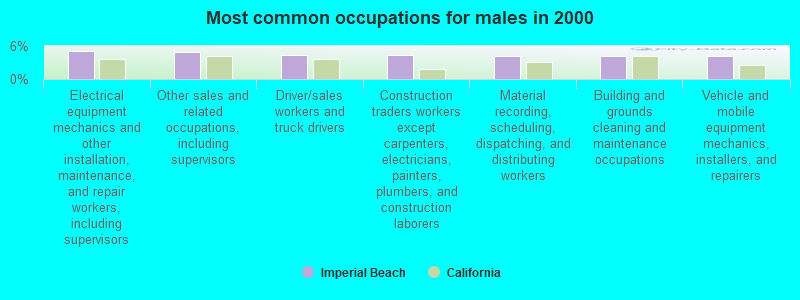
- Electrical equipment mechanics and other installation, maintenance, and repair workers, including supervisors (5.0%)
- Other sales and related occupations, including supervisors (5.0%)
- Driver/sales workers and truck drivers (4.3%)
- Construction traders workers except carpenters, electricians, painters, plumbers, and construction laborers (4.3%)
- Material recording, scheduling, dispatching, and distributing workers (4.1%)
- Building and grounds cleaning and maintenance occupations (4.1%)
- Vehicle and mobile equipment mechanics, installers, and repairers (4.1%)
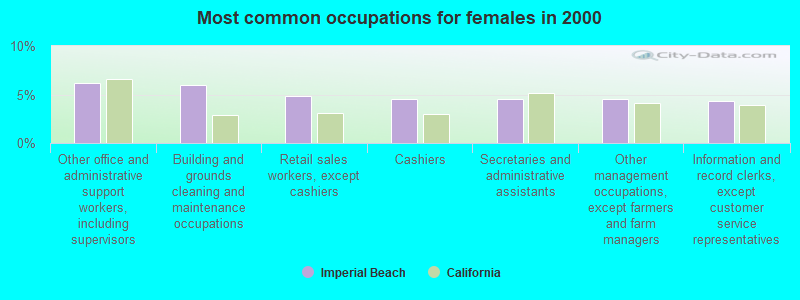
- Other office and administrative support workers, including supervisors (6.2%)
- Building and grounds cleaning and maintenance occupations (6.0%)
- Retail sales workers, except cashiers (4.8%)
- Cashiers (4.6%)
- Secretaries and administrative assistants (4.6%)
- Other management occupations, except farmers and farm managers (4.5%)
- Information and record clerks, except customer service representatives (4.3%)
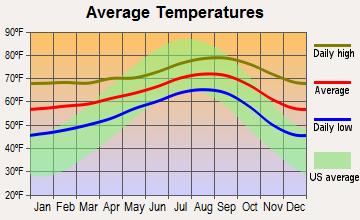
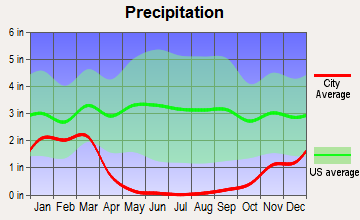
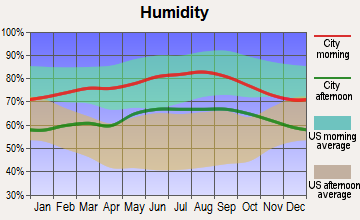
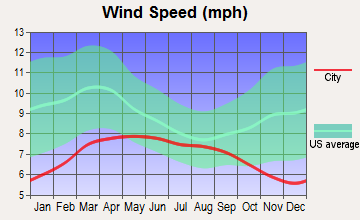
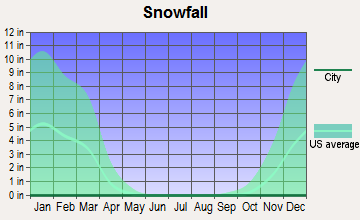
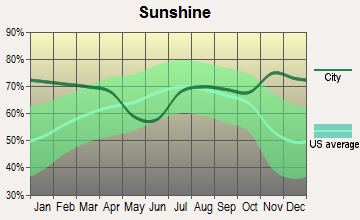
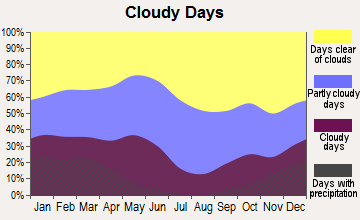
Average climate in Imperial Beach, California
Based on data reported by over 4,000 weather stations
|
|


(lower is better)
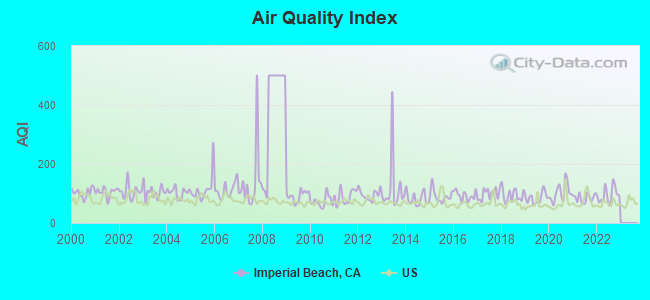
Air Quality Index (AQI) level in 2022 was 95.2. This is worse than average.
| City: | 95.2 |
| U.S.: | 72.6 |
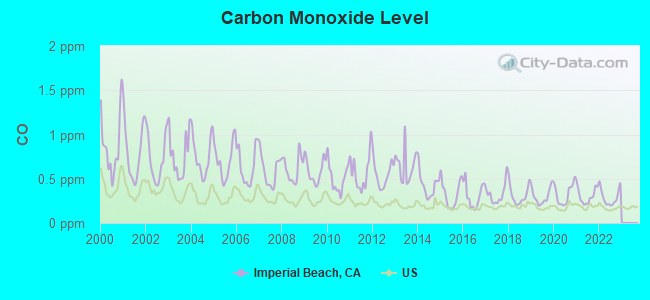
Carbon Monoxide (CO) [ppm] level in 2022 was 0.291. This is about average. Closest monitor was 0.4 miles away from the city center.
| City: | 0.291 |
| U.S.: | 0.251 |
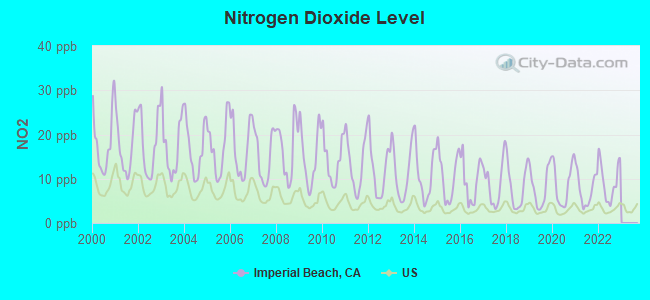
Nitrogen Dioxide (NO2) [ppb] level in 2022 was 9.45. This is significantly worse than average. Closest monitor was 0.4 miles away from the city center.
| City: | 9.45 |
| U.S.: | 5.11 |
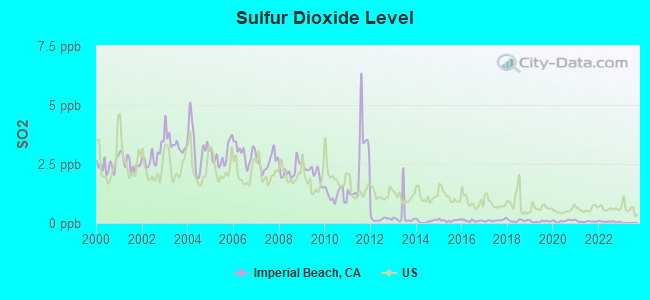
Sulfur Dioxide (SO2) [ppb] level in 2022 was 0.0589. This is significantly better than average. Closest monitor was 0.4 miles away from the city center.
| City: | 0.0589 |
| U.S.: | 1.5147 |
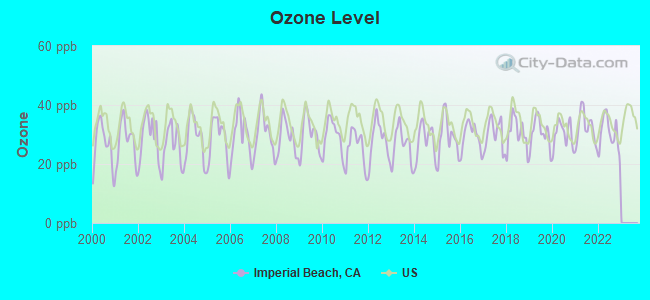
Ozone [ppb] level in 2022 was 30.1. This is about average. Closest monitor was 0.4 miles away from the city center.
| City: | 30.1 |
| U.S.: | 33.3 |
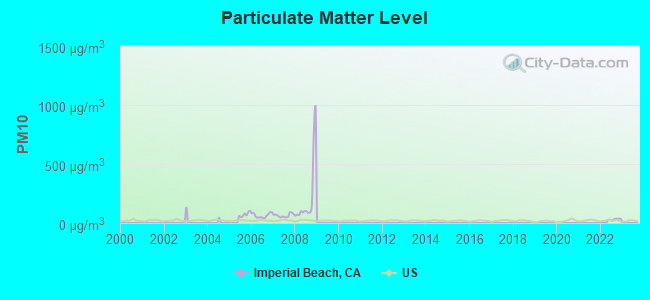
Particulate Matter (PM10) [µg/m3] level in 2022 was 30.9. This is significantly worse than average. Closest monitor was 5.0 miles away from the city center.
| City: | 30.9 |
| U.S.: | 19.2 |
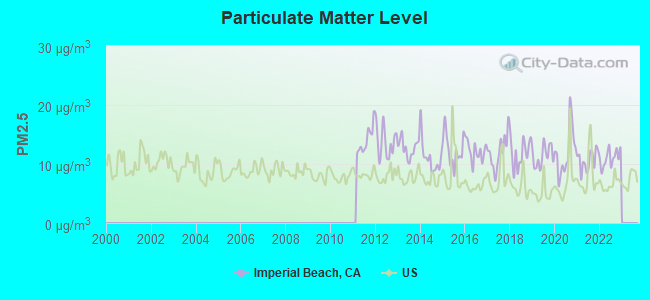
Particulate Matter (PM2.5) [µg/m3] level in 2022 was 11.0. This is worse than average. Closest monitor was 5.0 miles away from the city center.
| City: | 11.0 |
| U.S.: | 8.1 |
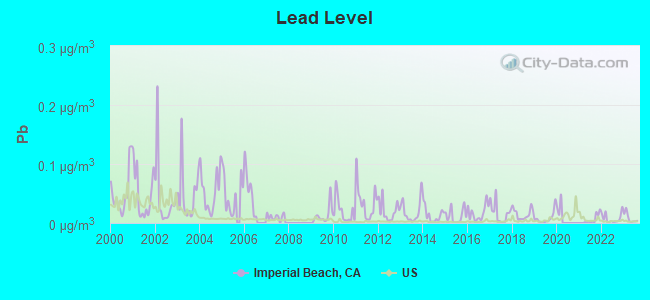
Lead (Pb) [µg/m3] level in 2023 was 0.00835. This is about average. Closest monitor was 5.0 miles away from the city center.
| City: | 0.00835 |
| U.S.: | 0.00931 |
Earthquake activity:
Imperial Beach-area historical earthquake activity is significantly above California state average. It is 5429% greater than the overall U.S. average.On 6/28/1992 at 11:57:34, a magnitude 7.6 (6.2 MB, 7.6 MS, 7.3 MW, Depth: 0.7 mi, Class: Major, Intensity: VIII - XII) earthquake occurred 116.1 miles away from the city center, causing 3 deaths (1 shaking deaths, 2 other deaths) and 400 injuries, causing $100,000,000 total damage and $40,000,000 insured losses
On 7/21/1952 at 11:52:14, a magnitude 7.7 (7.7 UK) earthquake occurred 199.4 miles away from the city center, causing $50,000,000 total damage
On 10/16/1999 at 09:46:44, a magnitude 7.4 (6.3 MB, 7.4 MS, 7.2 MW, 7.3 ML) earthquake occurred 139.6 miles away from Imperial Beach center
On 5/19/1940 at 04:36:40, a magnitude 7.2 (7.2 UK) earthquake occurred 93.7 miles away from the city center, causing $33,000,000 total damage
On 12/31/1934 at 18:45:56, a magnitude 7.1 (7.1 UK) earthquake occurred 79.3 miles away from Imperial Beach center
On 10/15/1979 at 23:16:54, a magnitude 7.0 (5.7 MB, 6.9 MS, 7.0 ML, 6.4 MW) earthquake occurred 87.6 miles away from Imperial Beach center
Magnitude types: body-wave magnitude (MB), local magnitude (ML), surface-wave magnitude (MS), moment magnitude (MW)
Natural disasters:
The number of natural disasters in San Diego County (39) is a lot greater than the US average (15).Major Disasters (Presidential) Declared: 21
Emergencies Declared: 2
Causes of natural disasters: Fires: 21, Floods: 17, Storms: 9, Winter Storms: 6, Landslides: 5, Mudslides: 4, Freeze: 1, Heavy Rain: 1, Hurricane: 1, Tornado: 1, Other: 1 (Note: some incidents may be assigned to more than one category).

Hospitals and medical centers near Imperial Beach:
- FMC-CHULA VISTA DIALYSIS CENTER- SOUTH (Dialysis Facility, about 3 miles away; SAN DIEGO, CA)
- FMC-SAN YSIDRO DIALYSIS CENTER (Dialysis Facility, about 3 miles away; SAN DIEGO, CA)
- DSI CHULA VISTA DIALYSIS (Dialysis Facility, about 3 miles away; CHULA VISTA, CA)
- SAN YSIDRO DIALYSIS (Dialysis Facility, about 4 miles away; SAN DIEGO, CA)
- FMC-BALBOA-MARINA BAY (Dialysis Facility, about 4 miles away; CHULA VISTA, CA)
- BAYVIEW HOSPITAL AND MENTAL HEALTH SYS (Hospital, about 4 miles away; CHULA VISTA, CA)
- HOME DIALYSIS THERAPIES OF SAN DIEGO-SOUTH (Dialysis Facility, about 5 miles away; CHULA VISTA, CA)
Airports located in Imperial Beach:
- Imperial Beach Nolf (Ream Fld) Airport (NRS) (Runways: 2)
Amtrak station near Imperial Beach:
- 10 miles: SAN DIEGO (1050 KETTNER BLVD.) . Services: ticket office, fully wheelchair accessible, enclosed waiting area, public restrooms, public payphones, full-service food facilities, paid short-term parking, paid long-term parking, call for car rental service, taxi stand, public transit connection.
Colleges/universities with over 2000 students nearest to Imperial Beach:
- Southwestern College (about 9 miles; Chula Vista, CA; Full-time enrollment: 10,761)
- San Diego City College (about 10 miles; San Diego, CA; FT enrollment: 7,972)
- Point Loma Nazarene University (about 13 miles; San Diego, CA; FT enrollment: 3,189)
- San Diego State University (about 14 miles; San Diego, CA; FT enrollment: 27,516)
- University of San Diego (about 14 miles; San Diego, CA; FT enrollment: 7,589)
- The Art Institute of California-Argosy University San Diego (about 15 miles; San Diego, CA; FT enrollment: 2,180)
- Cuyamaca College (about 16 miles; El Cajon, CA; FT enrollment: 4,270)
Public high schools in Imperial Beach:
- MAR VISTA SENIOR HIGH (Students: 1,266, Location: 505 ELM AVE., Grades: 9-12)
- SWEETWATER COMMUNITY DAY (Students: 12, Location: 505 1/2 ELM AVE., Grades: 7-9)
Public elementary/middle schools in Imperial Beach:
- IMPERIAL BEACH CHARTER (Students: 454, Location: 650 IMPERIAL BEACH BLVD., Grades: KG-8, Charter school)
- ONEONTA ELEMENTARY (Students: 357, Location: 1311 TENTH ST., Grades: KG-6)
- BAYSIDE ELEMENTARY (Students: 249, Location: 490 EMORY ST., Grades: KG-6)
- CENTRAL ELEMENTARY (Location: 1290 EBONY AVE., Grades: KG-6)
Points of interest:
Notable locations in Imperial Beach: Tijuana Estuary Natural Preserve Visitor Center (A), Imperial Beach City Hall (B), Imperial Beach Chamber of Commerce (C), Imperial Beach Branch San Diego County Library (D), Imperial Beach Fire Department Station 39 (E), Mar Vista High School Library (F). Display/hide their locations on the map
Shopping Centers: Silver Strand Shopping Center (1), Palm Center Shopping Center (2), Marina Village Shopping Center (3), Imperial Shopping Center (4), Imperial Beach Plaza Shopping Center (5). Display/hide their locations on the map
Churches in Imperial Beach include: Imperial Beach United Methodist Church (A), Imperial Beach Saint Marys by the Sea Episcopal Church (B), Westview Bible Church (C), United Pentecostal Church (D), First Southern Baptist Church of Imperial Beach (E). Display/hide their locations on the map
River: Tijuana River (A). Display/hide its location on the map
Parks in Imperial Beach include: Border Field State Park (1), Tijuana River National Estuarine Research Reserve (2), Bayside Park (3), Imperial Beach Sports Park (4), Marina Vista Park (5), Reama Park (6). Display/hide their locations on the map
Drinking water stations with addresses in Imperial Beach that have no violations reported:
- CALIFORNIA-AMERICAN WATER CO (Population served: 96,000, Primary Water Source Type: Purch surface water)
| This city: | 2.8 people |
| California: | 2.9 people |
| This city: | 68.2% |
| Whole state: | 68.7% |
| This city: | 9.3% |
| Whole state: | 7.2% |
Likely homosexual households (counted as self-reported same-sex unmarried-partner households)
- Lesbian couples: 0.4% of all households
- Gay men: 0.3% of all households
6 people in residential treatment centers for adults in 2010
People in group quarters in Imperial Beach in 2000:
- 614 people in job corps and vocational training facilities
- 32 people in other noninstitutional group quarters
- 12 people in other group homes
- 8 people in homes or halfway houses for drug/alcohol abuse
Banks with branches in Imperial Beach (2011 data):
- JPMorgan Chase Bank, National Association: Imperial Beach Branch at 1100 Palm Ave, branch established on 1934/11/01. Info updated 2011/11/10: Bank assets: $1,811,678.0 mil, Deposits: $1,190,738.0 mil, headquarters in Columbus, OH, positive income, International Specialization, 5577 total offices, Holding Company: Jpmorgan Chase & Co.
- Union Bank, National Association: Imperial Beach Branch at 900 Palm Avenue, branch established on 1963/08/09. Info updated 2011/09/01: Bank assets: $88,967.5 mil, Deposits: $65,286.4 mil, headquarters in San Francisco, CA, positive income, Commercial Lending Specialization, 403 total offices, Holding Company: Mitsubishi Ufj Financial Group, Inc.
For population 15 years and over in Imperial Beach:
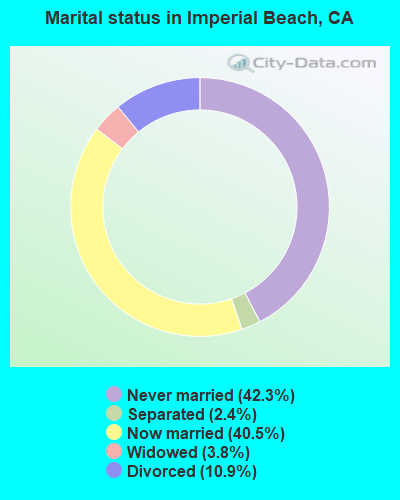
- Never married: 42.3%
- Now married: 40.5%
- Separated: 2.4%
- Widowed: 3.8%
- Divorced: 10.9%
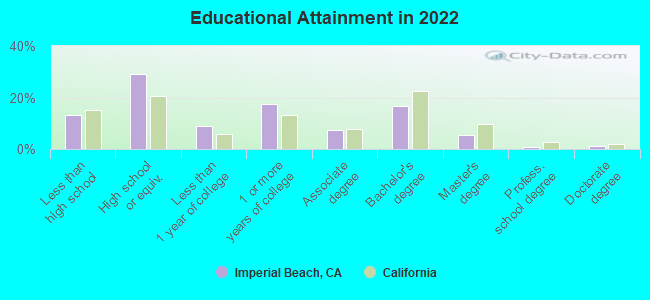
For population 25 years and over in Imperial Beach:
- High school or higher: 85.5%
- Bachelor's degree or higher: 22.5%
- Graduate or professional degree: 6.6%
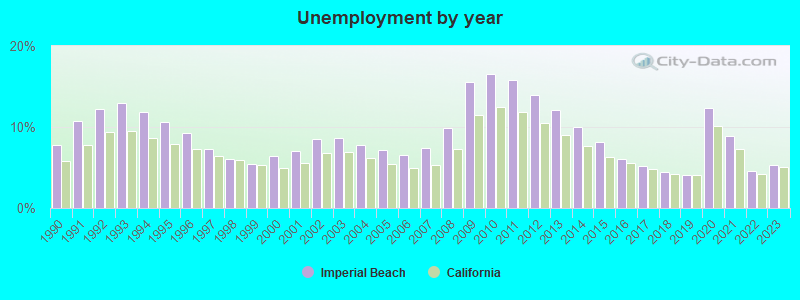
- Unemployed: 12.1%
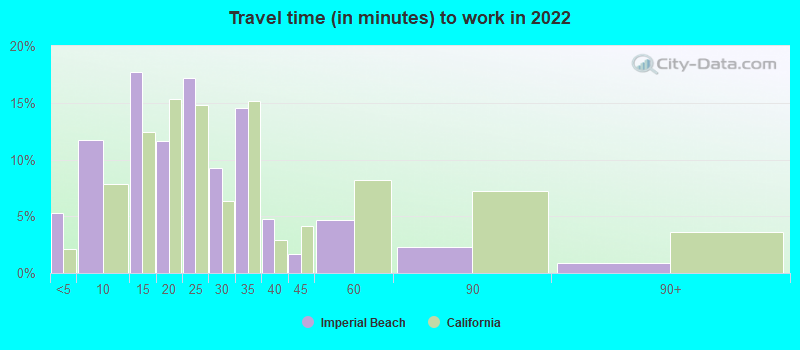
- Mean travel time to work (commute): 23.4 minutes
| Here: | 11.5 |
| California average: | 15.5 |
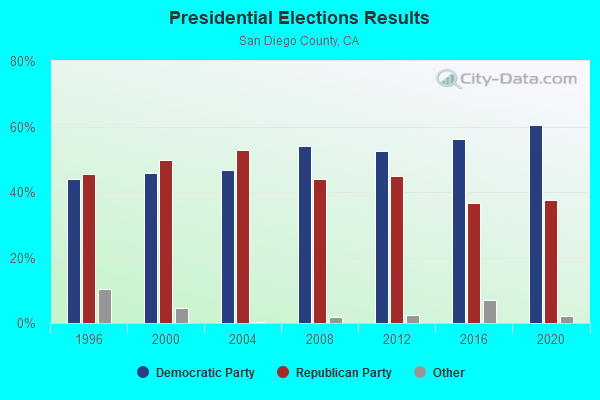
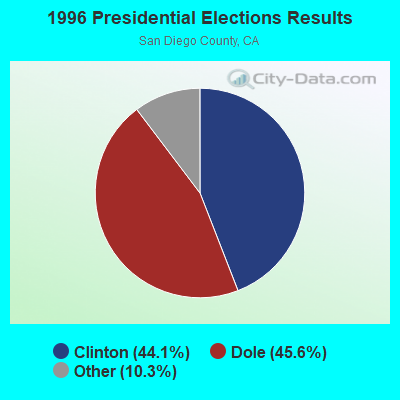
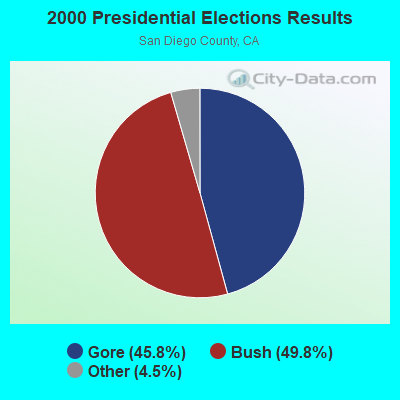
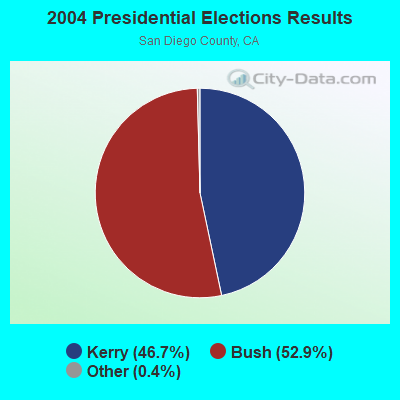
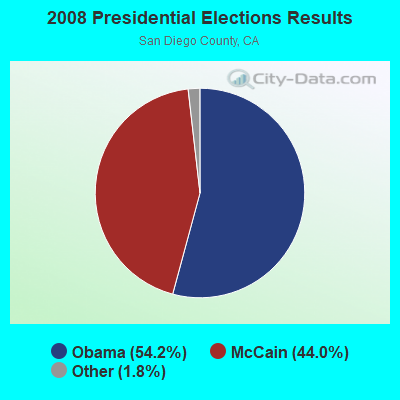
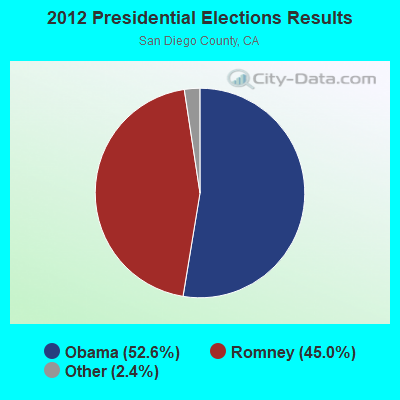
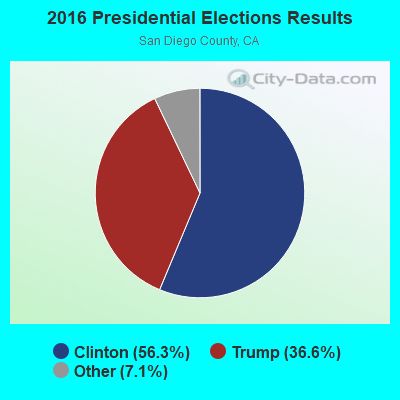
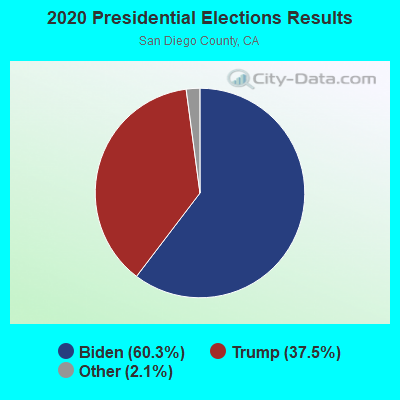
Graphs represent county-level data. Detailed 2008 Election Results
Political contributions by individuals in Imperial Beach, CA
Neighborhoods in Imperial Beach:
(Imperial Beach, California Neighborhood Map)Religion statistics for Imperial Beach, CA (based on San Diego County data)
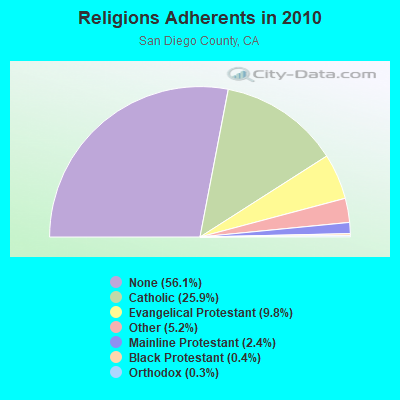
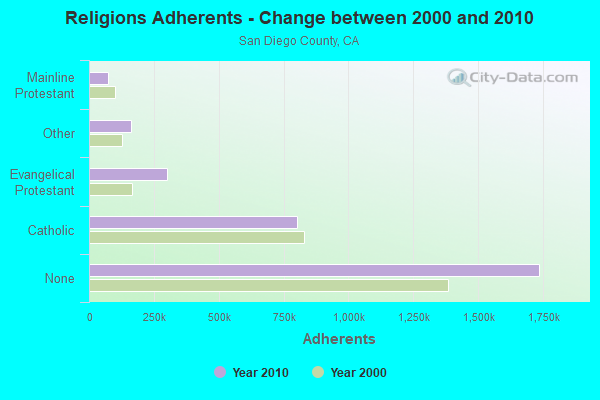
| Religion | Adherents | Congregations |
|---|---|---|
| Catholic | 801,850 | 115 |
| Evangelical Protestant | 302,320 | 974 |
| Other | 161,530 | 349 |
| Mainline Protestant | 74,992 | 211 |
| Black Protestant | 10,857 | 52 |
| Orthodox | 7,828 | 19 |
| None | 1,735,936 | - |
Food Environment Statistics:
| San Diego County: | 1.94 / 10,000 pop. |
| California: | 2.14 / 10,000 pop. |
| San Diego County: | 0.06 / 10,000 pop. |
| California: | 0.04 / 10,000 pop. |
| Here: | 0.77 / 10,000 pop. |
| California: | 0.62 / 10,000 pop. |
| San Diego County: | 1.65 / 10,000 pop. |
| California: | 1.49 / 10,000 pop. |
| San Diego County: | 7.56 / 10,000 pop. |
| California: | 7.42 / 10,000 pop. |
| San Diego County: | 6.5% |
| California: | 7.3% |
| San Diego County: | 22.2% |
| State: | 21.3% |
| This county: | 16.0% |
| California: | 17.9% |
Health and Nutrition:
| Here: | 48.1% |
| State: | 49.4% |
| Imperial Beach: | 47.5% |
| State: | 48.0% |
| Imperial Beach: | 28.2 |
| California: | 28.1 |
| This city: | 20.7% |
| California: | 20.2% |
| This city: | 11.3% |
| California: | 11.2% |
| Imperial Beach: | 6.8 |
| California: | 6.8 |
| Imperial Beach: | 31.6% |
| California: | 31.5% |
| Imperial Beach: | 56.4% |
| California: | 56.4% |
| Imperial Beach: | 81.7% |
| California: | 80.9% |
More about Health and Nutrition of Imperial Beach, CA Residents
| Local government employment and payroll (March 2022) | |||||
| Function | Full-time employees | Monthly full-time payroll | Average yearly full-time wage | Part-time employees | Monthly part-time payroll |
|---|---|---|---|---|---|
| Parks and Recreation | 19 | $135,224 | $85,405 | 37 | $34,981 |
| Firefighters | 12 | $145,689 | $145,689 | 0 | $0 |
| Streets and Highways | 11 | $92,969 | $101,421 | 0 | $0 |
| Other Government Administration | 10 | $108,126 | $129,751 | 5 | $11,069 |
| Other and Unallocable | 8 | $58,809 | $88,214 | 2 | $2,513 |
| Financial Administration | 5 | $56,429 | $135,430 | 1 | $2,152 |
| Housing and Community Development (Local) | 4 | $39,255 | $117,765 | 0 | $0 |
| Sewerage | 4 | $25,170 | $75,510 | 0 | $0 |
| Natural Resources | 2 | $21,855 | $131,130 | 0 | $0 |
| Fire - Other | 1 | $2,166 | $25,992 | 0 | $0 |
| Totals for Government | 76 | $685,691 | $108,267 | 45 | $50,716 |
Imperial Beach government finances - Expenditure in 2018 (per resident):
- Construction - Housing and Community Development: $1,412,000 ($54.75)
Regular Highways: $1,023,000 ($39.66)
- Current Operations - Police Protection: $8,088,000 ($313.60)
Sewerage: $5,403,000 ($209.49)
Central Staff Services: $4,717,000 ($182.89)
Local Fire Protection: $2,427,000 ($94.10)
Regular Highways: $2,109,000 ($81.77)
Sea and Inland Port Facilities: $972,000 ($37.69)
Parks and Recreation: $599,000 ($23.23)
Protective Inspection and Regulation - Other: $375,000 ($14.54)
Health - Other: $284,000 ($11.01)
General - Other: $192,000 ($7.44)
Housing and Community Development: $57,000 ($2.21)
- General - Interest on Debt: $1,511,000 ($58.59)
- Intergovernmental to Local - Other - Police Protection: $6,661,000 ($258.27)
Other - General - Other: $2,671,000 ($103.56)
- Other Capital Outlay - Local Fire Protection: $37,000 ($1.43)
Central Staff Services: $7,000 ($0.27)
Imperial Beach government finances - Revenue in 2018 (per resident):
- Charges - Other: $5,393,000 ($209.10)
Sewerage: $5,357,000 ($207.71)
Parks and Recreation: $47,000 ($1.82)
- Federal Intergovernmental - Housing and Community Development: $141,000 ($5.47)
Other: $129,000 ($5.00)
- Miscellaneous - General Revenue - Other: $1,989,000 ($77.12)
Fines and Forfeits: $285,000 ($11.05)
Rents: $269,000 ($10.43)
Donations From Private Sources: $170,000 ($6.59)
Interest Earnings: $10,000 ($0.39)
- State Intergovernmental - Other: $2,439,000 ($94.57)
Highways: $732,000 ($28.38)
General Local Government Support: $13,000 ($0.50)
- Tax - Property: $5,900,000 ($228.76)
Public Utilities Sales: $1,928,000 ($74.75)
General Sales and Gross Receipts: $1,908,000 ($73.98)
Other Selective Sales: $752,000 ($29.16)
Other License: $687,000 ($26.64)
Occupation and Business License - Other: $401,000 ($15.55)
Documentary and Stock Transfer: $148,000 ($5.74)
Imperial Beach government finances - Debt in 2018 (per resident):
- Long Term Debt - Beginning Outstanding - Unspecified Public Purpose: $37,770,000 ($1464.46)
Outstanding Unspecified Public Purpose: $37,525,000 ($1454.96)
Retired Unspecified Public Purpose: $245,000 ($9.50)
Imperial Beach government finances - Cash and Securities in 2018 (per resident):
- Bond Funds - Cash and Securities: $283,000 ($10.97)
- Other Funds - Cash and Securities: $16,832,000 ($652.63)
5.18% of this county's 2021 resident taxpayers lived in other counties in 2020 ($90,734 average adjusted gross income)
| Here: | 5.18% |
| California average: | 5.19% |
0.14% of residents moved from foreign countries ($1,493 average AGI)
San Diego County: 0.14% California average: 0.03%
Top counties from which taxpayers relocated into this county between 2020 and 2021:
| from Los Angeles County, CA | |
| from Riverside County, CA | |
| from Orange County, CA |
5.71% of this county's 2020 resident taxpayers moved to other counties in 2021 ($83,556 average adjusted gross income)
| Here: | 5.71% |
| California average: | 6.14% |
0.09% of residents moved to foreign countries ($1,067 average AGI)
San Diego County: 0.09% California average: 0.02%
Top counties to which taxpayers relocated from this county between 2020 and 2021:
| to Riverside County, CA | |
| to Los Angeles County, CA | |
| to Orange County, CA |
| Businesses in Imperial Beach, CA | ||||
| Name | Count | Name | Count | |
|---|---|---|---|---|
| 7-Eleven | 1 | H&R Block | 1 | |
| Burger King | 1 | Jones New York | 1 | |
| CVS | 2 | KFC | 1 | |
| Carl\s Jr. | 1 | McDonald's | 1 | |
| Cold Stone Creamery | 1 | Subway | 1 | |
| Domino's Pizza | 1 | U-Haul | 1 | |
| FedEx | 3 | |||
Strongest AM radio stations in Imperial Beach:
- KFMB (760 AM; 50 kW; SAN DIEGO, CA; Owner: MIDWEST TELEVISION, INC.)
- KCBQ (1170 AM; 50 kW; SAN DIEGO, CA; Owner: RADIO 1210, INC.)
- KURS (1040 AM; 5 kW; SAN DIEGO, CA; Owner: QUETZAL BILINGUAL COMMUNICATIONS INC)
- KOGO (600 AM; 5 kW; SAN DIEGO, CA; Owner: CITICASTERS LICENSES, L.P.)
- KPOP (1360 AM; 5 kW; SAN DIEGO, CA; Owner: CITICASTERS LICENSES, L.P.)
- KSDO (1130 AM; 10 kW; SAN DIEGO, CA; Owner: HI-FAVOR BROADCASTING, LLC)
- KPRZ (1210 AM; 20 kW; SAN MARCOS, CA; Owner: RADIO 1210, INC.)
- KSON (1240 AM; 1 kW; SAN DIEGO, CA; Owner: JEFFERSON-PILOT COMMUNICATIONS COMPANY OF CALIFORNIA)
- KECR (910 AM; 5 kW; EL CAJON, CA; Owner: FAMILY STATIONS, INC.)
- KFI (640 AM; 50 kW; LOS ANGELES, CA; Owner: CAPSTAR TX LIMITED PARTNERSHIP)
- KPLS (830 AM; 50 kW; ORANGE, CA; Owner: CRN LICENSES, LLC)
- KLAC (570 AM; 50 kW; LOS ANGELES, CA; Owner: AMFM RADIO LICENSES, L.L.C.)
- KTNQ (1020 AM; 50 kW; LOS ANGELES, CA; Owner: KTNQ-AM LICENSE CORP.)
Strongest FM radio stations in Imperial Beach:
- KHTS-FM (93.3 FM; EL CAJON, CA; Owner: CITICASTERS LICENSES, L.P.)
- K210CL (89.9 FM; LEMON GROVE, CA; Owner: SANTA MONICA COMMUNITY COLLEGE DISTRICT)
- KLNV (106.5 FM; SAN DIEGO, CA; Owner: HBC LICENSE CORPORATION)
- KPBS-FM (89.5 FM; SAN DIEGO, CA; Owner: THE BD. OF TRUSTEES, CALIFORNIA STATE UNIVERSITY)
- KLQV (102.9 FM; SAN DIEGO, CA; Owner: HBC LICENSE CORPORATION)
- KIOZ (105.3 FM; SAN DIEGO, CA; Owner: CITICASTERS LICENSES, L.P.)
- KGB-FM (101.5 FM; SAN DIEGO, CA; Owner: CITICASTERS LICENSES, L.P.)
- KSON-FM (97.3 FM; SAN DIEGO, CA; Owner: JEFFERSON-PILOT COMMUNICATIONS COMPANY OF CALIFORNIA)
- KWVE (107.9 FM; SAN CLEMENTE, CA; Owner: CALVARY CHAPEL OF COSTA MESA)
- KBZT (94.9 FM; SAN DIEGO, CA; Owner: JEFFERSON-PILOT COMMUNICATIONS COMPANY OF CALIFORNIA)
- KIFM (98.1 FM; SAN DIEGO, CA; Owner: JEFFERSON-PILOT COMMUNICATIONS COMPANY OF CALIFORNIA)
- KYXY (96.5 FM; SAN DIEGO, CA; Owner: INFINITY RADIO OPERATIONS INC.)
- KLVJ (100.1 FM; JULIAN, CA; Owner: EDUCATIONAL MEDIA FOUNDATION)
- KOCL (95.7 FM; CARLSBAD, CA; Owner: CITICASTERS LICENSES, L.P.)
- KRTM (88.9 FM; TEMECULA, CA; Owner: PENFOLD COMMUNICATIONS, INC.)
- KFMB-FM (100.7 FM; SAN DIEGO, CA; Owner: MIDWEST TELEVISION, INC.)
- KMYI (94.1 FM; SAN DIEGO, CA; Owner: CITICASTERS LICENSES, L.P.)
- KPLN (103.7 FM; SAN DIEGO, CA; Owner: INFINITY RADIO OPERATIONS INC.)
- KFSD-FM (92.1 FM; ESCONDIDO, CA; Owner: NORTH COUNTY BROADCASTING CORP.)
- KPRI (102.1 FM; ENCINITAS, CA; Owner: COMPASS RADIO OF SAN DIEGO, INC.)
TV broadcast stations around Imperial Beach:
- KBNT-CA (Channel 17; SAN DIEGO, CA; Owner: ENTRAVISION HOLDINGS, L.L.C.)
- KBOP-LP (Channel 25; SAN DIEGO, CA; Owner: COMMERCIAL BROADCASTING CORP.)
- K63EN (Channel 63; SAN DIEGO, CA; Owner: CIVIC LIGHT, INC.)
- K61GH (Channel 61; NATIONAL CITY, CA; Owner: TV-61 SAN DIEGO, INC.)
- KSWB-TV (Channel 69; SAN DIEGO, CA; Owner: KSWB INC.)
- KUSI-TV (Channel 51; SAN DIEGO, CA; Owner: CHANNEL 51 OF SAN DIEGO, INC.)
- KPBS (Channel 15; SAN DIEGO, CA; Owner: BOARD OF TRUSTEES FOR SAN DIEGO UNIV.)
- KNSD (Channel 39; SAN DIEGO, CA; Owner: STATION VENTURE OPERATIONS, LP)
- KFMB-TV (Channel 8; SAN DIEGO, CA; Owner: MIDWEST TELEVISION, INC.)
- KGTV (Channel 10; SAN DIEGO, CA; Owner: MCGRAW-HILL BROADCASTING COMPANY, INC.)
FCC Registered Antenna Towers:
69 (See the full list of FCC Registered Antenna Towers in Imperial Beach)FCC Registered Broadcast Land Mobile Towers:
5- Borderfield Shp W End Monument Rd (Lat: 32.543389 Lon: -117.114750), Type: Pole, Structure height: 6 m, Call Sign: KNGK505,
Assigned Frequencies: 811.037 MHz, 810.662 MHz, 808.462 MHz, 856.037 MHz, 855.662 MHz, 853.462 MHz, Grant Date: 01/09/2015, Expiration Date: 03/28/2025, Registrant: State Of California, 601 Sequoia Pacific Blvd, Sacramento, CA 95811-0231, Phone: (916) 894-5102, Fax: (916) 894-5392, Email:
- 845 Coronado Ave (Lat: 32.575611 Lon: -117.117528), Call Sign: KNCJ408, Licensee ID: L00004038,
Assigned Frequencies: 453.725 MHz, 458.425 MHz, 458.825 MHz, 458.950 MHz, Grant Date: 03/26/1998, Expiration Date: 06/06/2003, Cancellation Date: 03/19/2003, Registrant: County Of San Diego, 5555 Overland Ave Ms 056, San Diego, CA 92123, Phone: (858) 495-5455, Fax: (858) 495-5476, Email:
- 825 Imperial Beach Blvd (Lat: 32.563389 Lon: -117.077806), Call Sign: WQC632,
Assigned Frequencies: 155.745 MHz, Grant Date: 08/23/1995, Expiration Date: 10/18/2000, Cancellation Date: 12/24/2000, Registrant: City Of Imperial Beach, 825 Imperial Beach Blvd, Imperial Beach, CA 92032, Phone: (619) 423-8300
- Lat: 32.579222 Lon: -117.122111, Call Sign: WQQV649,
Assigned Frequencies: 159.510 MHz, 159.675 MHz, 153.005 MHz, 159.495 MHz, 159.915 MHz, Grant Date: 03/12/2013, Expiration Date: 03/12/2023, Cancellation Date: 05/13/2023, Certifier: Daniel Alonzo, Registrant: Business Radio Licensing, 30251 Golden Lantern Ste E #501, Laguna Niguel, CA 92677, Phone: (949) 348-8510, Fax: (949) 348-8514, Email:
- Lat: 32.576083 Lon: -117.126722, Call Sign: WSAF932,
Assigned Frequencies: 452.087 MHz, 452.337 MHz, 457.087 MHz, 457.112 MHz, 457.337 MHz, Grant Date: 01/13/2024, Expiration Date: 01/13/2034, Certifier: Jesse Lucero, Registrant: Bearcom, 4009 Distribution Drive, Bldg 200, Garland, TX 75041, Phone: (800) 458-9887, Email:
FCC Registered Microwave Towers:
2- MAR VISTA HIGH, 505 Elm Ave (Lat: 32.580028 Lon: -117.123750), Type: Building, Structure height: 4.3 m, Overall height: 6.7 m, Call Sign: WQBS666,
Assigned Frequencies: 22675.0 MHz, Grant Date: 12/07/2004, Expiration Date: 12/07/2014, Cancellation Date: 02/07/2015, Certifier: Joe Austin, Registrant: Sun Wireless, 13868 Little Creek Lane, Valley Center, CA 92082, Phone: (760) 749-5790, Email:
- TJE, 301 Caspian Way (Lat: 32.574694 Lon: -117.126306), Type: Bant, Structure height: 12.2 m, Call Sign: WSCA410,
Assigned Frequencies: 11245.0 MHz, 11245.0 MHz, 11245.0 MHz, 11245.0 MHz, 11245.0 MHz, 11245.0 MHz, 11245.0 MHz, 11245.0 MHz, 11245.0 MHz, 11245.0 MHz, Grant Date: 03/25/2024, Expiration Date: 03/25/2034, Certifier: Frank Vernon Res, Registrant: Micronet Communications, Inc., 812 Lexington Dr, Plano, TX 75075, Phone: (972) 422-7200, Email:
FCC Registered Amateur Radio Licenses:
158 (See the full list of FCC Registered Amateur Radio Licenses in Imperial Beach)FAA Registered Aircraft:
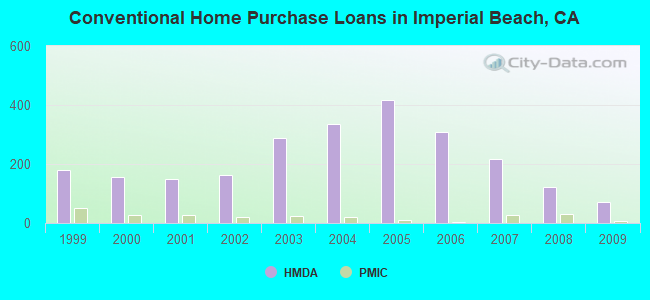
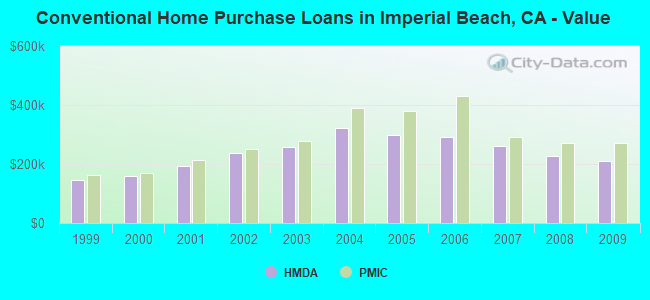
13 (See the full list of FAA Registered Aircraft in Imperial Beach)| Home Mortgage Disclosure Act Aggregated Statistics For Year 2009 (Based on 6 full tracts) | ||||||||||||||
| A) FHA, FSA/RHS & VA Home Purchase Loans | B) Conventional Home Purchase Loans | C) Refinancings | D) Home Improvement Loans | E) Loans on Dwellings For 5+ Families | F) Non-occupant Loans on < 5 Family Dwellings (A B C & D) | G) Loans On Manufactured Home Dwelling (A B C & D) | ||||||||
|---|---|---|---|---|---|---|---|---|---|---|---|---|---|---|
| Number | Average Value | Number | Average Value | Number | Average Value | Number | Average Value | Number | Average Value | Number | Average Value | Number | Average Value | |
| LOANS ORIGINATED | 55 | $276,205 | 70 | $209,731 | 162 | $256,822 | 8 | $109,674 | 3 | $736,990 | 62 | $232,714 | 1 | $252,370 |
| APPLICATIONS APPROVED, NOT ACCEPTED | 6 | $301,827 | 16 | $229,491 | 19 | $253,793 | 1 | $8,920 | 0 | $0 | 12 | $219,149 | 0 | $0 |
| APPLICATIONS DENIED | 9 | $285,412 | 22 | $177,802 | 92 | $295,482 | 13 | $87,993 | 1 | $500,000 | 36 | $274,681 | 0 | $0 |
| APPLICATIONS WITHDRAWN | 13 | $268,520 | 10 | $182,139 | 71 | $284,199 | 2 | $276,805 | 1 | $495,750 | 21 | $215,027 | 0 | $0 |
| FILES CLOSED FOR INCOMPLETENESS | 0 | $0 | 4 | $269,010 | 22 | $293,139 | 1 | $200,000 | 0 | $0 | 6 | $187,482 | 0 | $0 |
Detailed HMDA statistics for the following Tracts: 0102.00 , 0103.00, 0104.01, 0104.02, 0105.01, 0105.02
| Private Mortgage Insurance Companies Aggregated Statistics For Year 2009 (Based on 5 full tracts) | ||||
| A) Conventional Home Purchase Loans | B) Refinancings | |||
|---|---|---|---|---|
| Number | Average Value | Number | Average Value | |
| LOANS ORIGINATED | 6 | $272,487 | 1 | $268,000 |
| APPLICATIONS APPROVED, NOT ACCEPTED | 5 | $356,992 | 2 | $339,075 |
| APPLICATIONS DENIED | 2 | $211,000 | 1 | $284,000 |
| APPLICATIONS WITHDRAWN | 2 | $297,590 | 0 | $0 |
| FILES CLOSED FOR INCOMPLETENESS | 1 | $178,000 | 0 | $0 |
Detailed PMIC statistics for the following Tracts: 0102.00 , 0103.00, 0104.01, 0104.02, 0105.01, 0105.02
2005 - 2018 National Fire Incident Reporting System (NFIRS) incidents
- Fire incident types reported to NFIRS in Imperial Beach, CA
- 27255.6%Structure Fires
- 10421.3%Outside Fires
- 6914.1%Other
- 449.0%Mobile Property/Vehicle Fires
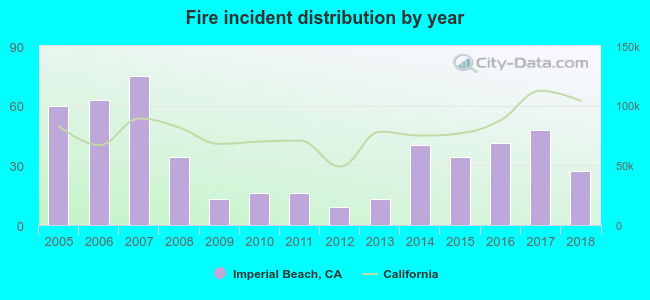 According to the data from the years 2005 - 2018 the average number of fire incidents per year is 35. The highest number of fire incidents - 75 took place in 2007, and the least - 9 in 2012. The data has a decreasing trend.
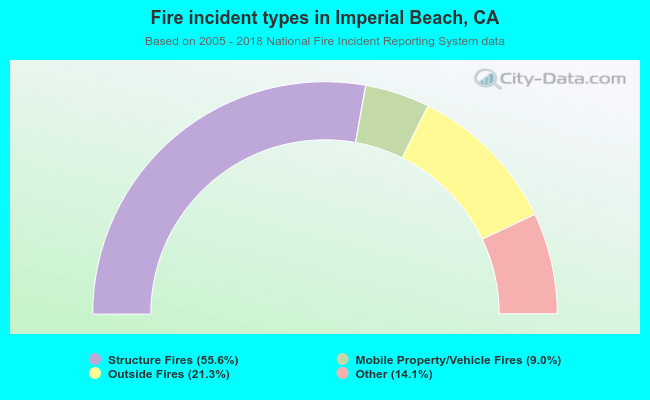 When looking into fire subcategories, the most incidents belonged to: Structure Fires (55.6%), and Outside Fires (21.3%).
| Most common first names in Imperial Beach, CA among deceased individuals | ||
| Name | Count | Lived (average) |
|---|---|---|
| John | 52 | 70.4 years |
| Robert | 46 | 67.5 years |
| William | 39 | 73.7 years |
| Mary | 37 | 76.8 years |
| Maria | 32 | 73.9 years |
| Charles | 26 | 71.9 years |
| James | 25 | 71.8 years |
| Jose | 22 | 71.2 years |
| Richard | 21 | 72.1 years |
| Dorothy | 20 | 81.5 years |
| Most common last names in Imperial Beach, CA among deceased individuals | ||
| Last name | Count | Lived (average) |
|---|---|---|
| Smith | 17 | 76.6 years |
| Garcia | 14 | 73.9 years |
| Johnson | 11 | 81.1 years |
| Cox | 8 | 78.0 years |
| Wilson | 6 | 67.5 years |
| Graham | 5 | 70.0 years |
| Thomas | 5 | 73.4 years |
| Sanchez | 5 | 82.4 years |
| Clark | 5 | 66.6 years |
| Torres | 5 | 64.4 years |
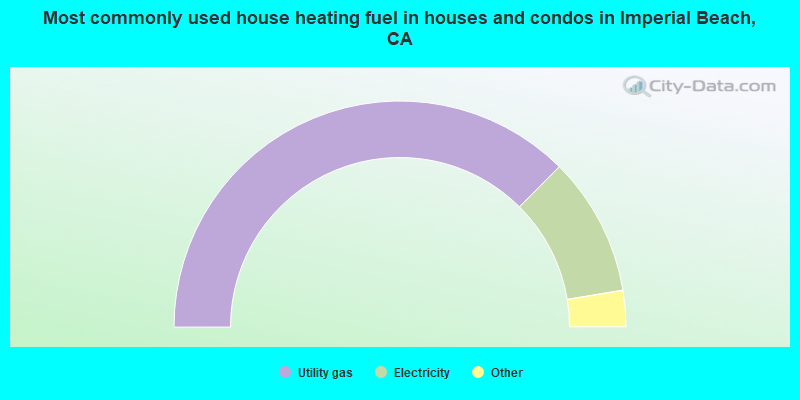
- 75.0%Utility gas
- 19.9%Electricity
- 3.0%No fuel used
- 1.2%Bottled, tank, or LP gas
- 0.5%Wood
- 0.5%Solar energy
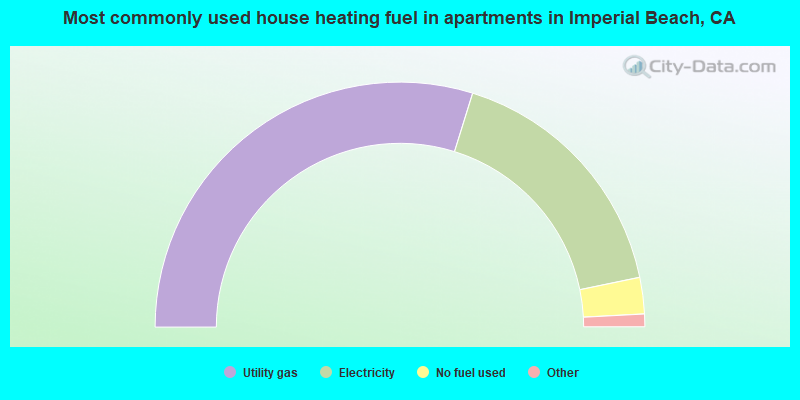
- 59.6%Utility gas
- 33.9%Electricity
- 4.8%No fuel used
- 1.4%Bottled, tank, or LP gas
- 0.3%Wood
Imperial Beach compared to California state average:
- Foreign-born population percentage below state average.
- Renting percentage above state average.
- Length of stay since moving in significantly above state average.
Imperial Beach on our top lists:
- #31 on the list of "Top 101 cities with the largest percentage of people in job corps and vocational training facilities (population 1,000+)"
- #4 on the list of "Top 101 counties with the most Catholic adherents"
- #4 on the list of "Top 101 counties with the highest lead air pollution readings in 2012 (µg/m3)"
- #7 on the list of "Top 101 counties with the most Evangelical Protestant congregations"
- #7 on the list of "Top 101 counties with the most Catholic congregations"
- #7 on the list of "Top 101 counties with the highest surface withdrawal of fresh water for public supply (pop. 50,000+)"

|
|
Total of 50 patent applications in 2008-2024.