California's diverse geography hosts both East San Gabriel Valley and Perris Valley, each with unique characteristics that appeal to residents and tourists alike. East San Gabriel Valley showcases a blend of suburban and urban living, rooted in rich cultural heritage while Perris Valley offers a more rural, cost-effective option. This comparison will delve into each city's crime and safety, weather, cost of living, education, and more in order to provide a comprehensive contrast.
East San Gabriel Valley has a comparatively lower crime rate compared to Perris Valley. Residents have reported feeling safer in general, partly due to superior policing and community initiatives aimed at combating crime in East San Gabriel Valley. In contrast, Perris Valley has a higher crime rate relative to the California average. However, local law enforcement efforts are continually being made to improve security.
Cost of Living
Living in East San Gabriel Valley is notably more expensive than in Perris Valley, reflecting its proximity to major urban centers like Los Angeles. Housing, groceries, health care, and transportation costs are all higher on average here. Perris Valley, on the other hand, offers a more affordable cost of living, making it attractive for families and individuals seeking to stretch their dollars further.
Income Tax
As both cities are in California, income tax rates are consistent and based on income level – which is steeply progressive.
Property Tax
Property tax is higher in East San Gabriel Valley due to higher property valuations. However, the actual tax rate is consistent across California.
Sales Tax
Sales tax is comparable in both localities due to statewide regulation, although slight variations may occur based on specific municipal added taxes or exemptions.
Income
Type
East San Gabriel Valley
Perris Valley
Estimated median household income
$95,242
$71,187
Estimated per capita income
$34,474
$27,699
Cost of living index (U.S. average is 100)
150.2
85.6
If you make $50,000 in Perris Valley, you will have to make $87,734 in East San Gabriel Valley to maintain the same standard of living.
Geographical Conditions
East San Gabriel Valley is located near the coast and boasts a scenic environment with rolling hills and valleys, hence the name. Perris Valley, though further from the coast, is near several state parks and lakes and surrounded by beautiful mountain slopes.
Geographical information
Type
East San Gabriel Valley
Perris Valley
Land area
212.6 sq. miles
276.5 sq. miles
Population density
4,478.5 people per sq. mile
689.3 people per sq. mile
Relative area comparison
East San Gabriel Valley, CA Perris Valley, CA
Education
East San Gabriel Valley boasts stronger educational opportunities, housing a variety of reputable public and private schools, along with community colleges and universities. It also offers various adult education and vocational training programs. Perris Valley’s school system is slightly less renowned, but efforts to improve educational standards and opportunities are ongoing.
East San Gabriel Valley's economy leans towards the service, health care and retail sectors. Despite higher living costs, professionally there are more employment opportunities which pay well. Perris Valley's economy is enhanced by the logistics industry, due to its close proximity to several major highways which make it a strategic location for large-scale warehousing and distribution centers.
Biggest Employers
Some of the largest employers in East San Gabriel Valley include Citrus Community College, City of Hope, and Los Angeles County. In Perris Valley, major employers encompass Ross Distribution Center, Hanesbrands Inc., and Amazon fulfillment centers.
In East San Gabriel Valley (Los Angeles County), 69.7% voted for Democrats and 27.8% for Republicans in 2012 Presidential Election. In Perris Valley (Riverside County), 49.6% voted for Democrats and 48.0% for Republicans.
Elections
Type
Democrats
Republicans
Other
Year
East San Gabriel Valley
Perris Valley
East San Gabriel Valley
Perris Valley
East San Gabriel Valley
Perris Valley
2020
71.0%
53.0%
26.9%
45.0%
2.1%
2.0%
2016
72.0%
49.7%
22.5%
44.4%
5.5%
5.9%
2012
69.7%
49.6%
27.8%
48.0%
2.4%
2.4%
2008
69.2%
50.4%
28.8%
48.1%
1.9%
1.5%
2004
63.3%
41.3%
35.7%
58.2%
1.0%
0.6%
2000
63.6%
45.0%
32.4%
51.6%
4.0%
3.4%
1996
59.3%
43.0%
31.0%
45.6%
9.7%
11.3%
Breakdown of population affiliated with a religious congregation
Type
Adherents
Congregations
Religion
East San Gabriel Valley
Perris Valley
East San Gabriel Valley
Perris Valley
CATHOLIC CHURCH
36.1%
27.5%
4.7%
4.5%
SOUTHERN BAPTIST CONVENTION
1.0%
1.2%
9.0%
11.2%
MUSLIM ESTIMATE
0.7%
0.5%
1.0%
0.7%
AMERICAN BAPTIST CHURCHES IN THE USA
0.5%
0.0%
3.1%
0.7%
SEVENTH DAY ADVENTIST CHURCH
0.5%
0.9%
2.4%
3.4%
EPISCOPAL CHURCH
0.4%
0.2%
1.4%
1.4%
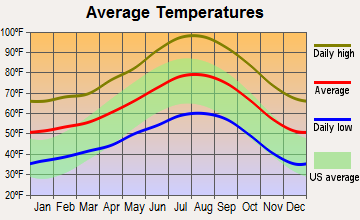
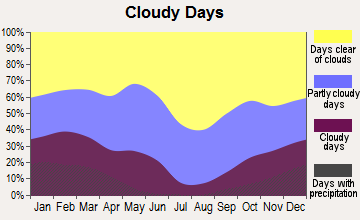
Weather
Both regions experience typical Southern California weather – warm summers and mild winters. East San Gabriel Valley, being closer to the coast, enjoys a slightly cooler and less extreme climate than Perris Valley. Perris Valley experiences more intense seasonal temperature swings, due to its inland location.
Weather and climate
Type
East San Gabriel Valley
Perris Valley
Temperature - Average
62.7°F
64.1°F
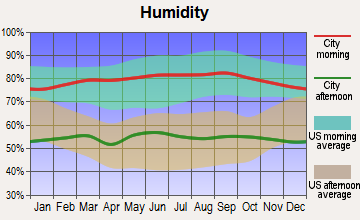
Humidity - Average morning or afternoon humidity
64.7%
68%
Humidity - Differences between morning and afternoon humidity
19.6%
22.4%
Humidity - Maximum monthly morning or afternoon humidity
70.7%
75.1%
Humidity - Minimum monthly morning or afternoon humidity
51%
52.7%
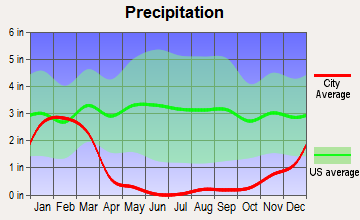
Precipitation - Yearly average
19.1 in
11.5 in
Snowfall - Yearly average
0 in
0 in
Clouds - Number of days clear of clouds
28.3%
27.1%
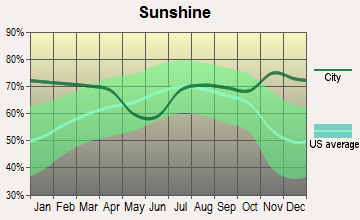
Sunshine amount - Average
78.4%
77.6%
Sunshine amount - Differences during a year
22%
20.5%
Sunshine amount - Maximum monthly
85%
82%
Sunshine amount - Minimum monthly
63%
61.5%
Wind speed - Average
3.7 mph
5 mph
Average climate in East San Gabriel Valley, California
Average climate in Perris Valley, California
Air pollution
Type
AQI
CO
NO2
OZONE
PB
PM10
PM25
SO2
Year
East San Gabriel Valley
Perris Valley
East San Gabriel Valley
Perris Valley
East San Gabriel Valley
Perris Valley
East San Gabriel Valley
Perris Valley
East San Gabriel Valley
Perris Valley
East San Gabriel Valley
Perris Valley
East San Gabriel Valley
Perris Valley
East San Gabriel Valley
Perris Valley
2018
143
154
0.36
0.28
14.1
9.3
29.2
33.0
0.007
0.006
29.6
27.9
13.4
8.9
0.3
0.5
2017
150
146
0.35
0.28
14.8
8.7
30.5
33.0
0.007
0.004
32.7
28.9
12.6
11.4
0.3
0.3
2016
141
143
0.31
0.25
15.5
8.9
29.3
31.6
0.007
0.006
30.3
27.6
12.0
11.0
0.3
0.2
2015
145
145
0.30
0.22
15.2
9.0
30.4
31.6
0.007
0.004
30.0
25.5
14.6
11.6
0.2
0.3
2014
142
148
0.32
0.24
16.8
10.5
29.7
32.6
0.008
0.006
33.6
31.9
11.7
13.6
0.3
0.3
2013
147
150
0.33
0.24
17.0
10.8
27.7
32.4
0.007
0.006
31.5
30.8
11.5
11.7
0.4
0.2
2012
149
145
0.39
0.23
18.3
11.3
27.5
31.4
0.005
0.007
30.9
28.3
15.6
12.1
0.6
0.2
2011
149
149
0.40
0.26
18.6
11.7
26.7
31.0
0.008
0.006
30.3
30.1
17.3
13.2
0.5
0.3
2010
139
146
0.44
0.29
19.3
12.3
26.8
31.4
N/A
0.008
26.6
27.8
14.8
13.3
0.4
1.3
2009
156
151
0.40
0.26
21.0
14.3
28.0
31.3
0.010
0.010
26.0
30.8
16.5
13.8
0.6
1.6
2008
156
155
0.48
0.34
22.7
14.9
27.7
32.3
0.012
0.011
27.0
40.0
15.1
12.0
1.0
0.9
2007
135
125
0.52
0.41
25.3
15.6
24.8
31.8
0.014
0.013
N/A
N/A
N/A
N/A
1.3
1.5
2006
128
126
0.55
0.37
25.1
16.2
24.0
30.9
0.009
0.007
N/A
N/A
N/A
N/A
1.9
1.3
2005
127
129
0.59
0.35
25.7
15.7
22.8
25.4
0.014
0.012
N/A
N/A
N/A
N/A
1.9
3.4
2004
132
137
0.68
0.42
25.4
15.5
24.6
30.2
0.016
0.013
N/A
N/A
N/A
N/A
1.7
3.4
2003
137
140
0.80
0.57
29.9
18.3
24.7
31.9
0.021
0.020
N/A
N/A
N/A
N/A
1.4
2.2
2002
134
138
0.83
0.57
31.4
18.3
23.1
33.2
0.021
0.015
N/A
N/A
N/A
N/A
2.0
0.1
2001
141
145
1.00
0.79
31.8
19.2
21.4
32.5
0.029
0.052
N/A
N/A
N/A
N/A
2.1
0.8
2000
150
157
1.05
0.83
34.7
18.4
20.7
28.8
0.027
0.033
N/A
N/A
N/A
N/A
2.0
1.1
Natural disasters
Type
East San Gabriel Valley
Perris Valley
Tornado activity compared to U.S. average
18.5%
16.2%
Earthquake activity compared to U.S. average
7,292.4%
7,175.7%
Natural disasters compared to U.S. average
57%
46%
Transportation
East San Gabriel Valley offers excellent transportation options due in part to its proximity to LA, with ample bus and train services. Ferris Valley's transportation infrastructure is improving, although individual cars are currently the most common means of commuting.
Transport
Type
East San Gabriel Valley
Perris Valley
Amtrak stations nearby
3
3
Means of transportation to work
Type
East San Gabriel Valley
Perris Valley
Bicycle
0.6%
0.3%
Bus
2.9%
1%
Carpooled
17.1%
18%
Car alone
73.3%
73.6%
Motorcycle
0.2%
0.1%
Railroad
0.6%
0.2%
Walked
2.2%
1.4%
Average travel time to work
Type
East San Gabriel Valley
Perris Valley
Average
32.3 min
37 min
Real Estate
Real estate in East San Gabriel Valley tends to be pricier, with its houses boasting higher property values due to high demand and accessibility to Los Angeles. In comparison, housing in Perris Valley is more affordable, with more options for larger properties at lower costs.
Neighborhoods
Neighborhoods in East San Gabriel Valley are mostly suburban, boasting a variety of trendy shops and eateries. They enjoy a mix of urban and suburban feel making them quite desirable. Perris Valley neighborhoods are more rural and community-oriented, with a slower pace of life and wider open spaces.
Houses and residents
Type
East San Gabriel Valley
Perris Valley
Houses
270,240
51,323
Average household size (people)
3.5
3.4
Houses occupied
263,338 (97.4%)
46,991 (91.6%)
Houses occupied by owners
180,683 (68.6%)
36,693 (78.1%)
Houses occupied by renters
82,655 (31.4%)
10,298 (21.9%)
Median rent asked for vacant for-rent units
$1,935
$1,322
Median price asked for vacant for-sale houses and condos
$1,138,428
$464,486
Estimated median house or condo value
$643,048
$376,802
Median number of rooms in apartments
3.7
5.7
Median number of rooms in houses and condos
5.9
6.2
Renting percentage
32.3%
27.2%
Housing density (houses/condos per square mile)
1,270.8
185.6
Household income disparities
40.3%
42.4%
Housing units without a mortgage
26,635 (16.4%)
6,227 (22.3%)
Housing units with both a second mortgage and home equity loan
515 (0.3%)
116 (0.4%)
Housing units with a mortgage
136,243 (83.6%)
21,647 (77.7%)
Housing units with a home equity loan
11,429 (7%)
962 (3.5%)
Housing units with a second mortgage
21,150 (13%)
3,573 (12.8%)
Housing units lacking complete kitchen facilities
1%
1.1%
Housing units lacking complete plumbing facilities
0.8%
0.9%
Housing units in structures
Housing units in structures
East San Gabriel Valley
Perris Valley
One, detached
68.5%
69.3%
One, attached
8.2%
3.1%
Two
1.0%
0.5%
3 or 4
3.9%
1.1%
5 to 9
3.0%
0.8%
10 to 19
2.4%
0.6%
20 to 49
2.8%
0.4%
50 or more
6.5%
1.6%
Mobile homes
3.6%
21.7%
Boats, RVs, vans, etc.
0.1%
0.9%
Median real estate property taxes paid for housing units
Self-employed workers in own not incorporated business
25,753
4,282
State government workers
13,845
1,900
Unpaid family workers
1,494
195
Industries and Occupations
East San Gabriel Valley hosts a diverse array of industries including health care, education, retail and professional services with positions ranging from management to sales. Perris Valley, on the other hand, is greatly influenced by the logistics and warehousing industry, thus offering occupations mainly in these sectors.
Both regions provide access to quality healthcare facilities. East San Gabriel has top-notch healthcare centers, including City of Hope, one of the nation's leading cancer treatment facilities. Perris Valley, while lacking any major, nationally renowned health facilities, still provides solid local healthcare services to its residents.
Health (county statistics)
Type
East San Gabriel Valley
Perris Valley
General health status score of residents in this county from 1 (poor) to 5 (excellent)
Infrastructure in East San Gabriel Valley is more developed and modernized due to its close proximity to Los Angeles, with an extensive public transportation network and well-maintained city facilities. Compared to its counterpart, Perris Valley has a more rural infrastructure, with ongoing development plans to improve local amenities and public services.
Infrastructure
Type
East San Gabriel Valley
Perris Valley
TV stations
24
4
Culture and Food
East San Gabriel Valley is renowned for its cultural diversity, as evidenced by a wide array of international cuisines available to residents and visitors. In contrast, Perris Valley offers a more traditional American culture and cuisine, with the added charm of local wineries nearby.
Sports Teams
East San Gabriel Valley residents enjoy close proximity to LA's varied sports offerings, including the Lakers (NBA), Dodgers (MLB), and Rams (NFL). Perris Valley doesn't host any major sports teams, but residents have easy access to the multiple sports teams in nearby greater Los Angeles.
 East San Gabriel Valley, CA
 Perris Valley, CA