The East San Gabriel Valley and Salt Lake City, Utah are two different places with diversified features catering to different life necessities. This comparison discusses the aspects of crime/safety, weather, cost of living, and others, looking into how life can feel in either area, considering if you are relocating or just visiting. There are differences in experience depending on whether someone is seeking a more urban or suburban feel, or a more relaxed or fast-paced lifestyle.
East San Gabriel Valley, CA, generally, seems to have a lower crime rate than Salt Lake City, but it varies from neighborhood to neighborhood. Safety is definitely a strong point for the San Gabriel Valley, but it's worth researching the specifics. On the other hand, Salt Lake City, while dealing with generally higher crime rates, still maintains safety levels congruent to a busy metropolitan area. More policing and neighborhood watch groups have been implemented to ensure public safety.
Cost of Living
Cost of living in East San Gabriel Valley tends to be higher than in Salt Lake City, due to the high costs associated with housing, food, and utilities in California. In particular, real estate prices are considerably higher in East San Gabriel Valley. Salt Lake City, while still offering an urban lifestyle, is generally more affordable across most expense categories.
Income Tax
California has a progressive income tax rate, which can be high for top earners, while Utah levies a flat 4.95% income tax rate, making Utah's income tax system simpler and potentially more affordable for higher earners.
Property Tax
Property taxes in California are limited by Proposition 13 to 1% of the home's assessed value, plus local levies. Utah has a slightly higher property tax rate average of around 0.66%, but the lower home prices in Salt Lake City might result in lower actual property tax bills.
Sales Tax
California has a higher sales tax rate that averages around 8.56% compared to Utah's statewide rate of 6.1%. However, Salt Lake City imposes an additional local sales tax, which makes the combined rate closer to 7.6%.
Income
Type
East San Gabriel Valley
Salt Lake City
Estimated median household income
$95,242
$66,658
Estimated per capita income
$34,474
$44,033
Cost of living index (U.S. average is 100)
150.2
94.9
If you make $50,000 in Salt Lake City, you will have to make $79,136 in East San Gabriel Valley to maintain the same standard of living.
Geographical Conditions
Geographically, East San Gabriel Valley features a flag, suburban landscape with nearby access to both beaches and mountains. Salt Lake City is in a high desert area, bordered by the buoyant waters of the Great Salt Lake and impressive peaks of the Wasatch Range, providing ample outdoor recreational opportunities.
Geographical information
Type
East San Gabriel Valley
Salt Lake City
Land area
212.6 sq. miles
109.1 sq. miles
Population density
4,478.5 people per sq. mile
1,837.9 people per sq. mile
Relative area comparison
East San Gabriel Valley, CA Salt Lake City, UT
Education
Both East San Gabriel Valley and Salt Lake City boast strong education systems. The East San Gabriel Valley includes a number of well-regarded school districts and is near to the University of Southern California and other higher education options. Salt Lake City is home to the University of Utah, which is renowned for research programs, and maintains a relatively lower student to teacher ratio in its public schools.
Both areas offer a variety of employment opportunities. East San Gabriel Valley's economy is diverse with sectors like healthcare, education, and retail providing many jobs, whereas Salt Lake City boosts a fast-growing tech industry and a significant government sector. Salt Lake City's economy is currently growing at a faster pace, and its lower cost of living may make wages go further for many workers.
Biggest Employers
In the East San Gabriel Valley, some of the largest employers include retail giants like Walmart and Costco, healthcare providers like Kaiser Permanente, and the local school districts. Meanwhile, in Salt Lake City, the State of Utah, University of Utah, Sinclair Oil Corporation, and major tech companies like Adobe Systems are the major employers.
In East San Gabriel Valley (Los Angeles County), 69.7% voted for Democrats and 27.8% for Republicans in 2012 Presidential Election. In Salt Lake City (Salt Lake County), 38.1% voted for Democrats and 58.4% for Republicans.
Elections
Type
Democrats
Republicans
Other
Year
East San Gabriel Valley
Salt Lake City
East San Gabriel Valley
Salt Lake City
East San Gabriel Valley
Salt Lake City
2020
71.0%
53.3%
26.9%
42.3%
2.1%
4.4%
2016
72.0%
41.7%
22.5%
32.7%
5.5%
25.6%
2012
69.7%
38.1%
27.8%
58.4%
2.4%
3.5%
2008
69.2%
48.2%
28.8%
48.2%
1.9%
3.6%
2004
63.3%
37.6%
35.7%
59.7%
1.0%
2.7%
2000
63.6%
35.1%
32.4%
55.9%
4.0%
9.0%
1996
59.3%
41.9%
31.0%
45.5%
9.7%
12.5%
Breakdown of population affiliated with a religious congregation
Type
Adherents
Congregations
Religion
East San Gabriel Valley
Salt Lake City
East San Gabriel Valley
Salt Lake City
CATHOLIC CHURCH
36.1%
8.2%
4.7%
1.4%
SOUTHERN BAPTIST CONVENTION
1.0%
0.5%
9.0%
1.3%
MUSLIM ESTIMATE
0.7%
0.4%
1.0%
0.4%
AMERICAN BAPTIST CHURCHES IN THE USA
0.5%
0.1%
3.1%
0.2%
SEVENTH DAY ADVENTIST CHURCH
0.5%
0.1%
2.4%
0.4%
EPISCOPAL CHURCH
0.4%
0.3%
1.4%
0.4%
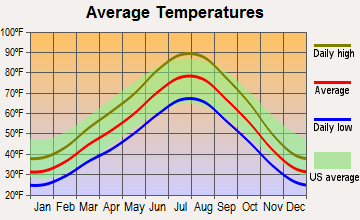
Weather
Weather in the East San Gabriel Valley of California is typical of Southern California – warm, dry summers, and mild, wet winters. The thermometer rarely drops below 40°F, making it an ideal choice for people who enjoy a warm climate year-round. Conversely, Salt Lake City experiences a full range of seasons, with snowy winters, hot summers, and pleasant springs and falls. For people who appreciate the changing seasons, Salt Lake City offers an enviable climate.
Weather and climate
Type
East San Gabriel Valley
Salt Lake City
Temperature - Average
62.7°F
54.1°F
Humidity - Average morning or afternoon humidity
64.7%
57.5%
Humidity - Differences between morning and afternoon humidity
19.6%
57%
Humidity - Maximum monthly morning or afternoon humidity
70.7%
78%
Humidity - Minimum monthly morning or afternoon humidity
51%
21%
Precipitation - Yearly average
19.1 in
17.8 in
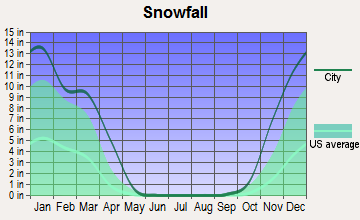
Snowfall - Yearly average
0 in
117.2 in
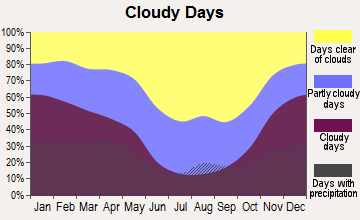
Clouds - Number of days clear of clouds
28.3%
20.8%
Sunshine amount - Average
78.4%
72.4%
Sunshine amount - Differences during a year
22%
46%
Sunshine amount - Maximum monthly
85%
85%
Sunshine amount - Minimum monthly
63%
39%
Wind speed - Average
3.7 mph
9.1 mph
Average climate in East San Gabriel Valley, California
Average climate in Salt Lake City, Utah
Air pollution
Type
AQI
CO
NO2
OZONE
PB
PM10
PM25
SO2
Year
East San Gabriel Valley
Salt Lake City
East San Gabriel Valley
Salt Lake City
East San Gabriel Valley
Salt Lake City
East San Gabriel Valley
Salt Lake City
East San Gabriel Valley
Salt Lake City
East San Gabriel Valley
East San Gabriel Valley
Salt Lake City
East San Gabriel Valley
Salt Lake City
2018
143
98
0.36
0.21
14.1
15.6
29.2
29.9
0.007
N/A
29.6
N/A
13.4
8.5
0.3
0.4
2017
150
102
0.35
0.30
14.8
13.8
30.5
31.6
0.007
N/A
32.7
N/A
12.6
8.0
0.3
0.3
2016
141
99
0.31
N/A
15.5
17.2
29.3
29.1
0.007
N/A
30.3
N/A
12.0
8.2
0.3
N/A
2015
145
85
0.30
0.35
15.2
14.9
30.4
29.2
0.007
N/A
30.0
N/A
14.6
7.4
0.2
0.3
2014
142
82
0.32
0.36
16.8
15.1
29.7
26.8
0.008
N/A
33.6
N/A
11.7
7.5
0.3
0.5
2013
147
95
0.33
0.36
17.0
18.0
27.7
27.4
0.007
N/A
31.5
N/A
11.5
10.7
0.4
1.4
2012
149
89
0.39
0.35
18.3
16.2
27.5
29.5
0.005
N/A
30.9
N/A
15.6
7.3
0.6
1.5
2011
149
87
0.40
0.34
18.6
18.1
26.7
27.5
0.008
N/A
30.3
N/A
17.3
7.9
0.5
1.5
2010
139
106
0.44
N/A
19.3
16.1
26.8
26.4
N/A
N/A
26.6
N/A
14.8
10.9
0.4
4.1
2009
156
105
0.40
0.47
21.0
18.3
28.0
26.0
0.010
N/A
26.0
N/A
16.5
12.5
0.6
4.0
2008
156
102
0.48
0.56
22.7
21.8
27.7
24.6
0.012
N/A
27.0
N/A
15.1
12.0
1.0
2.3
2007
135
108
0.52
0.63
25.3
23.4
24.8
25.4
0.014
N/A
N/A
N/A
N/A
13.2
1.3
1.8
2006
128
100
0.55
0.55
25.1
22.1
24.0
27.0
0.009
N/A
N/A
N/A
N/A
9.6
1.9
2.2
2005
127
91
0.59
0.64
25.7
23.5
22.8
N/A
0.014
0.039
N/A
N/A
N/A
N/A
1.9
3.0
2004
132
78
0.68
0.64
25.4
25.4
24.6
N/A
0.016
0.043
N/A
N/A
N/A
N/A
1.7
4.2
2003
137
80
0.80
0.80
29.9
24.2
24.7
N/A
0.021
0.035
N/A
N/A
N/A
N/A
1.4
4.8
2002
134
92
0.83
0.70
31.4
27.1
23.1
N/A
0.021
0.016
N/A
N/A
N/A
N/A
2.0
3.6
2001
141
88
1.00
0.82
31.8
26.5
21.4
N/A
0.029
0.029
N/A
N/A
N/A
N/A
2.1
4.0
2000
150
96
1.05
0.94
34.7
26.5
20.7
N/A
0.027
0.044
N/A
N/A
N/A
N/A
2.0
4.2
Natural disasters
Type
East San Gabriel Valley
Salt Lake City
Tornado activity compared to U.S. average
18.5%
10%
Earthquake activity compared to U.S. average
7,292.4%
2,272.3%
Natural disasters compared to U.S. average
57%
9%
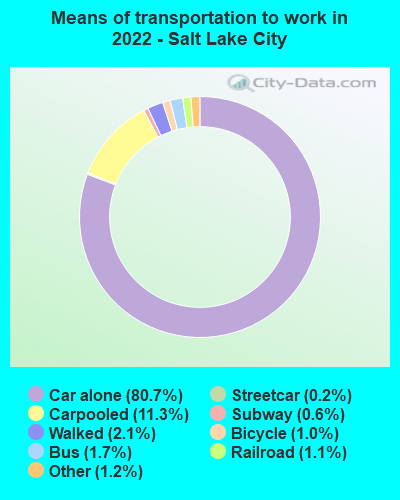
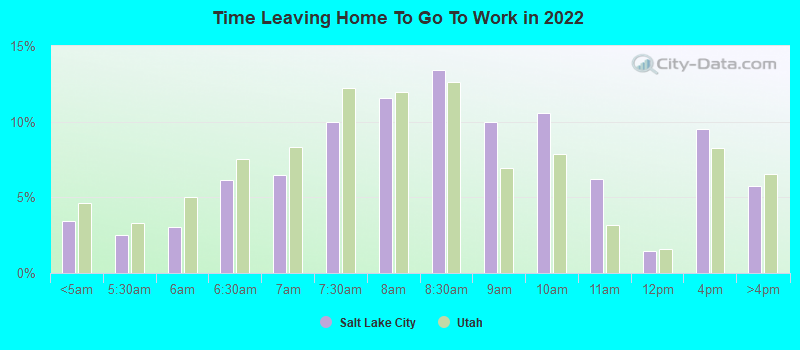
Transportation
Public transit and commuting experiences differ between the two areas. East San Gabriel Valley, while served by multiple freeways and public buses, can face heavy congestion. Salt Lake City offers a variety of public transit options, including bus, light rail (TRAX), and commuter rail (FrontRunner), that serve both urban and suburban areas well.
Transport
Type
East San Gabriel Valley
Salt Lake City
Amtrak stations
0
1
Amtrak stations nearby
3
1
Means of transportation to work
Type
East San Gabriel Valley
Salt Lake City
Bicycle
0.6%
1.2%
Bus
2.9%
2.3%
Carpooled
17.1%
9.9%
Car alone
73.3%
81%
Ferryboat
0%
0.1%
Motorcycle
0.2%
0.2%
Railroad
0.6%
1.1%
Streetcar
0%
0.2%
Subway
0.1%
0.6%
Walked
2.2%
2.4%
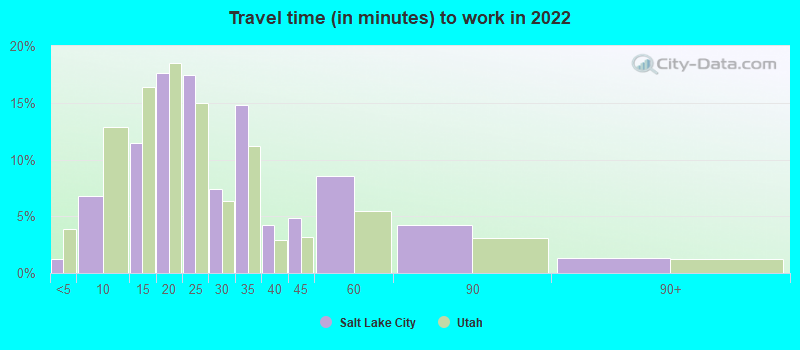
Average travel time to work
Type
East San Gabriel Valley
Salt Lake City
Average
32.3 min
27.8 min
Real Estate
Real-estate is pricier in East San Gabriel Valley compared to Salt Lake City. The former is part of the larger Los Angeles market, which is notorious for its high property values. Salt Lake City, though growing quickly, still generally offers more affordable housing options.
Neighborhoods
East San Gabriel Valley is known for some affluent communities like Walnut and Diamond Bar that offer a suburban atmosphere. Salt Lake City boasts a variety of neighborhoods, including the downtown area's urban apartments and historic districts like Sugar House with charming older homes.
Houses and residents
Type
East San Gabriel Valley
Salt Lake City
Houses
270,240
99,551
Average household size (people)
3.5
2.4
Houses occupied
263,338 (97.4%)
89,839 (90.2%)
Houses occupied by owners
180,683 (68.6%)
42,681 (47.5%)
Houses occupied by renters
82,655 (31.4%)
47,158 (52.5%)
Median rent asked for vacant for-rent units
$1,935
$1,183
Median price asked for vacant for-sale houses and condos
$1,138,428
$1,040,755
Estimated median house or condo value
$643,048
$459,800
Median number of rooms in apartments
3.7
3.5
Median number of rooms in houses and condos
5.9
6.8
Renting percentage
32.3%
51.6%
Housing density (houses/condos per square mile)
1,270.8
912.6
Household income disparities
40.3%
45.4%
Housing units without a mortgage
26,635 (16.4%)
515 (1.8%)
Housing units with both a second mortgage and home equity loan
515 (0.3%)
2,740 (9.6%)
Housing units with a mortgage
136,243 (83.6%)
28,000 (98.2%)
Housing units with a home equity loan
11,429 (7%)
0 (0%)
Housing units with a second mortgage
21,150 (13%)
3,493 (12.2%)
Housing units lacking complete kitchen facilities
1%
1.8%
Housing units lacking complete plumbing facilities
Self-employed workers in own not incorporated business
25,753
4,972
State government workers
13,845
11,071
Unpaid family workers
1,494
177
Industries and Occupations
East San Gabriel Valley has a healthy mix of industries such as retail, health care, and education with occupations varying accordingly. On the other hand, Salt Lake City has a strong emphasis on the government and tech sectors, making it a hotspot for related professions. Both areas also have a solid base of service industry professions due to tourism.
Both regions offer reliable healthcare services. East San Gabriel Valley benefits from the presence of high-quality healthcare system in the greater Los Angeles area, including numerous specialist facilities. Salt Lake City is home to the University of Utah Hospital, one of the top academic hospitals in the country, along with other high-quality healthcare facilities.
Health (county statistics)
Type
East San Gabriel Valley
Salt Lake City
General health status score of residents in this county from 1 (poor) to 5 (excellent)
Infrastructure varies greatly between the two locales. East San Gabriel Valley has a well-established infrastructure with extensive freeway networks, public transportation services, and utility systems, but suffers from common California problems like traffic and congestion. Salt Lake City's infrastructure is less congested and includes well-maintained roads and an efficient public transportation system, including the TRAX light rail system.
Infrastructure
Type
East San Gabriel Valley
Salt Lake City
TV stations
24
15
Culture and Food
The East San Gabriel Valley offers a diverse food scene, reflective of its large Asian-American community, with a range of various cuisines available. Salt Lake City offers everything from upscale dining to comfort foods and boasts its diverse brewpub scene. Both areas offer cultural activities and venues, such as theaters, museums, and art galleries, but East San Gabriel Valley benefits from its proximity to Los Angeles' cultural offerings.
Sports Teams
In terms of sports, the East San Gabriel Valley locals are generally fans of the Los Angeles area teams like the Lakers, Dodgers, and Rams. Salt Lake City is home to the Utah Jazz NBA team and Real Salt Lake MLS team, offering exciting sporting events for locals and visitors.
 East San Gabriel Valley, CA
 Salt Lake City, UT