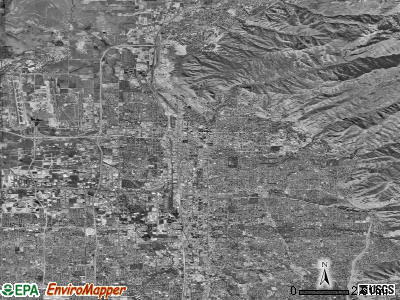
Salt Lake City, Utah

Salt Lake City: Downtown Salt Lake City
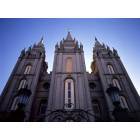
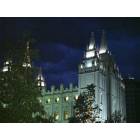
Salt Lake City: The Salt Lake Temple of The Church of Jesus Christ of Latter-day Saints, SLC, UT.
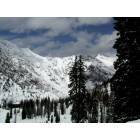
Salt Lake City: Snowbird
Salt Lake City: Temple Square in the throes of an August thunderstorm.
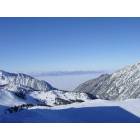
Salt Lake City: Salt Lake City from Snowbird Ski Resort during the "Inversion"
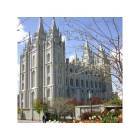
Salt Lake City: slc temple
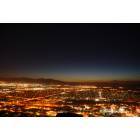
Salt Lake City: Photo taken at Salt Lake City on February 2008 around 6:456 p.m.
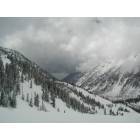
Salt Lake City: Low clouds over Little Cottonwood Canyon Rd
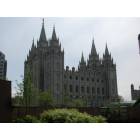
Salt Lake City: Mormon Temple, Temple Square, Salt Lake City
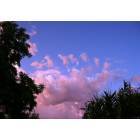
Salt Lake City: Sunset cloud
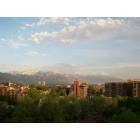
Salt Lake City: View from Capitol Hill of the Wasatch Mountains
- see
67
more - add
your
Submit your own pictures of this city and show them to the world
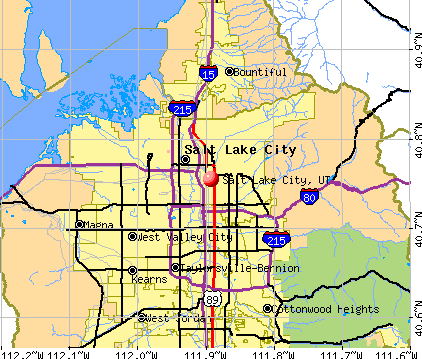
- OSM Map
- General Map
- Google Map
- MSN Map
Population change since 2000: +12.6%
 |
| Males: 103,805 | |
| Females: 100,852 |
| Median resident age: | 31.9 years |
| Utah median age: | 32.1 years |
Zip codes: 84101, 84102, 84103, 84104, 84105, 84111, 84112, 84113, 84115, 84116, 84119, 84128, 84144, 84180.
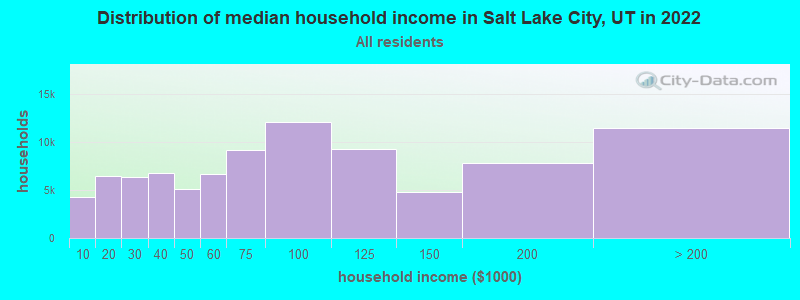
Salt Lake City Zip Code Map| Salt Lake City: | $75,529 |
| UT: | $89,168 |
Estimated per capita income in 2022: $49,767 (it was $20,752 in 2000)
Salt Lake City city income, earnings, and wages data
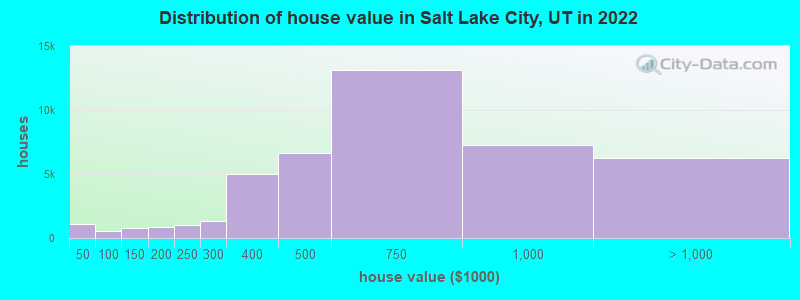
Estimated median house or condo value in 2022: $563,300 (it was $152,400 in 2000)
| Salt Lake City: | $563,300 |
| UT: | $499,500 |
Mean prices in 2022: all housing units: $696,285; detached houses: $735,843; townhouses or other attached units: $482,286; in 2-unit structures: $528,524; in 3-to-4-unit structures: over $1,000,000; in 5-or-more-unit structures: $517,403; mobile homes: $143,744
Median gross rent in 2022: $1,316.
Salt Lake City, UT residents, houses, and apartments details
(12.8% for White Non-Hispanic residents, 28.9% for Black residents, 15.5% for Hispanic or Latino residents, 17.5% for American Indian residents, 3.7% for Native Hawaiian and other Pacific Islander residents, 17.7% for other race residents, 15.3% for two or more races residents)
Detailed information about poverty and poor residents in Salt Lake City, UT


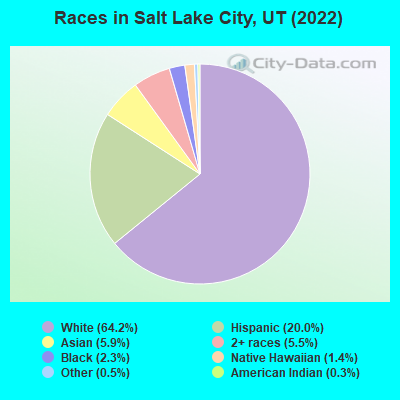
- 131,31364.2%White alone
- 40,91120.0%Hispanic
- 12,1435.9%Asian alone
- 11,1575.5%Two or more races
- 4,6442.3%Black alone
- 2,8921.4%Native Hawaiian and Other
Pacific Islander alone - 9270.5%Other race alone
- 6660.3%American Indian alone
Races in Salt Lake City detailed stats: ancestries, foreign born residents, place of birth
According to our research of Utah and other state lists, there were 975 registered sex offenders living in Salt Lake City, Utah as of April 27, 2024.
The ratio of all residents to sex offenders in Salt Lake City is 199 to 1.
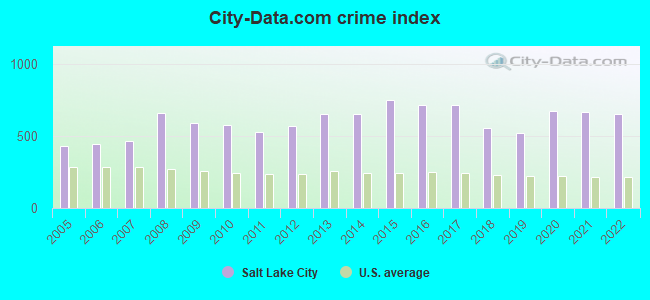
The City-Data.com crime index weighs serious crimes and violent crimes more heavily. Higher means more crime, U.S. average is 246.1. It adjusts for the number of visitors and daily workers commuting into cities.
- means the value is smaller than the state average.- means the value is about the same as the state average.
- means the value is bigger than the state average.
- means the value is much bigger than the state average.
Crime rate in Salt Lake City detailed stats: murders, rapes, robberies, assaults, burglaries, thefts, arson
Full-time law enforcement employees in 2021, including police officers: 627 (490 officers - 440 male; 50 female).
| Officers per 1,000 residents here: | 2.38 |
| Utah average: | 1.67 |
 Recent articles from our blog. Our writers, many of them Ph.D. graduates or candidates, create easy-to-read articles on a wide variety of topics.


Latest news from Salt Lake City, UT collected exclusively by city-data.com from local newspapers, TV, and radio stations
Ancestries: English (11.9%), European (5.0%), German (4.8%), American (4.2%), Irish (3.4%), Italian (2.3%).
Current Local Time: MST time zone
Incorporated in 1851
Elevation: 4266 feet
Land area: 109.1 square miles.
Population density: 1,876 people per square mile (low).
32,774 residents are foreign born (7.3% Latin America, 4.2% Asia, 1.8% Europe).
| This city: | 16.2% |
| Utah: | 8.4% |
Median real estate property taxes paid for housing units with mortgages in 2022: $2,469 (0.4%)
Median real estate property taxes paid for housing units with no mortgage in 2022: $2,771 (0.5%)
Nearest city with pop. 200,000+: Las Vegas, NV  (363.3 miles , pop. 478,434).
Nearest city with pop. 1,000,000+: Phoenix, AZ (499.9 miles , pop. 1,321,045).
Nearest cities:
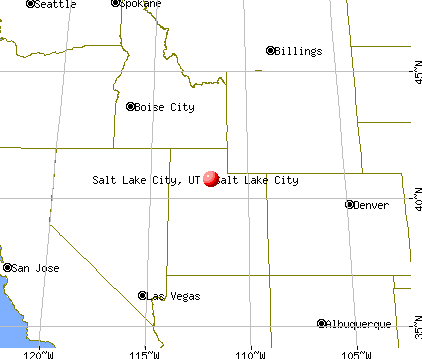
), ), ), ), ), )Latitude: 40.75 N, Longitude: 111.89 W
Daytime population change due to commuting: +144,975 (+70.8%)
Workers who live and work in this city: 85,436 (67.4%)
Area code: 801
Detailed articles:
- Salt Lake City: Introduction
- Salt Lake City Basic Facts
- Salt Lake City: Communications
- Salt Lake City: Convention Facilities
- Salt Lake City: Economy
- Salt Lake City: Education and Research
- Salt Lake City: Geography and Climate
- Salt Lake City: Health Care
- Salt Lake City: History
- Salt Lake City: Municipal Government
- Salt Lake City: Population Profile
- Salt Lake City: Recreation
- Salt Lake City: Transportation
Salt Lake City tourist attractions:
- Clark Planetarium - Salt Lake City - A space and science themed planetarium and education center
- EnergySolutions Arena Salt Lake City, Utah
- Gilgal Gardens - Salt Lake City, Utah - Park, Secret Garden, Stone Carvings
- Salt Lake Plaza Hotel - Salt Lake City, Utah - Hotel, In Room Refrigerator
- Little America Hotel - Salt Lake City, Utah - Hotel, Conferences, Meetings, Sunday Brunch, Indoor and Outdoor Pool
- Chase Suite Hotel - Salt Lake City, Utah - Hotel, Penthouse Suite, Fully Equipped Kitchens
- Radisson Salt Lake City Downtown - Salt Lake City, Utah - Hotel, High Speed Internet, Pets Allowed, Indoor Pool
- Shilo Inn Suites Hotel - Salt Lake City, Utah - Hotel, Suites, Pets allowed
- Red Lion Hotel Salt Lake Downtown - Salt Lake City, Utah - Hotel, Meeting and Conference Space
- Sheraton City Center Hotel - Salt Lake, Salt Lake City, Utah - Hotel, In Room
- Hilton Salt Lake City Center - Salt Lake City, Utah - Hotel, Spencer's Steakhouse, Starbucks
- Peery Hotel - Salt Lake City, Utah - Hotel, Historic Landmark, In Room Refrigerators
- Salt Palace Convention Center-Salt Lake City, Utah-Convention Center, Exhibit Space
- International Peace Gardens at Jordan Park-Salt Lake City, Utah-Botanical Gardens, Park, Statues
- Gallivan Center-Salt Lake City, Utah-Ice Skating, Free Concerts, Downtown Center
- Solitude Mountain Resort - Solitude, Utah - Ski Resort, European Styling, Shopping, Spa, Hiking
- Solitude Mountain - Solitude, Utah - Skiing, Hiking, Family-friendly
- Discovery Gateway - Salt Lake City, Utah - Children's Museum, Hands-on Exhibits
- Capitol Theater - Salt Lake City, Utah - Theater, Plays, Ballet, Opera
- Red Butte Garden - Salt Lake City, Utah - Gardens, Horticulture Classes, Outdoor Concerts, Hiking
- Memory Grove Park - Salt Lake City, Utah - Park, Hiking, Veterans Monuments
- Future City Creek Center - Salt Lake City, Utah - A shopping and residential district under construction near Temple Square
- Hotel Monaco - Salt Lake City, Utah - A boutique hotel owned by Kimpton Hotels
- Liberty Park - Salt Lake City, Utah - A large, recreation park located within the city
- Embassy Suites Hotel Salt Lake City
- Marriott Salt Lake City Downtown
- Marriott Salt Lake City City Center
- Trolley Square - Salt Lake City, Utah - Indoor Shopping Mall, Historic site
- Gateway District - Salt Lake City, Utah - Outdoor Mall, restaurants, Children's Museum, Planetarium
- Olympic Cauldron Park - Salt Lake City, Utah - A 2002 Winter Olympics commemorative plaza, the site of the Opening and Closing ceremonies of the XIX Olympic Winter Games
- Raging Waters Park - Salt Lake City, Utah - Water Park with several different water themed attractions
- Salt Lake City International Airport - Salt Lake City UT Salt Lake City Airport Flights
- Salt Lake Tabernacle - Salt Lake City, Utah - Concert Hall and home of the Mormon Tabernacle Choir
- Salt Lake Temple - Utah - The largest temple of The Church of Jesus Christ of Latter-day Saints
- Sugar House Neighborhood - Salt Lake City, Utah - A historical neighborhood consisting of residential areas, as well as businesses
- The Avenues - Salt Lake City, Utah - The Avenues is a historic neighborhood on the Northeast Bench of Salt Lake City
- The Gateway - Salt Lake City, Utah - A large shopping, office, and residential district
- The Grand American Hotel - Salt Lake City, Utah - One of the leading hotels of the world
- Tracy Aviary - Salt Lake City, Utah - A public aviary featuring over 400 birds
- Utah's Hogle Zoo - Salt Lake City - The state's largest zoo featuring a variety of different animals from around the world
- Utah Museum of Fine Arts - Salt Lake City - A Fine Arts museum displaying works from a variety of cultures
- Utah Museum of Natural History - Salt Lake City, Utah - Museum features natural history exhibits with a focus on Utah's natural history
Salt Lake City, Utah accommodation & food services, waste management - Economy and Business Data
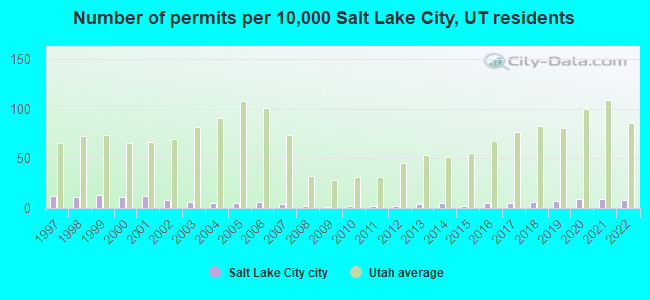
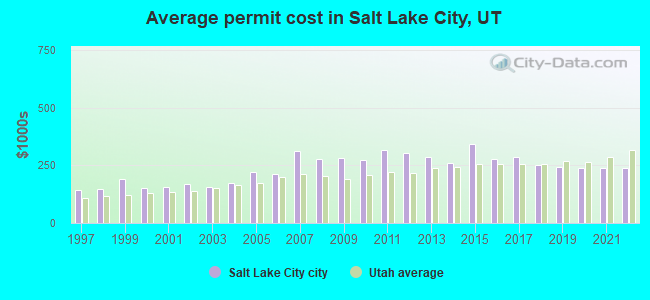
Single-family new house construction building permits:
- 2022: 144 buildings, average cost: $238,700
- 2021: 172 buildings, average cost: $239,000
- 2020: 168 buildings, average cost: $238,200
- 2019: 127 buildings, average cost: $241,500
- 2018: 109 buildings, average cost: $253,300
- 2017: 88 buildings, average cost: $286,400
- 2016: 90 buildings, average cost: $277,000
- 2015: 36 buildings, average cost: $341,700
- 2014: 95 buildings, average cost: $258,100
- 2013: 80 buildings, average cost: $285,000
- 2012: 41 buildings, average cost: $303,400
- 2011: 28 buildings, average cost: $317,900
- 2010: 30 buildings, average cost: $271,900
- 2009: 27 buildings, average cost: $281,000
- 2008: 37 buildings, average cost: $275,900
- 2007: 67 buildings, average cost: $310,100
- 2006: 117 buildings, average cost: $212,300
- 2005: 96 buildings, average cost: $220,300
- 2004: 92 buildings, average cost: $174,500
- 2003: 111 buildings, average cost: $157,700
- 2002: 144 buildings, average cost: $168,900
- 2001: 212 buildings, average cost: $155,800
- 2000: 209 buildings, average cost: $152,000
- 1999: 234 buildings, average cost: $190,900
- 1998: 208 buildings, average cost: $147,300
- 1997: 226 buildings, average cost: $144,300
| Here: | 2.8% |
| Utah: | 2.5% |
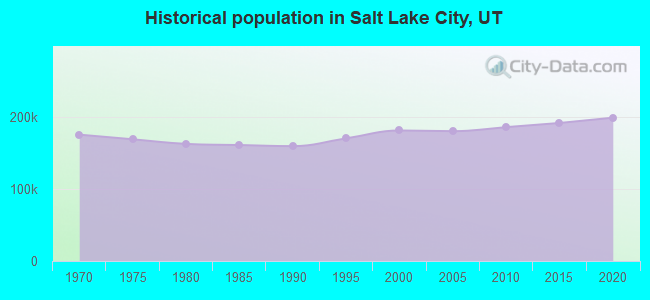
Population change in the 1990s: +21,667 (+13.5%).
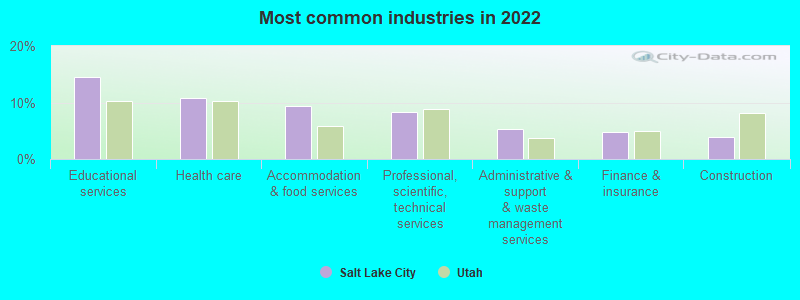
- Educational services (14.5%)
- Health care (10.7%)
- Accommodation & food services (9.5%)
- Professional, scientific, technical services (8.2%)
- Administrative & support & waste management services (5.4%)
- Finance & insurance (4.7%)
- Construction (3.9%)
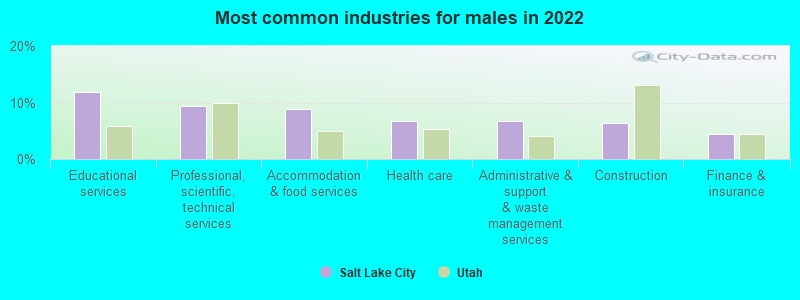
- Educational services (11.9%)
- Professional, scientific, technical services (9.3%)
- Accommodation & food services (8.8%)
- Health care (6.8%)
- Administrative & support & waste management services (6.7%)
- Construction (6.3%)
- Finance & insurance (4.4%)
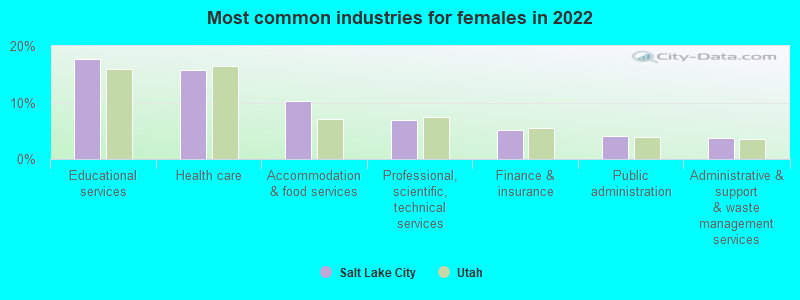
- Educational services (17.8%)
- Health care (15.7%)
- Accommodation & food services (10.3%)
- Professional, scientific, technical services (6.9%)
- Finance & insurance (5.1%)
- Public administration (4.2%)
- Administrative & support & waste management services (3.7%)
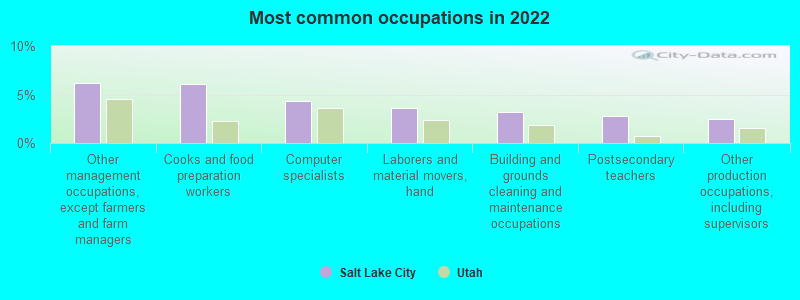
- Other management occupations, except farmers and farm managers (6.2%)
- Cooks and food preparation workers (6.1%)
- Computer specialists (4.3%)
- Laborers and material movers, hand (3.6%)
- Building and grounds cleaning and maintenance occupations (3.2%)
- Postsecondary teachers (2.8%)
- Other production occupations, including supervisors (2.5%)
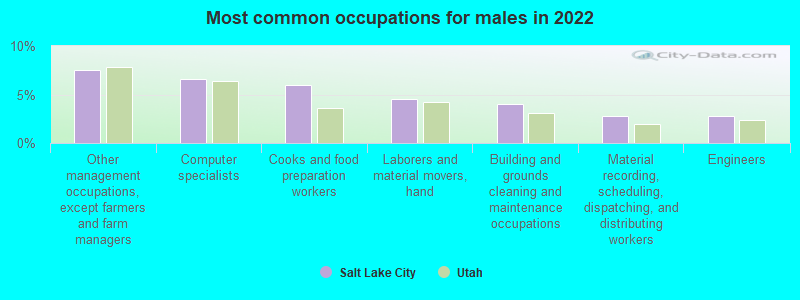
- Other management occupations, except farmers and farm managers (7.5%)
- Computer specialists (6.6%)
- Cooks and food preparation workers (6.0%)
- Laborers and material movers, hand (4.5%)
- Building and grounds cleaning and maintenance occupations (4.0%)
- Material recording, scheduling, dispatching, and distributing workers (2.8%)
- Engineers (2.8%)
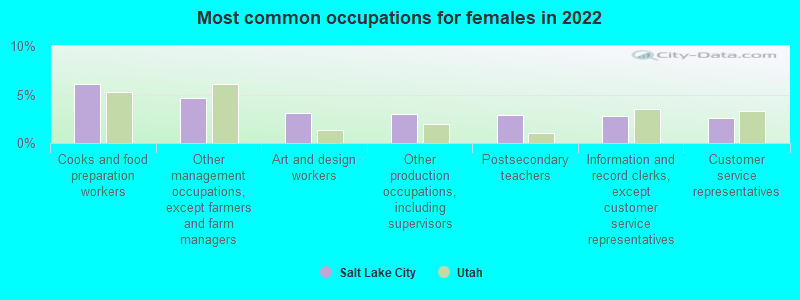
- Cooks and food preparation workers (6.1%)
- Other management occupations, except farmers and farm managers (4.7%)
- Art and design workers (3.1%)
- Other production occupations, including supervisors (3.0%)
- Postsecondary teachers (2.8%)
- Information and record clerks, except customer service representatives (2.8%)
- Customer service representatives (2.6%)
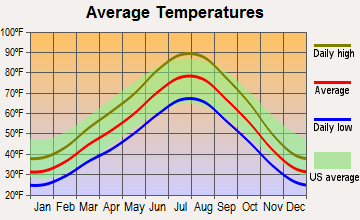
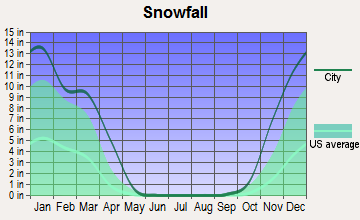
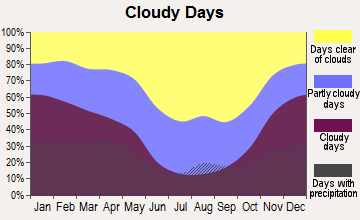
Average climate in Salt Lake City, Utah
Based on data reported by over 4,000 weather stations


|
|

(lower is better)
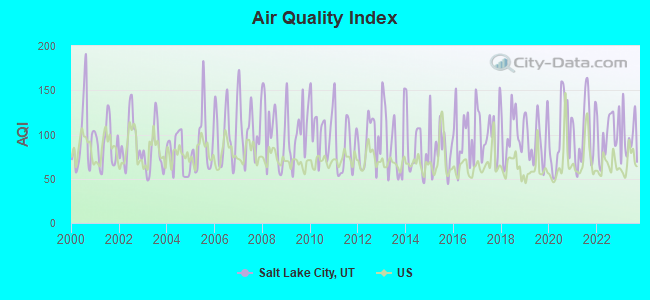
Air Quality Index (AQI) level in 2023 was 95.8. This is worse than average.
| City: | 95.8 |
| U.S.: | 72.6 |
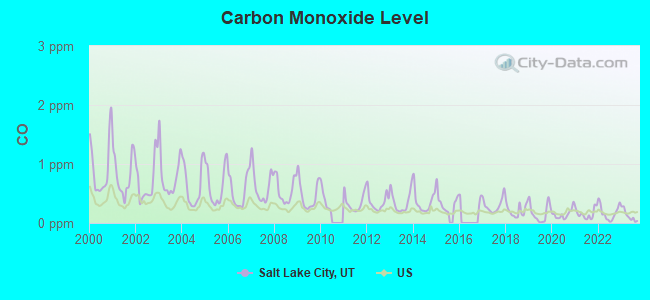
Carbon Monoxide (CO) [ppm] level in 2023 was 0.125. This is significantly better than average. Closest monitor was 0.4 miles away from the city center.
| City: | 0.125 |
| U.S.: | 0.251 |
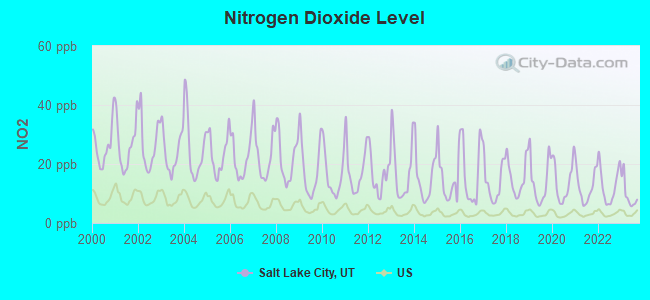
Nitrogen Dioxide (NO2) [ppb] level in 2023 was 9.62. This is significantly worse than average. Closest monitor was 0.4 miles away from the city center.
| City: | 9.62 |
| U.S.: | 5.11 |
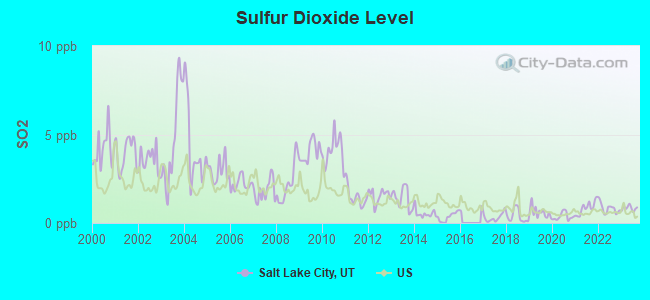
Sulfur Dioxide (SO2) [ppb] level in 2023 was 0.843. This is significantly better than average. Closest monitor was 0.4 miles away from the city center.
| City: | 0.843 |
| U.S.: | 1.515 |
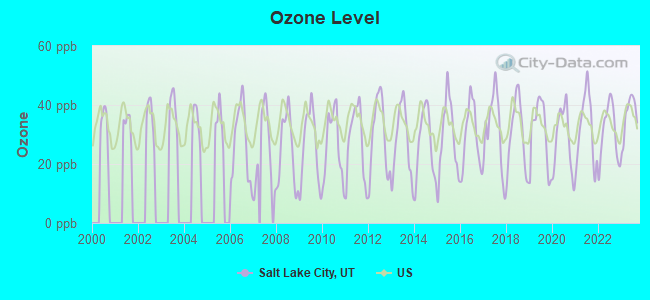
Ozone [ppb] level in 2023 was 36.4. This is about average. Closest monitor was 0.4 miles away from the city center.
| City: | 36.4 |
| U.S.: | 33.3 |
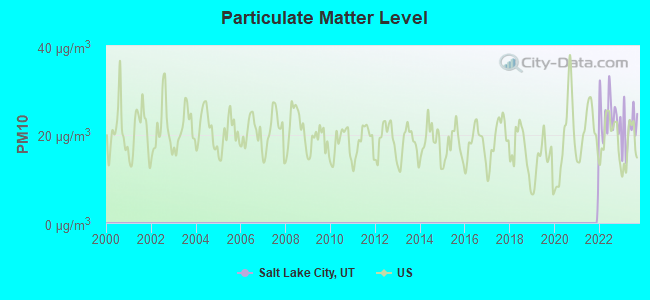
Particulate Matter (PM10) [µg/m3] level in 2023 was 21.2. This is about average. Closest monitor was 1.7 miles away from the city center.
| City: | 21.2 |
| U.S.: | 19.2 |
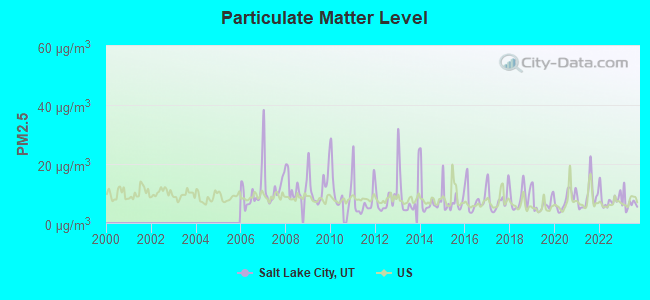
Particulate Matter (PM2.5) [µg/m3] level in 2023 was 6.84. This is about average. Closest monitor was 1.7 miles away from the city center.
| City: | 6.84 |
| U.S.: | 8.11 |
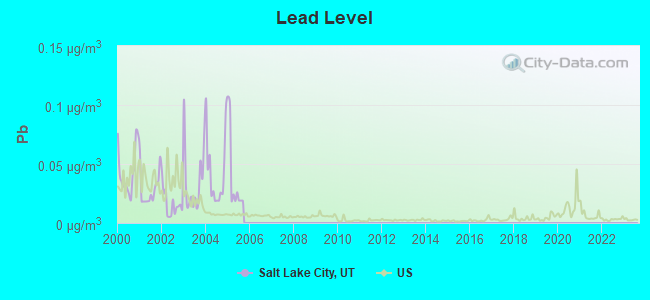
Lead (Pb) [µg/m3] level in 2005 was 0.0394. This is significantly worse than average. Closest monitor was 0.4 miles away from the city center.
| City: | 0.0394 |
| U.S.: | 0.0093 |
Earthquake activity:
Salt Lake City-area historical earthquake activity is significantly above Utah state average. It is 2172% greater than the overall U.S. average.On 8/18/1959 at 06:37:13, a magnitude 7.7 (7.7 UK, Class: Major, Intensity: VIII - XII) earthquake occurred 271.0 miles away from the city center, causing $26,000,000 total damage
On 10/3/1915 at 06:52:48, a magnitude 7.6 (7.6 UK) earthquake occurred 294.8 miles away from the city center
On 10/28/1983 at 14:06:06, a magnitude 7.3 (6.2 MB, 7.3 MS, 7.0 MW) earthquake occurred 249.6 miles away from Salt Lake City center, causing 2 deaths (2 shaking deaths) and 3 injuries, causing $15,000,000 total damage
On 3/28/1975 at 02:31:05, a magnitude 6.2 (6.1 MB, 6.0 MS, 6.2 ML, Class: Strong, Intensity: VII - IX) earthquake occurred 92.1 miles away from Salt Lake City center
On 3/18/2020 at 13:09:31, a magnitude 5.7 (5.7 MW, Depth: 7.4 mi, Class: Moderate, Intensity: VI - VII) earthquake occurred 9.7 miles away from Salt Lake City center
On 12/21/1932 at 06:10:09, a magnitude 7.2 (7.2 UK) earthquake occurred 364.4 miles away from the city center
Magnitude types: body-wave magnitude (MB), local magnitude (ML), surface-wave magnitude (MS), moment magnitude (MW)
Natural disasters:
The number of natural disasters in Salt Lake County (9) is smaller than the US average (15).Major Disasters (Presidential) Declared: 4
Emergencies Declared: 1
Causes of natural disasters: Floods: 3, Storms: 3, Fires: 2, Landslides: 2, Earthquake: 1, Hurricane: 1, Mudslide: 1, Tornado: 1, Other: 1 (Note: some incidents may be assigned to more than one category).
Main business address for: QUESTAR MARKET RESOURCES INC (CRUDE PETROLEUM & NATURAL GAS), QUESTAR GAS CO (NATURAL GAS TRANSMISSION & DISTRIBUTION), EVANS & SUTHERLAND COMPUTER CORP (MISCELLANEOUS ELECTRICAL MACHINERY, EQUIPMENT & SUPPLIES), HMP Equity Holdings CORP (CHEMICALS & ALLIED PRODUCTS), HUNTSMAN INTERNATIONAL HOLDINGS LLC (CHEMICALS & ALLIED PRODUCTS), GOLDEN EAGLE INTERNATIONAL INC (METAL MINING), FRANKLIN COVEY CO (BLANKBOOKS, LOOSELEAF BINDERS & BOOKBINDING & RELATED WORK), IOMED INC (PHARMACEUTICAL PREPARATIONS) and 22 other public companies.
Hospitals in Salt Lake City:
- ALPINE HOSPICE, INC (990 WEST 5370 SOUTH)
- HCS HOSPICE SPECIALISTS (3949 SOUTH 700 EAST, SUITE 110)
- INTERMOUNTAIN SURGICAL CENTER (359 8TH AVE)
- LIFEPATH HOSPICE AND FAMILY SERVICES, LLC (5801 FASHION BLVD)
- PARKSIDE RECOVERY CTR/SALT LAKE CITY (1255 EAST 3900 SOUTH)
- PRIMARY CHILDRENS MEDICAL CENTER (Voluntary non-profit - Private, 100 NORTH MARIO CAPECCHI DRIVE)
- SALT LAKE REGIONAL MEDICAL CENTER (Proprietary, 1050 EAST SOUTH TEMPLE)
- ST MARKS HOSPITAL (Proprietary, 1200 EAST 3900 SOUTH)
- UNIVERSITY OF UTAH NEUROPSYCHIATRIC INSTITUTE (501 CHIPETA WAY)
- VENCOR HOSPICE - SALT LAKE CITY (4444 SOUTH 700 EAST SUITE 202)
Airports and heliports located in Salt Lake City:
- Salt Lake City International Airport (SLC) (Runways: 6, Commercial Ops: 184,033, Air Taxi Ops: 75,336, Itinerant Ops: 42,481, Local Ops: 2,752, Military Ops: 5,214)
- South Valley Regional Airport (U42) (Runways: 1, Air Taxi Ops: 658, Itinerant Ops: 18,953, Local Ops: 48,730, Military Ops: 7,593)
- Heliports: 10
Colleges/Universities in Salt Lake City:
- Western Governors University (Full-time enrollment: 31,481; Location: 4001 East 700 South, Suite 700; Private, not-for-profit; Website: www.wgu.edu; Offers Master's degree)
- University of Utah (Full-time enrollment: 28,454; Location: 201 Presidents Circle, ROOM 203; Public; Website: www.utah.edu; Offers Doctor's degree)
- Salt Lake Community College (Full-time enrollment: 20,797; Location: 4600 S Redwood Rd; Public; Website: www.slcc.edu)
- Westminster College (Full-time enrollment: 2,870; Location: 1840 South 1300 East; Private, not-for-profit; Website: www.westminstercollege.edu; Offers Master's degree)
- Latter-day Saints Business College (Full-time enrollment: 2,059; Location: 95 North 300 West; Private, not-for-profit; Website: www.ldsbc.edu)
- Independence University (Full-time enrollment: 1,603; Location: 4021 S 700 E Ste 400; Private, not-for-profit; Website: www.independence.edu; Offers Master's degree)
- University of Phoenix-Utah Campus (Full-time enrollment: 1,392; Location: 5373 S. Green Street; Private, for-profit; Website: www.phoenix.edu; Offers Master's degree)
- Utah College of Massage Therapy-Salt Lake City (Full-time enrollment: 541; Location: 25 South 300 East; Private, for-profit; Website: www.steinered.com)
- Fortis College-Salt Lake City (Full-time enrollment: 503; Location: 3949 S 700 E Ste 150; Private, for-profit; Website: www.fortiscollege.edu)
- Neumont University (Full-time enrollment: 450; Location: 143 South Main Street; Private, for-profit; Website: www.neumont.edu/; Offers Master's degree)
- Eagle Gate College-Salt Lake City (Full-time enrollment: 283; Location: 405 South Main Street-Ste 130; Private, for-profit; Website: eaglegatecollege.edu)
- Midwives College of Utah (Full-time enrollment: 103; Location: 1174 East Graystone Way, Suite #2; Private, not-for-profit; Website: www.midwifery.edu/; Offers Master's degree)
- Healing Mountain Massage School (Full-time enrollment: 101; Location: 363 South 500 East, Suite 210; Private, for-profit; Website: www.healingmountain.edu)
- Broadview Entertainment Arts University (Full-time enrollment: 98; Location: 240 E Morris Ave; Private, for-profit; Website: www.broadviewuniversity.edu/)
- Sherman Kendall Academy-Salt Lake City (Full-time enrollment: 82; Location: 2230 S 700 E; Private, for-profit; Website: www.shermankendall.com)
- Skinworks School of Advanced Skincare (Full-time enrollment: 63; Location: 2121 South 230 East; Private, for-profit; Website: www.skinworks.edu)
- Myotherapy College of Utah (Full-time enrollment: 53; Location: 336 W Bugatti Drive; Private, for-profit; Website: www.myotherapycollege.com)
- Skin Science Institute (Full-time enrollment: 50; Location: 421 S 400 E; Private, for-profit; Website: skinscienceinstitute.com)
Biggest public high schools in Salt Lake City:
- WEST HIGH (Students: 2,562, Location: 241 N 300 W, Grades: 7-12)
- EAST HIGH (Students: 2,110, Location: 840 S 1300 E, Grades: 9-12)
- HORIZONTE INSTR & TRN CTR (Students: 586, Location: 1234 S MAIN, Grades: 7-12)
- WASATCH JR HIGH (Students: 471, Location: 3750 S 3100 E, Grades: 7-9)
- JEAN MASSIEU SCHOOL FOR THE DEAF (Students: 82, Location: 1655 E 3300 S, Grades: PK-12)
- SALT LAKE CENTER FOR SCIENCE EDUCATION (Location: 1400 W GOODWIN AVE, Grades: 6-12, Charter school)
- BRIGHTON HIGH (Location: 2220 E 7695 S, Grades: 8-12)
- UTAH ELECTRONIC HIGH SCHOOL (Location: 250 EAST 500 SOUTH, Grades: 5-12)
- BONNEVILLE JR HIGH (Location: 5330 S 1660 E, Grades: 7-9)
- CHURCHILL JR HIGH (Location: 3450 E 4275 S, Grades: 7-9)
Biggest private high schools in Salt Lake City:
- ROWLAND HALL (Students: 995, Location: 720 GUARDSMAN WAY, Grades: PK-12)
- JUDGE MEMORIAL CATHOLIC HIGH SCHOOL (Students: 730, Location: 650 S 1100 E, Grades: 9-12)
- INTERMOUNTAIN CHRISTIAN SCHOOL (Students: 275, Location: 6515 LION LN, Grades: PK-12)
- REID SCHOOL (Students: 139, Location: 2965 E 3435 S, Grades: PK-9)
- COTTWOOD TREATMENT CENTER (Students: 73, Location: 1110 W 3300 S, Grades: 7-12)
- PRIMARY CHILDREN'S MEDICAL CENTER SCHOOL (Students: 71, Location: 5770 S 1500 W BLDG A, Grades: 3-12)
- LIFE CHRISTIAN ACADEMY (Students: 48, Location: 3818 W 4700 S, Grades: KG-11)
- CONCORDIA PREPARATORY SCHOOL (Students: 34, Location: 4020 S 900 E, Grades: 9-12)
- GATEWAY ACADEMY (Students: 32, Location: 2487 S 700 E, Grades: 8-12, Boys only)
- UNIVERSITY ACADEMY (Students: 30, Location: 501 CHIPETA WAY, Grades: 3-12)
Biggest public elementary/middle schools in Salt Lake City:
- GEARLD WRIGHT SCHOOL (Students: 804, Location: 6760 W 3100 S, Grades: KG-6)
- NORTHWEST MIDDLE (Students: 796, Location: 1730 W 1700 N, Grades: 7-8)
- GLENDALE MIDDLE (Students: 796, Location: 1430 W ANDREW AVE, Grades: 6-8)
- WHITTIER SCHOOL (Students: 784, Location: 1600 S 300 E, Grades: PK-6)
- WOODROW WILSON SCHOOL (Students: 722, Location: 2567 S MAIN STREET, Grades: PK-6)
- HILLSIDE MIDDLE (Students: 712, Location: 1825 S NEVADA, Grades: 7-8)
- NORTH STAR SCHOOL (Students: 689, Location: 1545 N MORTON DR, Grades: PK-6)
- HOWARD R DRIGGS SCHOOL (Students: 677, Location: 4340 S 2700 E, Grades: KG-6)
- PLYMOUTH SCHOOL (Students: 654, Location: 5220 S 1470 W, Grades: KG-6)
- WILLIAM PENN SCHOOL (Students: 645, Location: 1670 SIGGARD DR, Grades: KG-6)
Biggest private elementary/middle schools in Salt Lake City:
- J E COSGRIFF MEMORIAL CATHOLIC SCHOOL (Students: 386, Location: 2335 REDONDO AVE, Grades: PK-8)
- CARDEN MEMORIAL SCHOOL (Students: 366, Location: 1452 E 2700 S, Grades: PK-8)
- THE MCGILLIS SCHOOL (Students: 339, Location: 668 S 1300 E, Grades: KG-8)
- MADELEINE CHOIR SCHOOL (Students: 280, Location: 205 1ST AVE, Grades: PK-8)
- ST VINCENT SCHOOL (Students: 280, Location: 1385 SPRING LN, Grades: PK-8)
- KEARNS-SAINT ANN SCHOOL (Students: 260, Location: 430 E 2100 S, Grades: UG-8)
- OUR LADY OF LOURDES SCHOOL (Students: 207, Location: 1065 E 700 S, Grades: PK-8)
- MONTESSORI COMMUNITY SCHOOL OF SALT LAKE CITY (Students: 169, Location: 2416 E 1700 S, Grades: PK-7)
- CARMEN B PINGREE CENTER (Students: 150, Location: 780 GUARDSMAN WAY, Grades: PK-8)
- REDEEMER LUTHERAN SCHOOL (Students: 93, Location: 1955 E STRATFORD AVE, Grades: KG-8)
Libraries in Salt Lake City:
- SALT LAKE COUNTY LIBRARY SYSTEM (Operating income: $30,100,098; Location: 2197 EAST FORT UNION BLVD.; 1,610,766 books; 12,484 e-books; 198,967 audio materials; 204,175 video materials; 37 local licensed databases; 39 state licensed databases; 7,888 print serial subscriptions; 165 electronic serial subscriptions)
- SALT LAKE CITY PUBLIC LIBRARY (Operating income: $13,502,217; Location: 210 EAST 400 SOUTH; 745,215 books; 114,780 audio materials; 89,217 video materials; 31 local licensed databases; 32 state licensed databases; 2,127 print serial subscriptions)
User-submitted facts and corrections:
- Latter Day Saints Business College moved from 411 E. South Temple to 95 North 300 West.
- Ricks College in Idaho is now known as BYU Idaho.
Points of interest:
Notable locations in Salt Lake City: Utah State Office Park (A), Utah State Fairpark (B), The Delta Center (C), Olympic Square (D), ZCMI Center (E), Trolley Square (F), Triad Center (G), Hyland Plaza (H), Glendale Shopping Plaza (I), Rose Park Golf Course (J), Forest Dale Golf Course (K), Bonneville Municipal Golf Course (L), Pioneer Square Industrial Park (M), Ingensoll Industrial Park (N), Horizon West Industrial Park (O), Centenniel Industrial Park (P), Cambridge Industrial Park (Q), Berleley Industrial Park (R), Bara Industrial Park (S), Crossroad Plaza (T). Display/hide their locations on the map
Shopping Centers: The Gateway Shopping Center (1), Sugar House Commons Shopping Center (2), Sugar House Shopping Center (3), Seventh East Shopping Center (4), Rose Park Shopping Center (5), Plaza 700 Shopping Center (6), North Temple Shopping Center (7), Foothill Village Shopping Center (8), Brickyard Plaza Shopping Center (9). Display/hide their locations on the map
Main business address in Salt Lake City include: QUESTAR MARKET RESOURCES INC (A), QUESTAR GAS CO (B), EVANS & SUTHERLAND COMPUTER CORP (C), HMP Equity Holdings CORP (D), IOMED INC (E). Display/hide their locations on the map
Churches in Salt Lake City include: The Church of Jesus Christ of Latter Day Saints (A), Faith Fellowship Foursquare Gospel Church (B), Jehovahs Witnesses Central Congregation (C), The Church of Jesus Christ of Latter Day Saints (D), Metropolitan Community Church (E), New Song Church of Salt Lake (F), Newman Center (G), Presbytery of Utah (H), Saints Peter and Paul Orthodox Christian Church (I). Display/hide their locations on the map
Cemeteries: Mount Calvary Cemetery (1), Mount Olivet Cemetery (2), B'Nai Israel Cemetery (3), Shrine of Memorial Mausoleum (4), Salt Lake City Cemetery (5), Sharey Tzedick Cemetery (6), Montefiore Cemetery (7). Display/hide their locations on the map
Lakes and reservoirs: Baileys Lake (A), Pleasant Valley Reservoir (B), Baskin Reservoir (C), Mount Olivet Reservoir (D), Morris Reservoir (E). Display/hide their locations on the map
Creeks: Parleys Creek (A), Emigration Creek (B), Dry Creek (C), Red Butte Creek (D), City Creek (E). Display/hide their locations on the map
Parks in Salt Lake City include: Riverside Park (1), Jordan Park (2), Derks Field (3), Miller Park (4), Fairmount Park (5), Pony Express Monument (6), Pioneer Monument State Park (7), Laird Park (8), Sugar House Monument (9). Display/hide their locations on the map
Tourist attractions: Fort Douglas Military Museum (32 Potter Street) (1), Utah Museum of Arts & History (125 South Main Street) (2), Chase Home Museum UT Folk Arts (Middle Of Liberty Park) (3), University of Utah - Utah Museum of Fine Arts- Event Information- Mus (410 Campus Center Drive) (4), Children's Museum of Utah (840 Beck Street) (5), Utah Museum of Natural History (1390 E Presidents Circle) (6), Utah State Government - Army National Guard Headquarters- FT Douglas Mu (Museums; 32 Potter Street) (7), University Health Care - You May DL DRCT To TH OFFC DSRD S Alphbtcl LST (Cultural Attractions- Events- & Facilities; 50 North Medical Drive) (8), Hogle Zoo - Office (Cultural Attractions- Events- & Facilities; 2600 Sunnyside Avenue) (9). Display/hide their approximate locations on the map
Hotels: Country Inn-Stes West Valley (3422 So Decker Lake Drive) (1), Goldener Hirsch Inn & Restaurant (7570 Royal Street East) (2), Uncommon Accommodations (P.O. Box 520695) (3), Utah Blitzz (123 Wright Brothers Drive Suite 100) (4), Radisson Hotel Salt Lake City Airport (2177 West North Temple) (5), Crystal Inn Midvalley- A Rodeway Inn (818 East Winchester) (6), Ramada Limited-Salt Lake City (2455 South State Street) (7), Comfort Inn (2055 S Redwood Rd) (8), Hampton Inn Salt Lake City Central (2055 South Redwood Road) (9). Display/hide their approximate locations on the map
Courts: Utah State Government - Public Safety Department- Drivers License Divi (834 East 9400 South Suite 63) (1), State Of Utah - Workforce Service Dept- Unemployment Insurance & Benefits-Claim Ce (140 East Broadway) (2), Utah State Government - Workforce Services Department (2750 South 5600 West Suite A) (3), Utah State Government - Juvenile Court- Third District Juvenile Court Salt Lake City- Rec (450 South State Street) (4), Workforce Services (5735 South Redwood Road) (5), Judicial Conduct Commission (645 South 200 East) (6), United States Government - Social Security Administration- Office Of Hearings And App (125 South State Street) (7), Bankruptcy Court (350 South Main Street) (8), City Of Holladay - Justice Court (4707 Holladay) (9). Display/hide their approximate locations on the map
Birthplace of: Chris Cannon - Politician, George Von Elm - Professional golfer, Craig Venter - Biologist, Gordon B. Hinckley, Bill Haywood - Labor organizer, Bob Bennett (politician) - Politician, Grover Krantz - Biological anthropologist, Richard Harrison (actor) - Film actor, Joseph Standing - Mormon missionary, Derek Hough - Male singer.
Drinking water stations with addresses in Salt Lake City and their reported violations in the past:
TAYLORSVILLE-BENNION ID (Population served: 67,000, Purch surface water):Past monitoring violations:SOUTH SALT LAKE CITY WATER SYSTEM (Population served: 18,000, Purch surface water):
- 53 regular monitoring violations
Past monitoring violations:WHITE CITY WID (Population served: 15,800, Groundwater):
- 71 regular monitoring violations
Past health violations:HOLLIDAY WATER COMPANY (Population served: 15,000, Purch surface water):Past monitoring violations:
- MCL, Monthly (TCR) - In OCT-2011, Contaminant: Coliform. Follow-up actions: St Public Notif requested (DEC-05-2011), St Formal NOV issued (DEC-05-2011), St Public Notif received (DEC-08-2011)
- MCL, Monthly (TCR) - In AUG-2009, Contaminant: Coliform. Follow-up actions: St Public Notif requested (OCT-02-2009), St Formal NOV issued (OCT-02-2009), St Compliance achieved (JUL-01-2010)
- MCL, Monthly (TCR) - In NOV-2005, Contaminant: Coliform. Follow-up actions: St Public Notif requested (FEB-21-2006), St Violation/Reminder Notice (FEB-21-2006), St Compliance achieved (JAN-01-2008)
- Follow-up Or Routine LCR Tap M/R - In JAN-01-2003, Contaminant: Lead and Copper Rule. Follow-up actions: St Compliance achieved (AUG-05-2009)
- 112 regular monitoring violations
Past monitoring violations:SOUTH DAVIS WATER DISTRICT (Population served: 9,628, Purch surface water):
- 4 regular monitoring violations
Past health violations:HEXCEL INC (Population served: 900, Purch surface water):Past monitoring violations:
- MCL, Monthly (TCR) - In NOV-2009, Contaminant: Coliform. Follow-up actions: St Public Notif requested (JAN-07-2010), St Compliance achieved (JAN-07-2010), St Formal NOV issued (JAN-07-2010)
- Failure To Address Deficiency - In JAN-14-2010, Contaminant: GROUNDWATER RULE
Past health violations:EMIGRATION IMPROVEMENT DISTRICT (Population served: 600, Groundwater):Past monitoring violations:
- MCL, Monthly (TCR) - In AUG-2005, Contaminant: Coliform. Follow-up actions: St Violation/Reminder Notice (4 times from NOV-10-2005 to NOV-10-2005), St Compliance achieved (JAN-01-2008)
- Monitoring and Reporting (DBP) - Between JAN-2014 and MAR-2014, Contaminant: Chlorine. Follow-up actions: St Formal NOV issued (MAY-08-2014), St Public Notif requested (MAY-08-2014)
- Failure To Address Deficiency - In OCT-26-2013, Contaminant: GROUNDWATER RULE. Follow-up actions: St Public Notif requested (JAN-30-2014), St Formal NOV issued (JAN-30-2014), St Compliance achieved (MAR-12-2014)
- Failure To Address Deficiency - In OCT-26-2013, Contaminant: GROUNDWATER RULE. Follow-up actions: St Formal NOV issued (JAN-30-2014), St Public Notif requested (JAN-30-2014)
- Monitoring and Reporting (DBP) - Between OCT-2013 and DEC-2013, Contaminant: Chlorine. Follow-up actions: St Formal NOV issued (MAY-08-2014), St Public Notif requested (MAY-08-2014)
- Monitoring and Reporting (DBP) - Between JUL-2013 and SEP-2013, Contaminant: Chlorine. Follow-up actions: St Formal NOV issued (NOV-17-2013), St Public Notif requested (NOV-17-2013)
- 2 other older monitoring violations
Past monitoring violations:COTTONWOOD CLUB (Population served: 490, Purch surface water):
- Monitoring and Reporting (DBP) - Between OCT-2010 and DEC-2010, Contaminant: Total Haloacetic Acids (HAA5). Follow-up actions: St Formal NOV issued (FEB-10-2011), St Public Notif requested (FEB-10-2011)
- Monitoring and Reporting (DBP) - Between OCT-2010 and DEC-2010, Contaminant: TTHM. Follow-up actions: St Formal NOV issued (FEB-10-2011), St Public Notif requested (FEB-10-2011)
- Monitoring and Reporting (DBP) - Between OCT-2008 and DEC-2008, Contaminant: Chlorine. Follow-up actions: St Compliance achieved (FEB-10-2009)
- One routine major monitoring violation
- 97 regular monitoring violations
Past monitoring violations:
- One routine major monitoring violation
Drinking water stations with addresses in Salt Lake City that have no violations reported:
- CHURCH OF JESUS CHRIST OF LDS VIDOR (Serves TX, Population served: 681, Primary Water Source Type: Groundwater)
- OAKRIDGE WARD HOUSTON TEXAS NORTH STAKE (Serves TX, Population served: 504, Primary Water Source Type: Groundwater)
- CAUSEY ESTATES (Population served: 300, Primary Water Source Type: Groundwater)
- ENERGY SOLUTIONS (Population served: 220, Primary Water Source Type: Purch groundwater)
- RED CREEK RANCH INC (Serves MT, Population served: 102, Primary Water Source Type: Groundwater)
- LOG HAVEN RESTAURANT (Population served: 100, Primary Water Source Type: Groundwater)
- CAMP TUTTLE (EPISCOPAL) (Population served: 80, Primary Water Source Type: Groundwater)
- FIRS SUMMER CABINS (Population served: 50, Primary Water Source Type: Groundwater)
- MCMILLAN SPRINGS CAMPGROUND (Population served: 30, Primary Water Source Type: Groundwater)
- LONESOME BEAVER - DANDELION FLAT (Population served: 30, Primary Water Source Type: Groundwater)
| This city: | 2.4 people |
| Utah: | 3.1 people |
| This city: | 52.5% |
| Whole state: | 75.2% |
| This city: | 7.4% |
| Whole state: | 4.6% |
Likely homosexual households (counted as self-reported same-sex unmarried-partner households)
- Lesbian couples: 0.6% of all households
- Gay men: 0.8% of all households
People in group quarters in Salt Lake City in 2010:
- 2,112 people in college/university student housing
- 1,251 people in other noninstitutional facilities
- 539 people in nursing facilities/skilled-nursing facilities
- 389 people in residential treatment centers for adults
- 221 people in correctional residential facilities
- 177 people in group homes intended for adults
- 56 people in residential treatment centers for juveniles (non-correctional)
- 24 people in workers' group living quarters and job corps centers
- 20 people in emergency and transitional shelters (with sleeping facilities) for people experiencing homelessness
- 6 people in group homes for juveniles (non-correctional)
People in group quarters in Salt Lake City in 2000:
- 1,677 people in college dormitories (includes college quarters off campus)
- 1,040 people in other noninstitutional group quarters
- 735 people in nursing homes
- 376 people in homes or halfway houses for drug/alcohol abuse
- 170 people in halfway houses
- 162 people in other nonhousehold living situations
- 96 people in homes for the mentally ill
- 83 people in wards in general hospitals for patients who have no usual home elsewhere
- 62 people in orthopedic wards and institutions for the physically handicapped
- 61 people in hospitals or wards for drug/alcohol abuse
- 52 people in homes for the mentally retarded
- 22 people in religious group quarters
- 17 people in mental (psychiatric) hospitals or wards
- 11 people in other group homes
- 4 people in training schools for juvenile delinquents
- 2 people in hospitals/wards and hospices for chronically ill
- 2 people in other hospitals or wards for chronically ill
- 2 people in job corps and vocational training facilities
Banks with most branches in Salt Lake City (2011 data):
- Wells Fargo Bank, National Association: 27 branches. Info updated 2011/04/05: Bank assets: $1,161,490.0 mil, Deposits: $905,653.0 mil, headquarters in Sioux Falls, SD, positive income, 6395 total offices, Holding Company: Wells Fargo & Company
- Zions First National Bank: 24 branches. Info updated 2006/11/03: Bank assets: $17,531.3 mil, Deposits: $14,905.3 mil, local headquarters, positive income, Commercial Lending Specialization, 151 total offices, Holding Company: Zions Bancorporation
- U.S. Bank National Association: 17 branches. Info updated 2012/01/30: Bank assets: $330,470.8 mil, Deposits: $236,091.5 mil, headquarters in Cincinnati, OH, positive income, 3121 total offices, Holding Company: U.S. Bancorp
- JPMorgan Chase Bank, National Association: 16 branches. Info updated 2011/11/10: Bank assets: $1,811,678.0 mil, Deposits: $1,190,738.0 mil, headquarters in Columbus, OH, positive income, International Specialization, 5577 total offices, Holding Company: Jpmorgan Chase & Co.
- KeyBank National Association: 10 branches. Info updated 2008/03/03: Bank assets: $86,198.8 mil, Deposits: $64,214.8 mil, headquarters in Cleveland, OH, positive income, Commercial Lending Specialization, 1067 total offices, Holding Company: Keycorp
- Brighton Bank: North Temple Branch, City Center Branch, South Salt Lake Branch, Midtown Branch, at 7101 Highland Drive. Info updated 2006/11/03: Bank assets: $152.2 mil, Deposits: $123.5 mil, local headquarters, positive income, Commercial Lending Specialization, 5 total offices, Holding Company: Brighton Bancorp
- Washington Federal: 505 East 200 South Branch, 1442 Foothill Drive Branch, 2262 South Highland Drive Branch, 3983 South Wasatch Boulevard Branch, Cottonwood. Info updated 2011/12/19: Bank assets: $13,653.0 mil, Deposits: $8,905.8 mil, headquarters in Seattle, WA, positive income, Mortgage Lending Specialization, 174 total offices
- First Utah Bank: City Center Branch, Centennial Park Branch, at 3826 South 2300 East. Info updated 2006/11/03: Bank assets: $253.4 mil, Deposits: $215.2 mil, local headquarters, negative income in the last year, Commercial Lending Specialization, 8 total offices, Holding Company: First Utah Bancorporation
- Bank of the West: Cottonwood Heights Branch, Salt Lake City Branch, South Valley Branch. Info updated 2009/11/16: Bank assets: $62,408.3 mil, Deposits: $43,995.2 mil, headquarters in San Francisco, CA, positive income, 647 total offices, Holding Company: Bnp Paribas
- 28 other banks with 31 local branches
For population 15 years and over in Salt Lake City:
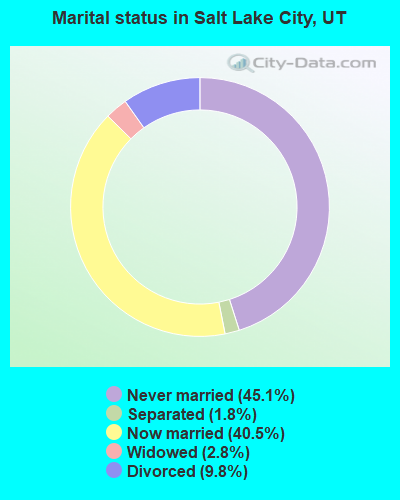
- Never married: 45.1%
- Now married: 40.5%
- Separated: 1.8%
- Widowed: 2.8%
- Divorced: 9.8%
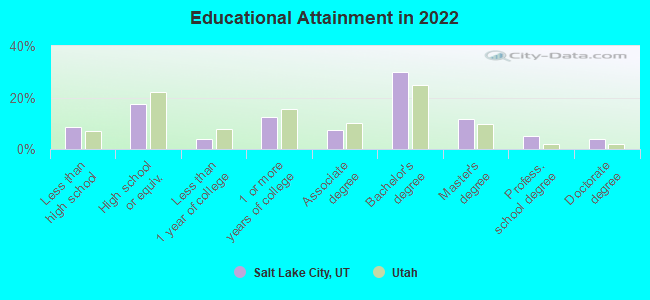
For population 25 years and over in Salt Lake City:
- High school or higher: 91.4%
- Bachelor's degree or higher: 50.3%
- Graduate or professional degree: 20.6%
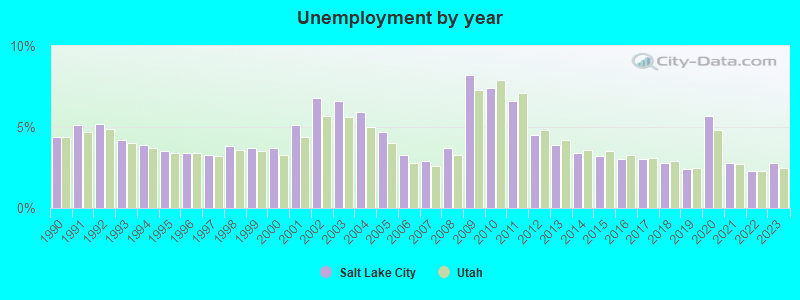
- Unemployed: 5.8%
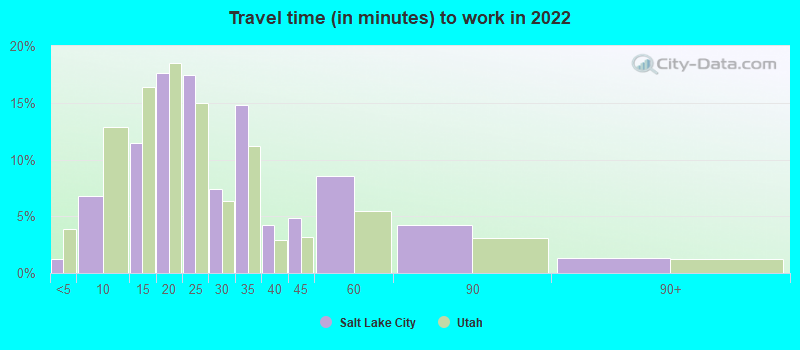
- Mean travel time to work (commute): 15.9 minutes
| Here: | 13.0 |
| Utah average: | 10.9 |
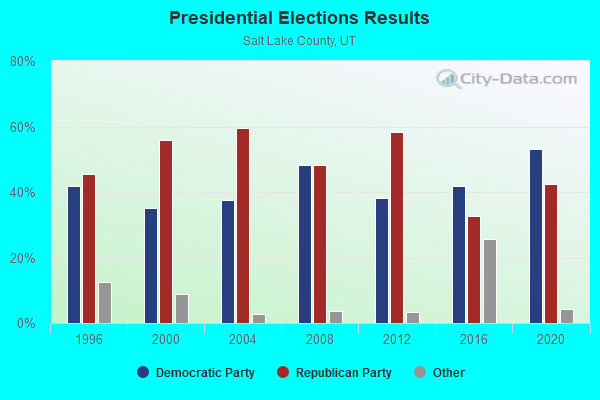
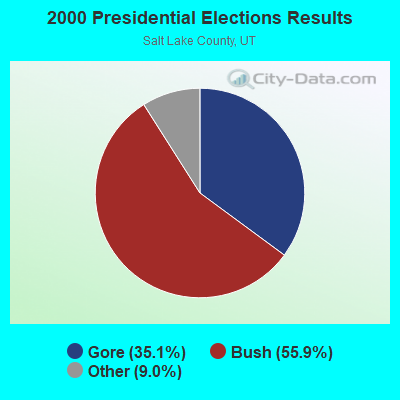
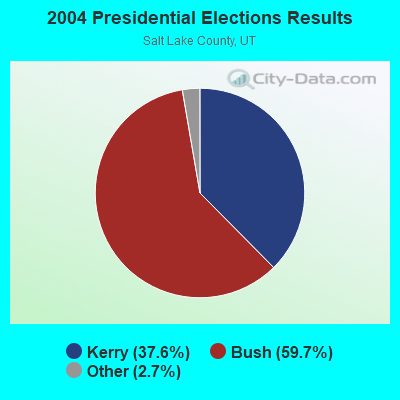
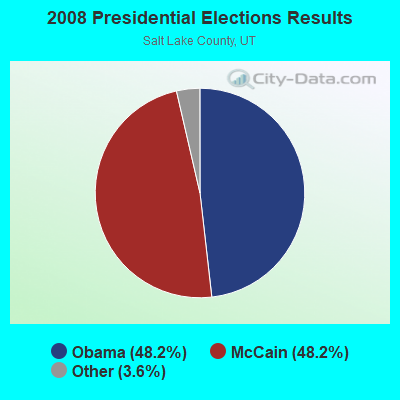

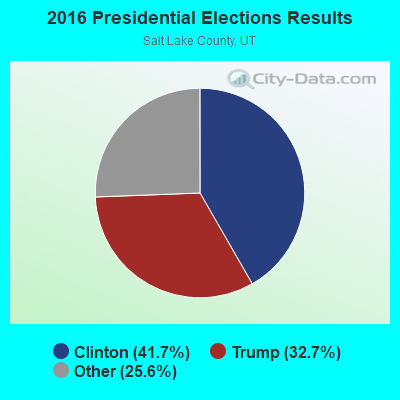
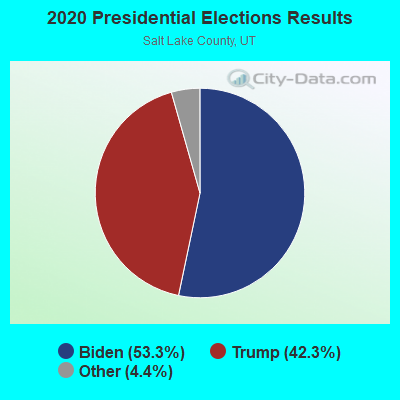
Graphs represent county-level data. Detailed 2008 Election Results
Political contributions by individuals in Salt Lake City, UT
Religion statistics for Salt Lake City, UT (based on Salt Lake County data)
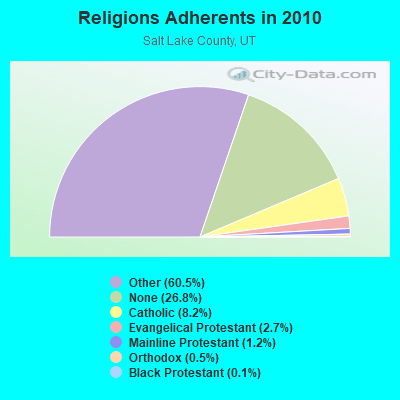
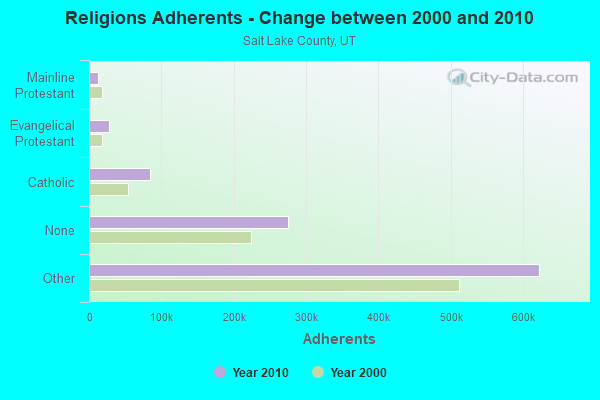
| Religion | Adherents | Congregations |
|---|---|---|
| Other | 622,807 | 1,452 |
| Catholic | 84,342 | 24 |
| Evangelical Protestant | 27,497 | 144 |
| Mainline Protestant | 12,789 | 38 |
| Orthodox | 5,352 | 7 |
| Black Protestant | 1,302 | 6 |
| None | 275,566 | - |
Food Environment Statistics:
| Here: | 1.45 / 10,000 pop. |
| Utah: | 1.37 / 10,000 pop. |
| Here: | 0.16 / 10,000 pop. |
| Utah: | 0.18 / 10,000 pop. |
| Salt Lake County: | 0.47 / 10,000 pop. |
| Utah: | 0.41 / 10,000 pop. |
| This county: | 2.45 / 10,000 pop. |
| State: | 2.82 / 10,000 pop. |
| Salt Lake County: | 5.55 / 10,000 pop. |
| Utah: | 5.09 / 10,000 pop. |
| Salt Lake County: | 6.5% |
| Utah: | 6.3% |
| Salt Lake County: | 22.7% |
| Utah: | 23.6% |
Health and Nutrition:
| Salt Lake City: | 48.9% |
| Utah: | 48.9% |
| Salt Lake City: | 47.5% |
| Utah: | 47.0% |
| This city: | 28.0 |
| Utah: | 28.4 |
| Salt Lake City: | 20.0% |
| Utah: | 21.0% |
| Here: | 10.3% |
| State: | 10.3% |
| Salt Lake City: | 6.8 |
| Utah: | 6.8 |
| Salt Lake City: | 30.1% |
| State: | 31.9% |
| Salt Lake City: | 57.7% |
| Utah: | 57.4% |
| This city: | 80.8% |
| Utah: | 80.1% |
More about Health and Nutrition of Salt Lake City, UT Residents
| Local government employment and payroll (March 2022) | |||||
| Function | Full-time employees | Monthly full-time payroll | Average yearly full-time wage | Part-time employees | Monthly part-time payroll |
|---|---|---|---|---|---|
| Airports | 579 | $3,469,739 | $71,912 | 1 | $1,036 |
| Police Protection - Officers | 416 | $2,314,221 | $66,756 | 6 | $9,090 |
| Firefighters | 296 | $2,121,206 | $85,995 | 0 | $0 |
| Police - Other | 258 | $1,504,731 | $69,987 | 11 | $12,223 |
| Sewerage | 225 | $1,123,245 | $59,906 | 0 | $0 |
| Other and Unallocable | 205 | $1,177,278 | $68,914 | 81 | $54,153 |
| Other Government Administration | 191 | $1,193,651 | $74,994 | 22 | $30,535 |
| Streets and Highways | 170 | $990,784 | $69,938 | 6 | $12,066 |
| Water Supply | 168 | $1,012,989 | $72,356 | 1 | $3,054 |
| Financial Administration | 164 | $1,070,711 | $78,345 | 12 | $20,859 |
| Local Libraries | 145 | $685,295 | $56,714 | 144 | $165,188 |
| Parks and Recreation | 137 | $699,252 | $61,248 | 152 | $162,952 |
| Judicial and Legal | 91 | $625,507 | $82,484 | 0 | $0 |
| Natural Resources | 77 | $386,867 | $60,291 | 8 | $20,188 |
| Fire - Other | 64 | $407,085 | $76,328 | 0 | $0 |
| Housing and Community Development (Local) | 5 | $28,992 | $69,581 | 0 | $0 |
| Solid Waste Management | 4 | $25,258 | $75,774 | 0 | $0 |
| Totals for Government | 3,195 | $18,836,812 | $70,749 | 444 | $491,341 |
Salt Lake City government finances - Expenditure in 2021 (per resident):
- Construction - Air Transportation: $592,879,000 ($2896.94)
General - Other: $25,087,000 ($122.58)
Water Utilities: $17,132,000 ($83.71)
Sewerage: $8,925,000 ($43.61)
Central Staff Services: $1,592,000 ($7.78)
Regular Highways: $575,000 ($2.81)
Parks and Recreation: $169,000 ($0.83)
Health - Other: $89,000 ($0.43)
Housing and Community Development: $32,000 ($0.16)
Police Protection: $7,000 ($0.03)
Transit Utilities: $4,000 ($0.02)
- Current Operations - Air Transportation: $123,312,000 ($602.53)
General - Other: $108,993,000 ($532.56)
Police Protection: $80,751,000 ($394.57)
Water Utilities: $64,754,000 ($316.40)
Health - Other: $57,537,000 ($281.14)
Local Fire Protection: $40,957,000 ($200.13)
Regular Highways: $31,518,000 ($154.00)
Sewerage: $25,265,000 ($123.45)
Libraries: $17,200,000 ($84.04)
Solid Waste Management: $14,878,000 ($72.70)
Housing and Community Development: $11,730,000 ($57.32)
Judicial and Legal Services: $11,720,000 ($57.27)
Central Staff Services: $9,983,000 ($48.78)
Parks and Recreation: $8,739,000 ($42.70)
Financial Administration: $7,873,000 ($38.47)
Natural Resources - Other: $6,304,000 ($30.80)
Electric Utilities: $5,210,000 ($25.46)
Elementary and Secondary Education: $4,217,000 ($20.61)
Miscellaneous Commercial Activities - Other: $1,743,000 ($8.52)
Transit Utilities: $1,208,000 ($5.90)
Public Welfare - Other: $102,000 ($0.50)
Gas Utilities: $10,000 ($0.05)
- General - Interest on Debt: $66,906,000 ($326.92)
- Intergovernmental to Local - Other - Health - Other: $246,000 ($1.20)
- Other Capital Outlay - Air Transportation: $57,073,000 ($278.87)
Sewerage: $54,335,000 ($265.49)
Water Utilities: $14,626,000 ($71.47)
General - Other: $6,284,000 ($30.71)
Regular Highways: $5,476,000 ($26.76)
Parks and Recreation: $4,839,000 ($23.64)
Central Staff Services: $1,286,000 ($6.28)
Housing and Community Development: $1,165,000 ($5.69)
Solid Waste Management: $633,000 ($3.09)
Transit Utilities: $350,000 ($1.71)
Local Fire Protection: $269,000 ($1.31)
Financial Administration: $212,000 ($1.04)
Health - Other: $208,000 ($1.02)
Police Protection: $202,000 ($0.99)
General Public Building: $143,000 ($0.70)
Natural Resources - Other: $66,000 ($0.32)
Judicial and Legal Services: $13,000 ($0.06)
Parking Facilities: $3,000 ($0.01)
- Total Salaries and Wages: $240,711,000 ($1176.17)
- Water Utilities - Interest on Debt: $2,687,000 ($13.13)
Salt Lake City government finances - Revenue in 2021 (per resident):
- Charges - Air Transportation: $197,347,000 ($964.28)
Other: $122,843,000 ($600.24)
Sewerage: $48,941,000 ($239.14)
Solid Waste Management: $11,517,000 ($56.27)
Parks and Recreation: $10,506,000 ($51.33)
Parking Facilities: $3,618,000 ($17.68)
Natural Resources - Other: $1,031,000 ($5.04)
Miscellaneous Commercial Activities: $776,000 ($3.79)
Housing and Community Development: $705,000 ($3.44)
- Federal Intergovernmental - Other: $43,792,000 ($213.98)
Housing and Community Development: $30,999,000 ($151.47)
Health and Hospitals: $20,699,000 ($101.14)
- Local Intergovernmental - Health and Hospitals: $30,572,000 ($149.38)
Housing and Community Development: $5,505,000 ($26.90)
Other: $1,901,000 ($9.29)
Highways: $1,367,000 ($6.68)
- Miscellaneous - General Revenue - Other: $62,165,000 ($303.75)
Rents: $2,129,000 ($10.40)
Fines and Forfeits: $1,940,000 ($9.48)
Royalties: $1,000,000 ($4.89)
Sale of Property: $528,000 ($2.58)
Donations From Private Sources: $306,000 ($1.50)
Interest Earnings: $128,000 ($0.63)
Special Assessments: $91,000 ($0.44)
- Revenue - Water Utilities: $79,858,000 ($390.20)
- State Intergovernmental - Health and Hospitals: $2,056,000 ($10.05)
Other: $638,000 ($3.12)
General Local Government Support: $203,000 ($0.99)
Housing and Community Development: $78,000 ($0.38)
- Tax - Property: $163,270,000 ($797.77)
General Sales and Gross Receipts: $98,835,000 ($482.93)
Other License: $30,315,000 ($148.13)
Public Utilities Sales: $28,595,000 ($139.72)
Occupation and Business License - Other: $3,368,000 ($16.46)
Other Selective Sales: $1,395,000 ($6.82)
Salt Lake City government finances - Debt in 2021 (per resident):
- Long Term Debt - Outstanding Unspecified Public Purpose: $2,660,846,000 ($13001.49)
Beginning Outstanding - Unspecified Public Purpose: $2,059,349,000 ($10062.44)
Issue, Unspecified Public Purpose: $644,659,000 ($3149.95)
Retired Unspecified Public Purpose: $43,163,000 ($210.90)
Salt Lake City government finances - Cash and Securities in 2021 (per resident):
- Bond Funds - Cash and Securities: $123,601,000 ($603.94)
- Other Funds - Cash and Securities: $645,993,000 ($3156.47)
- Sinking Funds - Cash and Securities: $121,000 ($0.59)
6.29% of this county's 2021 resident taxpayers lived in other counties in 2020 ($73,956 average adjusted gross income)
| Here: | 6.29% |
| Utah average: | 7.95% |
0.01% of residents moved from foreign countries ($111 average AGI)
Salt Lake County: 0.01% Utah average: 0.02%
Top counties from which taxpayers relocated into this county between 2020 and 2021:
| from Utah County, UT | |
| from Davis County, UT | |
| from Weber County, UT |
6.63% of this county's 2020 resident taxpayers moved to other counties in 2021 ($71,033 average adjusted gross income)
| Here: | 6.63% |
| Utah average: | 7.39% |
0.01% of residents moved to foreign countries ($100 average AGI)
Salt Lake County: 0.01% Utah average: 0.02%
Top counties to which taxpayers relocated from this county between 2020 and 2021:
| to Utah County, UT | |
| to Davis County, UT | |
| to Tooele County, UT |
| Businesses in Salt Lake City, UT | ||||
| Name | Count | Name | Count | |
|---|---|---|---|---|
| 24 Hour Fitness | 2 | JoS. A. Bank | 1 | |
| 7-Eleven | 37 | Jones New York | 5 | |
| ALDO | 1 | Journeys | 1 | |
| AMF Bowling | 1 | Justice | 1 | |
| AT&T | 13 | KFC | 3 | |
| Abercrombie & Fitch | 1 | Kincaid | 2 | |
| Abercrombie Kids | 1 | Kmart | 2 | |
| Ace Hardware | 2 | Kohl's | 1 | |
| Aeropostale | 1 | Kroger | 14 | |
| American Eagle Outfitters | 1 | La Quinta | 2 | |
| Ann Taylor | 3 | La-Z-Boy | 1 | |
| Apple Store | 1 | Lane Bryant | 1 | |
| Applebee's | 4 | Lane Furniture | 11 | |
| Arby's | 8 | LensCrafters | 1 | |
| Ashley Furniture | 1 | Little Caesars Pizza | 6 | |
| Audi | 1 | Lowe's | 1 | |
| AutoZone | 4 | Macy's | 1 | |
| Banana Republic | 1 | Marriott | 10 | |
| Barnes & Noble | 2 | MasterBrand Cabinets | 13 | |
| Baskin-Robbins | 2 | McDonald's | 17 | |
| Bath & Body Works | 2 | Men's Wearhouse | 1 | |
| Baymont Inn | 1 | Microtel | 1 | |
| Bebe | 1 | Motel 6 | 2 | |
| Bed Bath & Beyond | 1 | Motherhood Maternity | 2 | |
| Ben & Jerry's | 1 | New Balance | 5 | |
| Big O Tires | 6 | Nike | 15 | |
| Blockbuster | 6 | Nissan | 1 | |
| Brookstone | 3 | Nordstrom | 1 | |
| Budget Car Rental | 2 | Office Depot | 1 | |
| Burger King | 13 | OfficeMax | 2 | |
| Carl\s Jr. | 3 | Old Navy | 2 | |
| Chevrolet | 1 | Olive Garden | 2 | |
| Chick-Fil-A | 1 | Pac Sun | 1 | |
| Chico's | 3 | Panda Express | 3 | |
| Chipotle | 2 | Papa John's Pizza | 6 | |
| Cinnabon | 3 | Payless | 3 | |
| Coldwater Creek | 1 | Penske | 4 | |
| Comfort Inn | 2 | PetSmart | 2 | |
| Comfort Suites | 1 | Pier 1 Imports | 2 | |
| Costco | 1 | Pizza Hut | 7 | |
| Cricket Wireless | 14 | Pottery Barn | 1 | |
| Curves | 3 | Pottery Barn Kids | 1 | |
| DHL | 1 | Quality | 2 | |
| Dairy Queen | 1 | Quiznos | 4 | |
| Days Inn | 1 | RadioShack | 5 | |
| Decora Cabinetry | 3 | Ramada | 2 | |
| Dennys | 3 | Red Lobster | 1 | |
| Discount Tire | 1 | Red Robin | 1 | |
| Domino's Pizza | 12 | Rite Aid | 8 | |
| DressBarn | 1 | SONIC Drive-In | 2 | |
| Dressbarn | 1 | Sam's Club | 1 | |
| Econo Lodge | 1 | Sheraton | 1 | |
| Express | 1 | Shoe Carnival | 1 | |
| Famous Footwear | 2 | Skechers USA | 2 | |
| Fashion Bug | 1 | Sleep Inn | 1 | |
| FedEx | 101 | Sprint Nextel | 6 | |
| Firestone Complete Auto Care | 6 | Staples | 1 | |
| Foot Locker | 1 | Starbucks | 21 | |
| Ford | 1 | Subaru | 2 | |
| Forever 21 | 1 | Subway | 30 | |
| GNC | 6 | Super 8 | 1 | |
| GameStop | 3 | T-Mobile | 15 | |
| Gap | 1 | T.J.Maxx | 1 | |
| Gymboree | 1 | Taco Bell | 9 | |
| H&R Block | 11 | Target | 2 | |
| Haworth | 1 | Toyota | 1 | |
| Hilton | 7 | Toys"R"Us | 1 | |
| Holiday Inn | 5 | True Value | 2 | |
| Hollister Co. | 1 | U-Haul | 6 | |
| Home Depot | 3 | UPS | 122 | |
| Homestead Studio Suites | 2 | Vans | 5 | |
| Honda | 1 | Verizon Wireless | 3 | |
| Hot Topic | 1 | Victoria's Secret | 1 | |
| Howard Johnson | 1 | Village Inn | 2 | |
| Hyatt | 2 | Volkswagen | 1 | |
| IHOP | 1 | Walgreens | 3 | |
| InTown Suites | 1 | Walmart | 4 | |
| J. Jill | 1 | Wendy's | 12 | |
| J.Crew | 1 | Wet Seal | 1 | |
| JCPenney | 1 | Whole Foods Market | 2 | |
| Jamba Juice | 4 | YMCA | 1 | |
| Jimmy John's | 3 | Z Gallerie | 1 | |
Strongest AM radio stations in Salt Lake City:
- KIQN (1010 AM; 50 kW; TOOELE, UT)
- KBEE (860 AM; 10 kW; SALT LAKE CITY, UT; Owner: CITADEL BROADCASTING COMPANY)
- KALL (700 AM; 50 kW; NORTH SALT LAKE CITY, UT; Owner: CITICASTERS LICENSES, L.P.)
- KTKK (630 AM; 10 kW; SANDY, UT; Owner: UNITED BROADCASTING COMPANY)
- KBJA (1640 AM; 10 kW; SANDY, UT; Owner: UNITED BROADCASTING COMPANY, INC)
- KSOP (1370 AM; 5 kW; SOUTH SALT LAKE, UT; Owner: KSOP, INC.)
- KSL (1160 AM; 50 kW; SALT LAKE CITY, UT; Owner: BONNEVILLE HOLDING COMPANY)
- KNRS (570 AM; 5 kW; SALT LAKE CITY, UT; Owner: CITICASTERS LICENSES, L.P.)
- KZNS (1280 AM; 10 kW; SALT LAKE CITY, UT; Owner: SIMMONS-SLC, LS, LLC)
- KMRI (1550 AM; 10 kW; WEST VALLEY CITY, UT; Owner: KMRI RADIO, LLC)
- KFNZ (1320 AM; 5 kW; SALT LAKE CITY, UT; Owner: CITADEL BROADCASTING COMPANY)
- KLLB (1510 AM; daytime; 10 kW; WEST JORDAN, UT; Owner: UNITED SECURITY FINANCIAL, INC.)
- KSGO (1600 AM; 5 kW; CENTERVILLE, UT; Owner: UTAH SPANISH RADIO CORP)
Strongest FM radio stations in Salt Lake City:
- KCPX (105.7 FM; CENTERVILLE, UT; Owner: MERCURY BROADCASTING COMPANY, INC.)
- K252DI (98.3 FM; SALT LAKE CITY, UT; Owner: FIRST NATIONAL BROADCASTING CORPORATION)
- K276DP (103.1 FM; MILLCREEK, UT; Owner: FIRST NATIONAL B/CING CORPORATION)
- K213CQ (90.5 FM; SALT LAKE CITY, UT; Owner: CALVARY CHAPEL OF TWIN FALLS, INC.)
- KSOP-FM (104.3 FM; SALT LAKE CITY, UT; Owner: KSOP, INC.)
- K272DP (102.3 FM; TOOELE, UT; Owner: FAMILY STATIONS, INC.)
- KBZN (97.9 FM; OGDEN, UT; Owner: CAPITOL BROADCASTING, INC.)
- KRCL (90.9 FM; SALT LAKE CITY, UT; Owner: LISTENERS COMMUNITY RADIO OF UTAH)
- KBER (101.1 FM; OGDEN, UT; Owner: CITADEL BROADCASTING COMPANY)
- KISN-FM (97.1 FM; SALT LAKE CITY, UT; Owner: CLEAR CHANNEL BROADCASTING LICENSES, INC.)
- KKAT (101.9 FM; OGDEN, UT; Owner: CITICASTERS LICENSES, L.P.)
- KSFI (100.3 FM; SALT LAKE CITY, UT; Owner: SIMMONS-SLC, LS, LLC)
- KUBL-FM (93.3 FM; SALT LAKE CITY, UT; Owner: CITADEL BROADCASTING COMPANY)
- KOSY-FM (106.5 FM; SPANISH FORK, UT; Owner: MERCURY BROADCASTING COMPANY, INC.)
- KRSP-FM (103.5 FM; SALT LAKE CITY, UT; Owner: SIMMONS-SLC, LS, LLC)
- KODJ (94.1 FM; SALT LAKE CITY, UT; Owner: CITICASTERS LICENSES, L.P.)
- KUER-FM (90.1 FM; SALT LAKE CITY, UT; Owner: UNIVERSITY OF UTAH)
- KBYU-FM (89.1 FM; PROVO, UT; Owner: BRIGHAM YOUNG UNIVERSITY)
- KURR (99.5 FM; BOUNTIFUL, UT; Owner: CITICASTERS LICENSES, L.P.)
- KBEE-FM (98.7 FM; SALT LAKE CITY, UT; Owner: CITADEL BROADCASTING COMPANY)
TV broadcast stations around Salt Lake City:
- K59GS (Channel 59; SALT LAKE CITY, UT; Owner: ALPHA & OMEGA COMMUNICATIONS, LLC)
- KUTV (Channel 2; SALT LAKE CITY, UT; Owner: KUTV HOLDINGS, INC.)
- K66FN (Channel 66; SALT LAKE CITY, UT; Owner: AZTECA BROADCASTING CORPORATION)
- KEJT-LP (Channel 48; SALT LAKE CITY, UT; Owner: TELEMUNDO OF NORTHERN CALIFORNIA LICENSE CORP.)
- KUCL-LP (Channel 26; SALT LAKE CITY, UT; Owner: CHRISTIAN LIFE BROADCASTING)
- KULC (Channel 9; OGDEN, UT; Owner: UTAH STATE BOARD OF REGENTS)
- KUED (Channel 7; SALT LAKE CITY, UT; Owner: UNIVERSITY OF UTAH)
- KSL-TV (Channel 5; SALT LAKE CITY, UT; Owner: BONNEVILLE HOLDING COMPANY)
- KUWB (Channel 30; OGDEN, UT; Owner: ACME TV LICENSES OF UTAH, LLC)
- KBYU-TV (Channel 11; PROVO, UT; Owner: BRIGHAM YOUNG UNIVERSITY)
- KJZZ-TV (Channel 14; SALT LAKE CITY, UT; Owner: LARRY H. MILLER COMMUNICATIONS CORP.)
- KSTU (Channel 13; SALT LAKE CITY, UT; Owner: FOX TELEVISION STATIONS INC.)
- KTVX (Channel 4; SALT LAKE CITY, UT; Owner: CLEAR CHANNEL BROADCASTING LICENSES, INC.)
- KTMW (Channel 20; SALT LAKE CITY, UT; Owner: ALPHA & OMEGA COMMUNICATIONS, LLC)
- KUBX-LP (Channel 58; SALT LAKE CITY, UT; Owner: EQUITY BROADCASTING CORPORATION)
Medal of Honor Recipients
Medal of Honor Recipient born in Salt Lake City: Gerry H. Kisters.
- National Bridge Inventory (NBI) Statistics
- 320Number of bridges
- 5,259ft / 1,603mTotal length
- $3,818,000Total costs
- 13,297,491Total average daily traffic
- 1,807,931Total average daily truck traffic
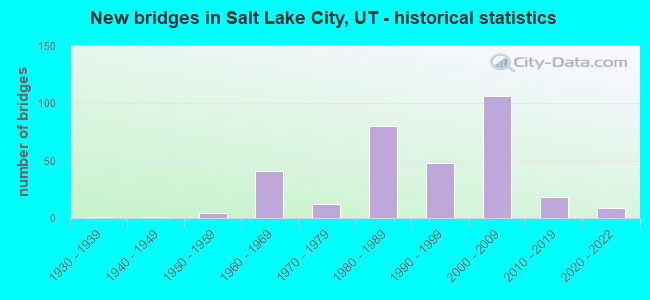
- New bridges - historical statistics
- 11930-1939
- 11940-1949
- 41950-1959
- 411960-1969
- 121970-1979
- 801980-1989
- 481990-1999
- 1062000-2009
- 182010-2019
- 92020-2022
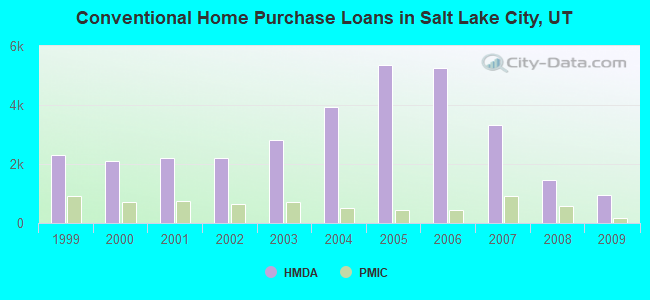
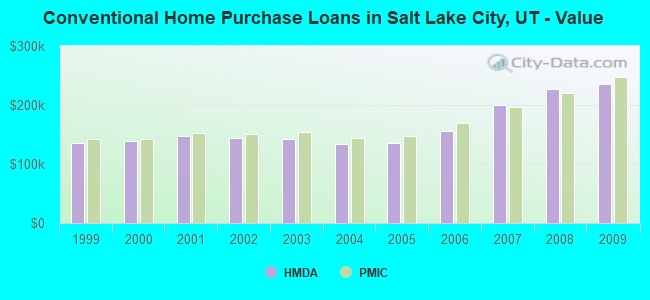
| Home Mortgage Disclosure Act Aggregated Statistics For Year 2009 (Based on 51 full and 4 partial tracts) | ||||||||||||||
| A) FHA, FSA/RHS & VA Home Purchase Loans | B) Conventional Home Purchase Loans | C) Refinancings | D) Home Improvement Loans | E) Loans on Dwellings For 5+ Families | F) Non-occupant Loans on < 5 Family Dwellings (A B C & D) | G) Loans On Manufactured Home Dwelling (A B C & D) | ||||||||
|---|---|---|---|---|---|---|---|---|---|---|---|---|---|---|
| Number | Average Value | Number | Average Value | Number | Average Value | Number | Average Value | Number | Average Value | Number | Average Value | Number | Average Value | |
| LOANS ORIGINATED | 926 | $197,993 | 936 | $236,160 | 4,946 | $213,461 | 140 | $145,964 | 21 | $1,605,772 | 461 | $174,112 | 4 | $108,512 |
| APPLICATIONS APPROVED, NOT ACCEPTED | 92 | $228,743 | 88 | $276,920 | 514 | $213,579 | 25 | $74,637 | 0 | $0 | 39 | $215,023 | 3 | $30,763 |
| APPLICATIONS DENIED | 167 | $179,827 | 189 | $223,119 | 1,429 | $211,648 | 110 | $88,227 | 10 | $692,634 | 235 | $175,580 | 11 | $47,421 |
| APPLICATIONS WITHDRAWN | 121 | $191,632 | 121 | $251,017 | 898 | $203,390 | 66 | $122,474 | 3 | $6,312,623 | 94 | $167,375 | 2 | $147,195 |
| FILES CLOSED FOR INCOMPLETENESS | 13 | $204,765 | 34 | $213,950 | 206 | $224,202 | 20 | $78,634 | 0 | $0 | 27 | $171,288 | 1 | $34,390 |
Detailed mortgage data for all 55 tracts in Salt Lake City, UT
| Private Mortgage Insurance Companies Aggregated Statistics For Year 2009 (Based on 46 full and 4 partial tracts) | ||||||
| A) Conventional Home Purchase Loans | B) Refinancings | C) Non-occupant Loans on < 5 Family Dwellings (A & B) | ||||
|---|---|---|---|---|---|---|
| Number | Average Value | Number | Average Value | Number | Average Value | |
| LOANS ORIGINATED | 159 | $246,689 | 122 | $225,974 | 2 | $241,000 |
| APPLICATIONS APPROVED, NOT ACCEPTED | 64 | $270,118 | 68 | $238,687 | 6 | $216,962 |
| APPLICATIONS DENIED | 28 | $210,315 | 35 | $248,979 | 1 | $277,000 |
| APPLICATIONS WITHDRAWN | 11 | $212,727 | 15 | $236,606 | 0 | $0 |
| FILES CLOSED FOR INCOMPLETENESS | 9 | $211,397 | 4 | $200,358 | 2 | $210,000 |
2002 - 2018 National Fire Incident Reporting System (NFIRS) incidents
- Fire incident types reported to NFIRS in Salt Lake City, UT
- 4,25140.3%Outside Fires
- 3,84036.4%Structure Fires
- 2,06419.6%Mobile Property/Vehicle Fires
- 3993.8%Other
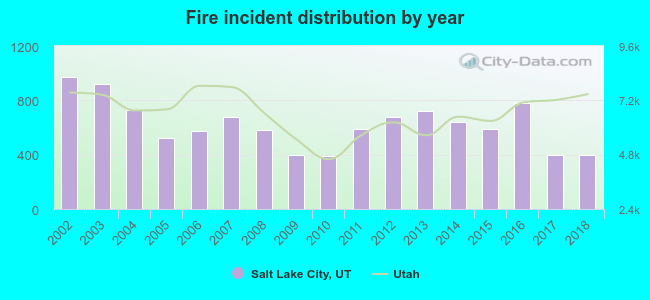 Based on the data from the years 2002 - 2018 the average number of fire incidents per year is 621. The highest number of fires - 975 took place in 2002, and the least - 390 in 2010. The data has a dropping trend.
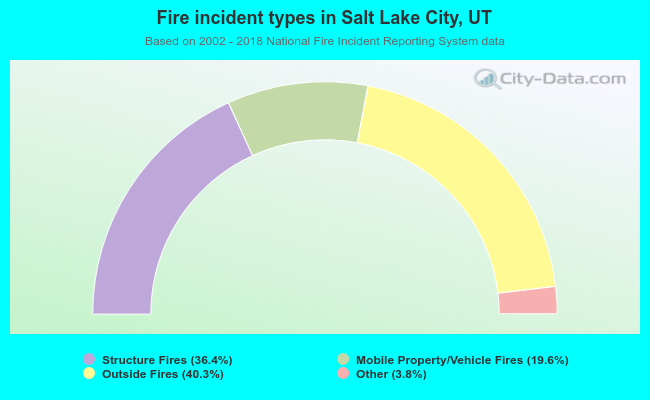 When looking into fire subcategories, the most reports belonged to: Outside Fires (40.3%), and Structure Fires (36.4%).
Fire-safe hotels and motels in Salt Lake City, Utah:
- Sheraton City Centre Hotel Salt Lake City, 150 W 500 S, Salt Lake City, Utah 84101 , Phone: (801) 401-2000, Fax: (801) 531-0705
- DoubleTree Suites by Hilton Salt Lake City Downtown, 110 W 600 S, Salt Lake City, Utah 84101 , Phone: (801) 359-7800, Fax: (801) 359-3753
- Radisson Hotel Salt Lake City Downtown, 215 W S Temple, Salt Lake City, Utah 84101 , Phone: (801) 531-7500, Fax: (801) 328-1289
- Ramada Salt Lake City Airport, 5575 W Amelia Earhart Dr, Salt Lake City, Utah 84115 , Phone: (801) 537-7020, Fax: (801) 537-7021
- Radisson Salt Lake City Airport, 2177 W N Temple St, Salt Lake City, Utah 84116 , Phone: (801) 364-5800, Fax: (801) 364-5823
- Days Inn Airport, 1900 W North Temple, Salt Lake City, Utah 84116 , Phone: (801) 539-8538, Fax: (801) 539-8538
- Best Western Executive Inn, 280 W 7200 S, Salt Lake City, Utah 84088 , Phone: (801) 566-4141, Fax: (801) 566-5142
- Days Inn, 1659 W N Temple, Salt Lake City, Utah 84116 , Phone: (801) 533-9000, Fax: (801) 355-3047
- 67 other hotels and motels
| Most common first names in Salt Lake City, UT among deceased individuals | ||
| Name | Count | Lived (average) |
|---|---|---|
| John | 2,082 | 75.2 years |
| William | 1,871 | 75.1 years |
| Mary | 1,672 | 80.3 years |
| James | 1,421 | 72.4 years |
| Robert | 1,416 | 70.9 years |
| George | 1,264 | 77.2 years |
| Ruth | 935 | 80.0 years |
| Joseph | 926 | 75.7 years |
| Helen | 918 | 80.0 years |
| Charles | 842 | 75.0 years |
| Most common last names in Salt Lake City, UT among deceased individuals | ||
| Last name | Count | Lived (average) |
|---|---|---|
| Smith | 1,184 | 76.1 years |
| Johnson | 985 | 75.6 years |
| Anderson | 879 | 77.2 years |
| Jensen | 618 | 77.7 years |
| Hansen | 561 | 77.0 years |
| Jones | 560 | 76.1 years |
| Brown | 553 | 76.2 years |
| Peterson | 525 | 77.2 years |
| Christensen | 516 | 76.9 years |
| Williams | 458 | 75.2 years |
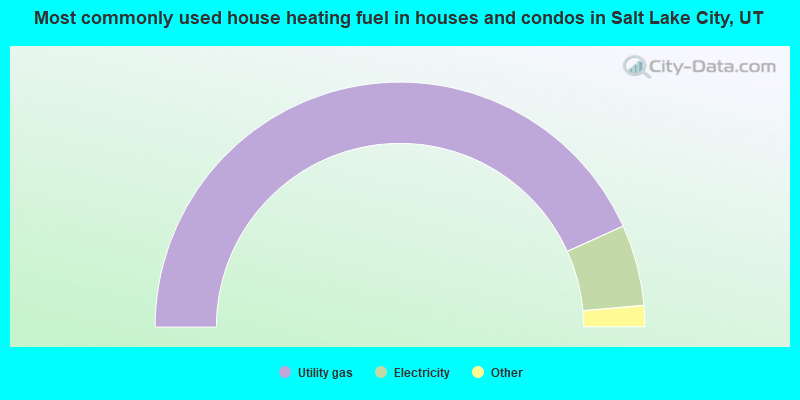
- 86.6%Utility gas
- 10.7%Electricity
- 1.7%Bottled, tank, or LP gas
- 0.4%Solar energy
- 0.3%Other fuel
- 0.2%Wood
- 0.1%No fuel used
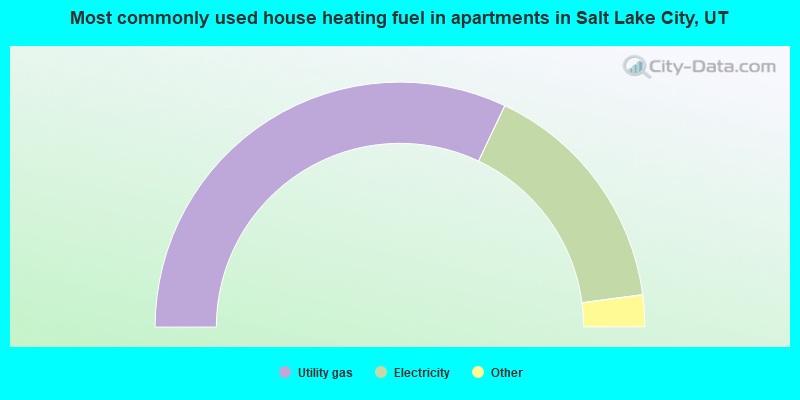
- 64.1%Utility gas
- 31.7%Electricity
- 2.2%Bottled, tank, or LP gas
- 1.1%Other fuel
- 0.6%No fuel used
- 0.3%Solar energy
Salt Lake City compared to Utah state average:
- Unemployed percentage below state average.
- Black race population percentage above state average.
- Foreign-born population percentage above state average.
- Renting percentage above state average.
- Number of rooms per house below state average.
- House age above state average.
- Percentage of population with a bachelor's degree or higher above state average.
Salt Lake City, UT compared to other similar cities:
Salt Lake City on our top lists:
- #7 on the list of "Top 101 cities with the highest number of thefts per 100,000 residents, excludes tourist destinations and others with a lot of outsiders visiting based on city industries data (population 50,000+)"
- #10 on the list of "Top 101 cities that people commute into (largest positive percentage daily daytime population change due to commuting) (population 50,000+)"
- #17 on the list of "Top 101 cities with largest percentage of males in occupations: arts, design, entertainment, sports, and media occupations (population 50,000+)"
- #21 on the list of "Top 101 cities with the largest percentage of likely gay men couples (counted as self-reported male-male unmarried-partner households) (population 50,000+)"
- #27 on the list of "Top 100 cities with the largest percentage of males (pop. 50,000+)"
- #30 on the list of "Top 101 cities with the largest percentage of likely homosexual households (counted as self-reported same-sex unmarried-partner households) (population 50,000+)"
- #33 on the list of "Top 101 cities with the highest number of auto thefts per 100,000 residents, excludes tourist destinations and others with a lot of outsiders visiting based on city industries data (population 50,000+)"
- #39 on the list of "Top 101 cities with largest percentage of males in occupations: education, training, and library occupations (population 50,000+)"
- #40 on the list of "Top 100 least-safe cities (highest city-data.com crime index) (pop. 50,000+)"
- #41 on the list of "Top 101 cities with the most people having Doctorate degrees (population 50,000+)"
- #44 on the list of "Top 101 cities with largest percentage of females in occupations: life, physical, and social science occupations (population 50,000+)"
- #45 on the list of "Top 101 cities with the lowest percentage of family households, population 100,000+"
- #48 on the list of "Top 100 highest located cities (pop. 50,000+)"
- #52 on the list of "Top 101 cities with largest percentage of females in occupations: arts, design, entertainment, sports, and media occupations (population 50,000+)"
- #54 on the list of "Top 101 cities with the lowest minimum monthly morning or afternoon humidity (population 50,000+)"
- #54 on the list of "Top 101 cities with largest percentage of males in industries: educational services (population 50,000+)"
- #60 on the list of "Top 101 cities with the highest number of rapes per 100,000 residents, excludes tourist destinations and others with a lot of outsiders visiting based on city industries data (population 50,000+)"
- #65 on the list of "Top 101 cities with largest percentage of males in occupations: life, physical, and social science occupations (population 50,000+)"
- #66 on the list of "Top 101 cities with the largest percentage of likely lesbian couples (counted as self-reported female-female unmarried-partner households) (population 50,000+)"
- #67 on the list of "Top 101 cities with the lowest average wind speeds (population 50,000+)"
- #2 (84112) on the list of "Top 101 zip codes with the lowest 2012 average Adjusted Gross Income (AGI) for individuals (pop 1,000+)"
- #2 (84112) on the list of "Top 101 zip codes with the lowest average reported salary/wage in 2012 (pop 1,000+)"
- #11 (84112) on the list of "Top 101 zip codes with the lowest 2012 average taxable interest for individuals (pop 1,000+)"
- #40 (84112) on the list of "Top 101 zip codes with the smallest percentage of taxpayers using paid preparers for 2012 taxes (pop 1,000+)"
- #56 (84116) on the list of "Top 101 zip codes with the largest percentage of Danish first ancestries (pop 5,000+)"
- #78 (84111) on the list of "Top 101 zip codes with the most offices of lawyers in 2005"
- #82 (84128) on the list of "Top 101 zip codes with the largest percentage of returns reporting salary or wage in 2012 (pop 5,000+)"
- #91 (84111) on the list of "Top 101 zip codes with the largest percentage of Welsh first ancestries (pop 5,000+)"
- #1 on the list of "Top 101 counties with the most Other adherents"
- #1 on the list of "Top 101 counties with the most Other congregations"
- #4 on the list of "Top 101 counties with the lowest percentage of residents that smoked 100+ cigarettes in their lives"
- #11 on the list of "Top 101 counties with the highest Nitrogen Dioxide air pollution readings in 2012 (ppm)"
- #14 on the list of "Top 101 counties with the highest number of births per 1000 residents 2007-2013"
State forum archive:

|
|
Total of 5658 patent applications in 2008-2024.


