Estimated zip code population in 2022: 13,262 Zip code population in 2010: 10,744 Zip code population in 2000: 10,667
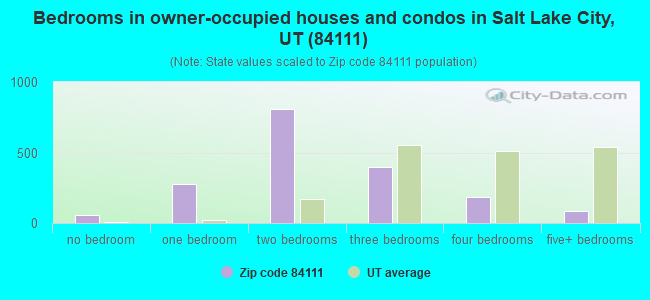
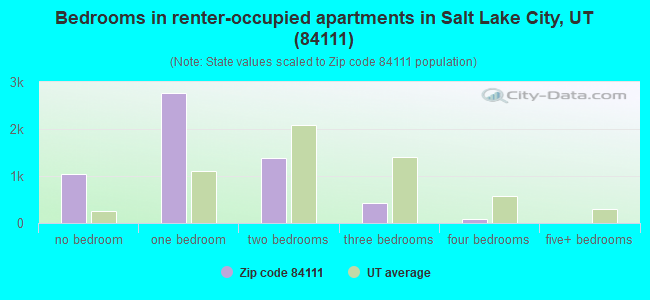
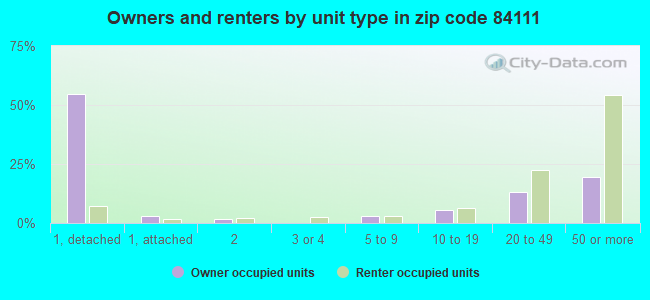
Houses and condos: 8,796 Renter-occupied apartments: 5,727
% of renters here:
76%
State:
29%
March 2022 cost of living index in zip code 84111: 95.6 (near average, U.S. average is 100)
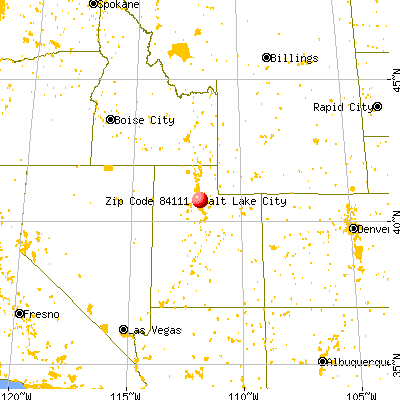
Land area: 1.4 sq. mi. Water area: 0.0 sq. mi.
Population density: 9,249 people per square mile
(high).
OSM Map
General Map
Google Map
MSN Map
OSM Map
General Map
Google Map
MSN Map
OSM Map
General Map
Google Map
MSN Map
OSM Map
General Map
Google Map
MSN Map
Please wait while loading the map...
Real estate property taxes paid for housing units in 2022:
This zip code:
0.5% ($2,334)
Utah:
0.5% ($2,376)
Median real estate property taxes paid for housing units with mortgages in 2022: $2,301 (0.5%) Median real estate property taxes paid for housing units with no mortgage in 2022: $2,404 (0.5%)
Averages for the 2020 tax year for zip code 84111, filed in 2021:
Average Adjusted Gross Income (AGI) in 2020: $70,441 (Individual Income Tax Returns)
Here:
$70,441
State:
$81,660
Salary/wage: $50,520 (reported on 88.5% of returns)
Here:
$50,520
State:
$63,027
(% of AGI for various income ranges: 1222.6% for AGIs below $25k, 4019.0% for AGIs $25k-50k, 7825.1% for AGIs $50k-75k, 11349.7% for AGIs $75k-100k, 19997.8% for AGIs $100k-200k, 65881.4% for AGIs over 200k)
Taxable interest for individuals: $4,705 (reported on 23.0% of returns)
This zip code:
$4,705
Utah:
$2,255
(% of AGI for various income ranges: 6.9% for AGIs below $25k, 7.9% for AGIs $25k-50k, 33.2% for AGIs $50k-75k, 26.1% for AGIs $75k-100k, 86.6% for AGIs $100k-200k, 8144.3% for AGIs over 200k)
Ordinary dividends: $16,347 (reported on 17.2% of returns)
Here:
$16,347
State:
$7,362
(% of AGI for various income ranges: 19.9% for AGIs below $25k, 35.2% for AGIs $25k-50k, 87.7% for AGIs $50k-75k, 125.5% for AGIs $75k-100k, 394.4% for AGIs $100k-200k, 19754.3% for AGIs over 200k)
Net capital gain/loss in AGI: +$56,601 (reported on 17.2% of returns)
Here:
+$56,601
State:
+$43,433
(% of AGI for various income ranges: 12.0% for AGIs below $25k, 38.9% for AGIs $25k-50k, 89.5% for AGIs $50k-75k, 233.2% for AGIs $75k-100k, 750.0% for AGIs $100k-200k, 76991.4% for AGIs over 200k)
Profit/loss from business: +$11,524 (reported on 14.3% of returns)
Here:
+$11,524
State:
+$9,957
(% of AGI for various income ranges: 89.2% for AGIs below $25k, 118.2% for AGIs $25k-50k, 284.6% for AGIs $50k-75k, 247.4% for AGIs $75k-100k, 587.5% for AGIs $100k-200k, 3418.6% for AGIs over 200k)
Taxable individual retirement arrangement distribution: $26,290 (reported on 3.5% of returns)
84111:
$26,290
Utah:
$21,167
(% of AGI for various income ranges: 13.9% for AGIs below $25k, 40.4% for AGIs $25k-50k, 97.8% for AGIs $50k-75k, 170.3% for AGIs $75k-100k, 349.7% for AGIs $100k-200k, 3551.4% for AGIs over 200k)
Total itemized deductions: $48,124 (reported on 8.3% of returns)
Here:
$48,124
State:
$41,056
(% of AGI for various income ranges: 39.3% for AGIs below $25k, 83.1% for AGIs $25k-50k, 300.5% for AGIs $50k-75k, 543.5% for AGIs $75k-100k, 1336.9% for AGIs $100k-200k, 20597.1% for AGIs over 200k)
Charity contributions: $28,515 (reported on 5.7% of returns)
Here:
$28,515
State:
$22,261
(% of AGI for various income ranges: 14.9% for AGIs $25k-50k, 58.6% for AGIs $50k-75k, 56.1% for AGIs $75k-100k, 293.8% for AGIs $100k-200k, 11441.4% for AGIs over 200k)
Taxes paid: $7,384 (reported on 8.2% of returns)
84111:
$7,384
State:
$7,985
(% of AGI for various income ranges: 17.4% for AGIs $25k-50k, 59.4% for AGIs $50k-75k, 177.1% for AGIs $75k-100k, 409.1% for AGIs $100k-200k, 1644.3% for AGIs over 200k)
Earned income credit: $1,472 (reported on 13.5% of returns)
Here:
$1,472
State:
$2,169
(% of AGI for various income ranges: 49.7% for AGIs below $25k, 27.5% for AGIs $25k-50k)
Percentage of individuals using paid preparers for their 2020 taxes: 93.7%
Here:
94%
State:
94%
(% for various income ranges: 92.1% for AGIs below $25k, 94.5% for AGIs $25k-50k, 95.8% for AGIs $50k-75k, 93.6% for AGIs $75k-100k, 93.0% for AGIs $100k-200k, 95.5% for AGIs over 200k)
Averages for the 2012 tax year for zip code 84111, filed in 2013:
Average Adjusted Gross Income (AGI) in 2012: $49,265 (Individual Income Tax Returns)
Here:
$49,265
State:
$60,327
Salary/wage: $34,546 (reported on 90.1% of returns)
Here:
$34,546
State:
$48,762
(% of AGI for various income ranges: 87.0% for AGIs below $25k, 90.8% for AGIs $25k-50k, 88.9% for AGIs $50k-75k, 83.5% for AGIs $75k-100k, 75.7% for AGIs $100k-200k, 14.9% for AGIs over 200k)
Taxable interest for individuals: $3,703 (reported on 22.8% of returns)
This zip code:
$3,703
Utah:
$1,534
(% of AGI for various income ranges: 0.5% for AGIs below $25k, 0.4% for AGIs $25k-50k, 0.6% for AGIs $50k-75k, 0.6% for AGIs $75k-100k, 1.2% for AGIs $100k-200k, 4.0% for AGIs over 200k)
Ordinary dividends: $12,218 (reported on 11.5% of returns)
Here:
$12,218
State:
$5,711
(% of AGI for various income ranges: 0.8% for AGIs below $25k, 0.8% for AGIs $25k-50k, 0.8% for AGIs $50k-75k, 0.9% for AGIs $75k-100k, 1.4% for AGIs $100k-200k, 6.9% for AGIs over 200k)
Net capital gain/loss in AGI: +$32,298 (reported on 10.1% of returns)
Here:
+$32,298
State:
+$23,734
(% of AGI for various income ranges: 0.3% for AGIs $25k-50k, 0.5% for AGIs $50k-75k, 0.3% for AGIs $75k-100k, 3.8% for AGIs $100k-200k, 18.7% for AGIs over 200k)
Profit/loss from business: +$8,983 (reported on 12.7% of returns)
Here:
+$8,983
State:
+$8,845
(% of AGI for various income ranges: 5.3% for AGIs below $25k, 2.3% for AGIs $25k-50k, 1.9% for AGIs $50k-75k, 1.2% for AGIs $75k-100k, 6.8% for AGIs $100k-200k)
Taxable individual retirement arrangement distribution: $14,058 (reported on 3.8% of returns)
84111:
$14,058
Utah:
$15,565
(% of AGI for various income ranges: 0.9% for AGIs below $25k, 0.8% for AGIs $25k-50k, 1.1% for AGIs $50k-75k, 1.7% for AGIs $75k-100k, 4.3% for AGIs $100k-200k)
Total itemized deductions: $27,684 (22% of AGI, reported on 22.6% of returns)
Here:
$27,684
State:
$25,197
Here:
22.4% of AGI
State:
22.4% of AGI
(% of AGI for various income ranges: 6.4% for AGIs below $25k, 7.9% for AGIs $25k-50k, 12.3% for AGIs $50k-75k, 15.0% for AGIs $75k-100k, 15.9% for AGIs $100k-200k, 16.8% for AGIs over 200k)
Charity contributions: $5,716 (reported on 16.6% of returns)
Here:
$5,716
State:
$8,502
(% of AGI for various income ranges: 0.5% for AGIs below $25k, 0.9% for AGIs $25k-50k, 1.6% for AGIs $50k-75k, 2.5% for AGIs $75k-100k, 3.6% for AGIs $100k-200k, 2.5% for AGIs over 200k)
Taxes paid: $9,444 (reported on 22.6% of returns)
84111:
$9,444
State:
$7,001
(% of AGI for various income ranges: 0.8% for AGIs below $25k, 1.8% for AGIs $25k-50k, 3.3% for AGIs $50k-75k, 4.9% for AGIs $75k-100k, 5.9% for AGIs $100k-200k, 7.2% for AGIs over 200k)
Earned income credit: $1,600 (reported on 19.2% of returns)
Here:
$1,600
State:
$2,259
(% of AGI for various income ranges: 4.0% for AGIs below $25k, 0.5% for AGIs $25k-50k)
Percentage of individuals using paid preparers for their 2012 taxes: 45.3%
Here:
45%
State:
51%
(% for various income ranges: 45.1% for AGIs below $25k, 43.4% for AGIs $25k-50k, 41.8% for AGIs $50k-75k, 45.8% for AGIs $75k-100k, 52.4% for AGIs $100k-200k, 87.5% for AGIs over 200k)
Averages for the 2004 tax year for zip code 84111, filed in 2005:
Average Adjusted Gross Income (AGI) in 2004: $38,556 (Individual Income Tax Returns)
Here:
$38,556
State:
$45,498
Salary/wage: $27,169 (reported on 87.6% of returns)
Here:
$27,169
State:
$38,975
(% of AGI for various income ranges: 108.4% for AGIs below $10k, 88.4% for AGIs $10k-25k, 90.1% for AGIs $25k-50k, 84.8% for AGIs $50k-75k, 80.0% for AGIs $75k-100k, 21.5% for AGIs over 100k)
Taxable interest for individuals: $2,300 (reported on 28.5% of returns)
This zip code:
$2,300
Utah:
$1,445
(% of AGI for various income ranges: 2.3% for AGIs below $10k, 1.2% for AGIs $10k-25k, 1.1% for AGIs $25k-50k, 1.1% for AGIs $50k-75k, 1.6% for AGIs $75k-100k, 2.4% for AGIs over 100k)
Taxable dividends: $25,087 (reported on 12.1% of returns)
Here:
$25,087
State:
$3,152
(% of AGI for various income ranges: 2.3% for AGIs below $10k, 0.5% for AGIs $10k-25k, 0.5% for AGIs $25k-50k, 0.9% for AGIs $50k-75k, 1.5% for AGIs $75k-100k, 18.6% for AGIs over 100k)
Net capital gain/loss: +$42,916 (reported on 10.7% of returns)
Here:
+$42,916
State:
+$14,059
(% of AGI for various income ranges: 0.9% for AGIs below $10k, 0.1% for AGIs $10k-25k, 0.2% for AGIs $25k-50k, 0.6% for AGIs $50k-75k, 3.0% for AGIs $75k-100k, 29.1% for AGIs over 100k)
Profit/loss from business: +$10,302 (reported on 11.6% of returns)
Here:
+$10,302
State:
+$6,903
(% of AGI for various income ranges: 6.0% for AGIs below $10k, 2.6% for AGIs $10k-25k, 1.5% for AGIs $25k-50k, 3.0% for AGIs $50k-75k, 0.8% for AGIs $75k-100k, 4.4% for AGIs over 100k)
IRA payment deduction: $1,951 (reported on 1.1% of returns)
84111:
$1,951
Utah:
$2,970
Self-employed pension: $17,062 (reported on 0.4% of returns)
Here:
$17,062
Utah:
$14,916
Total itemized deductions: $22,756 (22% of AGI, reported on 23.1% of returns)
Here:
$22,756
State:
$20,312
Here:
22.3% of AGI
State:
24.9% of AGI
(% of AGI for various income ranges: 10.7% for AGIs below $10k, 5.2% for AGIs $10k-25k, 12.0% for AGIs $25k-50k, 14.8% for AGIs $50k-75k, 15.1% for AGIs $75k-100k, 17.7% for AGIs over 100k)
Charity contributions deductions: $11,113 (10% of AGI, reported on 18.7% of returns)
Here:
$11,113
State:
$6,250
Here:
9.6% of AGI
State:
7.4% of AGI
(% of AGI for various income ranges: 0.4% for AGIs below $10k, 0.8% for AGIs $10k-25k, 1.9% for AGIs $25k-50k, 2.8% for AGIs $50k-75k, 3.3% for AGIs $75k-100k, 10.8% for AGIs over 100k)
Total tax: $6,693 (reported on 67.1% of returns)
84111:
$6,693
State:
$6,523
(% of AGI for various income ranges: 2.6% for AGIs below $10k, 4.1% for AGIs $10k-25k, 7.1% for AGIs $25k-50k, 10.6% for AGIs $50k-75k, 12.4% for AGIs $75k-100k, 18.2% for AGIs over 100k)
Earned income credit: $1,332 (reported on 17.8% of returns)
Here:
$1,332
State:
$1,703
Percentage of individuals using paid preparers for their 2004 taxes: 50.4%
Here:
50%
State:
53%
(% for various income ranges: 51.6% for AGIs below $10k, 50.1% for AGIs $10k-25k, 47.8% for AGIs $25k-50k, 42.3% for AGIs $50k-75k, 58.7% for AGIs $75k-100k, 74.6% for AGIs over 100k)
Likely homosexual households (counted as self-reported same-sex unmarried-partner households)
Lesbian couples: 0.0% of all households
Gay men: 0.4% of all households
Household received Food Stamps/SNAP in the past 12 months: 865 Household did not receive Food Stamps/SNAP in the past 12 months: 6,753
Women who had a birth in the past 12 months: 109 (89 now married, 18 unmarried) Women who did not have a birth in the past 12 months: 4,003 (1,116 now married, 2,915 unmarried)
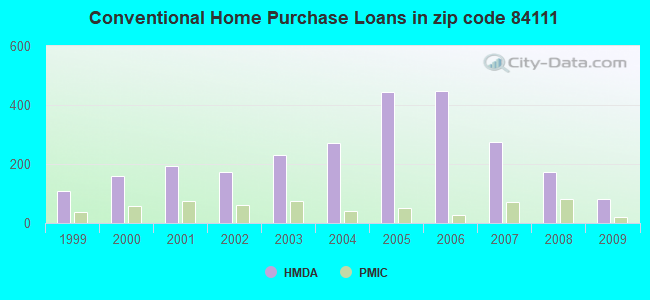
Housing units in zip code 84111 with a mortgage: 1,164 (65 second mortgage, 27 both second mortgage and home equity loan) Houses without a mortgage: 74
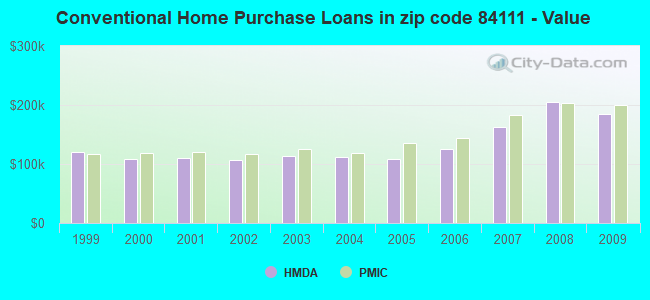
Median monthly owner costs for units with a mortgage: $1,720 Median monthly owner costs for units without a mortgage: $545
Residents with income below the poverty level in 2022:
This zip code:
20.7%
Whole state:
8.2%
Residents with income below 50% of the poverty level in 2022:
This zip code:
11.8%
Whole state:
4.3%
Median number of rooms in houses and condos:
Here:
4.9
State:
7.6
Median number of rooms in apartments:
Here:
2.9
State:
4.3
Notable locations in this zip code not listed on our city pages
Churches in zip code 84111 include: Faith Fellowship Foursquare Gospel Church (A), Saints Peter and Paul Orthodox Christian Church (B), Church of Scientology-Dianetics Mission (C), Corporation Episcopal Church in Utah (D), Korean Presbyterian Church of Utah (E), Cathedral of the Madeleine (F), Central Christian Church (G), Ebenezer Church of God in Christ (H), First United Methodist Church (I). Display/hide their locations on the map
Parks in zip code 84111 include: Pony Express Monument (1), Richmond Park (2), Dinwoody Park (3), Taufer Park (4), Van Ness Tot Lot Park (5), Artesian Well Park (6). Display/hide their locations on the map
Tourist attractions (not listed on the city page) : Heritage Associates (Cultural Attractions- Events- & Facilities; 8 East Broadway), Body by Banks (Arcades & Amusements; 111 East Broadway Ste 99), Phillips Gallery (Tours & Charters; 444 E. 2nd S).
936 married couples with children.
503 single-parent households (129 men, 374 women).
73.7% of residents of 84111 zip code speak English at home.
12.5% of residents speak Spanish at home (82% very well, 5% well, 2% not well, 10% not at all).
3.4% of residents speak other Indo-European language at home (89% very well, 11% well).
6.5% of residents speak Asian or Pacific Island language at home (50% very well, 41% well, 7% not well, 2% not at all).
3.9% of residents speak other language at home (44% very well, 40% well, 16% not well).
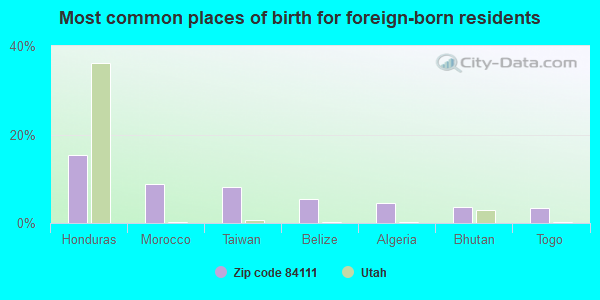
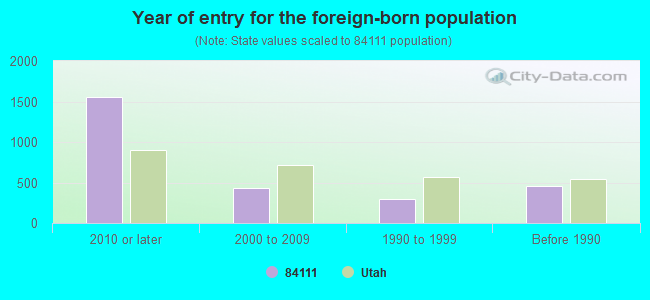
Foreign born population: 2,574 (19.4%) (35.8% of them are naturalized citizens)
Major facilities with environmental interests located in this zip code:
NATE WADE SUBARU PARTS (1240 MAJOR ST in SALT LAKE CITY, UT)
STATE MASTER (Utah compliance and permitting operations) - SQG DATABASE-7, CESQG Conditionally Exempt Small Quantity Generators, less than 100 kg/month of hazardous waste (Resource Conservation and Recovery Act (tracking hazardous waste)) - notification
FREED CHRYSLER PLYMOUTH INCORPORATED (47 S 200 E in SALT LAKE CITY, UT)
STATE MASTER (Utah compliance and permitting operations) - UST DATABASE-4, UNDERGROUND STORAGE TANK PROGRAM Small Quantity Generators, between 100 kg and 1000 kg of hazardous waste/month (Resource Conservation and Recovery Act (tracking hazardous waste)) - notification Organizations: CHRYSLER REALTY CORP (CONTACT/OWNER)
GARFF WARNER BODY SHOP (20 E 900 S in SALT LAKE CITY, UT)
STATE MASTER (Utah compliance and permitting operations) - SQG DATABASE-7, CESQG Conditionally Exempt Small Quantity Generators, less than 100 kg/month of hazardous waste (Resource Conservation and Recovery Act (tracking hazardous waste)) - notification
HENRIES CLEANERS (223 E 300 S in SALT LAKE CITY, UT)
STATE MASTER (Utah compliance and permitting operations) - SQG DATABASE-7, CESQG Small Quantity Generators, between 100 kg and 1000 kg of hazardous waste/month (Resource Conservation and Recovery Act (tracking hazardous waste)) - notification Organizations: BOYD HENRIE (CONTACT/OWNER)
LINCOLN ELEM SCH (1090 S ROBERTA ST in SALT LAKE CITY, UT)
(National Center for Education Statistics) - STATE ID-36 196 Organizations: SALT LAKE CITY SCHOOL DISTRICT (SCHOOL DISTRICT)
GOLDEN GARDENS (1144 ST 300 E in SALT LAKE CITY, UT)
(Integrated Compliance Information System) - ICIS-08-1992-0344, FORMAL ENFORCEMENT ACTION
LUDLOW, RONALD (160 E 300 S in SALT LAKE CITY, UT)
(Integrated Compliance Information System) - ICIS-08-1991-0074, FORMAL ENFORCEMENT ACTION
BAKERY (250 SOUTH 300 EAST in SALT LAKE CITY, UT)
AIR MINOR (AIRS/AFS) ENFORCEMENT/COMPLIANCE ACTIVITY (Integrated Compliance Information System) Business SIC classification: BREAD AND OTHER BAKERY PRODUCTS, EXCEPT COOKIES AND CRACKERS
KEN GARFF OLDSMOBILE PAINT SHOP (566 SOUTH 200 EAST in SALT LAKE CITY, UT)
(Resource Conservation and Recovery Act (tracking hazardous waste)) Organizations: KEN GARFF CO (CONTACT/OWNER)
FUJI TRUCOLOR (1146 SOUTH STATE STREET in SALT LAKE CITY, UT)
EMBASSY ARMS APARTMENTS (120 SOUTH 300 EAST in SALT LAKE CITY, UT)
ENFORCEMENT/COMPLIANCE ACTIVITY (Integrated Compliance Information System) COMPLIANCE ACTIVITY (Tracking inspections of insecticide, fungicide, and rodenticide, and toxic substances) Business SIC classification: OPERATORS OF APARTMENT BUILDINGS Alternative names: EMBASSY APARTMENTS
MOUNTAIN BELL REAL ESTATE (205 E. 200 S. in SALT LAKE CITY, UT)
AIR MINOR (AIRS/AFS) STATE MASTER (Utah compliance and permitting operations) Business SIC classification: NONCLASSIFIABLE ESTABLISHMENTS
HOUSE HAS A BLUE BARREL OF (OIL in SALT LAKE CITY, UT)
National Pollutant Discharge Elimination System NON-MAJOR (Tracking pollutant discharge elimination systems) - permit Business SIC classification: NONCLASSIFIABLE ESTABLISHMENTS Alternative names: HOUSE HAS A BLUE BARREL OF OIL
Housing units lacking complete plumbing facilities: 1.3% Housing units lacking complete kitchen facilities: 1.3%
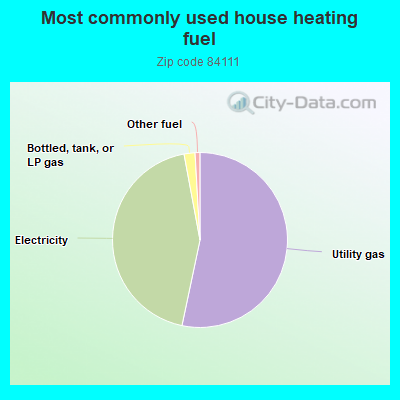
53.1%Utility gas
43.6%Electricity
2.0%Bottled, tank, or LP gas
0.9%Other fuel
Population in 1990: 8,978. Population change in the 1990s: +1,689 (+18.8%).
Place of birth for U.S.-born residents:
This state: 4,892
Northeast: 946
Midwest: 969
South: 1,220
West: 2,737
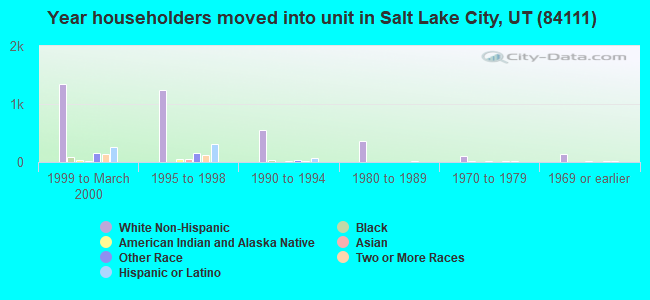
32% of the 84111 zip code residents lived in the same house 5 years ago. Out of people who lived in different houses, 57% lived in this county. Out of people who lived in different counties, 50% lived in Utah.
79% of the 84111 zip code residents lived in the same house 1 year ago. Out of people who lived in different houses, 52% moved from this county. Out of people who lived in different houses, 13% moved from different county within same state. Out of people who lived in different houses, 29% moved from different state. Out of people who lived in different houses, 3% moved from abroad.
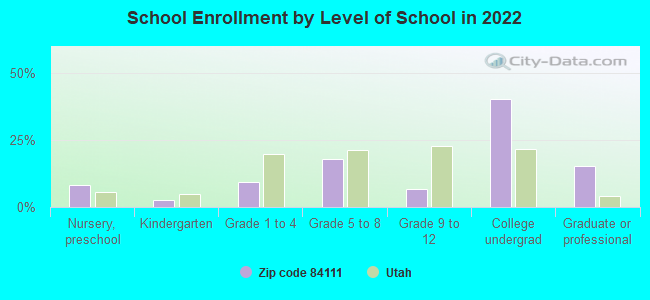
Private vs. public school enrollment:
Students in private schools in grades 1 to 8 (elementary and middle school): 15
Here:
2.2%
Utah:
7.2%
Students in private schools in grades 9 to 12 (high school): 12
Here:
7.5%
Utah:
5.3%
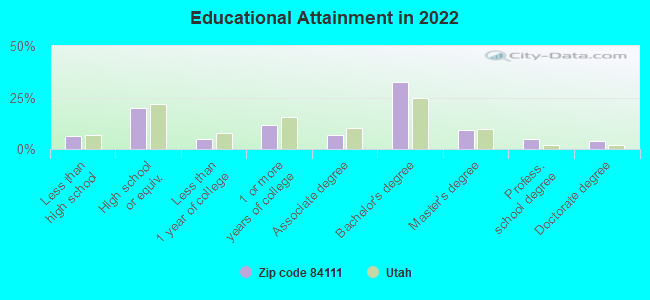
Students in private undergraduate colleges: 186
Here:
18.5%
Utah:
26.7%
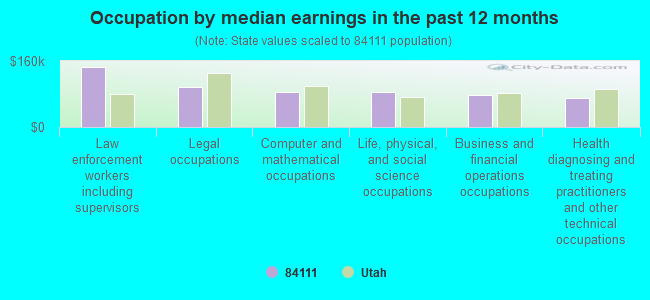
Occupation by median earnings in the past 12 months ($)
144,964Law enforcement workers including supervisors
96,080Legal occupations
85,632Computer and mathematical occupations
83,797Life, physical, and social science occupations
78,665Business and financial operations occupations
70,659Health diagnosing and treating practitioners and other technical occupations
Companies with biggest federal contracts located in this zip code (SALT LAKE CITY, UT):
SINCLAIR OIL CORPORATION (550 E SOUTH TEMPLE) : $21,829,933 in 13 contractsfrom 2002 to 2005
Contracts for Liquid Propellants and Fuels, Petroleum Base, Lease or Rental of Facilities -- Conference Space and Facilities, Lodging - Hotel/Motel, Purchase of Structures and Facilities -- Conference Space and Facilities, and moreby Defense Logistics Agency, Army, Patent and Trademark Office/Under Secretary for Intellectual Property, Forest Service, and others Signed by year:2000: $0; 2001: $0; 2002: $4,271; 2003: $139,454; 2004: $21,671,208; 2005: $15,000; 2006: $0.
Biggest contracts:
$21,486,955 with Defense Logistics Agency for Liquid Propellants and Fuels, Petroleum Base. Taking place in WY. Signed on 2004-08-24. Completion date: 2005-10-30.
$173,460, same as above.Signed on 2004-03-09. Completion date: 2004-03-14.
$119,454 with Army for Lease or Rental of Facilities -- Conference Space and Facilities. Signed on 2003-03-24. Completion date: 2003-04-11.
$20,000 with Army for Lodging - Hotel/Motel. Signed on 2003-10-22. Completion date: 2003-10-26.
UTAH STATE OFFICE OF EDUCATION (250 E 500 S) : $8,396,275 in 23 contractsfrom 1999 to 2006
Contracts for Food Services, Maintenance, Repair and Rebuilding of Equipment -- Miscellaneous, Education Services, Data Analyses (other than scientific), and moreby Air Force, EDUCATION, Department of Signed by year:2000: $0; 2001: $404,274; 2002: $1,962,451; 2003: $4,500,845; 2004: $272,468; 2005: $1,126,989; 2006: $116,248.
Biggest contracts:
$2,225,265 with Air Force for Food Services. Signed on 2003-10-01. Completion date: 2004-09-30.
$2,071,060, same as above.Signed on 2003-01-07. Completion date: 2003-09-30.
$1,126,989, same as above.Signed on 2005-04-01. Completion date: 2005-04-01.
$985,000 with Air Force for Maintenance, Repair and Rebuilding of Equipment -- Miscellaneous. Signed on 2002-02-01. Completion date: 2002-07-31.
CH2M HILL, INC (215 SOUTH STATE STREET) : $6,011,515 in 27 contractsfrom 2001 to 2006
Contracts for Other Architect and Engineering Services by Air Force Signed by year:2000: $0; 2001: $188,664; 2002: $161,000; 2003: $1,021,987; 2004: $962,081; 2005: $1,986,397; 2006: $1,691,386.
Biggest contracts:
$760,900 with Air Force for Other Architect and Engineering Services. Signed on 2005-08-18. Completion date: 2006-12-29.
$709,000, same as above.Signed on 2006-05-12. Completion date: 2007-12-31.
$696,000, same as above.Signed on 2003-02-25. Completion date: 2003-04-30.
$681,000, same as above.Signed on 2006-03-21. Completion date: 2007-05-31.
WHITE DOT SOLUTIONS, INC (299 S MAIN ST, STE 1700; small business) : $3,071,222 in 36 contractsfrom 2004 to 2006
Contracts for Installation of Equipment -- Maintenance and Repair Shop Equipment, Engineering and Technical Services, Installation of Equipment -- Refrigeration, Air Conditioning, and Air Circulating Equipment by Air Force Signed by year:2000: $0; 2001: $0; 2002: $0; 2003: $0; 2004: $471,017; 2005: $1,981,994; 2006: $618,211.
Biggest contracts:
$466,345 with Air Force for Installation of Equipment -- Maintenance and Repair Shop Equipment. Signed on 2005-03-28. Completion date: 2005-04-02.
$429,122, same as above.Signed on 2005-07-18. Completion date: 2005-09-30.
$288,745 with Air Force for Engineering and Technical Services. Signed on 2005-03-04. Completion date: 2006-02-28.
$234,200 with Air Force for Installation of Equipment -- Maintenance and Repair Shop Equipment. Signed on 2005-06-03. Completion date: 2005-05-12.
ENVIRONMENTAL AND SAFETY ENGIN (250 EAST 300 SOUTH SUITE 2; small business) : $1,975,251 in 85 contractsfrom 2001 to 2006
Contracts for Architect - Engineer Services (including landscaping, interior layout, and designing), Other Architect and Engineering Services, Industrial Buildings, Other Buildings, and moreby Army, Air Force Signed by year:2000: $0; 2001: $313,020; 2002: $261,289; 2003: $257,219; 2004: $558,843; 2005: $473,268; 2006: $111,612.
Biggest contracts:
$373,101 with Army for Architect - Engineer Services (including landscaping, interior layout, and designing). Signed on 2005-12-20. Completion date: 2006-11-17.
$79,375, same as above.Signed on 2004-11-04. Completion date: 2005-05-16.
$70,313 with Air Force for Architect - Engineer Services (including landscaping, interior layout, and designing). Signed on 2004-09-22. Completion date: 2004-12-09.
$69,965, same as above.Signed on 2004-06-23. Completion date: 2004-11-30.
ENERGY, UNITED STATES DEPT OF (257 E 200 S STE 475) : $601,921 in 5 contractsfrom 1999 to 2000
Contracts for Gas Services by Air Force Signed by year:2000: $557,806; 2001: $0; 2002: $0; 2003: $0; 2004: $0; 2005: $0; 2006: $0.
Biggest contracts:
$167,355 with Air Force for Gas Services. Signed on 2000-08-08. Completion date: 2000-08-08.
$165,055, same as above.Signed on 2000-02-16. Completion date: 2000-02-16.
$160,868, same as above.Signed on 2000-05-11. Completion date: 2000-05-11.
$64,528, same as above.Signed on 2000-09-30. Completion date: 2000-09-30.
FORSGREN ASSOCIATES INC (370 EAST 500 SOUTH SUITE 2) : $556,477 in 17 contractsfrom 2001 to 2006
Contracts for Architect - Engineer Services (including landscaping, interior layout, and designing), Other Architect and Engineering Services by Air Force, U.S. Army Corps of Engineers - civil program financing only, Army Signed by year:2000: $0; 2001: $75,765; 2002: $95,542; 2003: $271,555; 2004: $95,054; 2005: $0; 2006: $18,561.
Biggest contracts:
$115,216 with Air Force for Architect - Engineer Services (including landscaping, interior layout, and designing). Signed on 2003-03-07. Completion date: 2003-06-05.
$75,765, same as above.Signed on 2001-09-26. Completion date: 2001-12-17.
$66,259, same as above.Signed on 2003-03-06. Completion date: 2003-06-04.
$65,519, same as above.Signed on 2003-03-07. Completion date: 2003-05-14.
DESIGN WEST ARCHITECTS, INC (230 EAST SOUTH TEMPLE; small business) : $367,922 in 12 contractsfrom 2003 to 2005
Contracts for Electric Power Generation (EPG), Architect - Engineer Services (including landscaping, interior layout, and designing) by Air Force Signed by year:2000: $0; 2001: $0; 2002: $0; 2003: $109,184; 2004: $138,679; 2005: $120,059; 2006: $0.
Biggest contracts:
$96,590 with Air Force for Electric Power Generation (EPG). Signed on 2003-09-12. Completion date: 2003-12-01.
$79,344 with Air Force for Architect - Engineer Services (including landscaping, interior layout, and designing). Signed on 2004-05-17. Completion date: 2004-09-11.
$74,512, same as above.Signed on 2005-01-06. Completion date: 2005-03-28.
$33,651, same as above.Signed on 2004-09-23. Completion date: 2005-01-15.
DELCAM USA (275 E SOUTH TEMPLE # 305; small business) : $319,317 in 31 contractsfrom 2002 to 2006
Contracts for ADP Software, Miscellaneous Items, ADP Systems Analysis Services, Other Photographic, Mapping, Printing, and Publication Services, and moreby Air Force, Army, Department of Veterans Affairs Signed by year:2000: $0; 2001: $0; 2002: $14,965; 2003: $25,465; 2004: $92,134; 2005: $121,133; 2006: $65,620.
Biggest contracts:
$23,540 with Air Force for ADP Software. Taking place in HI. Signed on 2006-06-28. Completion date: 2006-07-28.
$20,955 with Army for ADP Software. Taking place in TN. Signed on 2005-08-25. Completion date: 2005-09-24.
$19,240 with Air Force for ADP Software. Signed on 2005-08-30. Completion date: 2005-09-30.
$19,230 with Air Force for Miscellaneous Items. Signed on 2004-09-27. Completion date: 2004-10-20.
WBK CONTROLS, INCORPORATED (10 E 800 S; small business) : $195,032 in 7 contractsfrom 2001 to 2006
Contracts for Flight Instruments, Switches, Miscellaneous Electric Power and Distribution Equipment by Defense Logistics Agency, Air Force Signed by year:2000: $0; 2001: $30,686; 2002: $30,686; 2003: $0; 2004: $68,908; 2005: $61,372; 2006: $3,380.
Biggest contracts:
$61,372 with Defense Logistics Agency for Flight Instruments. Signed on 2005-03-28. Completion date: 2005-08-03.
$33,413 with Defense Logistics Agency for Switches. Signed on 2004-10-22. Completion date: 2004-11-21.
$30,686 with Defense Logistics Agency for Flight Instruments. Signed on 2002-06-05. Completion date: 2002-10-11.
$30,686, same as above.Signed on 2001-06-04. Completion date: 2001-10-10.
Top industries in this zip code by the number of employees in 2005:
2002 - 2018 National Fire Incident Reporting System (NFIRS) incidents
According to the data from the years 2002 - 2018 the average number of fire incidents per year is 74. The highest number of fires - 135 took place in 2018, and the least - 37 in 2009. The data has a rising trend.
When looking into fire subcategories, the most incidents belonged to: Structure Fires (47.7%), and Outside Fires (34.0%).
Fire incident types reported to NFIRS in Zip Code 84111


 Nearest zip codes: 84144, 84101, 84102, 84180, 84105, 84115.


 According to the data from the years 2002 - 2018 the average number of fire incidents per year is 74. The highest number of fires - 135 took place in 2018, and the least - 37 in 2009. The data has a rising trend.
 When looking into fire subcategories, the most incidents belonged to: Structure Fires (47.7%), and Outside Fires (34.0%).